Cities with the Highest Percentage of Households with Income Below $10,000 in the United States
RELATED REPORTS & OPTIONS
Household Income | $0-10k
United States
Compare Cities
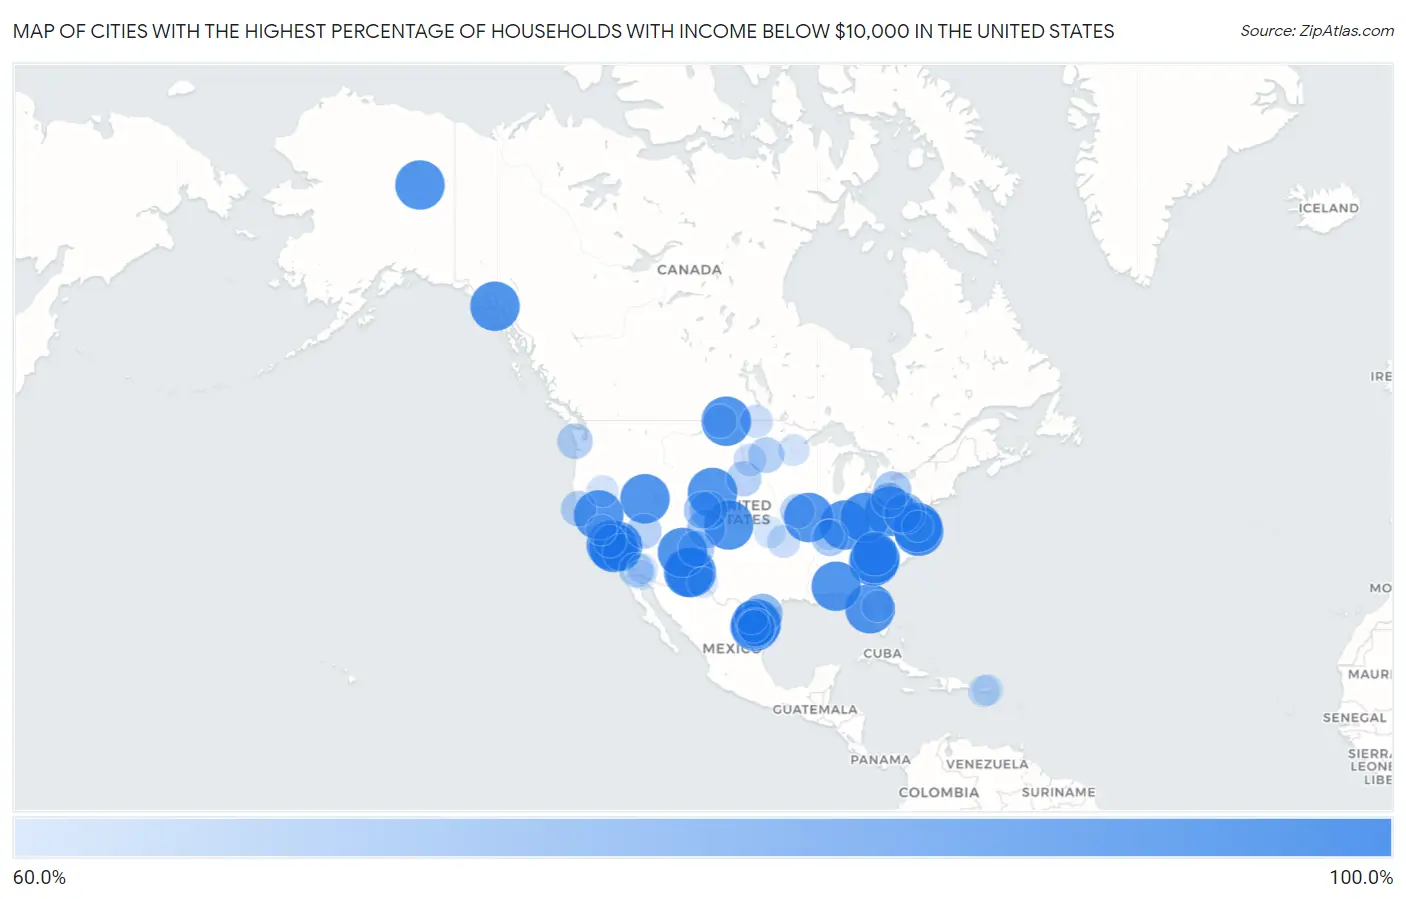
Map of Cities with the Highest Percentage of Households with Income Below $10,000 in the United States
0.0%
100.0%
Cities with the Highest Percentage of Households with Income Below $10,000 in the United States
| City | Households with Income < $10k | vs State | vs National | |
| 1. | Fairfield University | 100.0% | 4.3%(+95.7)#1 | 4.9%(+95.1)#1 |
| 2. | St. Mary | 100.0% | 4.6%(+95.4)#1 | 4.9%(+95.1)#2 |
| 3. | Millville | 100.0% | 5.0%(+95.0)#1 | 4.9%(+95.1)#3 |
| 4. | Pence | 100.0% | 5.0%(+95.0)#2 | 4.9%(+95.1)#4 |
| 5. | Buffington | 100.0% | 4.8%(+95.2)#1 | 4.9%(+95.1)#5 |
| 6. | Bayport | 100.0% | 5.2%(+94.8)#1 | 4.9%(+95.1)#6 |
| 7. | Kennedy Meadows | 100.0% | 4.4%(+95.6)#1 | 4.9%(+95.1)#8 |
| 8. | Kingston | 100.0% | 6.8%(+93.2)#1 | 4.9%(+95.1)#9 |
| 9. | Excursion Inlet | 100.0% | 3.9%(+96.1)#1 | 4.9%(+95.1)#10 |
| 10. | El Rancho | 100.0% | 4.4%(+95.6)#2 | 4.9%(+95.1)#11 |
| 11. | Slater | 100.0% | 4.6%(+95.4)#1 | 4.9%(+95.1)#12 |
| 12. | Mayfield Colony | 100.0% | 4.2%(+95.8)#1 | 4.9%(+95.1)#13 |
| 13. | Shamrock Colony | 100.0% | 4.2%(+95.8)#2 | 4.9%(+95.1)#14 |
| 14. | Osage | 100.0% | 6.5%(+93.5)#1 | 4.9%(+95.1)#15 |
| 15. | Deep Creek | 100.0% | 4.2%(+95.8)#1 | 4.9%(+95.1)#16 |
| 16. | Fredericksburg | 100.0% | 5.0%(+95.0)#3 | 4.9%(+95.1)#17 |
| 17. | Ashley | 100.0% | 5.0%(+95.0)#1 | 4.9%(+95.1)#18 |
| 18. | Villa Sin Miedo | 100.0% | 22.7%(+77.3)#1 | 4.9%(+95.1)#19 |
| 19. | Coronaca | 100.0% | 6.1%(+93.9)#1 | 4.9%(+95.1)#20 |
| 20. | Burney | 100.0% | 5.0%(+95.0)#4 | 4.9%(+95.1)#21 |
| 21. | Brandon | 100.0% | 3.9%(+96.1)#1 | 4.9%(+95.1)#22 |
| 22. | Symonds | 100.0% | 7.4%(+92.6)#1 | 4.9%(+95.1)#23 |
| 23. | Cross Anchor | 100.0% | 6.1%(+93.9)#2 | 4.9%(+95.1)#24 |
| 24. | Lake Roberts Heights | 100.0% | 6.8%(+93.2)#2 | 4.9%(+95.1)#25 |
| 25. | Cynthiana | 100.0% | 5.2%(+94.8)#1 | 4.9%(+95.1)#26 |
| 26. | Montello | 100.0% | 5.4%(+94.6)#1 | 4.9%(+95.1)#27 |
| 27. | Mcclenney Tract | 100.0% | 4.4%(+95.6)#3 | 4.9%(+95.1)#28 |
| 28. | Beaver | 100.0% | 4.5%(+95.5)#1 | 4.9%(+95.1)#29 |
| 29. | Warm Spring Creek | 100.0% | 4.6%(+95.4)#2 | 4.9%(+95.1)#30 |
| 30. | Graniteville | 100.0% | 4.4%(+95.6)#4 | 4.9%(+95.1)#31 |
| 31. | Martinez | 100.0% | 5.1%(+94.9)#1 | 4.9%(+95.1)#32 |
| 32. | Surprise Creek Colony | 100.0% | 4.6%(+95.4)#3 | 4.9%(+95.1)#33 |
| 33. | Frenchtown Rumbly | 100.0% | 4.2%(+95.8)#1 | 4.9%(+95.1)#34 |
| 34. | Vail | 100.0% | 4.8%(+95.2)#2 | 4.9%(+95.1)#35 |
| 35. | Megargel | 100.0% | 6.5%(+93.5)#1 | 4.9%(+95.1)#36 |
| 36. | Lupton | 100.0% | 4.9%(+95.1)#1 | 4.9%(+95.1)#37 |
| 37. | Larson | 100.0% | 4.6%(+95.4)#1 | 4.9%(+95.1)#38 |
| 38. | Birch Creek | 100.0% | 3.9%(+96.1)#2 | 4.9%(+95.1)#39 |
| 39. | Santa Anna | 100.0% | 5.1%(+94.9)#2 | 4.9%(+95.1)#40 |
| 40. | Homer C Jones | 94.4% | 6.8%(+87.6)#3 | 4.9%(+89.5)#41 |
| 41. | Los Alvarez | 91.8% | 5.1%(+86.7)#3 | 4.9%(+86.9)#42 |
| 42. | Coker Creek | 90.0% | 5.3%(+84.7)#1 | 4.9%(+85.1)#43 |
| 43. | Fingerville | 88.8% | 6.1%(+82.7)#3 | 4.9%(+83.9)#44 |
| 44. | Riverview Colony | 83.8% | 4.6%(+79.2)#4 | 4.9%(+78.9)#45 |
| 45. | Janesville | 83.3% | 5.3%(+78.0)#1 | 4.9%(+78.4)#46 |
| 46. | Cearfoss | 83.2% | 4.2%(+79.0)#2 | 4.9%(+78.3)#47 |
| 47. | Sandy Hollow Escondidas | 81.1% | 5.1%(+76.0)#4 | 4.9%(+76.2)#48 |
| 48. | Manuel Garcia | 80.0% | 5.1%(+74.9)#5 | 4.9%(+75.1)#49 |
| 49. | Eagle Creek Colony | 78.9% | 4.6%(+74.3)#5 | 4.9%(+74.0)#50 |
| 50. | Serena | 78.3% | 5.3%(+73.0)#2 | 4.9%(+73.4)#51 |
| 51. | Crestone | 78.1% | 3.9%(+74.2)#2 | 4.9%(+73.2)#52 |
| 52. | Pecktonville | 76.7% | 4.2%(+72.5)#3 | 4.9%(+71.8)#53 |
| 53. | Glendale | 76.4% | 3.9%(+72.5)#3 | 4.9%(+71.5)#54 |
| 54. | El Socio | 76.2% | 5.1%(+71.1)#6 | 4.9%(+71.3)#55 |
| 55. | Johannesburg | 76.0% | 4.4%(+71.6)#5 | 4.9%(+71.1)#56 |
| 56. | Pelkie | 76.0% | 5.0%(+71.0)#1 | 4.9%(+71.1)#57 |
| 57. | Chautauqua | 75.8% | 5.6%(+70.2)#1 | 4.9%(+70.9)#58 |
| 58. | Baxter | 75.6% | 6.5%(+69.1)#2 | 4.9%(+70.7)#59 |
| 59. | Parshall | 75.5% | 3.9%(+71.6)#4 | 4.9%(+70.6)#60 |
| 60. | Gilbertsville | 74.7% | 6.1%(+68.6)#1 | 4.9%(+69.8)#61 |
| 61. | Rectortown | 73.5% | 4.2%(+69.3)#2 | 4.9%(+68.6)#62 |
| 62. | San Luis | 73.3% | 6.8%(+66.5)#4 | 4.9%(+68.4)#63 |
| 63. | Long Hollow | 72.4% | 4.2%(+68.2)#3 | 4.9%(+67.5)#64 |
| 64. | Alderpoint | 72.3% | 4.4%(+67.9)#6 | 4.9%(+67.4)#65 |
| 65. | Moccasin | 72.2% | 4.6%(+67.6)#6 | 4.9%(+67.3)#66 |
| 66. | Oyehut | 72.0% | 3.7%(+68.3)#1 | 4.9%(+67.1)#67 |
| 67. | Edgemont | 72.0% | 6.0%(+66.0)#1 | 4.9%(+67.1)#68 |
| 68. | Slippery Rock University | 71.4% | 4.8%(+66.6)#3 | 4.9%(+66.5)#69 |
| 69. | Okreek | 71.4% | 4.2%(+67.2)#4 | 4.9%(+66.5)#70 |
| 70. | White Oak | 71.4% | 5.0%(+66.4)#2 | 4.9%(+66.5)#71 |
| 71. | Beaverdam | 71.4% | 5.4%(+66.0)#2 | 4.9%(+66.5)#72 |
| 72. | Ethel | 70.5% | 5.0%(+65.5)#3 | 4.9%(+65.6)#73 |
| 73. | Niland | 70.4% | 4.4%(+66.0)#7 | 4.9%(+65.5)#74 |
| 74. | San Carlos Ii | 68.6% | 5.1%(+63.5)#7 | 4.9%(+63.7)#75 |
| 75. | Fortuna | 68.4% | 4.6%(+63.8)#2 | 4.9%(+63.5)#76 |
| 76. | East Orosi | 66.7% | 4.4%(+62.3)#8 | 4.9%(+61.8)#77 |
| 77. | Barrera | 66.7% | 5.1%(+61.6)#8 | 4.9%(+61.8)#78 |
| 78. | Butler | 66.7% | 5.6%(+61.1)#1 | 4.9%(+61.8)#79 |
| 79. | Lake View | 66.7% | 5.0%(+61.7)#5 | 4.9%(+61.8)#80 |
| 80. | Onaka | 66.7% | 4.2%(+62.5)#5 | 4.9%(+61.8)#81 |
| 81. | Hannah | 66.7% | 4.6%(+62.1)#3 | 4.9%(+61.8)#82 |
| 82. | Centerville | 66.7% | 4.6%(+62.1)#7 | 4.9%(+61.8)#83 |
| 83. | Groverton | 65.5% | 5.0%(+60.5)#6 | 4.9%(+60.6)#84 |
| 84. | Altoona | 65.4% | 5.2%(+60.2)#2 | 4.9%(+60.5)#85 |
| 85. | Vayas | 64.8% | 22.7%(+42.1)#2 | 4.9%(+59.9)#86 |
| 86. | New Pine Creek | 64.7% | 4.4%(+60.3)#9 | 4.9%(+59.8)#87 |
| 87. | Locust Mount | 64.6% | 4.2%(+60.4)#3 | 4.9%(+59.7)#88 |
| 88. | Mcgrath | 64.3% | 3.6%(+60.7)#1 | 4.9%(+59.4)#89 |
| 89. | Latham | 64.0% | 4.5%(+59.5)#2 | 4.9%(+59.1)#90 |
| 90. | Pencil Bluff | 64.0% | 6.0%(+58.0)#2 | 4.9%(+59.1)#91 |
| 91. | Santa Clara | 63.9% | 22.7%(+41.2)#3 | 4.9%(+59.0)#92 |
| 92. | Bivalve | 63.5% | 4.2%(+59.3)#4 | 4.9%(+58.6)#93 |
| 93. | Chinese Camp | 63.2% | 4.4%(+58.8)#10 | 4.9%(+58.3)#94 |
| 94. | Butterfield | 63.0% | 5.1%(+57.9)#9 | 4.9%(+58.1)#95 |
| 95. | Cibola | 62.5% | 4.9%(+57.6)#2 | 4.9%(+57.6)#96 |
| 96. | Burna | 62.5% | 6.1%(+56.4)#2 | 4.9%(+57.6)#97 |
| 97. | Panther Burn | 61.9% | 7.4%(+54.5)#2 | 4.9%(+57.0)#98 |
| 98. | Drysdale | 61.7% | 4.9%(+56.8)#3 | 4.9%(+56.8)#99 |
| 99. | Big Stone Colony | 61.5% | 4.6%(+56.9)#8 | 4.9%(+56.6)#100 |
| 100. | Deerfield Street | 61.4% | 4.1%(+57.3)#1 | 4.9%(+56.5)#101 |
Common Questions
What are the Top 10 Cities with the Highest Percentage of Households with Income Below $10,000 in the United States?
Top 10 Cities with the Highest Percentage of Households with Income Below $10,000 in the United States are:
#1
100.0%
#2
100.0%
#3
100.0%
#4
100.0%
#5
100.0%
#6
100.0%
#7
100.0%
#8
100.0%
#9
100.0%
#10
100.0%
What city has the Highest Percentage of Households with Income Below $10,000 in the United States?
Buffington has the Highest Percentage of Households with Income Below $10,000 in the United States with 100.0%.
What is the Percentage of Households with Income Below $10,000 in the United States?
Percentage of Households with Income Below $10,000 in the United States is 4.9%.