Cities with the Highest Percentage of Immigrants from El Salvador in the United States
RELATED REPORTS & OPTIONS
El Salvador
United States
Compare Cities
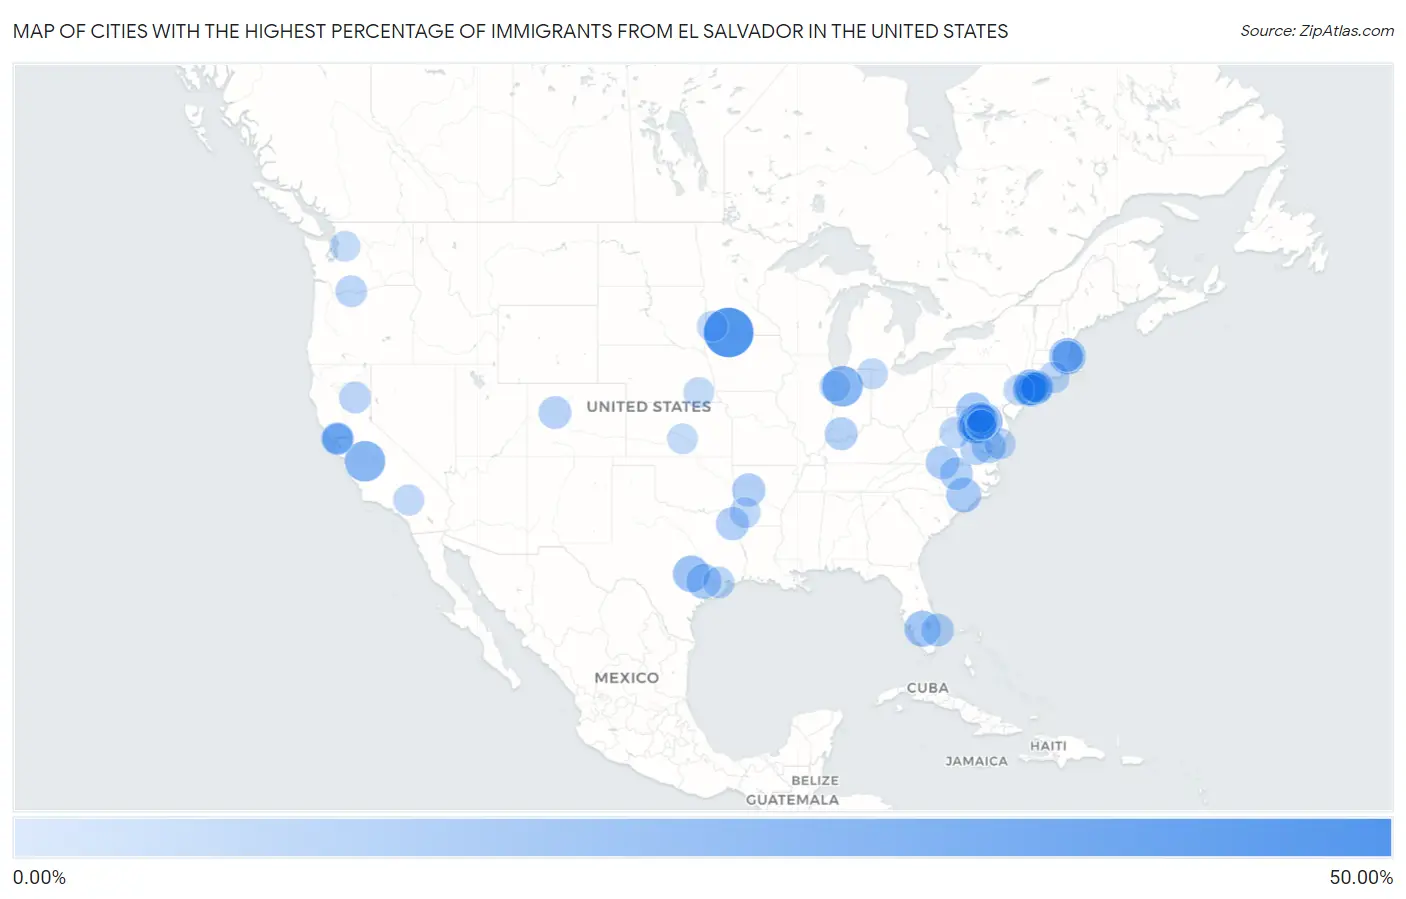
Map of Cities with the Highest Percentage of Immigrants from El Salvador in the United States
0.00%
50.00%
Cities with the Highest Percentage of Immigrants from El Salvador in the United States
| City | El Salvador | vs State | vs National | |
| 1. | Alpha | 42.98% | 0.12%(+42.9)#-1 | 0.43%(+42.6)#0 |
| 2. | Mendota | 25.99% | 1.12%(+24.9)#-1 | 0.43%(+25.6)#1 |
| 3. | Monon | 25.91% | 0.12%(+25.8)#-1 | 0.43%(+25.5)#2 |
| 4. | Chillum | 20.87% | 1.87%(+19.0)#31 | 0.43%(+20.4)#678 |
| 5. | East Riverdale | 20.12% | 1.87%(+18.2)#76 | 0.43%(+19.7)#1,463 |
| 6. | Yorkshire | 19.89% | 1.25%(+18.6)#-1 | 0.43%(+19.5)#1,464 |
| 7. | Edmonston | 19.59% | 1.87%(+17.7)#77 | 0.43%(+19.2)#1,465 |
| 8. | Brentwood | 19.25% | 1.87%(+17.4)#78 | 0.43%(+18.8)#1,466 |
| 9. | Berwyn Heights | 19.14% | 1.87%(+17.3)#79 | 0.43%(+18.7)#1,467 |
| 10. | Woodlawn Cdp Prince George S County | 19.11% | 1.87%(+17.2)#80 | 0.43%(+18.7)#1,468 |
| 11. | Colmar Manor | 19.06% | 1.87%(+17.2)#81 | 0.43%(+18.6)#1,469 |
| 12. | Wyldwood | 18.68% | 0.77%(+17.9)#-1 | 0.43%(+18.3)#1,470 |
| 13. | Chelsea | 18.58% | 0.65%(+17.9)#35 | 0.43%(+18.2)#1,471 |
| 14. | Pioneer | 17.90% | 0.23%(+17.7)#-1 | 0.43%(+17.5)#1,472 |
| 15. | Langley Park | 17.84% | 1.87%(+16.0)#82 | 0.43%(+17.4)#1,491 |
| 16. | Loch Lomond | 17.42% | 1.25%(+16.2)#0 | 0.43%(+17.0)#1,492 |
| 17. | Philadelphia | 16.72% | 0.12%(+16.6)#0 | 0.43%(+16.3)#1,493 |
| 18. | Hutchison | 16.63% | 1.25%(+15.4)#1 | 0.43%(+16.2)#1,494 |
| 19. | Adelphi | 16.40% | 1.87%(+14.5)#83 | 0.43%(+16.0)#1,495 |
| 20. | New Cassel | 16.32% | 0.54%(+15.8)#6 | 0.43%(+15.9)#1,496 |
| 21. | Ingold | 16.12% | 0.32%(+15.8)#-1 | 0.43%(+15.7)#1,497 |
| 22. | West Berlin | 15.97% | 0.53%(+15.4)#-1 | 0.43%(+15.5)#1,498 |
| 23. | Glidden | 15.91% | 0.77%(+15.1)#0 | 0.43%(+15.5)#1,499 |
| 24. | Bagtown | 15.74% | 1.87%(+13.9)#84 | 0.43%(+15.3)#1,500 |
| 25. | Pea Ridge | 15.74% | 0.060%(+15.7)#-1 | 0.43%(+15.3)#1,501 |
| 26. | North Brentwood | 15.14% | 1.87%(+13.3)#85 | 0.43%(+14.7)#1,502 |
| 27. | Brentwood | 14.98% | 0.54%(+14.4)#36 | 0.43%(+14.6)#1,503 |
| 28. | Cottage City | 14.71% | 1.87%(+12.8)#86 | 0.43%(+14.3)#1,504 |
| 29. | Landover Hills | 14.26% | 1.87%(+12.4)#87 | 0.43%(+13.8)#1,505 |
| 30. | Saluda | 13.85% | 1.25%(+12.6)#2 | 0.43%(+13.4)#1,506 |
| 31. | Sterling | 13.80% | 1.25%(+12.6)#3 | 0.43%(+13.4)#1,507 |
| 32. | Woodlawn Cdp Fairfax County | 13.69% | 1.25%(+12.4)#21 | 0.43%(+13.3)#1,508 |
| 33. | Hempstead | 13.44% | 0.54%(+12.9)#37 | 0.43%(+13.0)#1,509 |
| 34. | Bull Run | 13.33% | 1.25%(+12.1)#31 | 0.43%(+12.9)#1,510 |
| 35. | Roosevelt | 13.29% | 0.54%(+12.8)#38 | 0.43%(+12.9)#1,511 |
| 36. | Laurel Park | 13.29% | 1.25%(+12.0)#32 | 0.43%(+12.9)#1,512 |
| 37. | Herndon | 13.09% | 1.25%(+11.8)#33 | 0.43%(+12.7)#1,513 |
| 38. | Hyattsville | 12.88% | 1.87%(+11.0)#88 | 0.43%(+12.5)#1,514 |
| 39. | Corinth | 12.82% | 0.54%(+12.3)#-1 | 0.43%(+12.4)#1,515 |
| 40. | Wheaton | 12.82% | 1.87%(+10.9)#89 | 0.43%(+12.4)#1,629 |
| 41. | Marietta | 12.62% | 0.77%(+11.9)#1 | 0.43%(+12.2)#1,630 |
| 42. | Fair Oaks | 12.62% | 0.12%(+12.5)#1 | 0.43%(+12.2)#1,631 |
| 43. | Riverdale Park | 12.44% | 1.87%(+10.6)#90 | 0.43%(+12.0)#1,632 |
| 44. | Gorman | 12.29% | 0.32%(+12.0)#0 | 0.43%(+11.9)#1,633 |
| 45. | Central Islip | 12.28% | 0.54%(+11.7)#39 | 0.43%(+11.9)#1,634 |
| 46. | North Bay Shore | 12.21% | 0.54%(+11.7)#95 | 0.43%(+11.8)#1,635 |
| 47. | Plantation Mobile Home Park | 12.21% | 0.23%(+12.0)#0 | 0.43%(+11.8)#1,636 |
| 48. | Huntingburg | 12.19% | 0.12%(+12.1)#2 | 0.43%(+11.8)#1,637 |
| 49. | Uniondale | 12.11% | 0.54%(+11.6)#96 | 0.43%(+11.7)#1,638 |
| 50. | El Jebel | 11.76% | 0.21%(+11.6)#-1 | 0.43%(+11.3)#1,639 |
| 51. | Woodbridge | 11.49% | 1.25%(+10.2)#50 | 0.43%(+11.1)#1,640 |
| 52. | Montalvin Manor | 11.48% | 1.12%(+10.4)#0 | 0.43%(+11.1)#1,641 |
| 53. | Sudley | 11.27% | 1.25%(+10.0)#51 | 0.43%(+10.8)#1,642 |
| 54. | Glenmont | 11.20% | 1.87%(+9.33)#91 | 0.43%(+10.8)#1,643 |
| 55. | Dumfries | 10.85% | 1.25%(+9.60)#52 | 0.43%(+10.4)#1,644 |
| 56. | North Richmond | 10.85% | 1.12%(+9.73)#1 | 0.43%(+10.4)#1,645 |
| 57. | Bensley | 10.64% | 1.25%(+9.40)#53 | 0.43%(+10.2)#1,646 |
| 58. | Seven Corners | 10.62% | 1.25%(+9.38)#54 | 0.43%(+10.2)#1,647 |
| 59. | Mount Rainier | 10.41% | 1.87%(+8.54)#92 | 0.43%(+9.98)#1,648 |
| 60. | Beltsville | 10.27% | 1.87%(+8.39)#93 | 0.43%(+9.84)#1,649 |
| 61. | Sugarland Run | 10.23% | 1.25%(+8.98)#55 | 0.43%(+9.80)#1,650 |
| 62. | Mifflintown Borough | 10.16% | 0.059%(+10.1)#-1 | 0.43%(+9.73)#1,651 |
| 63. | Lake Almanor Country Club | 10.02% | 1.12%(+8.90)#2 | 0.43%(+9.59)#1,652 |
| 64. | Mosier | 9.84% | 0.099%(+9.74)#-1 | 0.43%(+9.42)#1,653 |
| 65. | Revere | 9.83% | 0.65%(+9.17)#36 | 0.43%(+9.40)#1,654 |
| 66. | Fifth Street | 9.72% | 0.77%(+8.95)#2 | 0.43%(+9.29)#1,655 |
| 67. | Mount Crawford | 9.63% | 1.25%(+8.38)#56 | 0.43%(+9.20)#1,656 |
| 68. | Glen Cove | 9.58% | 0.54%(+9.04)#227 | 0.43%(+9.15)#1,746 |
| 69. | Inwood | 9.56% | 0.54%(+9.01)#228 | 0.43%(+9.13)#1,747 |
| 70. | Poquonock Bridge | 9.50% | 0.17%(+9.33)#-1 | 0.43%(+9.07)#1,748 |
| 71. | Capitol Heights | 9.30% | 1.87%(+7.43)#94 | 0.43%(+8.87)#1,749 |
| 72. | Forest Heights | 9.28% | 1.87%(+7.40)#95 | 0.43%(+8.85)#1,750 |
| 73. | Dale City | 9.17% | 1.25%(+7.92)#57 | 0.43%(+8.74)#1,751 |
| 74. | Washington | 9.00% | 0.54%(+8.46)#0 | 0.43%(+8.57)#1,752 |
| 75. | Onley | 8.99% | 1.25%(+7.75)#58 | 0.43%(+8.57)#1,753 |
| 76. | Westbury | 8.89% | 0.54%(+8.35)#229 | 0.43%(+8.46)#1,754 |
| 77. | Forest Glen | 8.86% | 1.87%(+6.99)#96 | 0.43%(+8.44)#1,755 |
| 78. | Mountain View Acres | 8.82% | 1.12%(+7.70)#3 | 0.43%(+8.40)#1,756 |
| 79. | Brook | 8.75% | 0.12%(+8.63)#3 | 0.43%(+8.32)#1,757 |
| 80. | New Carrollton | 8.68% | 1.87%(+6.81)#97 | 0.43%(+8.26)#1,758 |
| 81. | Manassas | 8.64% | 1.25%(+7.39)#59 | 0.43%(+8.21)#1,759 |
| 82. | Chandler | 8.64% | 0.12%(+8.51)#0 | 0.43%(+8.21)#1,760 |
| 83. | Everett | 8.58% | 0.65%(+7.93)#37 | 0.43%(+8.16)#1,761 |
| 84. | Spencerville | 8.54% | 1.87%(+6.66)#98 | 0.43%(+8.11)#1,762 |
| 85. | Calverton | 8.50% | 1.87%(+6.62)#99 | 0.43%(+8.07)#1,763 |
| 86. | Huntington Station | 8.47% | 0.54%(+7.93)#230 | 0.43%(+8.05)#1,764 |
| 87. | Freeport | 8.45% | 0.54%(+7.91)#231 | 0.43%(+8.03)#1,765 |
| 88. | Groveton | 8.38% | 1.25%(+7.13)#60 | 0.43%(+7.95)#1,766 |
| 89. | Blakeslee | 8.33% | 0.067%(+8.27)#-1 | 0.43%(+7.91)#1,767 |
| 90. | Glassmanor | 8.33% | 1.87%(+6.45)#100 | 0.43%(+7.90)#1,768 |
| 91. | Wyandanch | 8.29% | 0.54%(+7.75)#232 | 0.43%(+7.86)#1,769 |
| 92. | Plainfield | 8.22% | 0.53%(+7.69)#52 | 0.43%(+7.79)#1,770 |
| 93. | Fairview Borough | 8.10% | 0.53%(+7.57)#53 | 0.43%(+7.67)#1,771 |
| 94. | Redland | 8.01% | 1.87%(+6.13)#101 | 0.43%(+7.58)#1,772 |
| 95. | Sultan | 8.00% | 0.18%(+7.82)#-1 | 0.43%(+7.58)#1,773 |
| 96. | Partridge | 7.95% | 0.15%(+7.80)#-1 | 0.43%(+7.53)#1,774 |
| 97. | Wilber | 7.93% | 0.28%(+7.65)#-1 | 0.43%(+7.51)#1,775 |
| 98. | Hybla Valley | 7.85% | 1.25%(+6.60)#61 | 0.43%(+7.42)#1,776 |
| 99. | Islandia | 7.82% | 0.54%(+7.28)#233 | 0.43%(+7.39)#1,777 |
| 100. | Rollingwood | 7.75% | 1.12%(+6.63)#4 | 0.43%(+7.33)#1,778 |
Common Questions
What are the Top 10 Cities with the Highest Percentage of Immigrants from El Salvador in the United States?
Top 10 Cities with the Highest Percentage of Immigrants from El Salvador in the United States are:
What city has the Highest Percentage of Immigrants from El Salvador in the United States?
Alpha has the Highest Percentage of Immigrants from El Salvador in the United States with 42.98%.
What is the Percentage of Immigrants from El Salvador in the United States?
Percentage of Immigrants from El Salvador in the United States is 0.43%.