Chester County, SC Map & Demographics
Chester County Map
Chester County Overview
$26,349
PER CAPITA INCOME
$59,906
AVG FAMILY INCOME
$50,022
AVG HOUSEHOLD INCOME
27.6%
WAGE / INCOME GAP [ % ]
72.4¢/ $1
WAGE / INCOME GAP [ $ ]
$9,135
FAMILY INCOME DEFICIT
0.45
INEQUALITY / GINI INDEX
32,171
TOTAL POPULATION
15,747
MALE POPULATION
16,424
FEMALE POPULATION
95.88
MALES / 100 FEMALES
104.30
FEMALES / 100 MALES
41.8
MEDIAN AGE
3.1
AVG FAMILY SIZE
2.5
AVG HOUSEHOLD SIZE
14,682
LABOR FORCE [ PEOPLE ]
56.3%
PERCENT IN LABOR FORCE
6.2%
UNEMPLOYMENT RATE
Chester County Area Codes
Income in Chester County
Income Overview in Chester County
Per Capita Income in Chester County is $26,349, while median incomes of families and households are $59,906 and $50,022 respectively.
| Characteristic | Number | Measure |
| Per Capita Income | 32,171 | $26,349 |
| Median Family Income | 8,507 | $59,906 |
| Mean Family Income | 8,507 | $73,578 |
| Median Household Income | 12,890 | $50,022 |
| Mean Household Income | 12,890 | $64,095 |
| Income Deficit | 8,507 | $9,135 |
| Wage / Income Gap (%) | 32,171 | 27.59% |
| Wage / Income Gap ($) | 32,171 | 72.41¢ per $1 |
| Gini / Inequality Index | 32,171 | 0.45 |
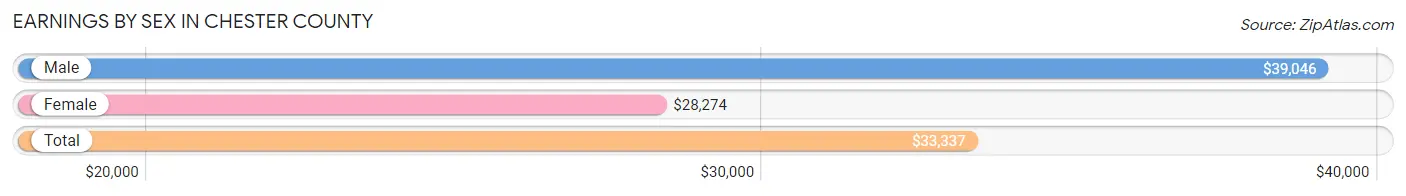
Earnings by Sex in Chester County
Average Earnings in Chester County are $33,337, $39,046 for men and $28,274 for women, a difference of 27.6%.
| Sex | Number | Average Earnings |
| Male | 7,209 (48.4%) | $39,046 |
| Female | 7,697 (51.6%) | $28,274 |
| Total | 14,906 (100.0%) | $33,337 |
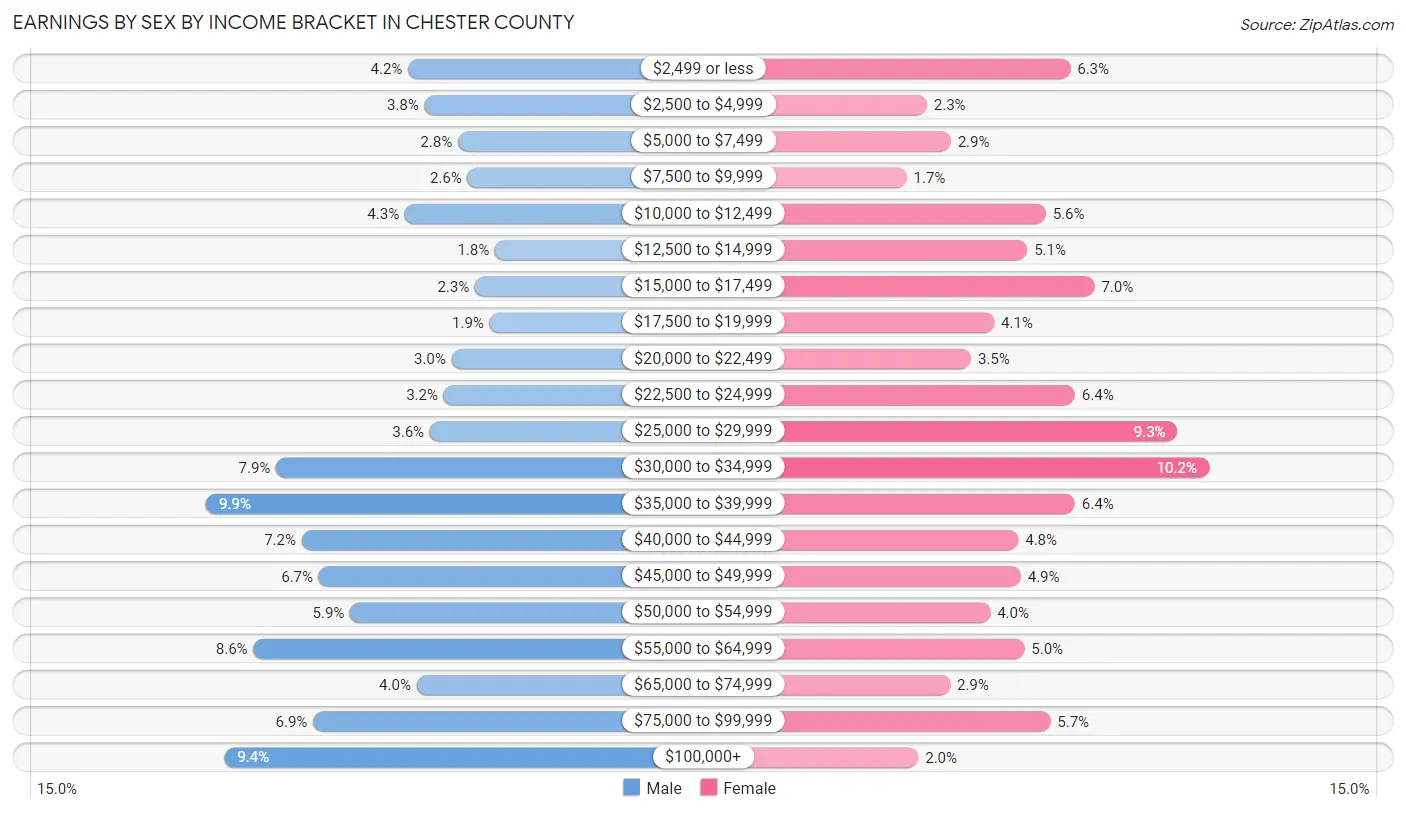
Earnings by Sex by Income Bracket in Chester County
The most common earnings brackets in Chester County are $35,000 to $39,999 for men (714 | 9.9%) and $30,000 to $34,999 for women (783 | 10.2%).
| Income | Male | Female |
| $2,499 or less | 304 (4.2%) | 483 (6.3%) |
| $2,500 to $4,999 | 271 (3.8%) | 173 (2.2%) |
| $5,000 to $7,499 | 203 (2.8%) | 225 (2.9%) |
| $7,500 to $9,999 | 184 (2.5%) | 129 (1.7%) |
| $10,000 to $12,499 | 311 (4.3%) | 430 (5.6%) |
| $12,500 to $14,999 | 128 (1.8%) | 390 (5.1%) |
| $15,000 to $17,499 | 169 (2.3%) | 536 (7.0%) |
| $17,500 to $19,999 | 139 (1.9%) | 319 (4.1%) |
| $20,000 to $22,499 | 216 (3.0%) | 269 (3.5%) |
| $22,500 to $24,999 | 232 (3.2%) | 493 (6.4%) |
| $25,000 to $29,999 | 260 (3.6%) | 715 (9.3%) |
| $30,000 to $34,999 | 572 (7.9%) | 783 (10.2%) |
| $35,000 to $39,999 | 714 (9.9%) | 493 (6.4%) |
| $40,000 to $44,999 | 520 (7.2%) | 371 (4.8%) |
| $45,000 to $49,999 | 485 (6.7%) | 376 (4.9%) |
| $50,000 to $54,999 | 422 (5.9%) | 310 (4.0%) |
| $55,000 to $64,999 | 618 (8.6%) | 384 (5.0%) |
| $65,000 to $74,999 | 287 (4.0%) | 223 (2.9%) |
| $75,000 to $99,999 | 497 (6.9%) | 440 (5.7%) |
| $100,000+ | 677 (9.4%) | 155 (2.0%) |
| Total | 7,209 (100.0%) | 7,697 (100.0%) |
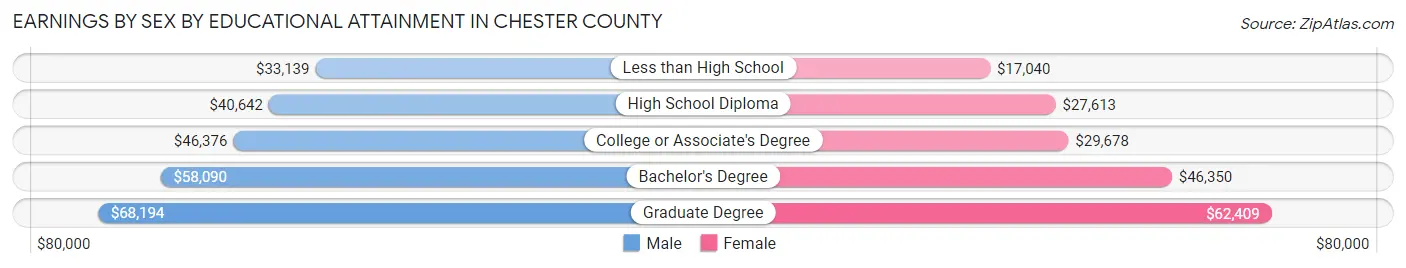
Earnings by Sex by Educational Attainment in Chester County
Average earnings in Chester County are $43,424 for men and $29,623 for women, a difference of 31.8%. Men with an educational attainment of graduate degree enjoy the highest average annual earnings of $68,194, while those with less than high school education earn the least with $33,139. Women with an educational attainment of graduate degree earn the most with the average annual earnings of $62,409, while those with less than high school education have the smallest earnings of $17,040.
| Educational Attainment | Male Income | Female Income |
| Less than High School | $33,139 | $17,040 |
| High School Diploma | $40,642 | $27,613 |
| College or Associate's Degree | $46,376 | $29,678 |
| Bachelor's Degree | $58,090 | $46,350 |
| Graduate Degree | $68,194 | $62,409 |
| Total | $43,424 | $29,623 |
Family Income in Chester County
Family Income Brackets in Chester County
According to the Chester County family income data, there are 2,016 families falling into the $50,000 to $74,999 income range, which is the most common income bracket and makes up 23.7% of all families. Conversely, the $10,000 to $14,999 income bracket is the least frequent group with only 196 families (2.3%) belonging to this category.
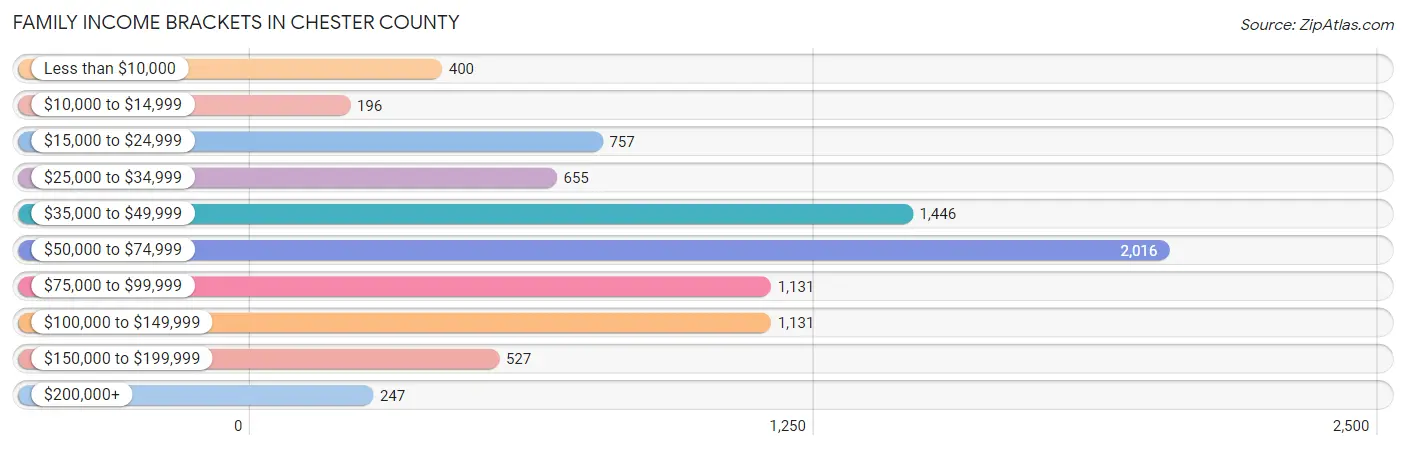
| Income Bracket | # Families | % Families |
| Less than $10,000 | 400 | 4.7% |
| $10,000 to $14,999 | 196 | 2.3% |
| $15,000 to $24,999 | 757 | 8.9% |
| $25,000 to $34,999 | 655 | 7.7% |
| $35,000 to $49,999 | 1,446 | 17.0% |
| $50,000 to $74,999 | 2,016 | 23.7% |
| $75,000 to $99,999 | 1,131 | 13.3% |
| $100,000 to $149,999 | 1,131 | 13.3% |
| $150,000 to $199,999 | 527 | 6.2% |
| $200,000+ | 247 | 2.9% |
Family Income by Famaliy Size in Chester County
5-person families (512 | 6.0%) account for the highest median family income in Chester County with $74,205 per family, while 2-person families (4,588 | 53.9%) have the highest median income of $28,074 per family member.
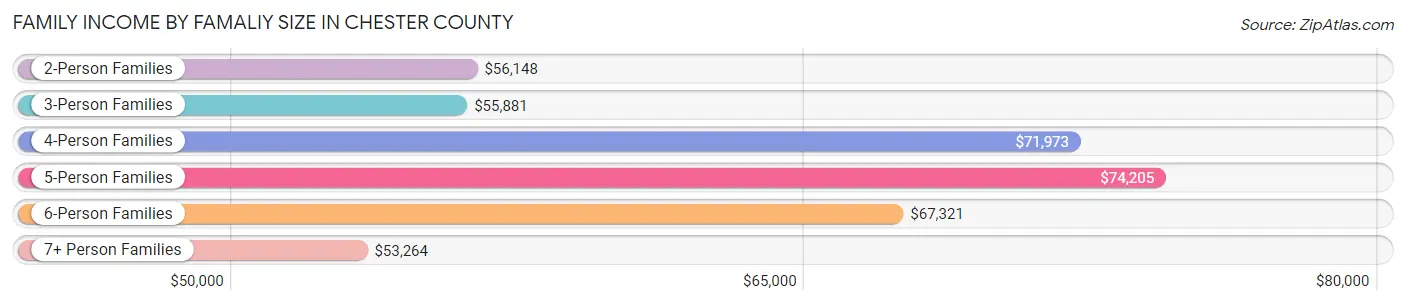
| Income Bracket | # Families | Median Income |
| 2-Person Families | 4,588 (53.9%) | $56,148 |
| 3-Person Families | 1,783 (21.0%) | $55,881 |
| 4-Person Families | 1,353 (15.9%) | $71,973 |
| 5-Person Families | 512 (6.0%) | $74,205 |
| 6-Person Families | 180 (2.1%) | $67,321 |
| 7+ Person Families | 91 (1.1%) | $53,264 |
| Total | 8,507 (100.0%) | $59,906 |
Family Income by Number of Earners in Chester County
The median family income in Chester County is $59,906, with families comprising 3+ earners (752) having the highest median family income of $129,615, while families with no earners (1,603) have the lowest median family income of $38,995, accounting for 8.8% and 18.8% of families, respectively.
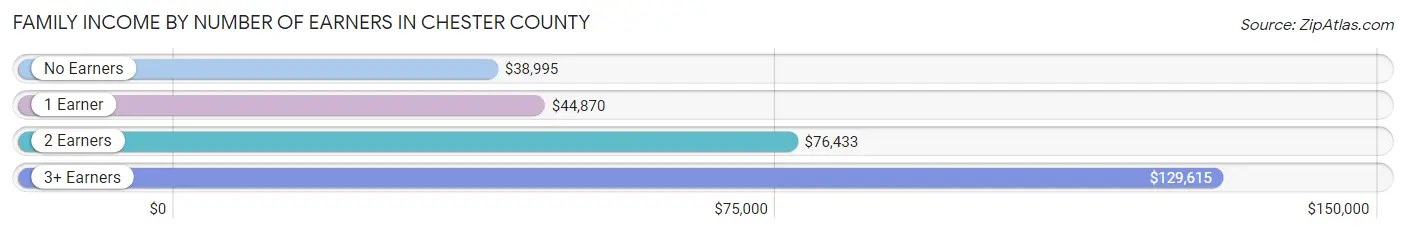
| Number of Earners | # Families | Median Income |
| No Earners | 1,603 (18.8%) | $38,995 |
| 1 Earner | 3,248 (38.2%) | $44,870 |
| 2 Earners | 2,904 (34.1%) | $76,433 |
| 3+ Earners | 752 (8.8%) | $129,615 |
| Total | 8,507 (100.0%) | $59,906 |
Household Income in Chester County
Household Income Brackets in Chester County
With 2,642 households falling in the category, the $50,000 to $74,999 income range is the most frequent in Chester County, accounting for 20.5% of all households. In contrast, only 284 households (2.2%) fall into the $200,000+ income bracket, making it the least populous group.
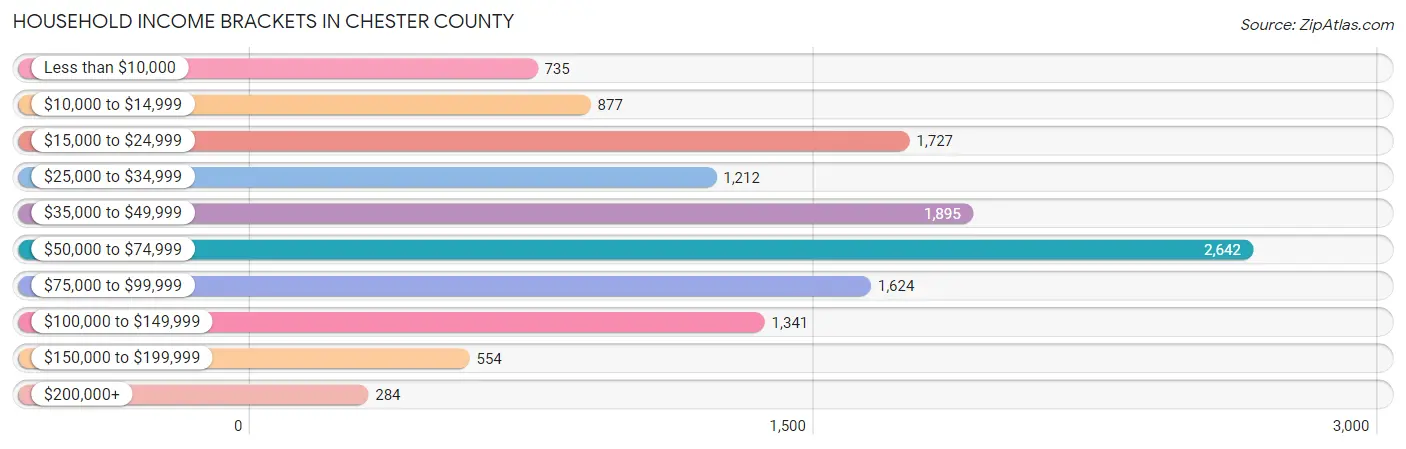
| Income Bracket | # Households | % Households |
| Less than $10,000 | 735 | 5.7% |
| $10,000 to $14,999 | 877 | 6.8% |
| $15,000 to $24,999 | 1,727 | 13.4% |
| $25,000 to $34,999 | 1,212 | 9.4% |
| $35,000 to $49,999 | 1,895 | 14.7% |
| $50,000 to $74,999 | 2,642 | 20.5% |
| $75,000 to $99,999 | 1,624 | 12.6% |
| $100,000 to $149,999 | 1,341 | 10.4% |
| $150,000 to $199,999 | 554 | 4.3% |
| $200,000+ | 284 | 2.2% |
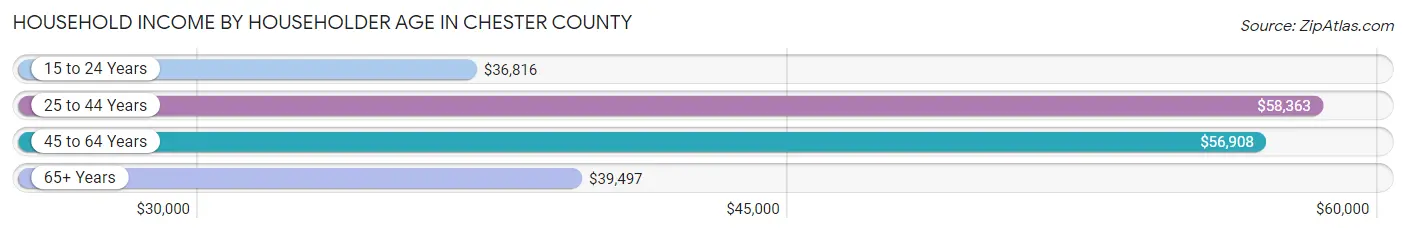
Household Income by Householder Age in Chester County
The median household income in Chester County is $50,022, with the highest median household income of $58,363 found in the 25 to 44 years age bracket for the primary householder. A total of 3,568 households (27.7%) fall into this category. Meanwhile, the 15 to 24 years age bracket for the primary householder has the lowest median household income of $36,816, with 269 households (2.1%) in this group.
| Income Bracket | # Households | Median Income |
| 15 to 24 Years | 269 (2.1%) | $36,816 |
| 25 to 44 Years | 3,568 (27.7%) | $58,363 |
| 45 to 64 Years | 4,848 (37.6%) | $56,908 |
| 65+ Years | 4,205 (32.6%) | $39,497 |
| Total | 12,890 (100.0%) | $50,022 |
Poverty in Chester County
Income Below Poverty by Sex and Age in Chester County
With 16.0% poverty level for males and 21.8% for females among the residents of Chester County, 12 to 14 year old males and 15 year old females are the most vulnerable to poverty, with 268 males (42.9%) and 76 females (54.3%) in their respective age groups living below the poverty level.
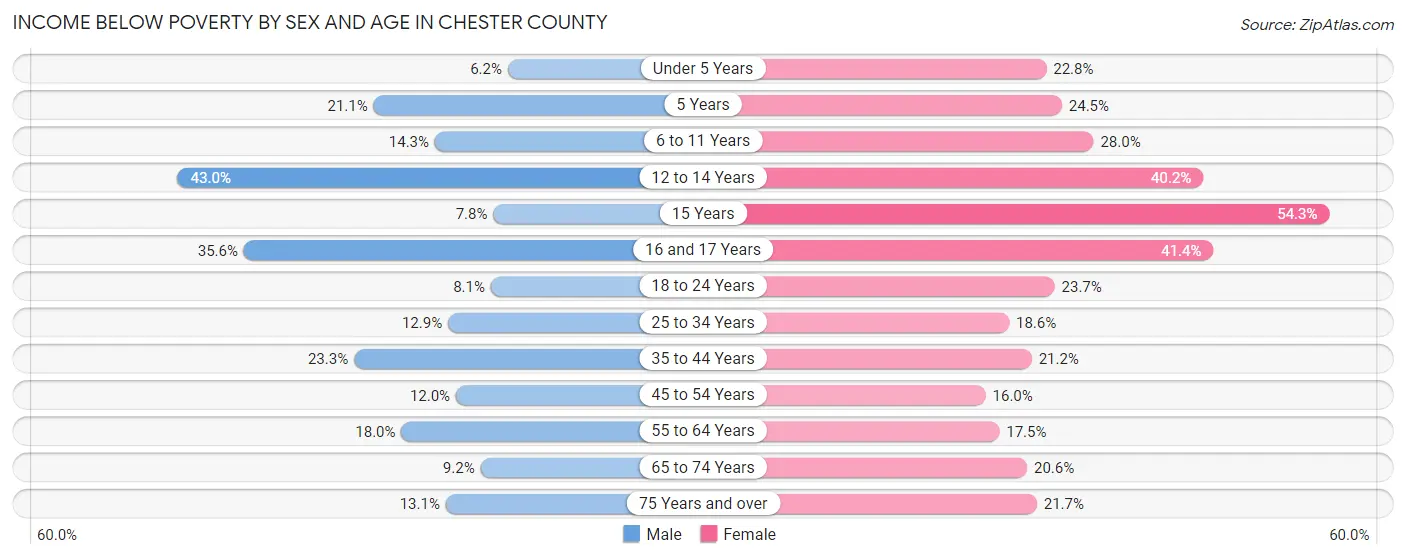
| Age Bracket | Male | Female |
| Under 5 Years | 54 (6.2%) | 194 (22.8%) |
| 5 Years | 67 (21.1%) | 50 (24.5%) |
| 6 to 11 Years | 173 (14.3%) | 317 (28.0%) |
| 12 to 14 Years | 268 (42.9%) | 204 (40.2%) |
| 15 Years | 11 (7.8%) | 76 (54.3%) |
| 16 and 17 Years | 252 (35.6%) | 163 (41.4%) |
| 18 to 24 Years | 99 (8.1%) | 305 (23.7%) |
| 25 to 34 Years | 231 (12.9%) | 374 (18.6%) |
| 35 to 44 Years | 407 (23.3%) | 417 (21.1%) |
| 45 to 54 Years | 250 (12.0%) | 345 (16.0%) |
| 55 to 64 Years | 411 (18.0%) | 414 (17.5%) |
| 65 to 74 Years | 157 (9.2%) | 395 (20.6%) |
| 75 Years and over | 126 (13.1%) | 293 (21.7%) |
| Total | 2,506 (16.0%) | 3,547 (21.8%) |
Income Above Poverty by Sex and Age in Chester County
According to the poverty statistics in Chester County, males aged under 5 years and females aged 45 to 54 years are the age groups that are most secure financially, with 93.8% of males and 84.0% of females in these age groups living above the poverty line.
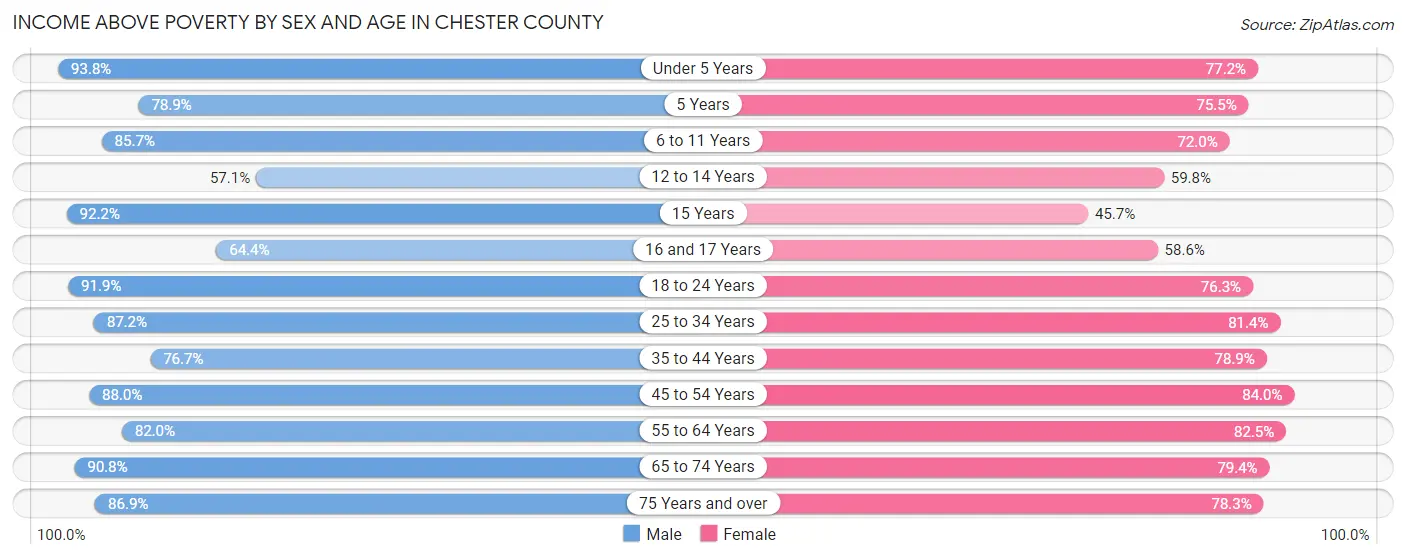
| Age Bracket | Male | Female |
| Under 5 Years | 818 (93.8%) | 658 (77.2%) |
| 5 Years | 250 (78.9%) | 154 (75.5%) |
| 6 to 11 Years | 1,036 (85.7%) | 814 (72.0%) |
| 12 to 14 Years | 356 (57.1%) | 303 (59.8%) |
| 15 Years | 130 (92.2%) | 64 (45.7%) |
| 16 and 17 Years | 456 (64.4%) | 231 (58.6%) |
| 18 to 24 Years | 1,127 (91.9%) | 982 (76.3%) |
| 25 to 34 Years | 1,566 (87.2%) | 1,634 (81.4%) |
| 35 to 44 Years | 1,338 (76.7%) | 1,555 (78.8%) |
| 45 to 54 Years | 1,840 (88.0%) | 1,808 (84.0%) |
| 55 to 64 Years | 1,867 (82.0%) | 1,946 (82.5%) |
| 65 to 74 Years | 1,544 (90.8%) | 1,520 (79.4%) |
| 75 Years and over | 836 (86.9%) | 1,056 (78.3%) |
| Total | 13,164 (84.0%) | 12,725 (78.2%) |
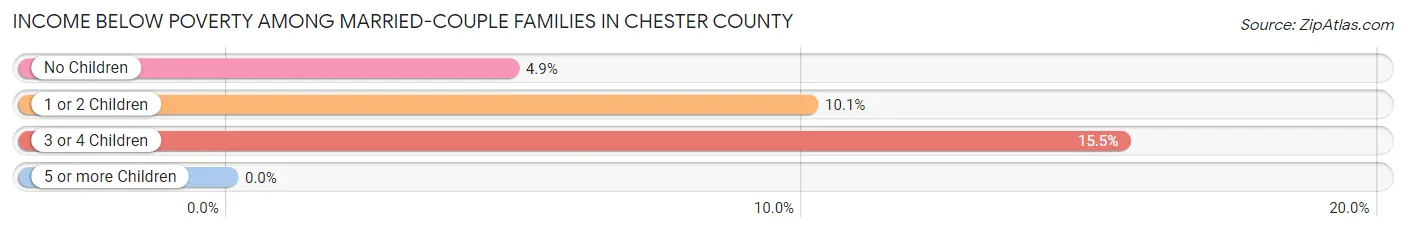
Income Below Poverty Among Married-Couple Families in Chester County
The poverty statistics for married-couple families in Chester County show that 6.5% or 372 of the total 5,710 families live below the poverty line. Families with 3 or 4 children have the highest poverty rate of 15.5%, comprising of 34 families. On the other hand, families with no children have the lowest poverty rate of 4.9%, which includes 203 families.
| Children | Above Poverty | Below Poverty |
| No Children | 3,951 (95.1%) | 203 (4.9%) |
| 1 or 2 Children | 1,202 (89.9%) | 135 (10.1%) |
| 3 or 4 Children | 185 (84.5%) | 34 (15.5%) |
| 5 or more Children | 0 (0.0%) | 0 (0.0%) |
| Total | 5,338 (93.5%) | 372 (6.5%) |
Income Below Poverty Among Single-Parent Households in Chester County
According to the poverty data in Chester County, 17.2% or 104 single-father households and 36.7% or 805 single-mother households are living below the poverty line. Among single-father households, those with 1 or 2 children have the highest poverty rate, with 85 households (33.3%) experiencing poverty. Likewise, among single-mother households, those with 3 or 4 children have the highest poverty rate, with 128 households (84.2%) falling below the poverty line.
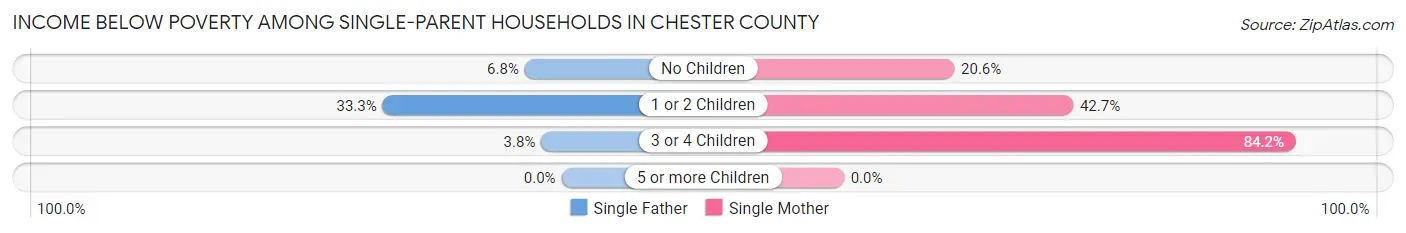
| Children | Single Father | Single Mother |
| No Children | 13 (6.8%) | 179 (20.6%) |
| 1 or 2 Children | 85 (33.3%) | 498 (42.7%) |
| 3 or 4 Children | 6 (3.8%) | 128 (84.2%) |
| 5 or more Children | 0 (0.0%) | 0 (0.0%) |
| Total | 104 (17.2%) | 805 (36.7%) |
Income Below Poverty Among Married-Couple vs Single-Parent Households in Chester County
The poverty data for Chester County shows that 372 of the married-couple family households (6.5%) and 909 of the single-parent households (32.5%) are living below the poverty level. Within the married-couple family households, those with 3 or 4 children have the highest poverty rate, with 34 households (15.5%) falling below the poverty line. Among the single-parent households, those with 3 or 4 children have the highest poverty rate, with 134 household (43.1%) living below poverty.
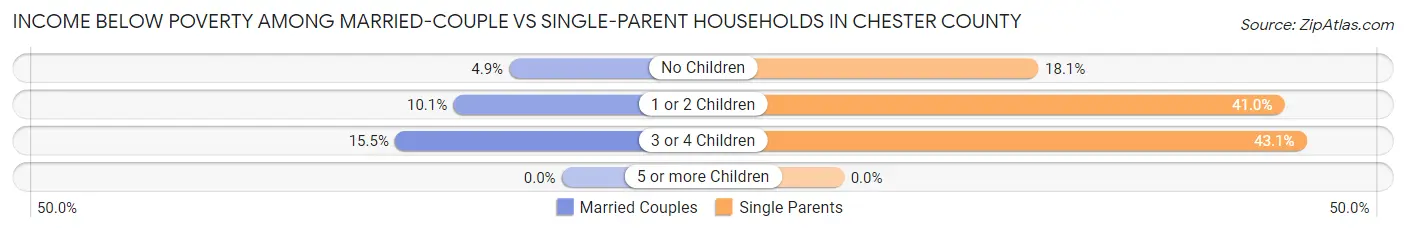
| Children | Married-Couple Families | Single-Parent Households |
| No Children | 203 (4.9%) | 192 (18.1%) |
| 1 or 2 Children | 135 (10.1%) | 583 (41.0%) |
| 3 or 4 Children | 34 (15.5%) | 134 (43.1%) |
| 5 or more Children | 0 (0.0%) | 0 (0.0%) |
| Total | 372 (6.5%) | 909 (32.5%) |
Race in Chester County
The most populous races in Chester County are White / Caucasian (19,146 | 59.5%), Black / African American (11,604 | 36.1%), and Two or more Races (1,043 | 3.2%).
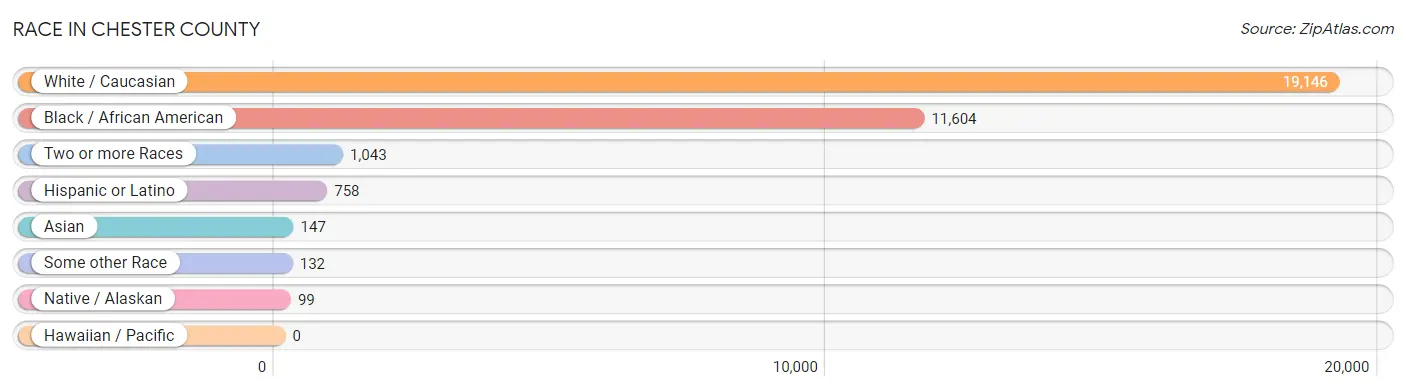
| Race | # Population | % Population |
| Asian | 147 | 0.5% |
| Black / African American | 11,604 | 36.1% |
| Hawaiian / Pacific | 0 | 0.0% |
| Hispanic or Latino | 758 | 2.4% |
| Native / Alaskan | 99 | 0.3% |
| White / Caucasian | 19,146 | 59.5% |
| Two or more Races | 1,043 | 3.2% |
| Some other Race | 132 | 0.4% |
| Total | 32,171 | 100.0% |
Ancestry in Chester County
The most populous ancestries reported in Chester County are American (5,634 | 17.5%), English (2,489 | 7.7%), Irish (1,844 | 5.7%), German (1,668 | 5.2%), and Subsaharan African (1,194 | 3.7%), together accounting for 39.9% of all Chester County residents.
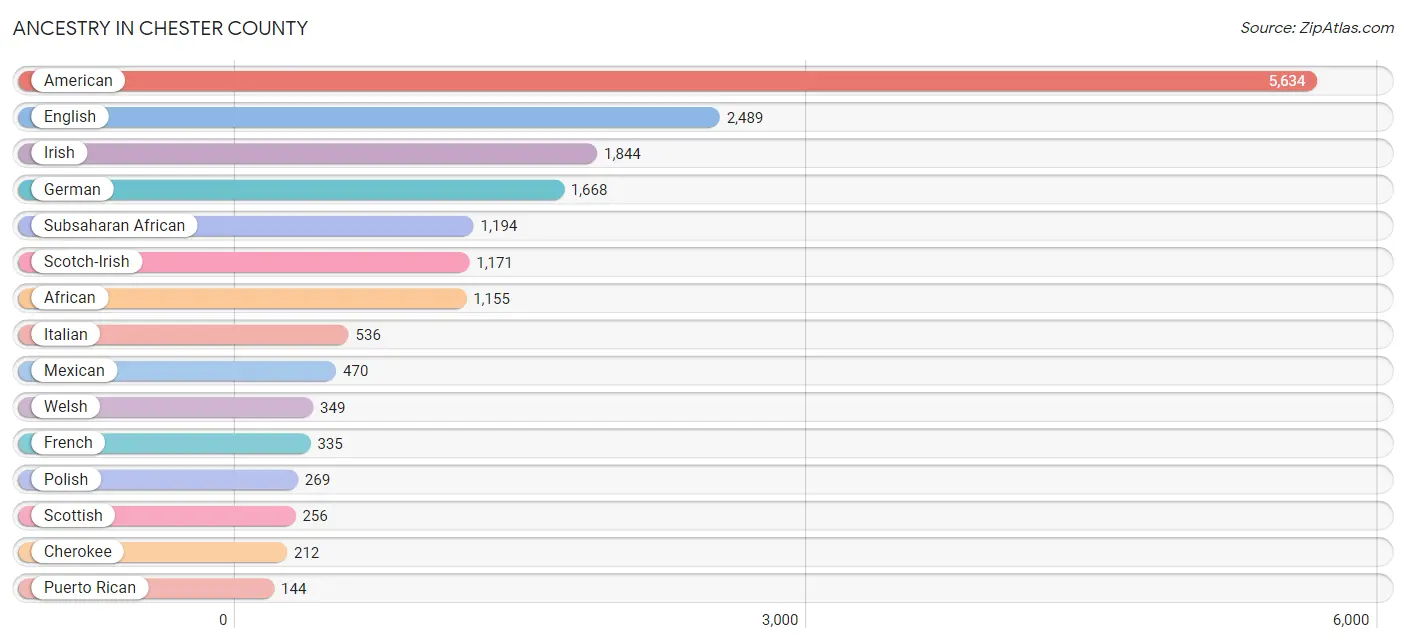
| Ancestry | # Population | % Population |
| African | 1,155 | 3.6% |
| Alaska Native | 7 | 0.0% |
| American | 5,634 | 17.5% |
| Arab | 8 | 0.0% |
| Austrian | 54 | 0.2% |
| Bahamian | 8 | 0.0% |
| Belgian | 66 | 0.2% |
| Belizean | 4 | 0.0% |
| Bhutanese | 14 | 0.0% |
| Blackfeet | 4 | 0.0% |
| British | 79 | 0.3% |
| Burmese | 7 | 0.0% |
| Canadian | 19 | 0.1% |
| Central American | 83 | 0.3% |
| Central American Indian | 31 | 0.1% |
| Cherokee | 212 | 0.7% |
| Choctaw | 6 | 0.0% |
| Colombian | 15 | 0.1% |
| Comanche | 10 | 0.0% |
| Costa Rican | 13 | 0.0% |
| Cuban | 42 | 0.1% |
| Czech | 90 | 0.3% |
| Dutch | 67 | 0.2% |
| Eastern European | 10 | 0.0% |
| English | 2,489 | 7.7% |
| European | 112 | 0.4% |
| Finnish | 16 | 0.1% |
| French | 335 | 1.0% |
| French American Indian | 8 | 0.0% |
| French Canadian | 50 | 0.2% |
| German | 1,668 | 5.2% |
| Greek | 8 | 0.0% |
| Guatemalan | 6 | 0.0% |
| Honduran | 64 | 0.2% |
| Hungarian | 32 | 0.1% |
| Indian (Asian) | 27 | 0.1% |
| Irish | 1,844 | 5.7% |
| Iroquois | 3 | 0.0% |
| Italian | 536 | 1.7% |
| Japanese | 6 | 0.0% |
| Korean | 66 | 0.2% |
| Lebanese | 8 | 0.0% |
| Lithuanian | 9 | 0.0% |
| Lumbee | 21 | 0.1% |
| Mexican | 470 | 1.5% |
| Mexican American Indian | 9 | 0.0% |
| Nigerian | 39 | 0.1% |
| Northern European | 4 | 0.0% |
| Norwegian | 38 | 0.1% |
| Peruvian | 4 | 0.0% |
| Polish | 269 | 0.8% |
| Portuguese | 14 | 0.0% |
| Pueblo | 10 | 0.0% |
| Puerto Rican | 144 | 0.4% |
| Russian | 11 | 0.0% |
| Scandinavian | 67 | 0.2% |
| Scotch-Irish | 1,171 | 3.6% |
| Scottish | 256 | 0.8% |
| South American | 19 | 0.1% |
| Sri Lankan | 103 | 0.3% |
| Subsaharan African | 1,194 | 3.7% |
| Swedish | 51 | 0.2% |
| Trinidadian and Tobagonian | 4 | 0.0% |
| Ukrainian | 38 | 0.1% |
| Welsh | 349 | 1.1% | View All 65 Rows |
Immigrants in Chester County
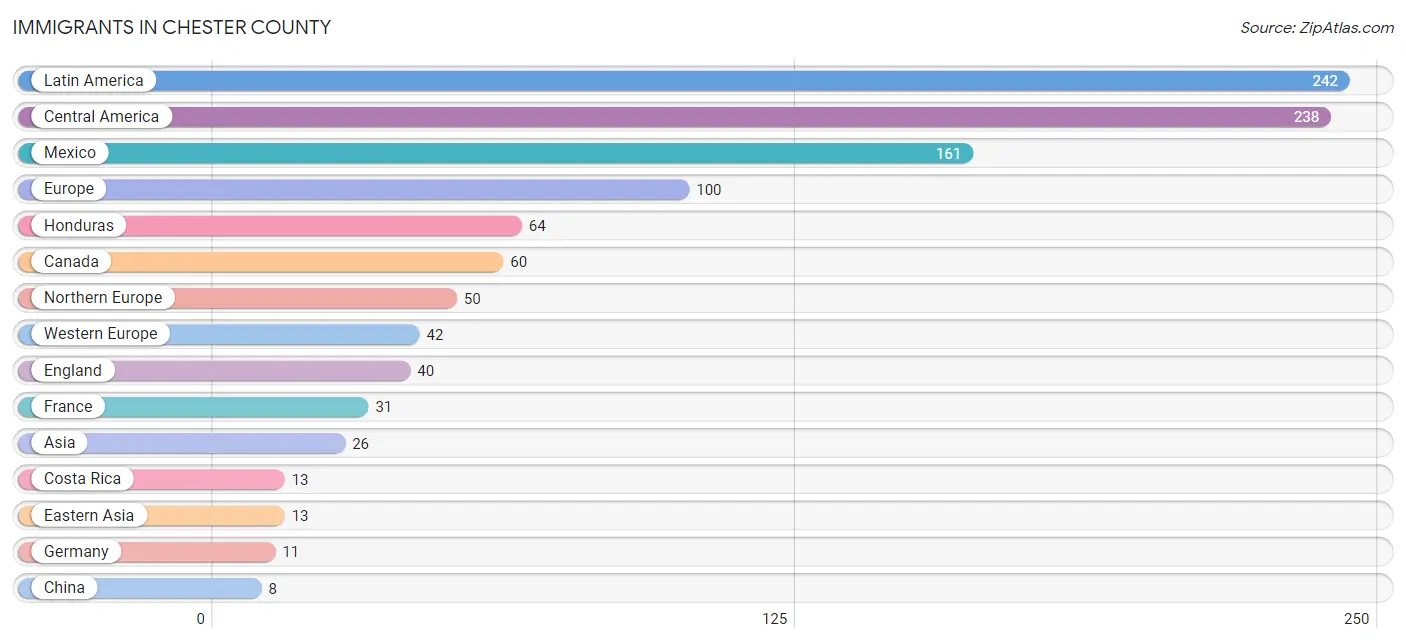
The most numerous immigrant groups reported in Chester County came from Latin America (242 | 0.7%), Central America (238 | 0.7%), Mexico (161 | 0.5%), Europe (100 | 0.3%), and Honduras (64 | 0.2%), together accounting for 2.5% of all Chester County residents.
| Immigration Origin | # Population | % Population |
| Asia | 26 | 0.1% |
| Cambodia | 4 | 0.0% |
| Canada | 60 | 0.2% |
| Caribbean | 4 | 0.0% |
| Central America | 238 | 0.7% |
| China | 8 | 0.0% |
| Costa Rica | 13 | 0.0% |
| Cuba | 4 | 0.0% |
| Eastern Asia | 13 | 0.0% |
| England | 40 | 0.1% |
| Europe | 100 | 0.3% |
| France | 31 | 0.1% |
| Germany | 11 | 0.0% |
| Greece | 8 | 0.0% |
| Honduras | 64 | 0.2% |
| Israel | 5 | 0.0% |
| Japan | 5 | 0.0% |
| Latin America | 242 | 0.7% |
| Mexico | 161 | 0.5% |
| Northern Europe | 50 | 0.2% |
| South Eastern Asia | 8 | 0.0% |
| Southern Europe | 8 | 0.0% |
| Thailand | 4 | 0.0% |
| Western Asia | 5 | 0.0% |
| Western Europe | 42 | 0.1% | View All 25 Rows |
Sex and Age in Chester County
Sex and Age in Chester County
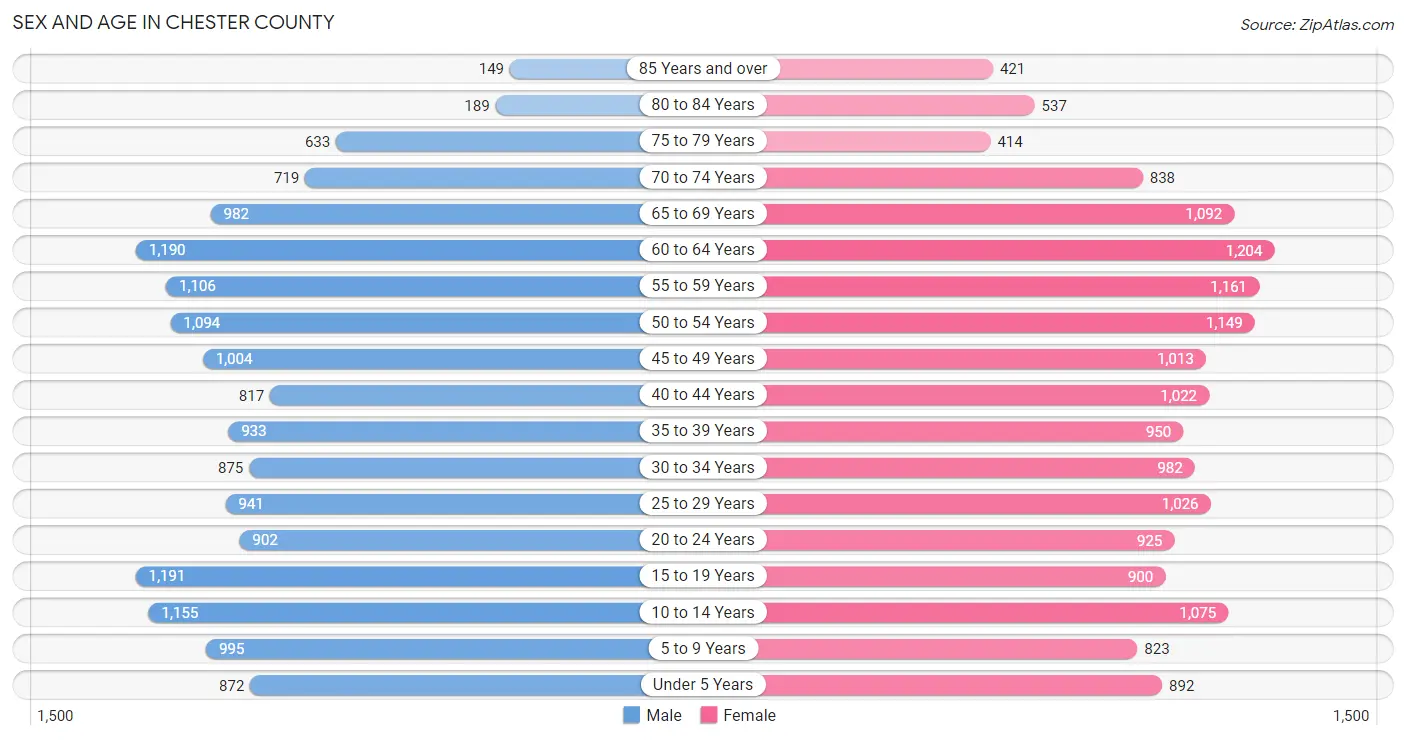
The most populous age groups in Chester County are 15 to 19 Years (1,191 | 7.6%) for men and 60 to 64 Years (1,204 | 7.3%) for women.
| Age Bracket | Male | Female |
| Under 5 Years | 872 (5.5%) | 892 (5.4%) |
| 5 to 9 Years | 995 (6.3%) | 823 (5.0%) |
| 10 to 14 Years | 1,155 (7.3%) | 1,075 (6.6%) |
| 15 to 19 Years | 1,191 (7.6%) | 900 (5.5%) |
| 20 to 24 Years | 902 (5.7%) | 925 (5.6%) |
| 25 to 29 Years | 941 (6.0%) | 1,026 (6.2%) |
| 30 to 34 Years | 875 (5.6%) | 982 (6.0%) |
| 35 to 39 Years | 933 (5.9%) | 950 (5.8%) |
| 40 to 44 Years | 817 (5.2%) | 1,022 (6.2%) |
| 45 to 49 Years | 1,004 (6.4%) | 1,013 (6.2%) |
| 50 to 54 Years | 1,094 (7.0%) | 1,149 (7.0%) |
| 55 to 59 Years | 1,106 (7.0%) | 1,161 (7.1%) |
| 60 to 64 Years | 1,190 (7.6%) | 1,204 (7.3%) |
| 65 to 69 Years | 982 (6.2%) | 1,092 (6.7%) |
| 70 to 74 Years | 719 (4.6%) | 838 (5.1%) |
| 75 to 79 Years | 633 (4.0%) | 414 (2.5%) |
| 80 to 84 Years | 189 (1.2%) | 537 (3.3%) |
| 85 Years and over | 149 (0.9%) | 421 (2.6%) |
| Total | 15,747 (100.0%) | 16,424 (100.0%) |
Families and Households in Chester County
Median Family Size in Chester County
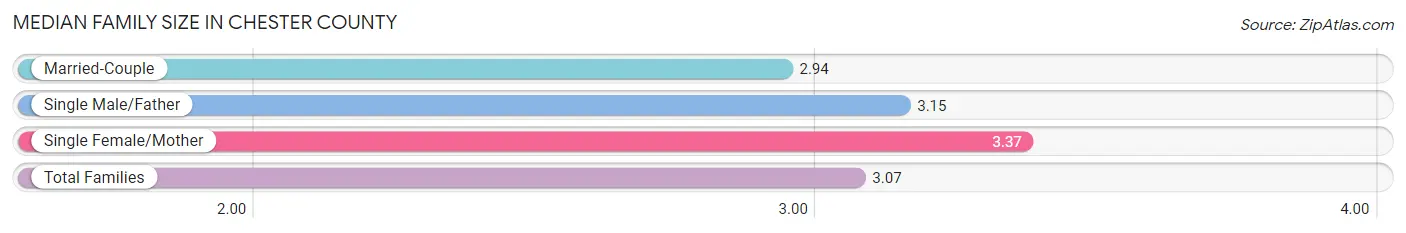
The median family size in Chester County is 3.07 persons per family, with single female/mother families (2,193 | 25.8%) accounting for the largest median family size of 3.37 persons per family. On the other hand, married-couple families (5,710 | 67.1%) represent the smallest median family size with 2.94 persons per family.
| Family Type | # Families | Family Size |
| Married-Couple | 5,710 (67.1%) | 2.94 |
| Single Male/Father | 604 (7.1%) | 3.15 |
| Single Female/Mother | 2,193 (25.8%) | 3.37 |
| Total Families | 8,507 (100.0%) | 3.07 |
Median Household Size in Chester County
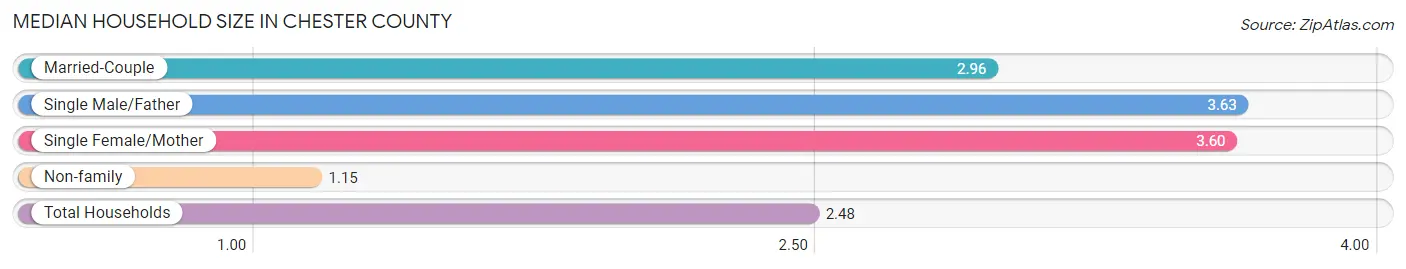
The median household size in Chester County is 2.48 persons per household, with single male/father households (604 | 4.7%) accounting for the largest median household size of 3.63 persons per household. non-family households (4,383 | 34.0%) represent the smallest median household size with 1.15 persons per household.
| Household Type | # Households | Household Size |
| Married-Couple | 5,710 (44.3%) | 2.96 |
| Single Male/Father | 604 (4.7%) | 3.63 |
| Single Female/Mother | 2,193 (17.0%) | 3.60 |
| Non-family | 4,383 (34.0%) | 1.15 |
| Total Households | 12,890 (100.0%) | 2.48 |
Household Size by Marriage Status in Chester County
Out of a total of 12,890 households in Chester County, 8,507 (66.0%) are family households, while 4,383 (34.0%) are nonfamily households. The most numerous type of family households are 2-person households, comprising 4,307, and the most common type of nonfamily households are 1-person households, comprising 3,864.
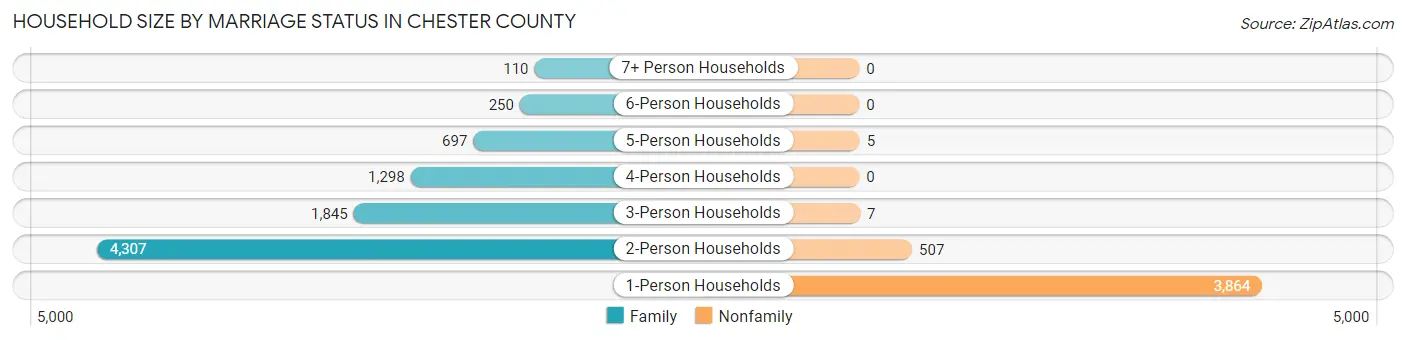
| Household Size | Family Households | Nonfamily Households |
| 1-Person Households | - | 3,864 (30.0%) |
| 2-Person Households | 4,307 (33.4%) | 507 (3.9%) |
| 3-Person Households | 1,845 (14.3%) | 7 (0.1%) |
| 4-Person Households | 1,298 (10.1%) | 0 (0.0%) |
| 5-Person Households | 697 (5.4%) | 5 (0.0%) |
| 6-Person Households | 250 (1.9%) | 0 (0.0%) |
| 7+ Person Households | 110 (0.9%) | 0 (0.0%) |
| Total | 8,507 (66.0%) | 4,383 (34.0%) |
Female Fertility in Chester County
Fertility by Age in Chester County
Average fertility rate in Chester County is 83.0 births per 1,000 women. Women in the age bracket of 20 to 34 years have the highest fertility rate with 122.0 births per 1,000 women. Women in the age bracket of 20 to 34 years acount for 61.0% of all women with births.
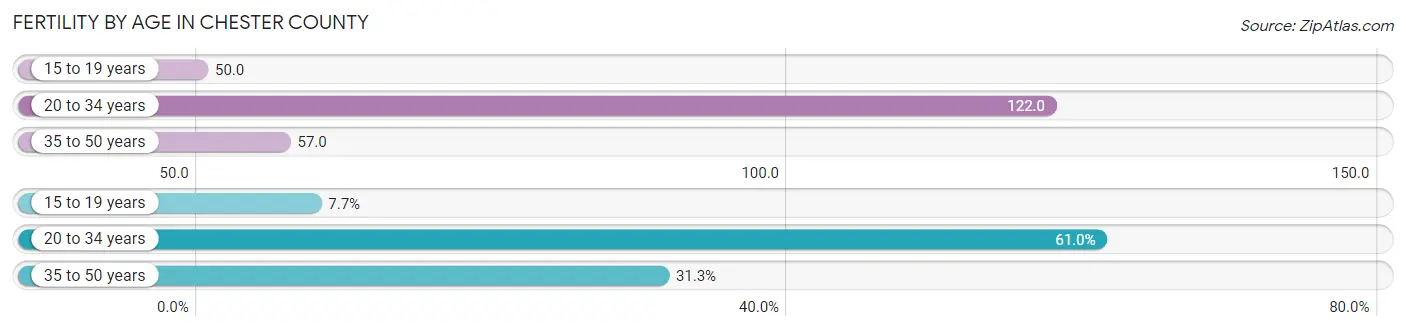
| Age Bracket | Women with Births | Births / 1,000 Women |
| 15 to 19 years | 45 (7.7%) | 50.0 |
| 20 to 34 years | 357 (61.0%) | 122.0 |
| 35 to 50 years | 183 (31.3%) | 57.0 |
| Total | 585 (100.0%) | 83.0 |
Fertility by Age by Marriage Status in Chester County
40.0% of women with births (585) in Chester County are married. The highest percentage of unmarried women with births falls into 15 to 19 years age bracket with 77.8% of them unmarried at the time of birth, while the lowest percentage of unmarried women with births belong to 35 to 50 years age bracket with 38.8% of them unmarried.
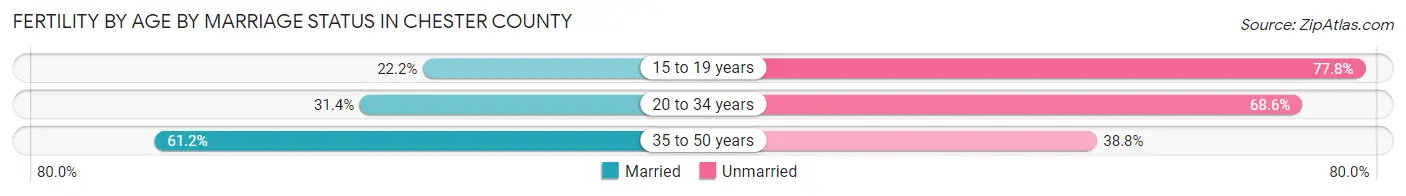
| Age Bracket | Married | Unmarried |
| 15 to 19 years | 10 (22.2%) | 35 (77.8%) |
| 20 to 34 years | 112 (31.4%) | 245 (68.6%) |
| 35 to 50 years | 112 (61.2%) | 71 (38.8%) |
| Total | 234 (40.0%) | 351 (60.0%) |
Fertility by Education in Chester County
Average fertility rate in Chester County is 83.0 births per 1,000 women. Women with the education attainment of bachelor's degree have the highest fertility rate of 119.0 births per 1,000 women, while women with the education attainment of graduate degree have the lowest fertility at 13.0 births per 1,000 women. Women with the education attainment of high school diploma represent 36.2% of all women with births.
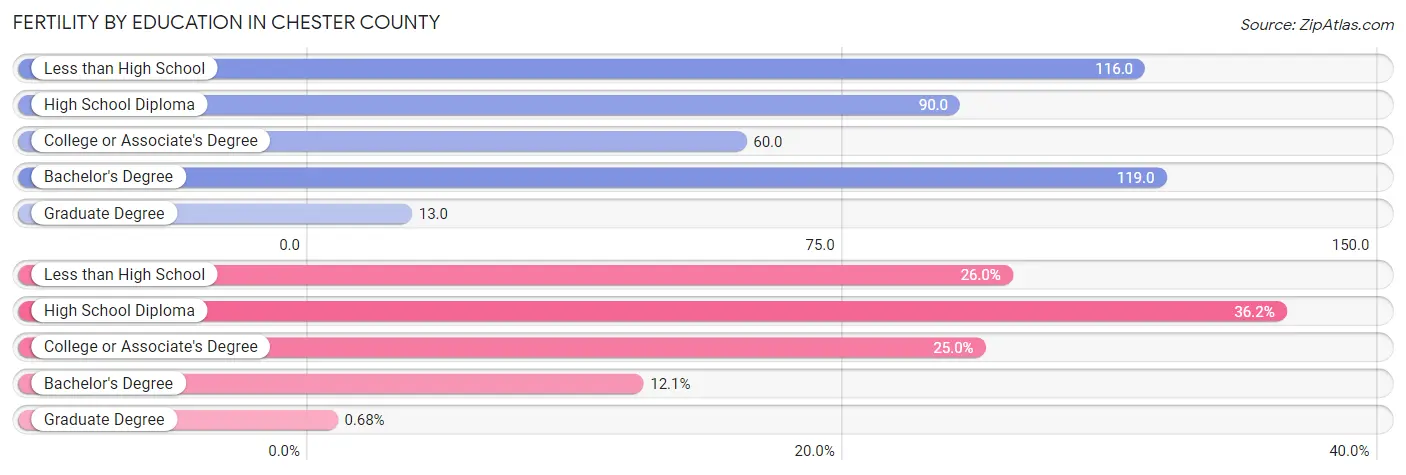
| Educational Attainment | Women with Births | Births / 1,000 Women |
| Less than High School | 152 (26.0%) | 116.0 |
| High School Diploma | 212 (36.2%) | 90.0 |
| College or Associate's Degree | 146 (25.0%) | 60.0 |
| Bachelor's Degree | 71 (12.1%) | 119.0 |
| Graduate Degree | 4 (0.7%) | 13.0 |
| Total | 585 (100.0%) | 83.0 |
Fertility by Education by Marriage Status in Chester County
60.0% of women with births in Chester County are unmarried. Women with the educational attainment of bachelor's degree are most likely to be married with 100.0% of them married at childbirth, while women with the educational attainment of high school diploma are least likely to be married with 95.8% of them unmarried at childbirth.
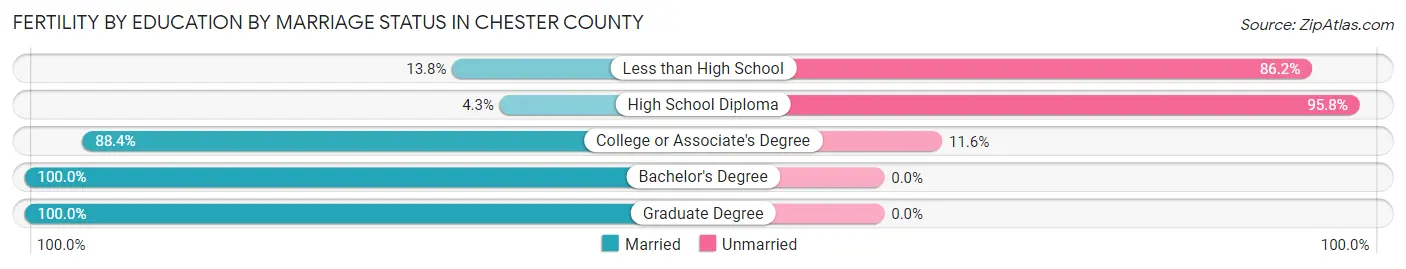
| Educational Attainment | Married | Unmarried |
| Less than High School | 21 (13.8%) | 131 (86.2%) |
| High School Diploma | 9 (4.3%) | 203 (95.8%) |
| College or Associate's Degree | 129 (88.4%) | 17 (11.6%) |
| Bachelor's Degree | 71 (100.0%) | 0 (0.0%) |
| Graduate Degree | 4 (100.0%) | 0 (0.0%) |
| Total | 234 (40.0%) | 351 (60.0%) |
Employment Characteristics in Chester County
Employment by Class of Employer in Chester County
Among the 13,438 employed individuals in Chester County, private company employees (9,766 | 72.7%), local government employees (1,215 | 9.0%), and state government employees (681 | 5.1%) make up the most common classes of employment.
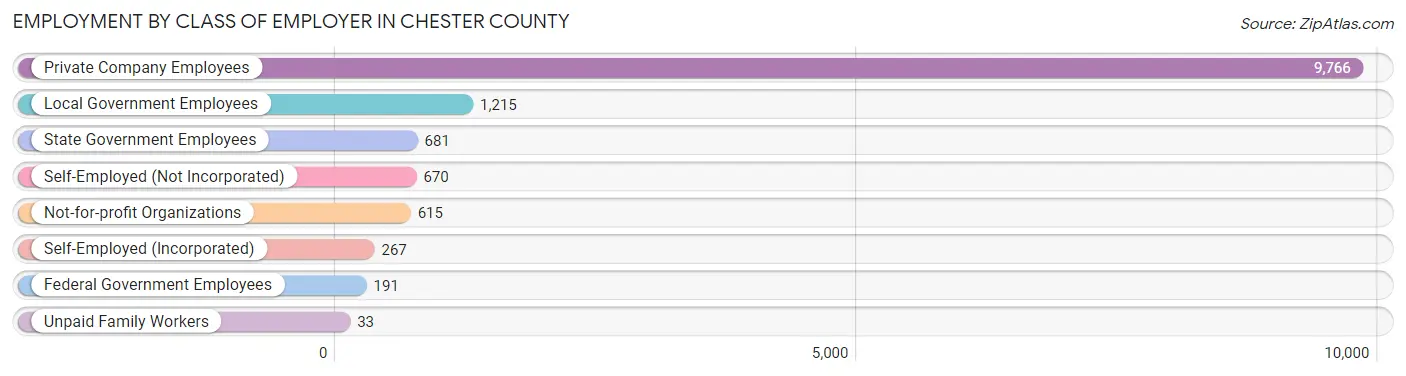
| Employer Class | # Employees | % Employees |
| Private Company Employees | 9,766 | 72.7% |
| Self-Employed (Incorporated) | 267 | 2.0% |
| Self-Employed (Not Incorporated) | 670 | 5.0% |
| Not-for-profit Organizations | 615 | 4.6% |
| Local Government Employees | 1,215 | 9.0% |
| State Government Employees | 681 | 5.1% |
| Federal Government Employees | 191 | 1.4% |
| Unpaid Family Workers | 33 | 0.3% |
| Total | 13,438 | 100.0% |
Employment Status by Age in Chester County
According to the labor force statistics for Chester County, out of the total population over 16 years of age (26,078), 56.3% or 14,682 individuals are in the labor force, with 6.2% or 910 of them unemployed. The age group with the highest labor force participation rate is 30 to 34 years, with 91.7% or 1,703 individuals in the labor force. Within the labor force, the 16 to 19 years age range has the highest percentage of unemployed individuals, with 16.5% or 95 of them being unemployed.
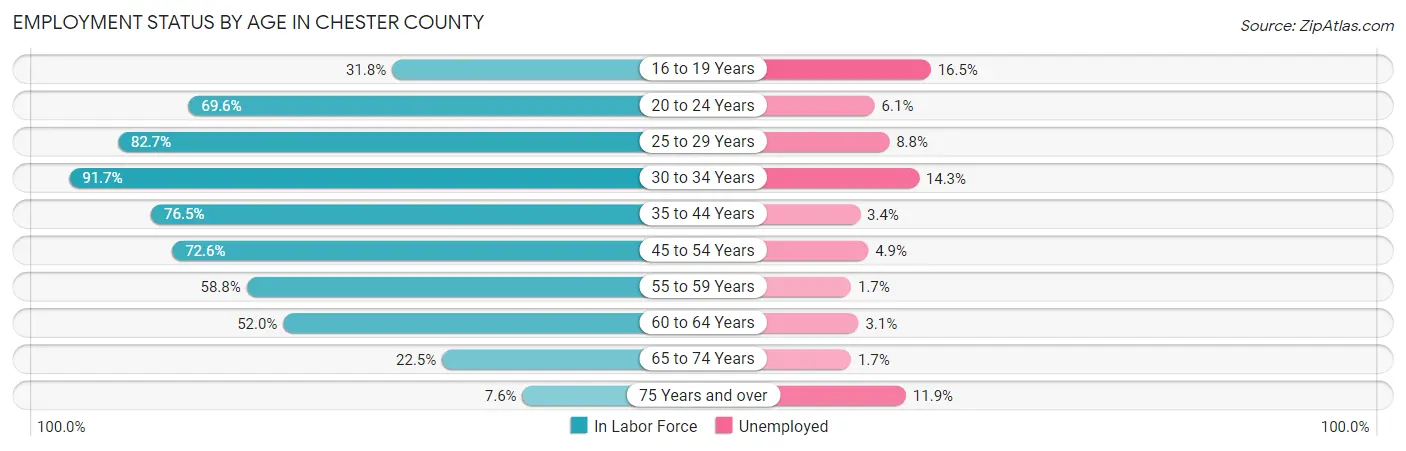
| Age Bracket | In Labor Force | Unemployed |
| 16 to 19 Years | 576 (31.8%) | 95 (16.5%) |
| 20 to 24 Years | 1,272 (69.6%) | 78 (6.1%) |
| 25 to 29 Years | 1,627 (82.7%) | 143 (8.8%) |
| 30 to 34 Years | 1,703 (91.7%) | 244 (14.3%) |
| 35 to 44 Years | 2,847 (76.5%) | 97 (3.4%) |
| 45 to 54 Years | 3,093 (72.6%) | 152 (4.9%) |
| 55 to 59 Years | 1,333 (58.8%) | 23 (1.7%) |
| 60 to 64 Years | 1,245 (52.0%) | 39 (3.1%) |
| 65 to 74 Years | 817 (22.5%) | 14 (1.7%) |
| 75 Years and over | 178 (7.6%) | 21 (11.9%) |
| Total | 14,682 (56.3%) | 910 (6.2%) |
Employment Status by Educational Attainment in Chester County
According to labor force statistics for Chester County, 71.9% of individuals (11,840) out of the total population between 25 and 64 years of age (16,467) are in the labor force, with 5.9% or 699 of them being unemployed. The group with the highest labor force participation rate are those with the educational attainment of bachelor's degree or higher, with 88.4% or 2,105 individuals in the labor force. Within the labor force, individuals with less than high school education have the highest percentage of unemployment, with 18.0% or 193 of them being unemployed.
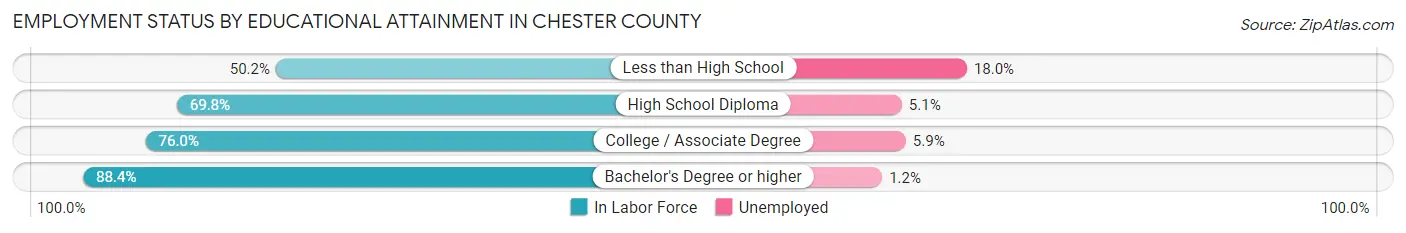
| Educational Attainment | In Labor Force | Unemployed |
| Less than High School | 1,072 (50.2%) | 384 (18.0%) |
| High School Diploma | 4,631 (69.8%) | 338 (5.1%) |
| College / Associate Degree | 4,041 (76.0%) | 314 (5.9%) |
| Bachelor's Degree or higher | 2,105 (88.4%) | 29 (1.2%) |
| Total | 11,840 (71.9%) | 972 (5.9%) |
Employment Occupations by Sex in Chester County
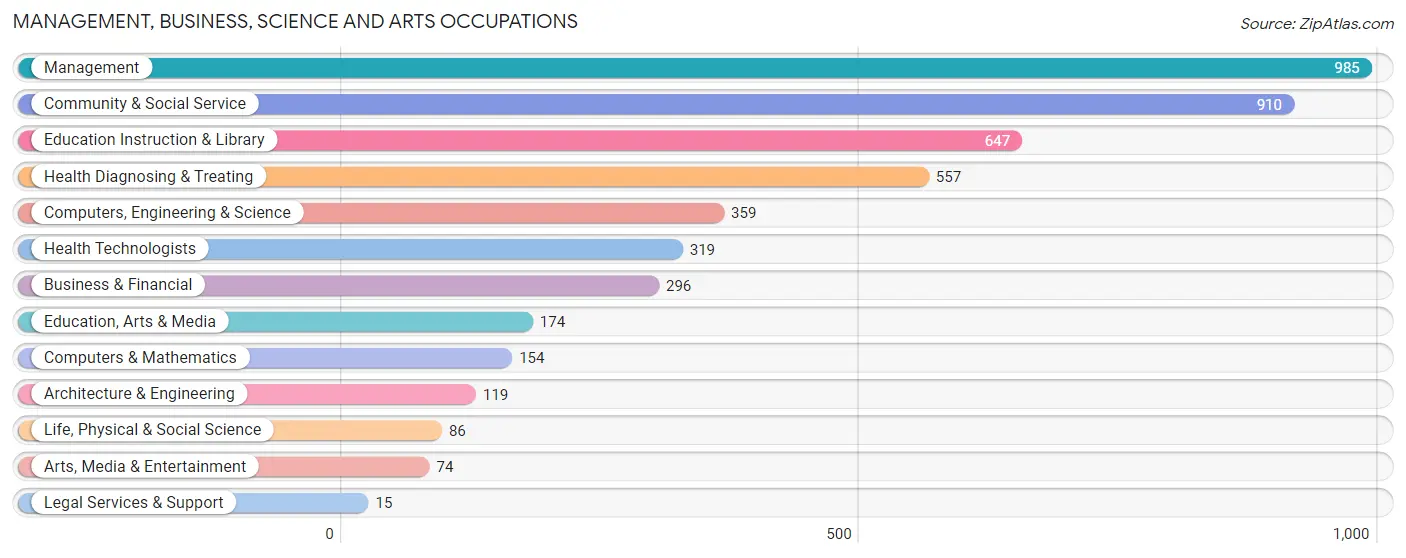
Management, Business, Science and Arts Occupations
The most common Management, Business, Science and Arts occupations in Chester County are Management (985 | 7.2%), Community & Social Service (910 | 6.6%), Education Instruction & Library (647 | 4.7%), Health Diagnosing & Treating (557 | 4.1%), and Computers, Engineering & Science (359 | 2.6%).
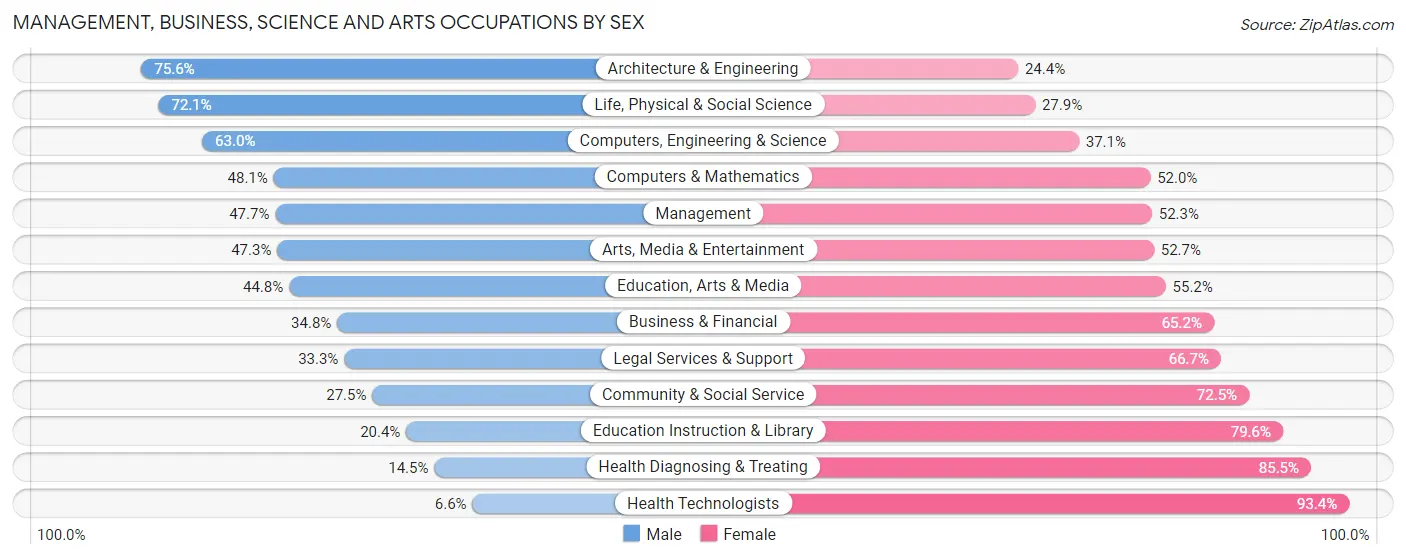
Management, Business, Science and Arts Occupations by Sex
Within the Management, Business, Science and Arts occupations in Chester County, the most male-oriented occupations are Architecture & Engineering (75.6%), Life, Physical & Social Science (72.1%), and Computers, Engineering & Science (62.9%), while the most female-oriented occupations are Health Technologists (93.4%), Health Diagnosing & Treating (85.5%), and Education Instruction & Library (79.6%).
| Occupation | Male | Female |
| Management | 470 (47.7%) | 515 (52.3%) |
| Business & Financial | 103 (34.8%) | 193 (65.2%) |
| Computers, Engineering & Science | 226 (62.9%) | 133 (37.0%) |
| Computers & Mathematics | 74 (48.0%) | 80 (51.9%) |
| Architecture & Engineering | 90 (75.6%) | 29 (24.4%) |
| Life, Physical & Social Science | 62 (72.1%) | 24 (27.9%) |
| Community & Social Service | 250 (27.5%) | 660 (72.5%) |
| Education, Arts & Media | 78 (44.8%) | 96 (55.2%) |
| Legal Services & Support | 5 (33.3%) | 10 (66.7%) |
| Education Instruction & Library | 132 (20.4%) | 515 (79.6%) |
| Arts, Media & Entertainment | 35 (47.3%) | 39 (52.7%) |
| Health Diagnosing & Treating | 81 (14.5%) | 476 (85.5%) |
| Health Technologists | 21 (6.6%) | 298 (93.4%) |
| Total (Category) | 1,130 (36.4%) | 1,977 (63.6%) |
| Total (Overall) | 6,580 (48.0%) | 7,128 (52.0%) |
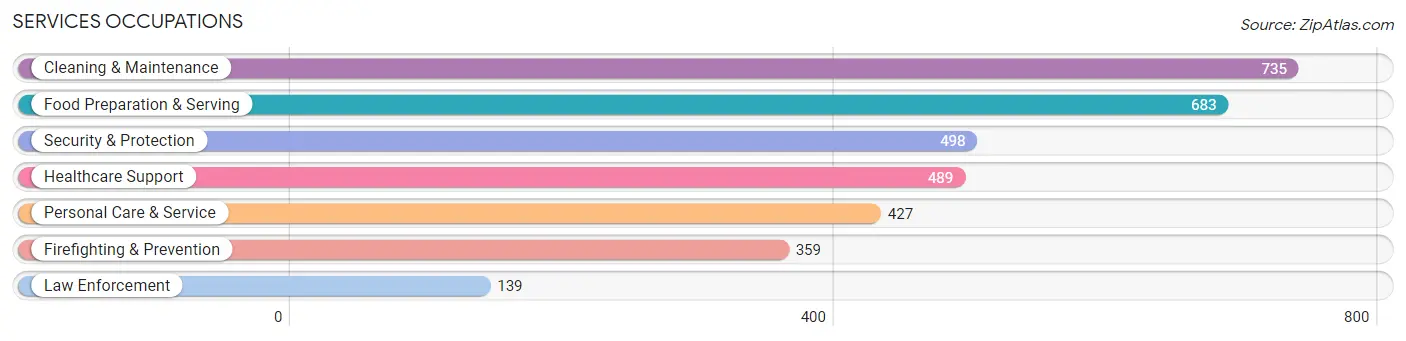
Services Occupations
The most common Services occupations in Chester County are Cleaning & Maintenance (735 | 5.4%), Food Preparation & Serving (683 | 5.0%), Security & Protection (498 | 3.6%), Healthcare Support (489 | 3.6%), and Personal Care & Service (427 | 3.1%).
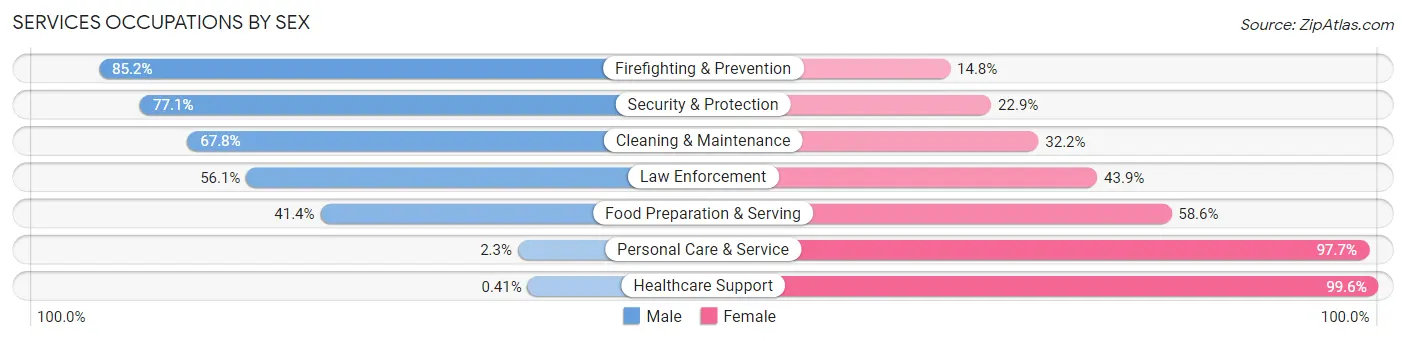
Services Occupations by Sex
Within the Services occupations in Chester County, the most male-oriented occupations are Firefighting & Prevention (85.2%), Security & Protection (77.1%), and Cleaning & Maintenance (67.8%), while the most female-oriented occupations are Healthcare Support (99.6%), Personal Care & Service (97.7%), and Food Preparation & Serving (58.6%).
| Occupation | Male | Female |
| Healthcare Support | 2 (0.4%) | 487 (99.6%) |
| Security & Protection | 384 (77.1%) | 114 (22.9%) |
| Firefighting & Prevention | 306 (85.2%) | 53 (14.8%) |
| Law Enforcement | 78 (56.1%) | 61 (43.9%) |
| Food Preparation & Serving | 283 (41.4%) | 400 (58.6%) |
| Cleaning & Maintenance | 498 (67.8%) | 237 (32.2%) |
| Personal Care & Service | 10 (2.3%) | 417 (97.7%) |
| Total (Category) | 1,177 (41.6%) | 1,655 (58.4%) |
| Total (Overall) | 6,580 (48.0%) | 7,128 (52.0%) |
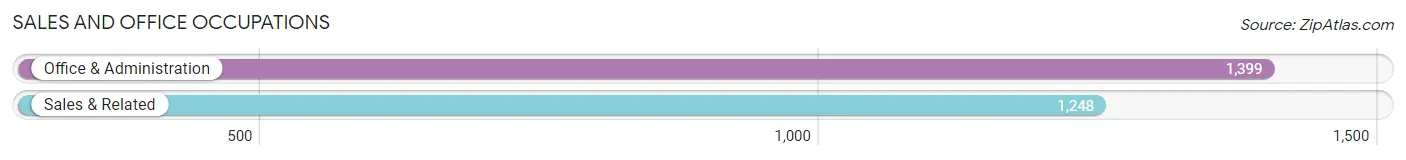
Sales and Office Occupations
The most common Sales and Office occupations in Chester County are Office & Administration (1,399 | 10.2%), and Sales & Related (1,248 | 9.1%).
Sales and Office Occupations by Sex
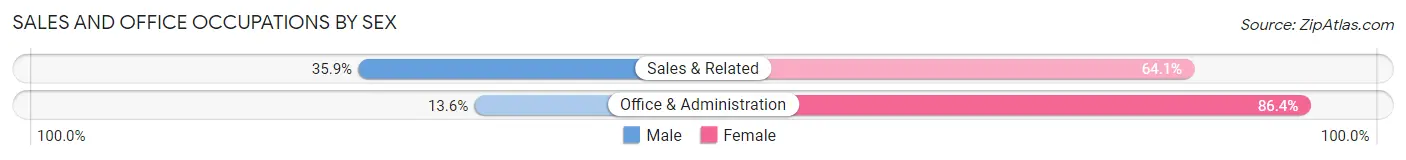
| Occupation | Male | Female |
| Sales & Related | 448 (35.9%) | 800 (64.1%) |
| Office & Administration | 190 (13.6%) | 1,209 (86.4%) |
| Total (Category) | 638 (24.1%) | 2,009 (75.9%) |
| Total (Overall) | 6,580 (48.0%) | 7,128 (52.0%) |
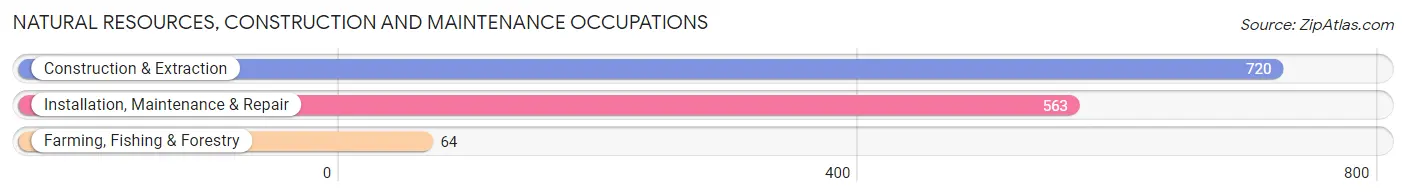
Natural Resources, Construction and Maintenance Occupations
The most common Natural Resources, Construction and Maintenance occupations in Chester County are Construction & Extraction (720 | 5.2%), Installation, Maintenance & Repair (563 | 4.1%), and Farming, Fishing & Forestry (64 | 0.5%).
Natural Resources, Construction and Maintenance Occupations by Sex
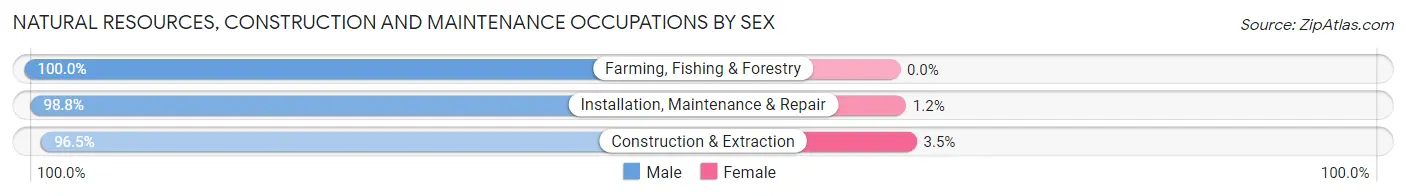
| Occupation | Male | Female |
| Farming, Fishing & Forestry | 64 (100.0%) | 0 (0.0%) |
| Construction & Extraction | 695 (96.5%) | 25 (3.5%) |
| Installation, Maintenance & Repair | 556 (98.8%) | 7 (1.2%) |
| Total (Category) | 1,315 (97.6%) | 32 (2.4%) |
| Total (Overall) | 6,580 (48.0%) | 7,128 (52.0%) |
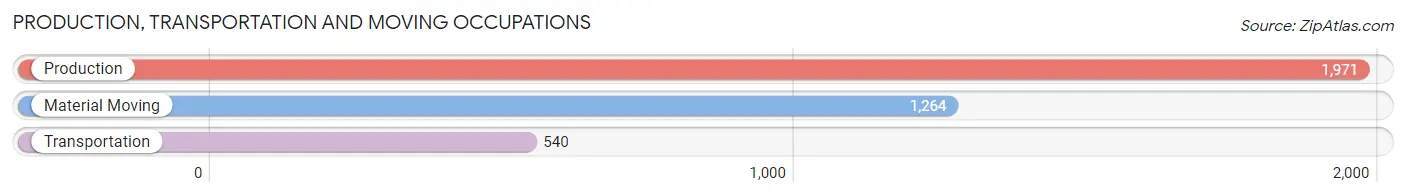
Production, Transportation and Moving Occupations
The most common Production, Transportation and Moving occupations in Chester County are Production (1,971 | 14.4%), Material Moving (1,264 | 9.2%), and Transportation (540 | 3.9%).
Production, Transportation and Moving Occupations by Sex
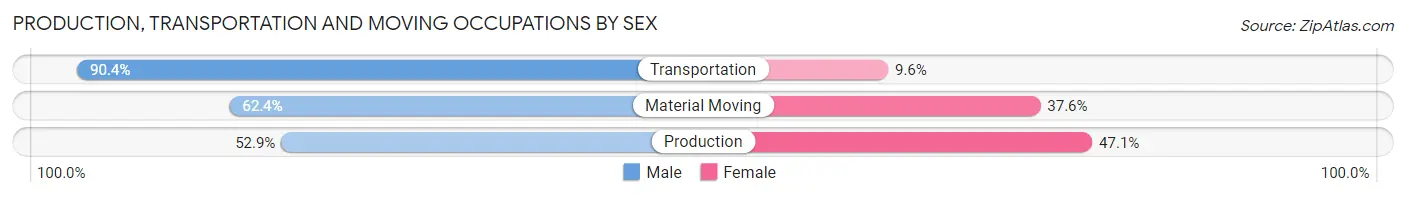
| Occupation | Male | Female |
| Production | 1,043 (52.9%) | 928 (47.1%) |
| Transportation | 488 (90.4%) | 52 (9.6%) |
| Material Moving | 789 (62.4%) | 475 (37.6%) |
| Total (Category) | 2,320 (61.5%) | 1,455 (38.5%) |
| Total (Overall) | 6,580 (48.0%) | 7,128 (52.0%) |
Employment Industries by Sex in Chester County
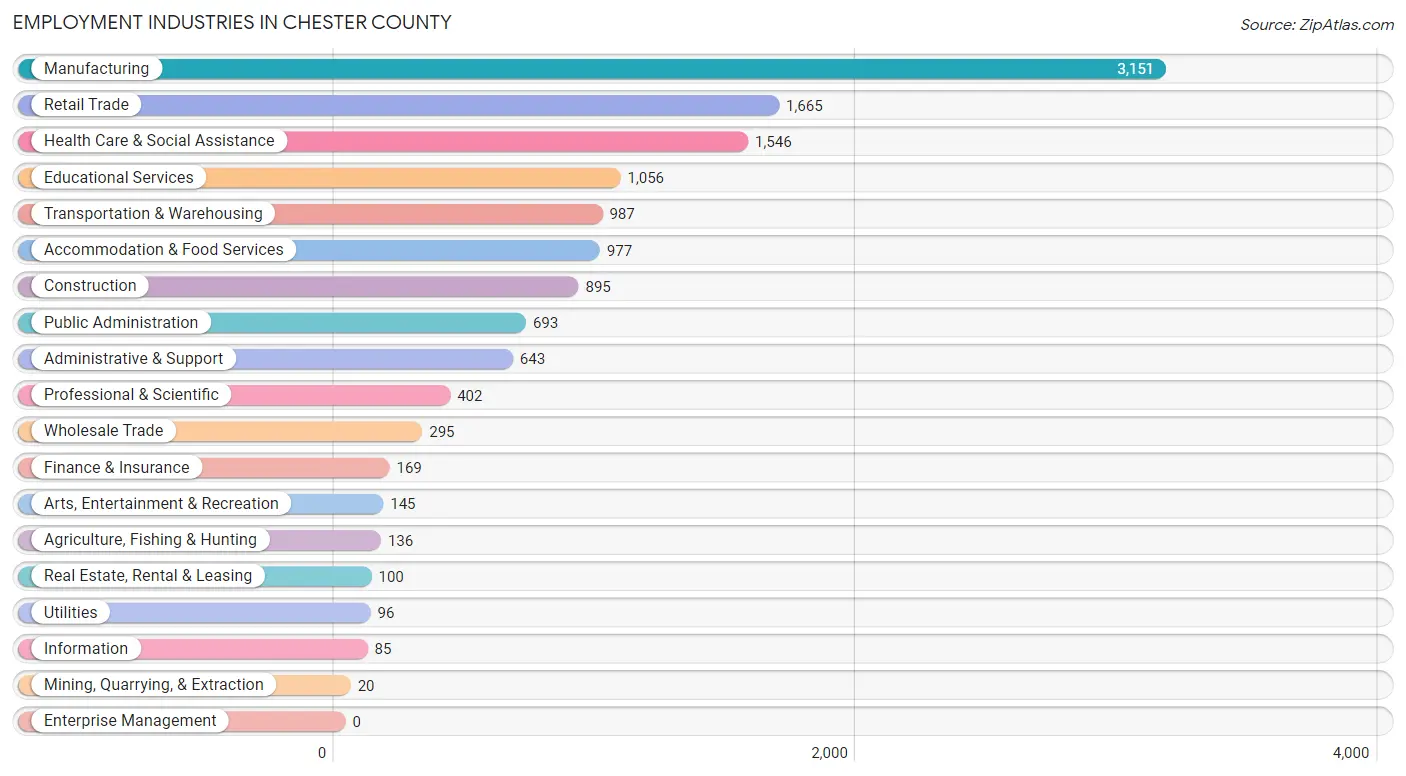
Employment Industries in Chester County
The major employment industries in Chester County include Manufacturing (3,151 | 23.0%), Retail Trade (1,665 | 12.1%), Health Care & Social Assistance (1,546 | 11.3%), Educational Services (1,056 | 7.7%), and Transportation & Warehousing (987 | 7.2%).
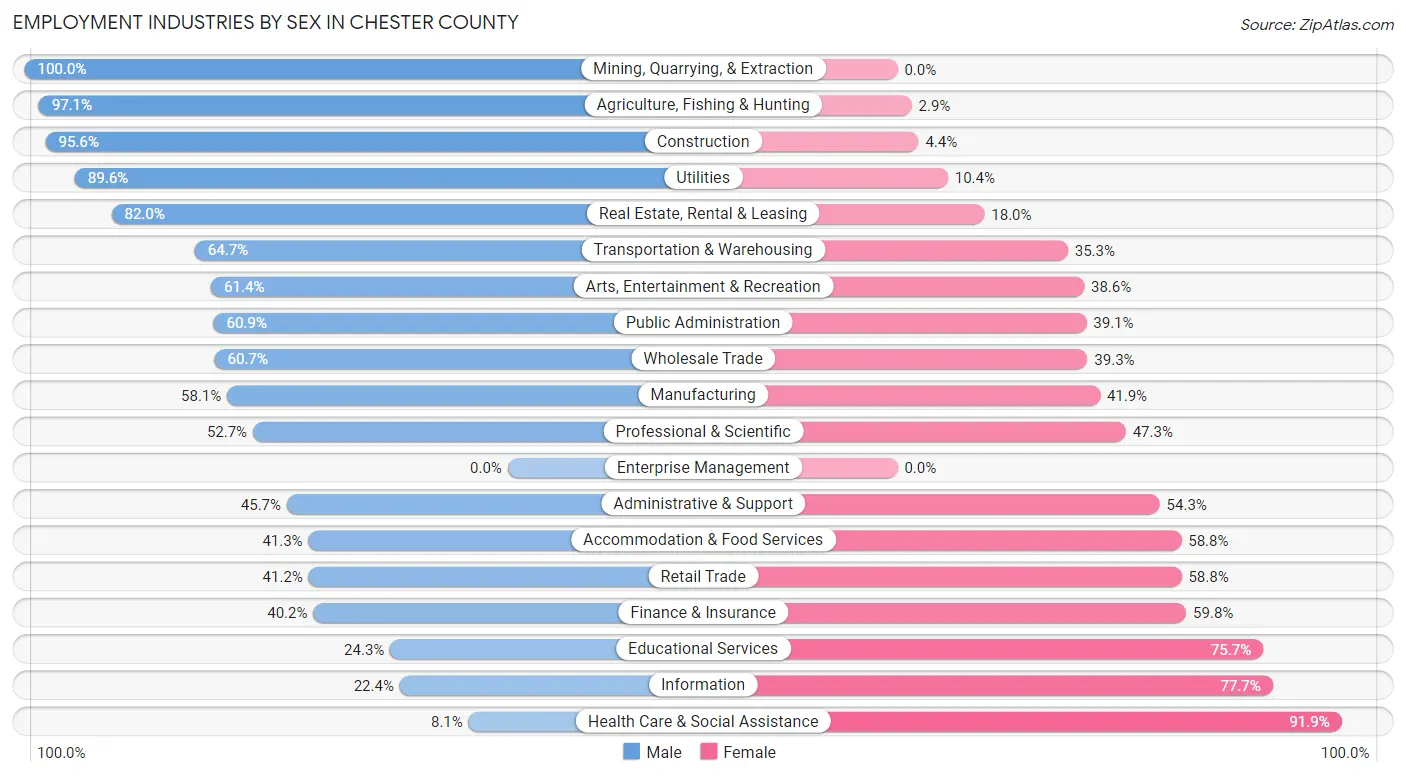
Employment Industries by Sex in Chester County
The Chester County industries that see more men than women are Mining, Quarrying, & Extraction (100.0%), Agriculture, Fishing & Hunting (97.1%), and Construction (95.6%), whereas the industries that tend to have a higher number of women are Health Care & Social Assistance (91.9%), Information (77.6%), and Educational Services (75.7%).
| Industry | Male | Female |
| Agriculture, Fishing & Hunting | 132 (97.1%) | 4 (2.9%) |
| Mining, Quarrying, & Extraction | 20 (100.0%) | 0 (0.0%) |
| Construction | 856 (95.6%) | 39 (4.4%) |
| Manufacturing | 1,830 (58.1%) | 1,321 (41.9%) |
| Wholesale Trade | 179 (60.7%) | 116 (39.3%) |
| Retail Trade | 686 (41.2%) | 979 (58.8%) |
| Transportation & Warehousing | 639 (64.7%) | 348 (35.3%) |
| Utilities | 86 (89.6%) | 10 (10.4%) |
| Information | 19 (22.4%) | 66 (77.6%) |
| Finance & Insurance | 68 (40.2%) | 101 (59.8%) |
| Real Estate, Rental & Leasing | 82 (82.0%) | 18 (18.0%) |
| Professional & Scientific | 212 (52.7%) | 190 (47.3%) |
| Enterprise Management | 0 (0.0%) | 0 (0.0%) |
| Administrative & Support | 294 (45.7%) | 349 (54.3%) |
| Educational Services | 257 (24.3%) | 799 (75.7%) |
| Health Care & Social Assistance | 125 (8.1%) | 1,421 (91.9%) |
| Arts, Entertainment & Recreation | 89 (61.4%) | 56 (38.6%) |
| Accommodation & Food Services | 403 (41.2%) | 574 (58.8%) |
| Public Administration | 422 (60.9%) | 271 (39.1%) |
| Total | 6,580 (48.0%) | 7,128 (52.0%) |
Education in Chester County
School Enrollment in Chester County
The most common levels of schooling among the 6,718 students in Chester County are middle school (1,875 | 27.9%), high school (1,587 | 23.6%), and elementary school (1,435 | 21.4%).
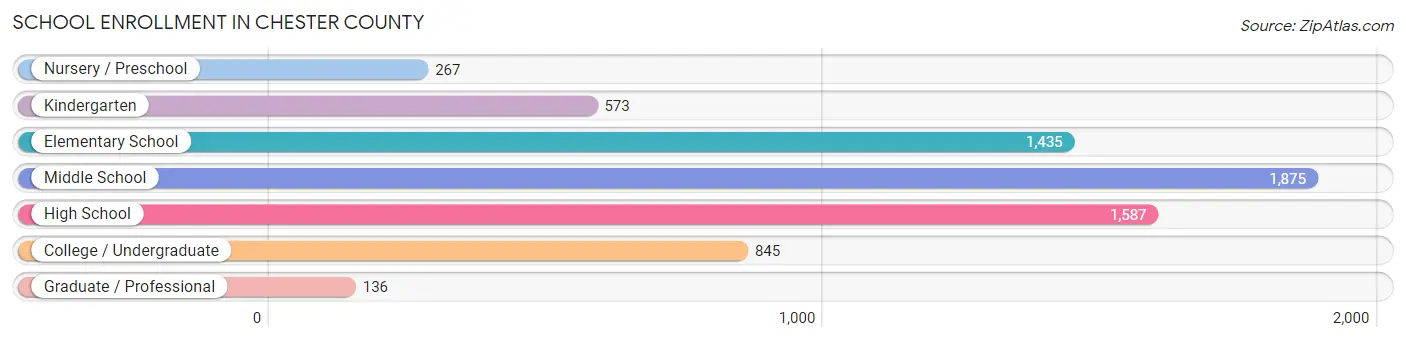
| School Level | # Students | % Students |
| Nursery / Preschool | 267 | 4.0% |
| Kindergarten | 573 | 8.5% |
| Elementary School | 1,435 | 21.4% |
| Middle School | 1,875 | 27.9% |
| High School | 1,587 | 23.6% |
| College / Undergraduate | 845 | 12.6% |
| Graduate / Professional | 136 | 2.0% |
| Total | 6,718 | 100.0% |
School Enrollment by Age by Funding Source in Chester County
Out of a total of 6,718 students who are enrolled in schools in Chester County, 786 (11.7%) attend a private institution, while the remaining 5,932 (88.3%) are enrolled in public schools. The age group of 3 to 4 year olds has the highest likelihood of being enrolled in private schools, with 109 (55.3% in the age bracket) enrolled. Conversely, the age group of 18 to 19 year olds has the lowest likelihood of being enrolled in a private school, with 395 (96.8% in the age bracket) attending a public institution.
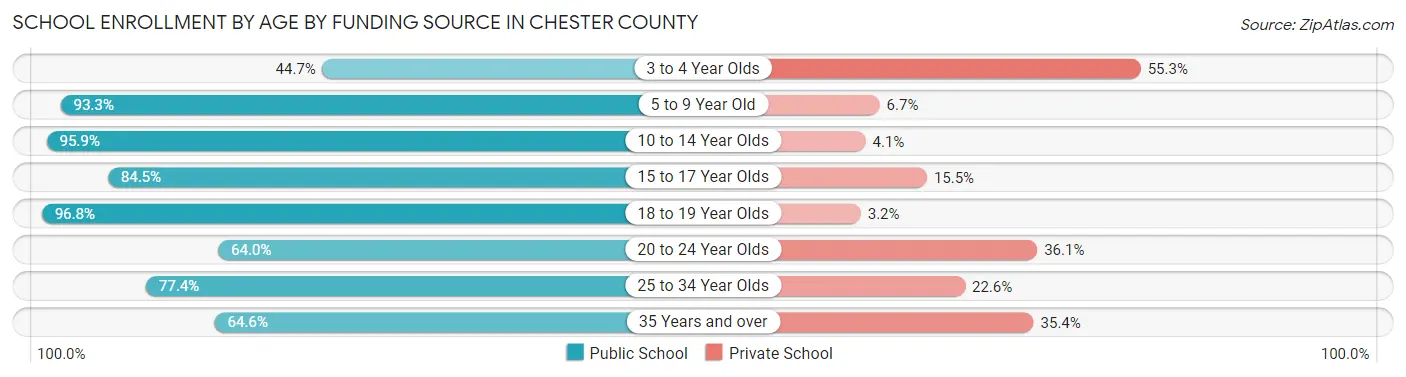
| Age Bracket | Public School | Private School |
| 3 to 4 Year Olds | 88 (44.7%) | 109 (55.3%) |
| 5 to 9 Year Old | 1,686 (93.3%) | 121 (6.7%) |
| 10 to 14 Year Olds | 2,133 (95.9%) | 91 (4.1%) |
| 15 to 17 Year Olds | 1,057 (84.5%) | 194 (15.5%) |
| 18 to 19 Year Olds | 395 (96.8%) | 13 (3.2%) |
| 20 to 24 Year Olds | 220 (63.9%) | 124 (36.0%) |
| 25 to 34 Year Olds | 226 (77.4%) | 66 (22.6%) |
| 35 Years and over | 126 (64.6%) | 69 (35.4%) |
| Total | 5,932 (88.3%) | 786 (11.7%) |
Educational Attainment by Field of Study in Chester County
Business (945 | 29.0%), education (550 | 16.9%), science & technology (434 | 13.3%), liberal arts & history (217 | 6.7%), and arts & humanities (216 | 6.6%) are the most common fields of study among 3,256 individuals in Chester County who have obtained a bachelor's degree or higher.
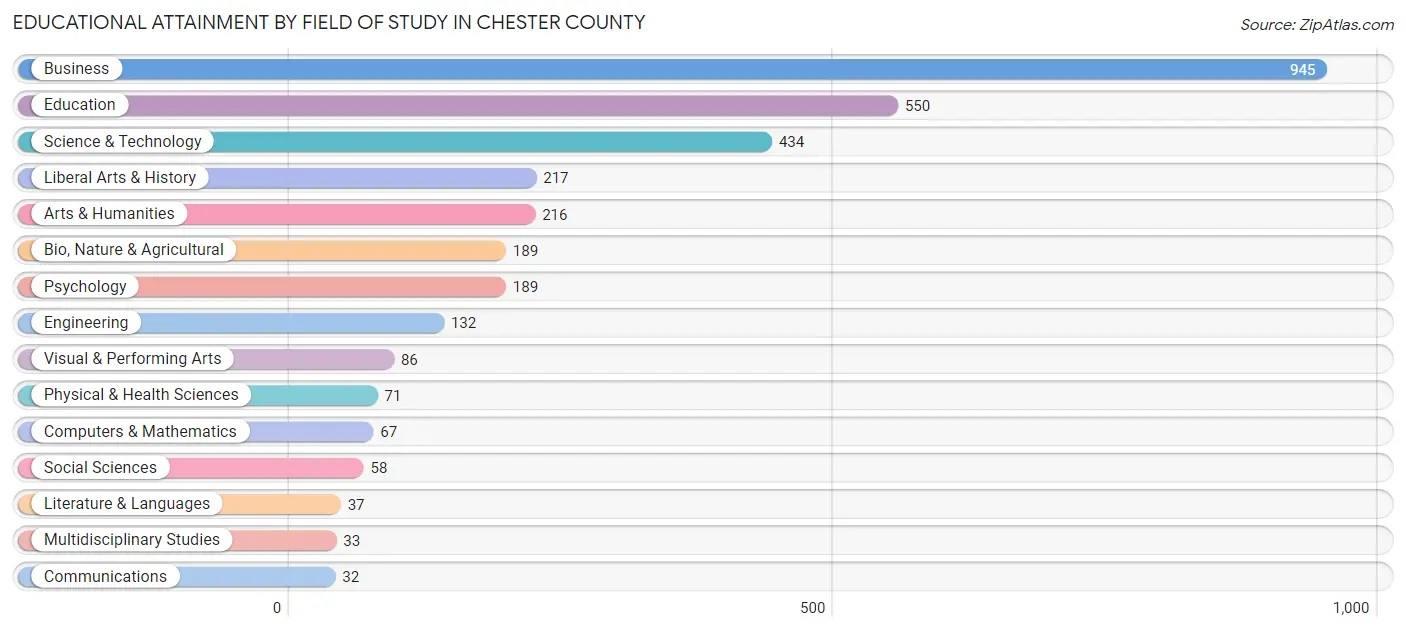
| Field of Study | # Graduates | % Graduates |
| Computers & Mathematics | 67 | 2.1% |
| Bio, Nature & Agricultural | 189 | 5.8% |
| Physical & Health Sciences | 71 | 2.2% |
| Psychology | 189 | 5.8% |
| Social Sciences | 58 | 1.8% |
| Engineering | 132 | 4.1% |
| Multidisciplinary Studies | 33 | 1.0% |
| Science & Technology | 434 | 13.3% |
| Business | 945 | 29.0% |
| Education | 550 | 16.9% |
| Literature & Languages | 37 | 1.1% |
| Liberal Arts & History | 217 | 6.7% |
| Visual & Performing Arts | 86 | 2.6% |
| Communications | 32 | 1.0% |
| Arts & Humanities | 216 | 6.6% |
| Total | 3,256 | 100.0% |
Transportation & Commute in Chester County
Vehicle Availability by Sex in Chester County
The most prevalent vehicle ownership categories in Chester County are males with 2 vehicles (2,317, accounting for 35.8%) and females with 2 vehicles (2,505, making up 33.4%).
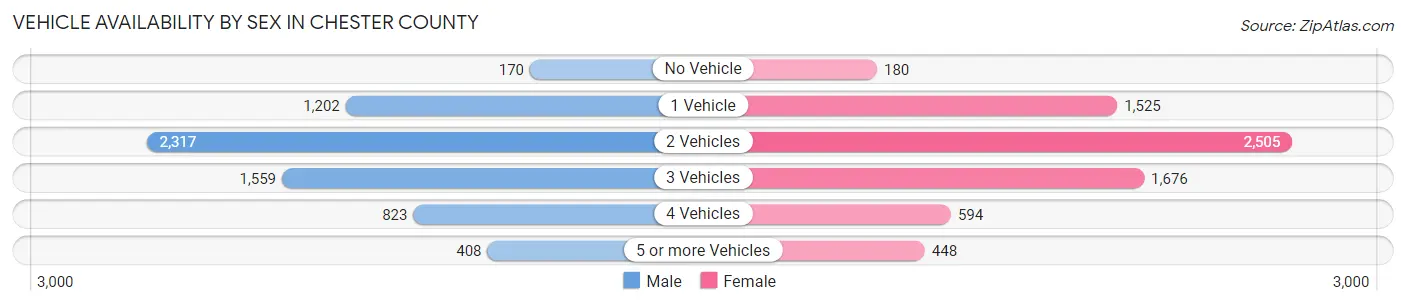
| Vehicles Available | Male | Female |
| No Vehicle | 170 (2.6%) | 180 (2.6%) |
| 1 Vehicle | 1,202 (18.5%) | 1,525 (22.0%) |
| 2 Vehicles | 2,317 (35.8%) | 2,505 (36.2%) |
| 3 Vehicles | 1,559 (24.1%) | 1,676 (24.2%) |
| 4 Vehicles | 823 (12.7%) | 594 (8.6%) |
| 5 or more Vehicles | 408 (6.3%) | 448 (6.5%) |
| Total | 6,479 (100.0%) | 6,928 (100.0%) |
Commute Time in Chester County
The most frequently occuring commute durations in Chester County are 30 to 34 minutes (1,972 commuters, 15.3%), 45 to 59 minutes (1,890 commuters, 14.7%), and 20 to 24 minutes (1,633 commuters, 12.7%).
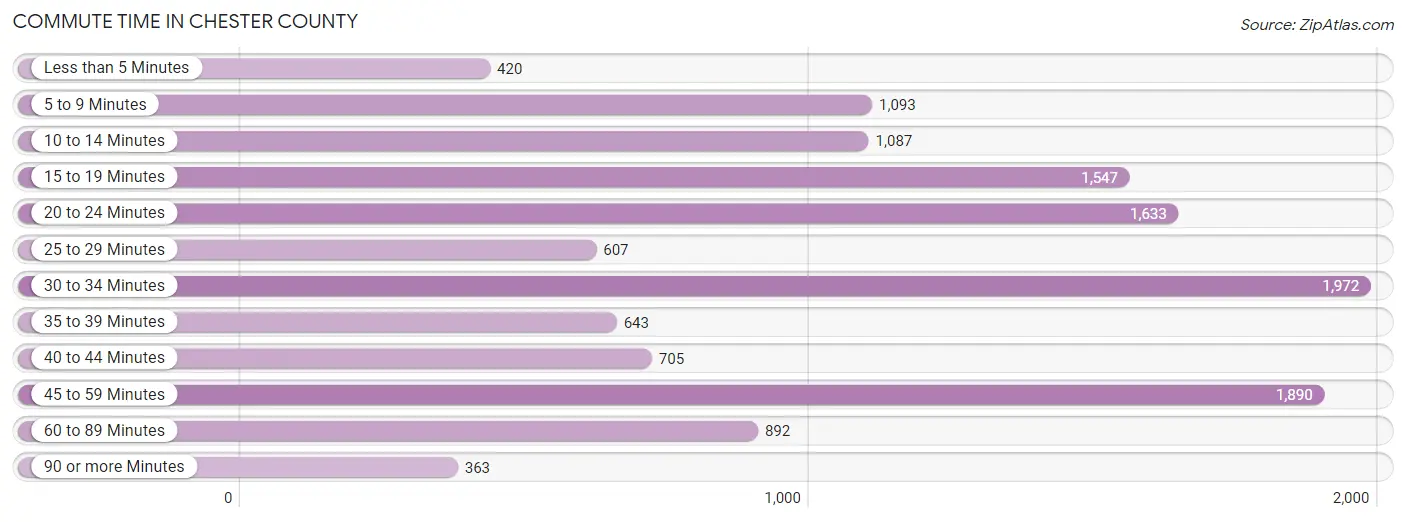
| Commute Time | # Commuters | % Commuters |
| Less than 5 Minutes | 420 | 3.3% |
| 5 to 9 Minutes | 1,093 | 8.5% |
| 10 to 14 Minutes | 1,087 | 8.5% |
| 15 to 19 Minutes | 1,547 | 12.0% |
| 20 to 24 Minutes | 1,633 | 12.7% |
| 25 to 29 Minutes | 607 | 4.7% |
| 30 to 34 Minutes | 1,972 | 15.3% |
| 35 to 39 Minutes | 643 | 5.0% |
| 40 to 44 Minutes | 705 | 5.5% |
| 45 to 59 Minutes | 1,890 | 14.7% |
| 60 to 89 Minutes | 892 | 6.9% |
| 90 or more Minutes | 363 | 2.8% |
Commute Time by Sex in Chester County
The most common commute times in Chester County are 45 to 59 minutes (1,156 commuters, 18.5%) for males and 30 to 34 minutes (1,169 commuters, 17.7%) for females.
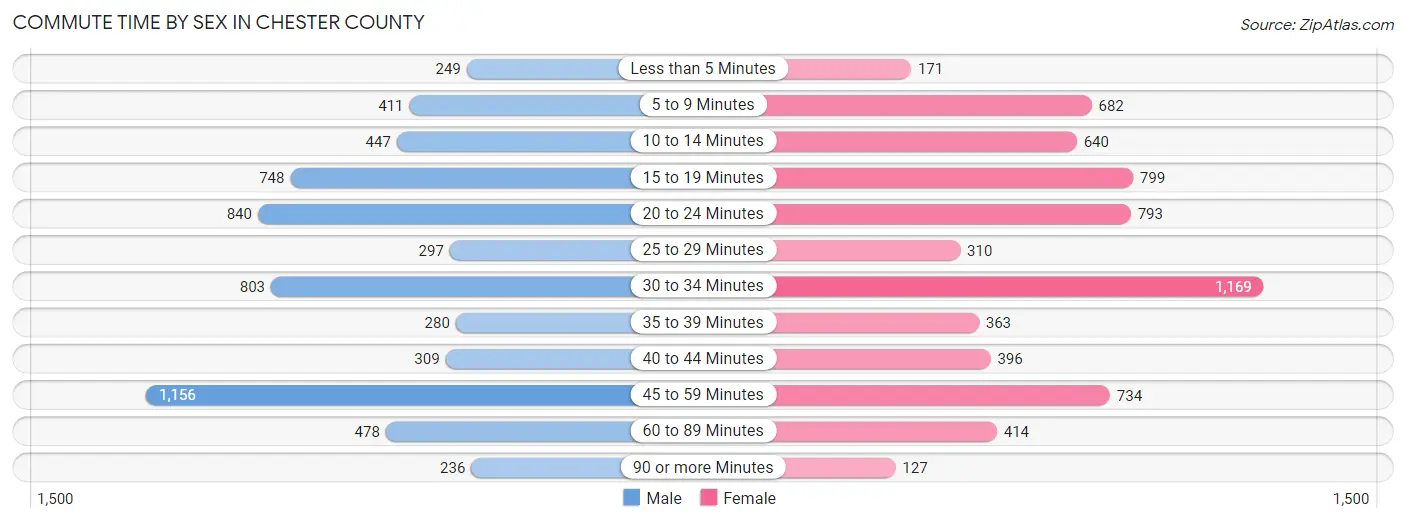
| Commute Time | Male | Female |
| Less than 5 Minutes | 249 (4.0%) | 171 (2.6%) |
| 5 to 9 Minutes | 411 (6.6%) | 682 (10.3%) |
| 10 to 14 Minutes | 447 (7.1%) | 640 (9.7%) |
| 15 to 19 Minutes | 748 (12.0%) | 799 (12.1%) |
| 20 to 24 Minutes | 840 (13.4%) | 793 (12.0%) |
| 25 to 29 Minutes | 297 (4.8%) | 310 (4.7%) |
| 30 to 34 Minutes | 803 (12.8%) | 1,169 (17.7%) |
| 35 to 39 Minutes | 280 (4.5%) | 363 (5.5%) |
| 40 to 44 Minutes | 309 (4.9%) | 396 (6.0%) |
| 45 to 59 Minutes | 1,156 (18.5%) | 734 (11.1%) |
| 60 to 89 Minutes | 478 (7.6%) | 414 (6.3%) |
| 90 or more Minutes | 236 (3.8%) | 127 (1.9%) |
Time of Departure to Work by Sex in Chester County
The most frequent times of departure to work in Chester County are 7:00 AM to 7:29 AM (1,046, 16.7%) for males and 7:00 AM to 7:29 AM (1,466, 22.2%) for females.
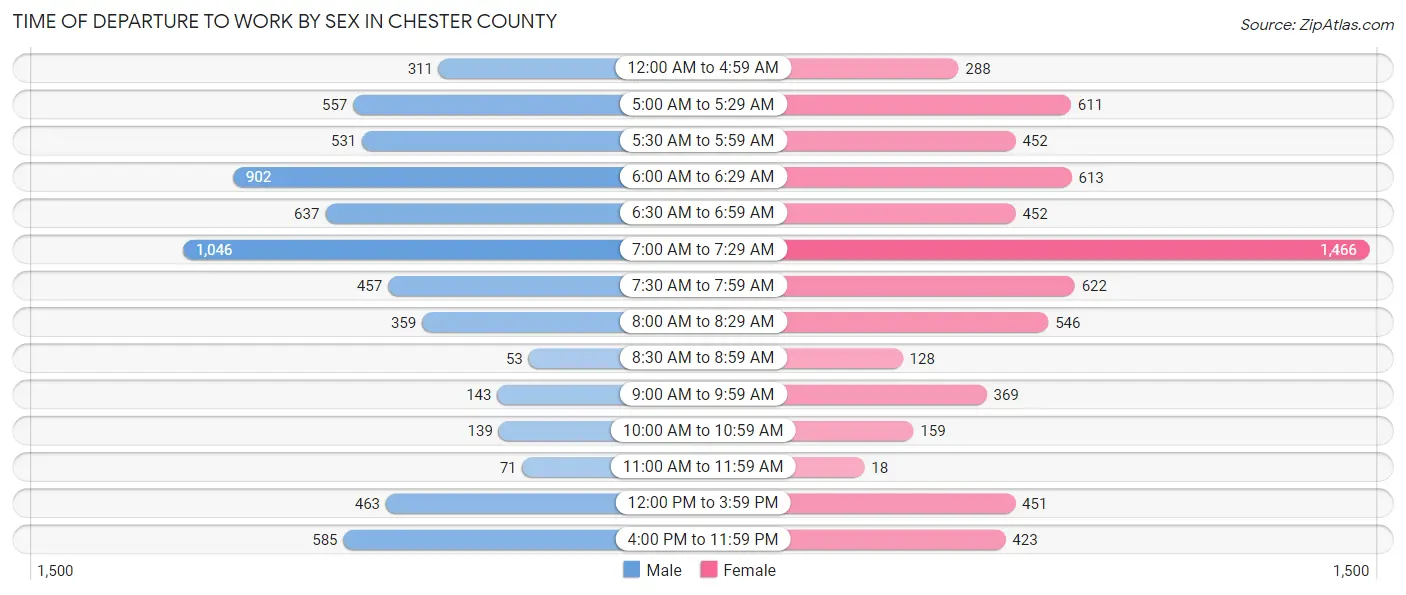
| Time of Departure | Male | Female |
| 12:00 AM to 4:59 AM | 311 (5.0%) | 288 (4.4%) |
| 5:00 AM to 5:29 AM | 557 (8.9%) | 611 (9.3%) |
| 5:30 AM to 5:59 AM | 531 (8.5%) | 452 (6.9%) |
| 6:00 AM to 6:29 AM | 902 (14.4%) | 613 (9.3%) |
| 6:30 AM to 6:59 AM | 637 (10.2%) | 452 (6.9%) |
| 7:00 AM to 7:29 AM | 1,046 (16.7%) | 1,466 (22.2%) |
| 7:30 AM to 7:59 AM | 457 (7.3%) | 622 (9.4%) |
| 8:00 AM to 8:29 AM | 359 (5.7%) | 546 (8.3%) |
| 8:30 AM to 8:59 AM | 53 (0.9%) | 128 (1.9%) |
| 9:00 AM to 9:59 AM | 143 (2.3%) | 369 (5.6%) |
| 10:00 AM to 10:59 AM | 139 (2.2%) | 159 (2.4%) |
| 11:00 AM to 11:59 AM | 71 (1.1%) | 18 (0.3%) |
| 12:00 PM to 3:59 PM | 463 (7.4%) | 451 (6.8%) |
| 4:00 PM to 11:59 PM | 585 (9.3%) | 423 (6.4%) |
| Total | 6,254 (100.0%) | 6,598 (100.0%) |
Housing Occupancy in Chester County
Occupancy by Ownership in Chester County
Of the total 12,890 dwellings in Chester County, owner-occupied units account for 9,972 (77.4%), while renter-occupied units make up 2,918 (22.6%).
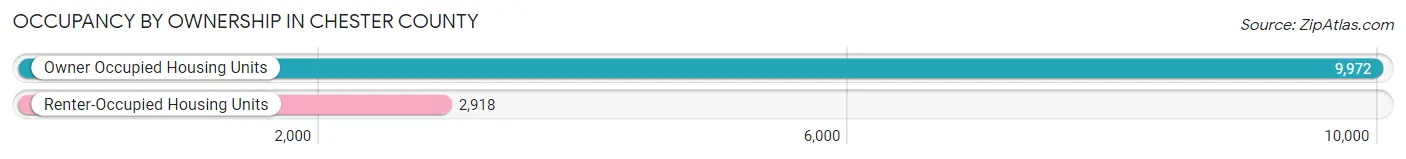
| Occupancy | # Housing Units | % Housing Units |
| Owner Occupied Housing Units | 9,972 | 77.4% |
| Renter-Occupied Housing Units | 2,918 | 22.6% |
| Total Occupied Housing Units | 12,890 | 100.0% |
Occupancy by Household Size in Chester County
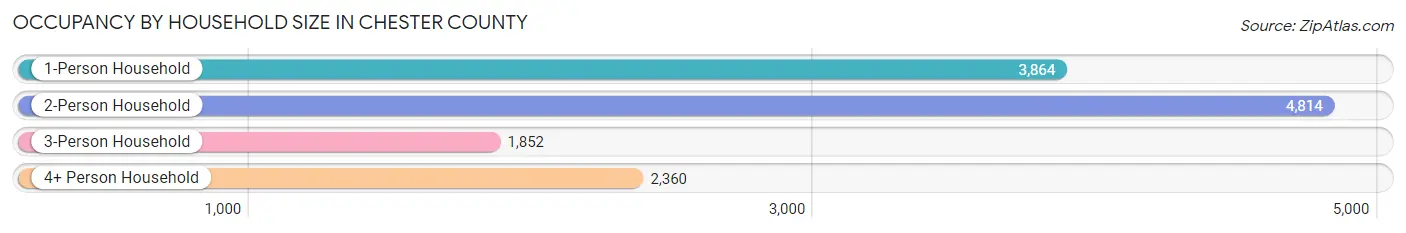
| Household Size | # Housing Units | % Housing Units |
| 1-Person Household | 3,864 | 30.0% |
| 2-Person Household | 4,814 | 37.3% |
| 3-Person Household | 1,852 | 14.4% |
| 4+ Person Household | 2,360 | 18.3% |
| Total Housing Units | 12,890 | 100.0% |
Occupancy by Ownership by Household Size in Chester County
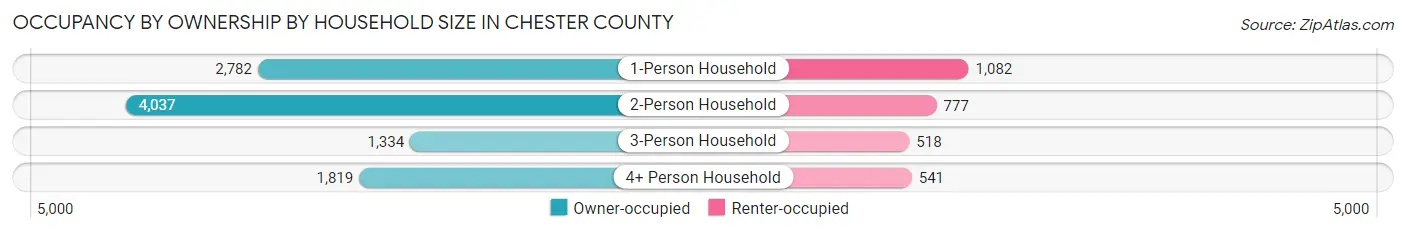
| Household Size | Owner-occupied | Renter-occupied |
| 1-Person Household | 2,782 (72.0%) | 1,082 (28.0%) |
| 2-Person Household | 4,037 (83.9%) | 777 (16.1%) |
| 3-Person Household | 1,334 (72.0%) | 518 (28.0%) |
| 4+ Person Household | 1,819 (77.1%) | 541 (22.9%) |
| Total Housing Units | 9,972 (77.4%) | 2,918 (22.6%) |
Occupancy by Educational Attainment in Chester County
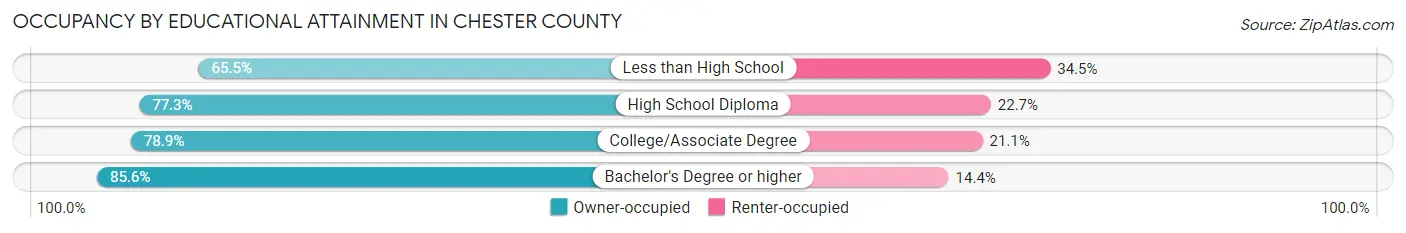
| Household Size | Owner-occupied | Renter-occupied |
| Less than High School | 1,199 (65.5%) | 632 (34.5%) |
| High School Diploma | 3,836 (77.3%) | 1,129 (22.7%) |
| College/Associate Degree | 3,298 (78.9%) | 882 (21.1%) |
| Bachelor's Degree or higher | 1,639 (85.6%) | 275 (14.4%) |
Occupancy by Age of Householder in Chester County
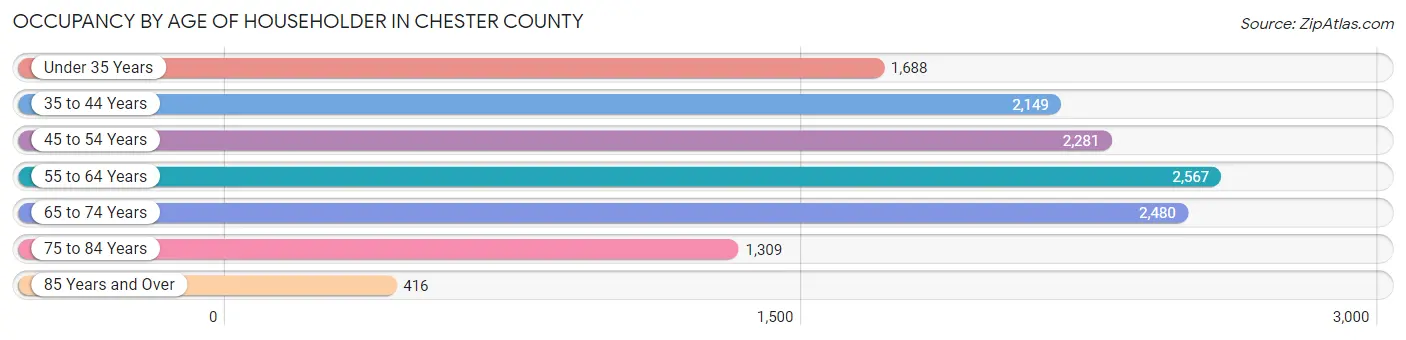
| Age Bracket | # Households | % Households |
| Under 35 Years | 1,688 | 13.1% |
| 35 to 44 Years | 2,149 | 16.7% |
| 45 to 54 Years | 2,281 | 17.7% |
| 55 to 64 Years | 2,567 | 19.9% |
| 65 to 74 Years | 2,480 | 19.2% |
| 75 to 84 Years | 1,309 | 10.2% |
| 85 Years and Over | 416 | 3.2% |
| Total | 12,890 | 100.0% |
Housing Finances in Chester County
Median Income by Occupancy in Chester County
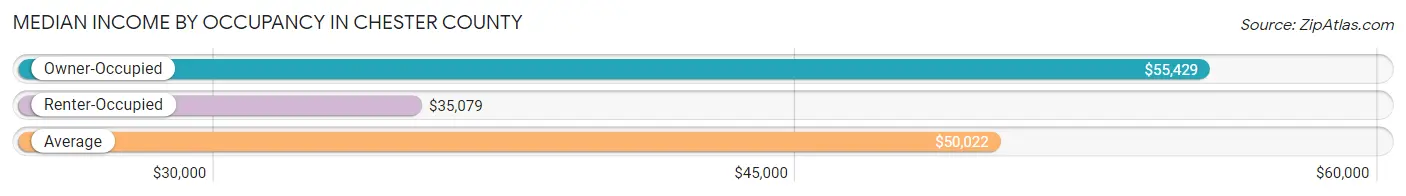
| Occupancy Type | # Households | Median Income |
| Owner-Occupied | 9,972 (77.4%) | $55,429 |
| Renter-Occupied | 2,918 (22.6%) | $35,079 |
| Average | 12,890 (100.0%) | $50,022 |
Occupancy by Householder Income Bracket in Chester County
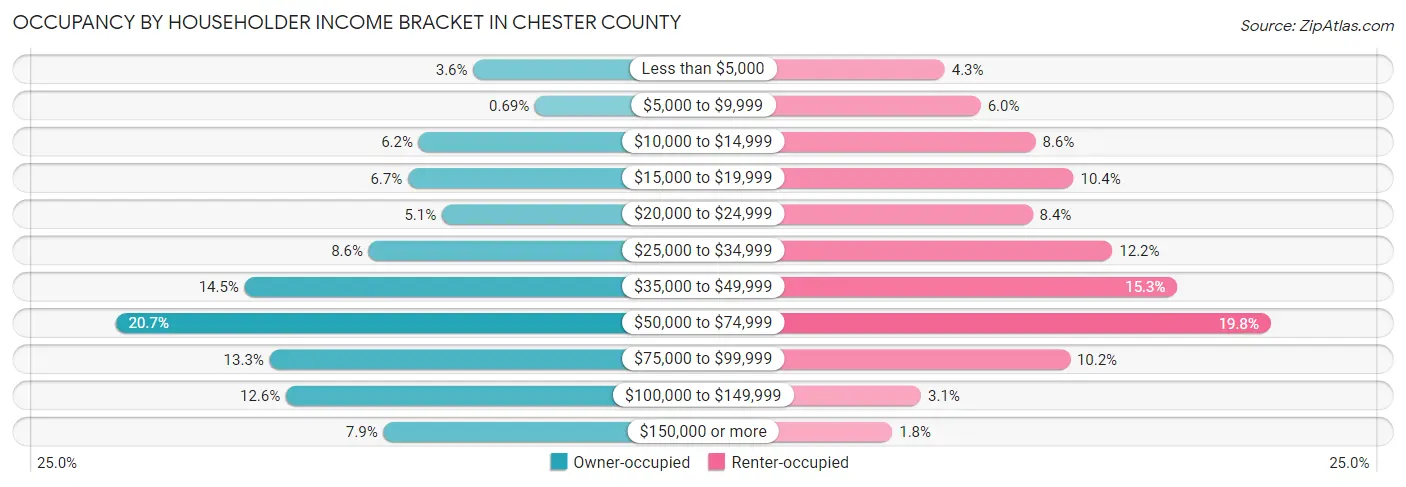
| Income Bracket | Owner-occupied | Renter-occupied |
| Less than $5,000 | 362 (3.6%) | 124 (4.3%) |
| $5,000 to $9,999 | 69 (0.7%) | 174 (6.0%) |
| $10,000 to $14,999 | 621 (6.2%) | 250 (8.6%) |
| $15,000 to $19,999 | 672 (6.7%) | 303 (10.4%) |
| $20,000 to $24,999 | 511 (5.1%) | 246 (8.4%) |
| $25,000 to $34,999 | 859 (8.6%) | 357 (12.2%) |
| $35,000 to $49,999 | 1,448 (14.5%) | 447 (15.3%) |
| $50,000 to $74,999 | 2,061 (20.7%) | 577 (19.8%) |
| $75,000 to $99,999 | 1,329 (13.3%) | 298 (10.2%) |
| $100,000 to $149,999 | 1,251 (12.6%) | 91 (3.1%) |
| $150,000 or more | 789 (7.9%) | 51 (1.8%) |
| Total | 9,972 (100.0%) | 2,918 (100.0%) |
Monthly Housing Cost Tiers in Chester County
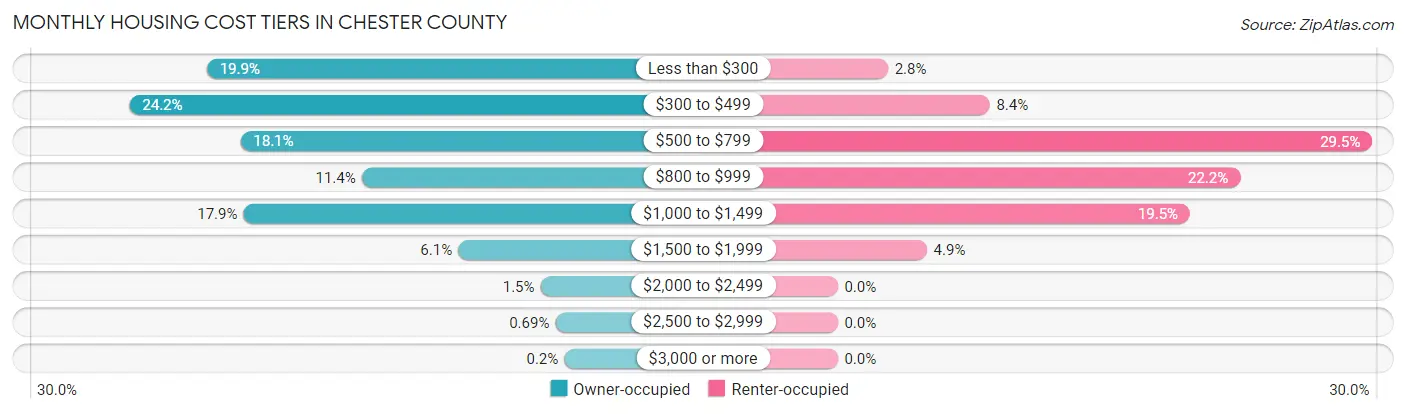
| Monthly Cost | Owner-occupied | Renter-occupied |
| Less than $300 | 1,988 (19.9%) | 81 (2.8%) |
| $300 to $499 | 2,414 (24.2%) | 245 (8.4%) |
| $500 to $799 | 1,803 (18.1%) | 862 (29.5%) |
| $800 to $999 | 1,136 (11.4%) | 649 (22.2%) |
| $1,000 to $1,499 | 1,787 (17.9%) | 568 (19.5%) |
| $1,500 to $1,999 | 604 (6.1%) | 144 (4.9%) |
| $2,000 to $2,499 | 151 (1.5%) | 0 (0.0%) |
| $2,500 to $2,999 | 69 (0.7%) | 0 (0.0%) |
| $3,000 or more | 20 (0.2%) | 0 (0.0%) |
| Total | 9,972 (100.0%) | 2,918 (100.0%) |
Physical Housing Characteristics in Chester County
Housing Structures in Chester County
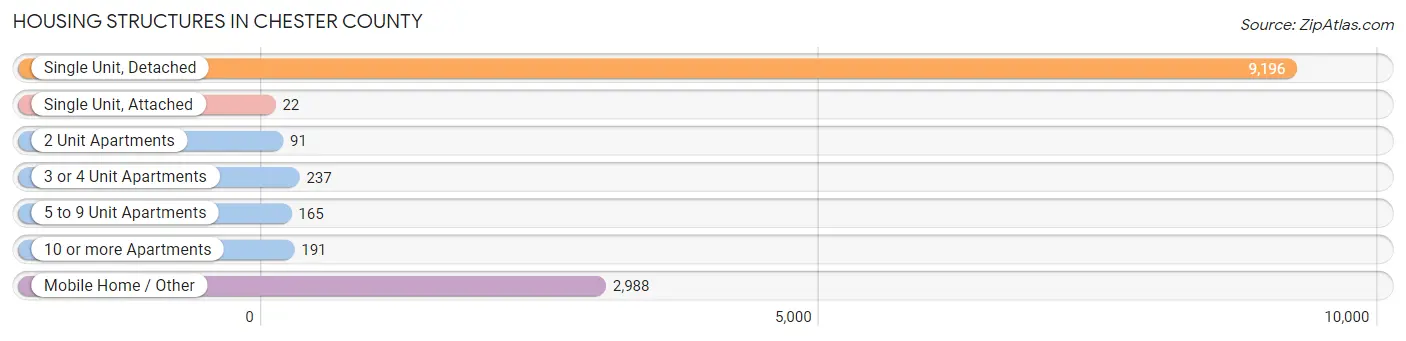
| Structure Type | # Housing Units | % Housing Units |
| Single Unit, Detached | 9,196 | 71.3% |
| Single Unit, Attached | 22 | 0.2% |
| 2 Unit Apartments | 91 | 0.7% |
| 3 or 4 Unit Apartments | 237 | 1.8% |
| 5 to 9 Unit Apartments | 165 | 1.3% |
| 10 or more Apartments | 191 | 1.5% |
| Mobile Home / Other | 2,988 | 23.2% |
| Total | 12,890 | 100.0% |
Housing Structures by Occupancy in Chester County
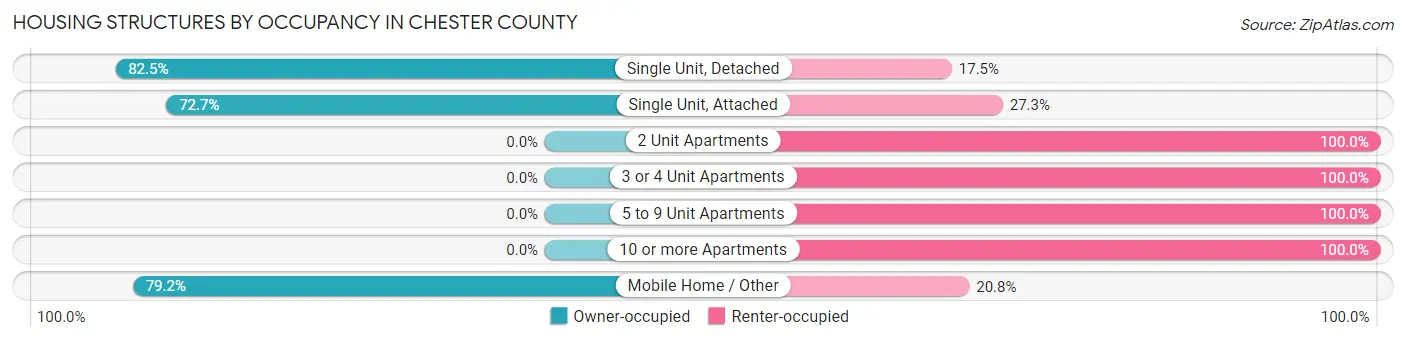
| Structure Type | Owner-occupied | Renter-occupied |
| Single Unit, Detached | 7,590 (82.5%) | 1,606 (17.5%) |
| Single Unit, Attached | 16 (72.7%) | 6 (27.3%) |
| 2 Unit Apartments | 0 (0.0%) | 91 (100.0%) |
| 3 or 4 Unit Apartments | 0 (0.0%) | 237 (100.0%) |
| 5 to 9 Unit Apartments | 0 (0.0%) | 165 (100.0%) |
| 10 or more Apartments | 0 (0.0%) | 191 (100.0%) |
| Mobile Home / Other | 2,366 (79.2%) | 622 (20.8%) |
| Total | 9,972 (77.4%) | 2,918 (22.6%) |
Housing Structures by Number of Rooms in Chester County
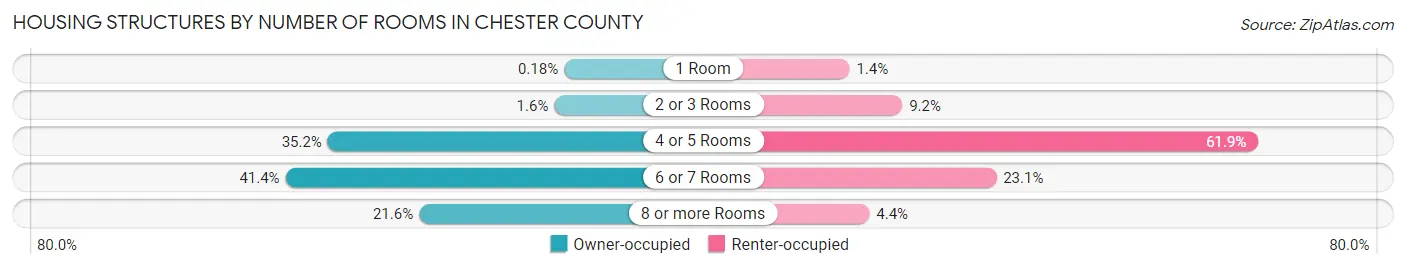
| Number of Rooms | Owner-occupied | Renter-occupied |
| 1 Room | 18 (0.2%) | 41 (1.4%) |
| 2 or 3 Rooms | 163 (1.6%) | 269 (9.2%) |
| 4 or 5 Rooms | 3,505 (35.1%) | 1,806 (61.9%) |
| 6 or 7 Rooms | 4,128 (41.4%) | 675 (23.1%) |
| 8 or more Rooms | 2,158 (21.6%) | 127 (4.3%) |
| Total | 9,972 (100.0%) | 2,918 (100.0%) |
Housing Structure by Heating Type in Chester County
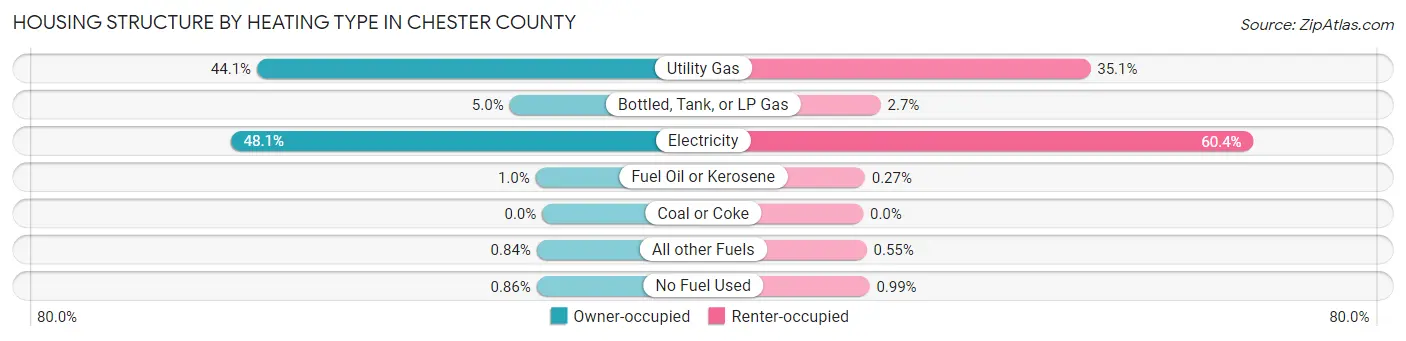
| Heating Type | Owner-occupied | Renter-occupied |
| Utility Gas | 4,397 (44.1%) | 1,025 (35.1%) |
| Bottled, Tank, or LP Gas | 503 (5.0%) | 79 (2.7%) |
| Electricity | 4,801 (48.1%) | 1,761 (60.4%) |
| Fuel Oil or Kerosene | 101 (1.0%) | 8 (0.3%) |
| Coal or Coke | 0 (0.0%) | 0 (0.0%) |
| All other Fuels | 84 (0.8%) | 16 (0.5%) |
| No Fuel Used | 86 (0.9%) | 29 (1.0%) |
| Total | 9,972 (100.0%) | 2,918 (100.0%) |
Household Vehicle Usage in Chester County
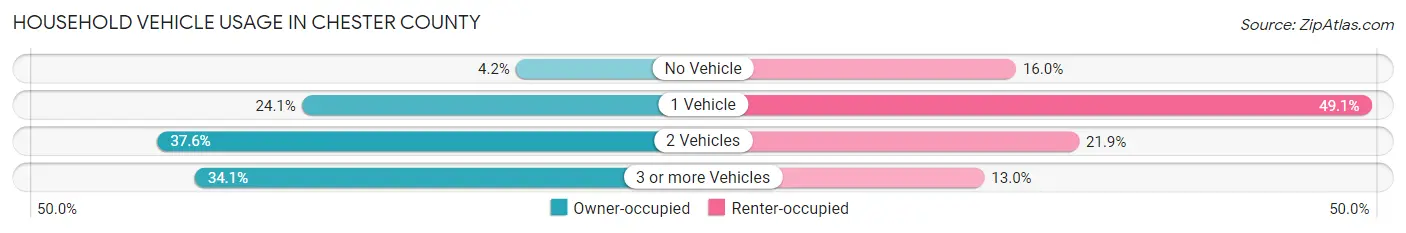
| Vehicles per Household | Owner-occupied | Renter-occupied |
| No Vehicle | 415 (4.2%) | 466 (16.0%) |
| 1 Vehicle | 2,407 (24.1%) | 1,434 (49.1%) |
| 2 Vehicles | 3,749 (37.6%) | 638 (21.9%) |
| 3 or more Vehicles | 3,401 (34.1%) | 380 (13.0%) |
| Total | 9,972 (100.0%) | 2,918 (100.0%) |
Real Estate & Mortgages in Chester County
Real Estate and Mortgage Overview in Chester County
| Characteristic | Without Mortgage | With Mortgage |
| Housing Units | 5,453 | 4,519 |
| Median Property Value | $103,200 | $158,500 |
| Median Household Income | $43,490 | $597 |
| Monthly Housing Costs | $347 | $20 |
| Real Estate Taxes | $621 | $145 |
Property Value by Mortgage Status in Chester County
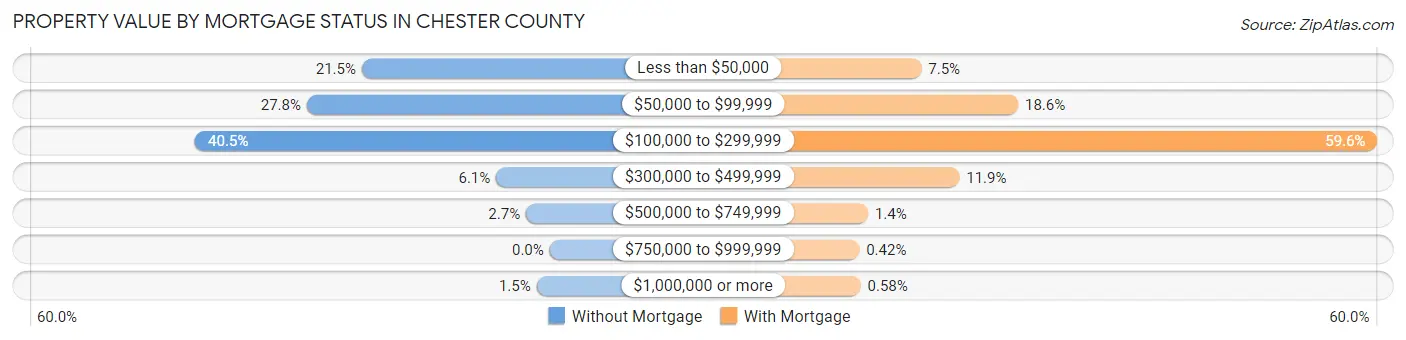
| Property Value | Without Mortgage | With Mortgage |
| Less than $50,000 | 1,170 (21.5%) | 340 (7.5%) |
| $50,000 to $99,999 | 1,513 (27.8%) | 839 (18.6%) |
| $100,000 to $299,999 | 2,209 (40.5%) | 2,695 (59.6%) |
| $300,000 to $499,999 | 333 (6.1%) | 536 (11.9%) |
| $500,000 to $749,999 | 147 (2.7%) | 64 (1.4%) |
| $750,000 to $999,999 | 0 (0.0%) | 19 (0.4%) |
| $1,000,000 or more | 81 (1.5%) | 26 (0.6%) |
| Total | 5,453 (100.0%) | 4,519 (100.0%) |
Household Income by Mortgage Status in Chester County
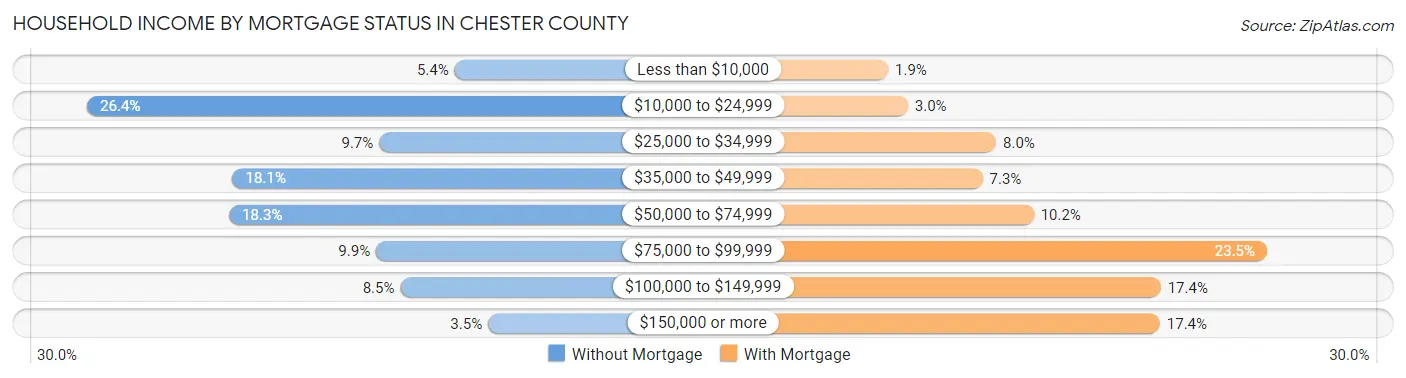
| Household Income | Without Mortgage | With Mortgage |
| Less than $10,000 | 296 (5.4%) | 84 (1.9%) |
| $10,000 to $24,999 | 1,441 (26.4%) | 135 (3.0%) |
| $25,000 to $34,999 | 531 (9.7%) | 363 (8.0%) |
| $35,000 to $49,999 | 988 (18.1%) | 328 (7.3%) |
| $50,000 to $74,999 | 999 (18.3%) | 460 (10.2%) |
| $75,000 to $99,999 | 541 (9.9%) | 1,062 (23.5%) |
| $100,000 to $149,999 | 465 (8.5%) | 788 (17.4%) |
| $150,000 or more | 192 (3.5%) | 786 (17.4%) |
| Total | 5,453 (100.0%) | 4,519 (100.0%) |
Property Value to Household Income Ratio in Chester County
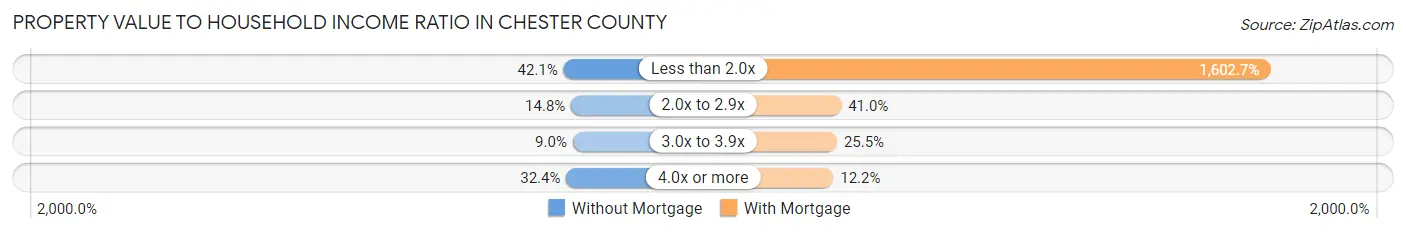
| Value-to-Income Ratio | Without Mortgage | With Mortgage |
| Less than 2.0x | 2,296 (42.1%) | 72,426 (1,602.7%) |
| 2.0x to 2.9x | 808 (14.8%) | 1,853 (41.0%) |
| 3.0x to 3.9x | 493 (9.0%) | 1,154 (25.5%) |
| 4.0x or more | 1,765 (32.4%) | 553 (12.2%) |
| Total | 5,453 (100.0%) | 4,519 (100.0%) |
Real Estate Taxes by Mortgage Status in Chester County
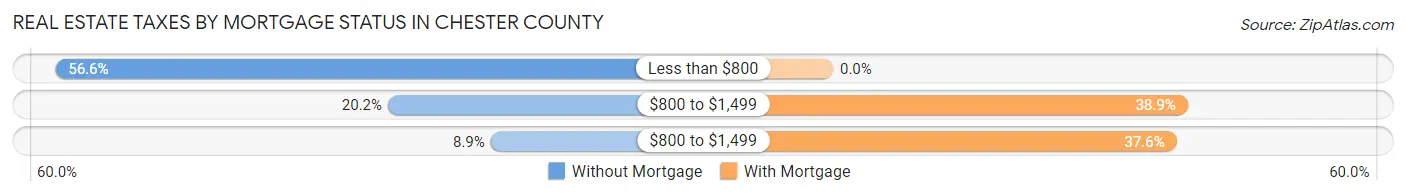
| Property Taxes | Without Mortgage | With Mortgage |
| Less than $800 | 3,088 (56.6%) | 0 (0.0%) |
| $800 to $1,499 | 1,101 (20.2%) | 1,756 (38.9%) |
| $800 to $1,499 | 487 (8.9%) | 1,701 (37.6%) |
| Total | 5,453 (100.0%) | 4,519 (100.0%) |
Health & Disability in Chester County
Health Insurance Coverage by Age in Chester County
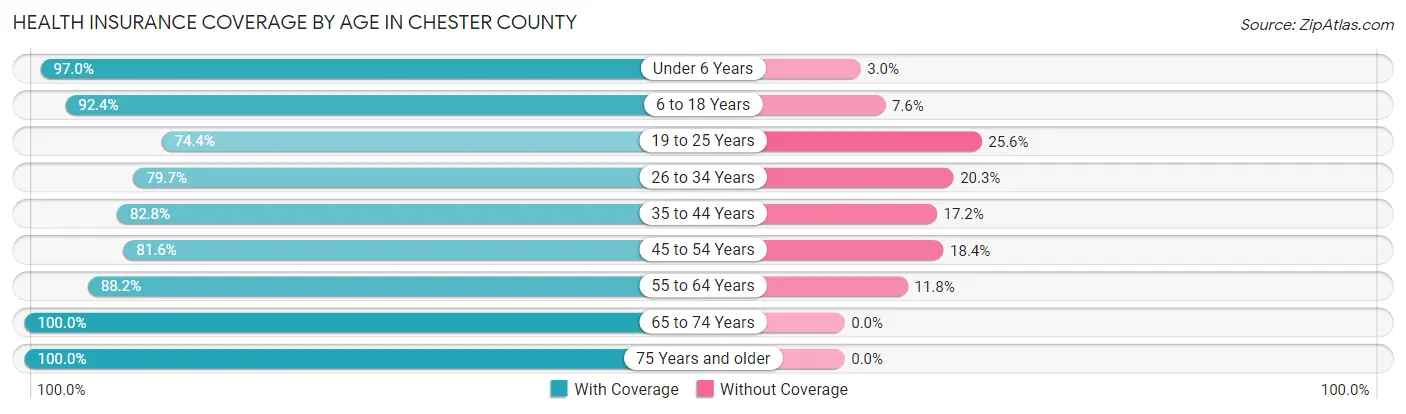
| Age Bracket | With Coverage | Without Coverage |
| Under 6 Years | 2,217 (97.0%) | 68 (3.0%) |
| 6 to 18 Years | 4,835 (92.4%) | 397 (7.6%) |
| 19 to 25 Years | 1,905 (74.4%) | 654 (25.6%) |
| 26 to 34 Years | 2,739 (79.7%) | 698 (20.3%) |
| 35 to 44 Years | 3,038 (82.8%) | 631 (17.2%) |
| 45 to 54 Years | 3,434 (81.6%) | 776 (18.4%) |
| 55 to 64 Years | 4,091 (88.2%) | 547 (11.8%) |
| 65 to 74 Years | 3,616 (100.0%) | 0 (0.0%) |
| 75 Years and older | 2,311 (100.0%) | 0 (0.0%) |
| Total | 28,186 (88.2%) | 3,771 (11.8%) |
Health Insurance Coverage by Citizenship Status in Chester County
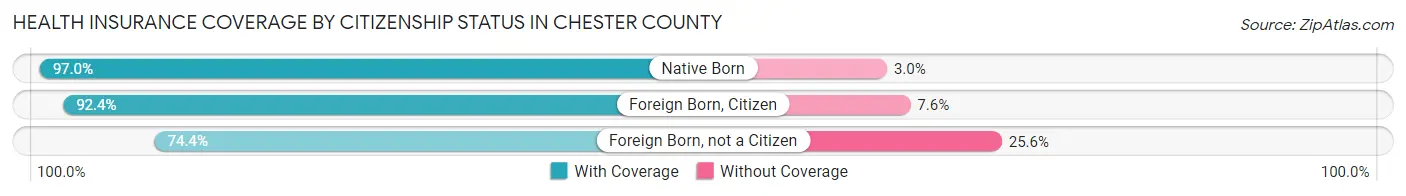
| Citizenship Status | With Coverage | Without Coverage |
| Native Born | 2,217 (97.0%) | 68 (3.0%) |
| Foreign Born, Citizen | 4,835 (92.4%) | 397 (7.6%) |
| Foreign Born, not a Citizen | 1,905 (74.4%) | 654 (25.6%) |
Health Insurance Coverage by Household Income in Chester County
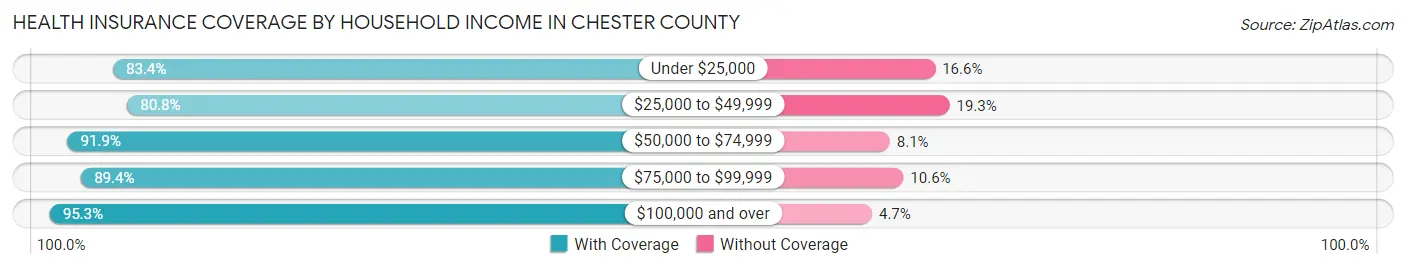
| Household Income | With Coverage | Without Coverage |
| Under $25,000 | 4,754 (83.4%) | 944 (16.6%) |
| $25,000 to $49,999 | 5,781 (80.7%) | 1,378 (19.3%) |
| $50,000 to $74,999 | 7,057 (91.9%) | 619 (8.1%) |
| $75,000 to $99,999 | 4,439 (89.4%) | 527 (10.6%) |
| $100,000 and over | 6,108 (95.3%) | 303 (4.7%) |
Public vs Private Health Insurance Coverage by Age in Chester County
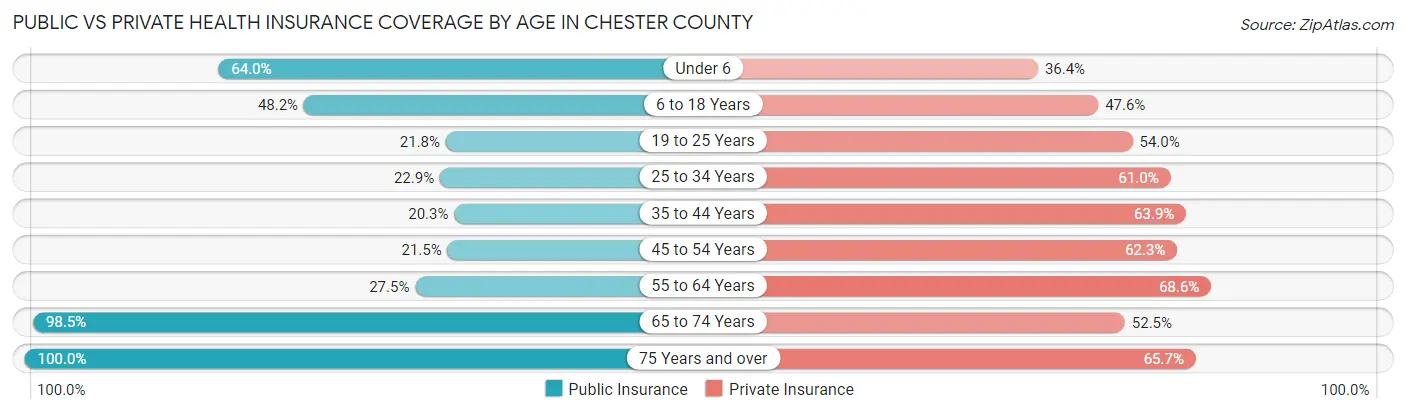
| Age Bracket | Public Insurance | Private Insurance |
| Under 6 | 1,463 (64.0%) | 832 (36.4%) |
| 6 to 18 Years | 2,519 (48.1%) | 2,490 (47.6%) |
| 19 to 25 Years | 558 (21.8%) | 1,381 (54.0%) |
| 25 to 34 Years | 787 (22.9%) | 2,097 (61.0%) |
| 35 to 44 Years | 743 (20.3%) | 2,345 (63.9%) |
| 45 to 54 Years | 905 (21.5%) | 2,621 (62.3%) |
| 55 to 64 Years | 1,275 (27.5%) | 3,180 (68.6%) |
| 65 to 74 Years | 3,560 (98.5%) | 1,900 (52.5%) |
| 75 Years and over | 2,311 (100.0%) | 1,518 (65.7%) |
| Total | 14,121 (44.2%) | 18,364 (57.5%) |
Disability Status by Sex by Age in Chester County
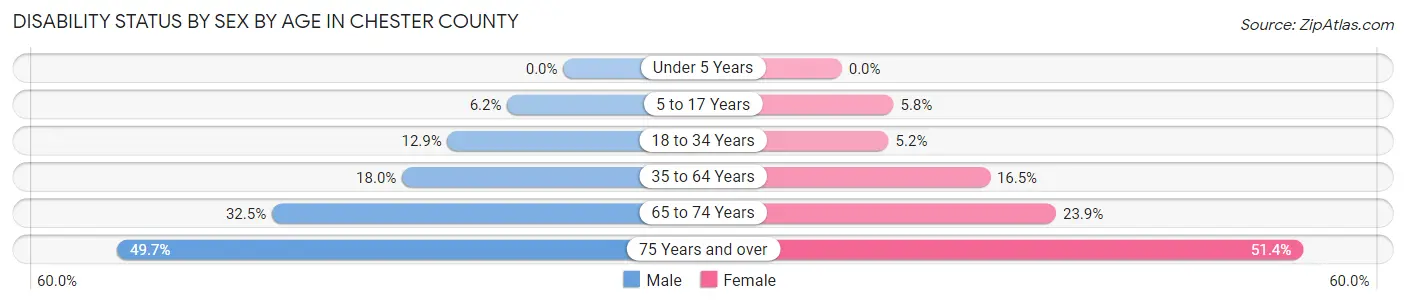
| Age Bracket | Male | Female |
| Under 5 Years | 0 (0.0%) | 0 (0.0%) |
| 5 to 17 Years | 187 (6.2%) | 140 (5.8%) |
| 18 to 34 Years | 390 (12.9%) | 172 (5.2%) |
| 35 to 64 Years | 1,083 (17.9%) | 1,070 (16.5%) |
| 65 to 74 Years | 552 (32.5%) | 457 (23.9%) |
| 75 Years and over | 478 (49.7%) | 693 (51.4%) |
Disability Class by Sex by Age in Chester County
Disability Class: Hearing Difficulty
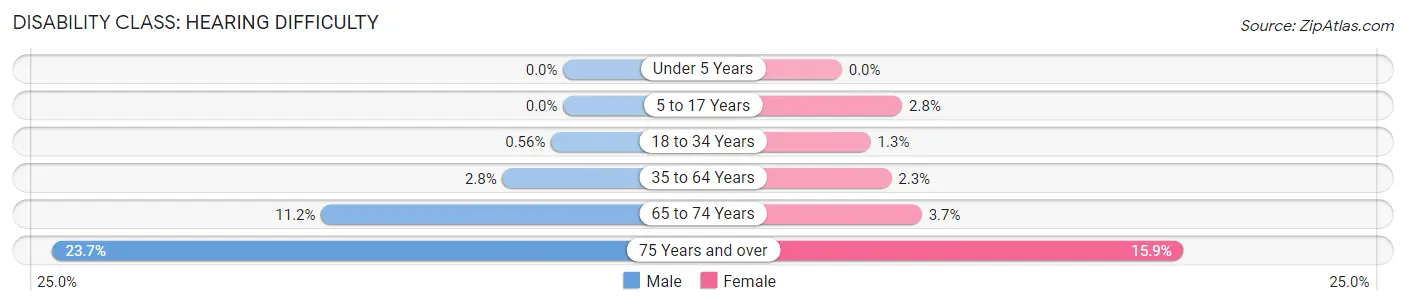
| Age Bracket | Male | Female |
| Under 5 Years | 0 (0.0%) | 0 (0.0%) |
| 5 to 17 Years | 0 (0.0%) | 68 (2.8%) |
| 18 to 34 Years | 17 (0.6%) | 44 (1.3%) |
| 35 to 64 Years | 170 (2.8%) | 149 (2.3%) |
| 65 to 74 Years | 191 (11.2%) | 71 (3.7%) |
| 75 Years and over | 228 (23.7%) | 214 (15.9%) |
Disability Class: Vision Difficulty
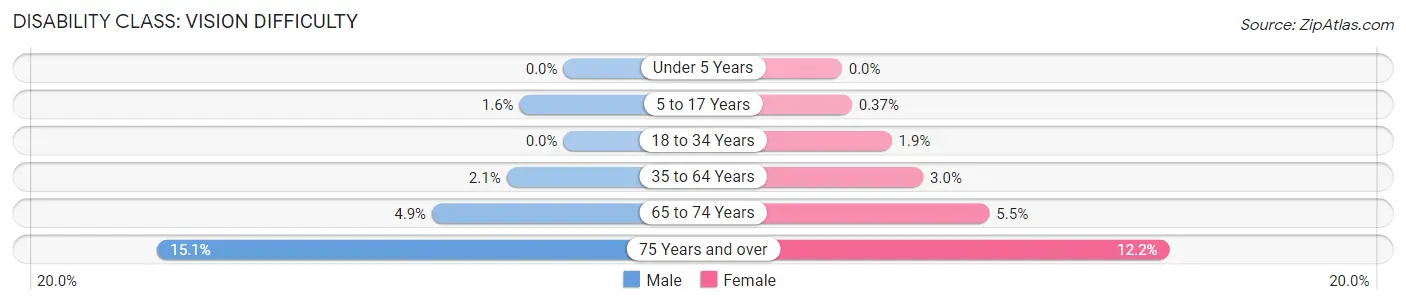
| Age Bracket | Male | Female |
| Under 5 Years | 0 (0.0%) | 0 (0.0%) |
| 5 to 17 Years | 49 (1.6%) | 9 (0.4%) |
| 18 to 34 Years | 0 (0.0%) | 61 (1.8%) |
| 35 to 64 Years | 127 (2.1%) | 196 (3.0%) |
| 65 to 74 Years | 83 (4.9%) | 105 (5.5%) |
| 75 Years and over | 145 (15.1%) | 164 (12.2%) |
Disability Class: Cognitive Difficulty
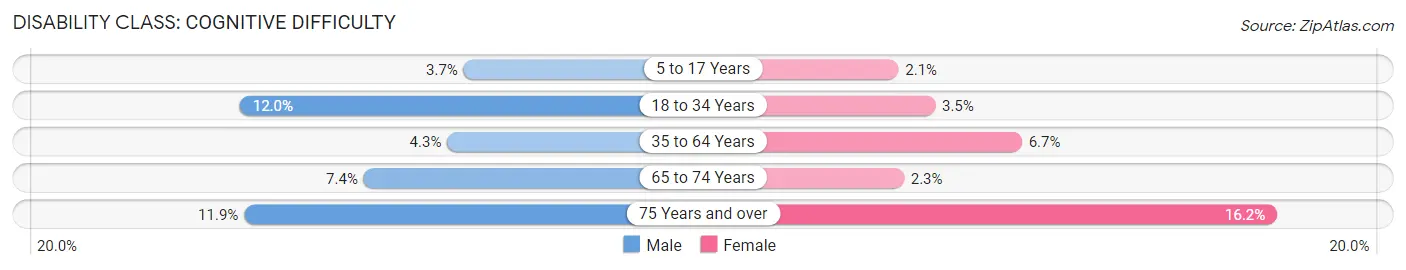
| Age Bracket | Male | Female |
| 5 to 17 Years | 111 (3.7%) | 51 (2.1%) |
| 18 to 34 Years | 363 (12.0%) | 114 (3.5%) |
| 35 to 64 Years | 260 (4.3%) | 433 (6.7%) |
| 65 to 74 Years | 126 (7.4%) | 44 (2.3%) |
| 75 Years and over | 114 (11.8%) | 218 (16.2%) |
Disability Class: Ambulatory Difficulty
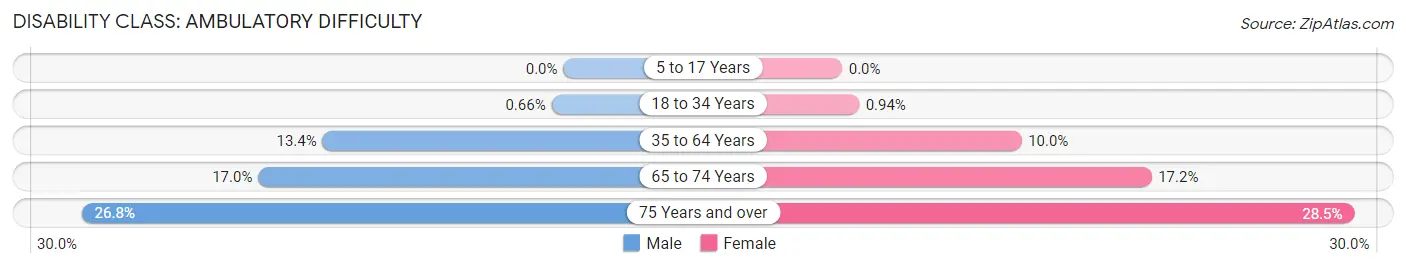
| Age Bracket | Male | Female |
| 5 to 17 Years | 0 (0.0%) | 0 (0.0%) |
| 18 to 34 Years | 20 (0.7%) | 31 (0.9%) |
| 35 to 64 Years | 809 (13.4%) | 648 (10.0%) |
| 65 to 74 Years | 289 (17.0%) | 330 (17.2%) |
| 75 Years and over | 258 (26.8%) | 385 (28.5%) |
Disability Class: Self-Care Difficulty
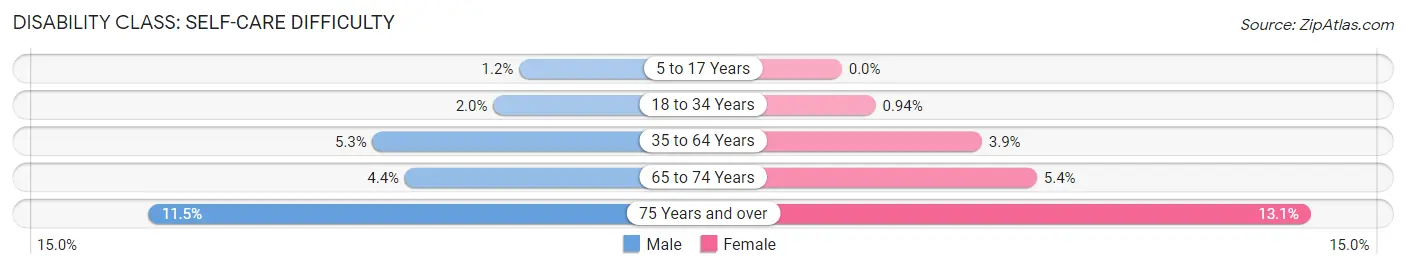
| Age Bracket | Male | Female |
| 5 to 17 Years | 37 (1.2%) | 0 (0.0%) |
| 18 to 34 Years | 59 (1.9%) | 31 (0.9%) |
| 35 to 64 Years | 320 (5.3%) | 253 (3.9%) |
| 65 to 74 Years | 75 (4.4%) | 104 (5.4%) |
| 75 Years and over | 111 (11.5%) | 176 (13.1%) |
Technology Access in Chester County
Computing Device Access in Chester County
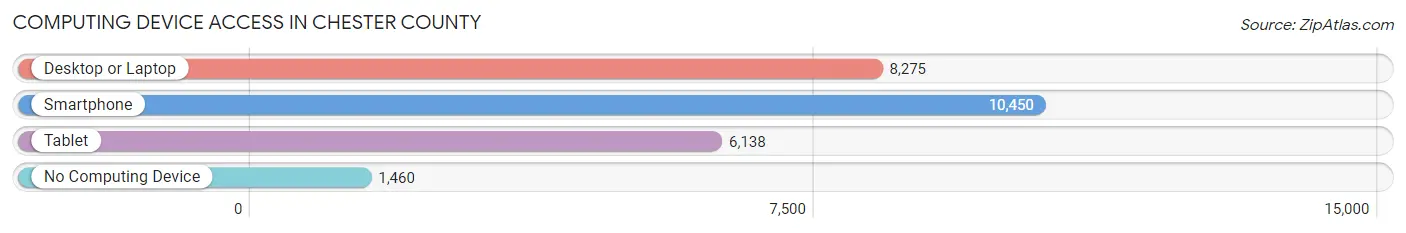
| Device Type | # Households | % Households |
| Desktop or Laptop | 8,275 | 64.2% |
| Smartphone | 10,450 | 81.1% |
| Tablet | 6,138 | 47.6% |
| No Computing Device | 1,460 | 11.3% |
| Total | 12,890 | 100.0% |
Internet Access in Chester County

| Internet Type | # Households | % Households |
| Dial-Up Internet | 37 | 0.3% |
| Broadband Home | 6,796 | 52.7% |
| Cellular Data Only | 2,531 | 19.6% |
| Satellite Internet | 989 | 7.7% |
| No Internet | 2,988 | 23.2% |
| Total | 12,890 | 100.0% |
Chester County Summary
Chester County, South Carolina is located in the northwestern corner of the state, and is bordered by North Carolina to the north, York County to the east, Lancaster County to the south, and Union County to the west. The county seat is Chester, and the county is home to a population of 33,140 people, according to the 2010 census.
History
Chester County was formed in 1785 from parts of Lancaster and York counties. It was named for the English county of the same name, and was the first county in South Carolina to be named for a place outside of the state. The county was originally part of the Catawba Nation, and was home to many Native American tribes, including the Catawba, Cherokee, and Waxhaw.
The county was home to many Revolutionary War battles, including the Battle of Huck’s Defeat, which was fought in 1780. The county was also home to the Battle of Fishdam Ford, which was fought in 1780.
The county was home to many prominent figures in South Carolina history, including John C. Calhoun, who served as a U.S. Senator and Vice President of the United States. The county was also home to the first African-American college in the state, Biddle University, which was founded in 1867.
Geography
Chester County is located in the northwestern corner of South Carolina, and is bordered by North Carolina to the north, York County to the east, Lancaster County to the south, and Union County to the west. The county is located in the Piedmont region of the state, and is home to rolling hills and valleys. The Catawba River runs through the county, and is a major source of water for the area.
The county is home to several state parks, including Landsford Canal State Park, which is home to the longest stretch of canal in the state. The county is also home to the Andrew Jackson State Park, which is home to a replica of the President’s home.
Economy
Chester County’s economy is largely based on agriculture, with the county being home to many farms and agricultural businesses. The county is also home to several manufacturing companies, including textile and furniture manufacturers. The county is also home to several retail businesses, including a number of antique stores.
The county is home to several major employers, including Springs Industries, which is the largest employer in the county. The county is also home to several smaller employers, including a number of small businesses and restaurants.
Demographics
According to the 2010 census, Chester County is home to a population of 33,140 people. The population is made up of a variety of ethnic and racial backgrounds, with the largest group being white (77.3%), followed by African American (17.7%), Hispanic (2.2%), and Asian (1.3%).
The median household income in the county is $41,945, and the median home value is $133,400. The county has a poverty rate of 17.3%, and the unemployment rate is 6.2%.
Conclusion
Chester County, South Carolina is located in the northwestern corner of the state, and is bordered by North Carolina to the north, York County to the east, Lancaster County to the south, and Union County to the west. The county was formed in 1785, and is home to a population of 33,140 people, according to the 2010 census. The county’s economy is largely based on agriculture, with the county being home to many farms and agricultural businesses. The county is also home to several manufacturing companies, including textile and furniture manufacturers. The county is home to a variety of ethnic and racial backgrounds, with the largest group being white (77.3%), followed by African American (17.7%), Hispanic (2.2%), and Asian (1.3%). The median household income in the county is $41,945, and the median home value is $133,400.
Common Questions
What is Per Capita Income in Chester County?
Per Capita income in Chester County is $26,349.
What is the Median Family Income in Chester County?
Median Family Income in Chester County is $59,906.
What is the Median Household income in Chester County?
Median Household Income in Chester County is $50,022.
What is Income or Wage Gap in Chester County?
Income or Wage Gap in Chester County is 27.6%.
Women in Chester County earn 72.4 cents for every dollar earned by a man.
What is Family Income Deficit in Chester County?
Family Income Deficit in Chester County is $9,135.
Families that are below poverty line in Chester County earn $9,135 less on average than the poverty threshold level.
What is Inequality or Gini Index in Chester County?
Inequality or Gini Index in Chester County is 0.45.
What is the Total Population of Chester County?
Total Population of Chester County is 32,171.
What is the Total Male Population of Chester County?
Total Male Population of Chester County is 15,747.
What is the Total Female Population of Chester County?
Total Female Population of Chester County is 16,424.
What is the Ratio of Males per 100 Females in Chester County?
There are 95.88 Males per 100 Females in Chester County.
What is the Ratio of Females per 100 Males in Chester County?
There are 104.30 Females per 100 Males in Chester County.
What is the Median Population Age in Chester County?
Median Population Age in Chester County is 41.8 Years.
What is the Average Family Size in Chester County
Average Family Size in Chester County is 3.1 People.
What is the Average Household Size in Chester County
Average Household Size in Chester County is 2.5 People.
How Large is the Labor Force in Chester County?
There are 14,682 People in the Labor Forcein in Chester County.
What is the Percentage of People in the Labor Force in Chester County?
56.3% of People are in the Labor Force in Chester County.
What is the Unemployment Rate in Chester County?
Unemployment Rate in Chester County is 6.2%.