Cities with the Largest Chippewa Community in the United States
RELATED REPORTS & OPTIONS
Chippewa
United States
Compare Cities
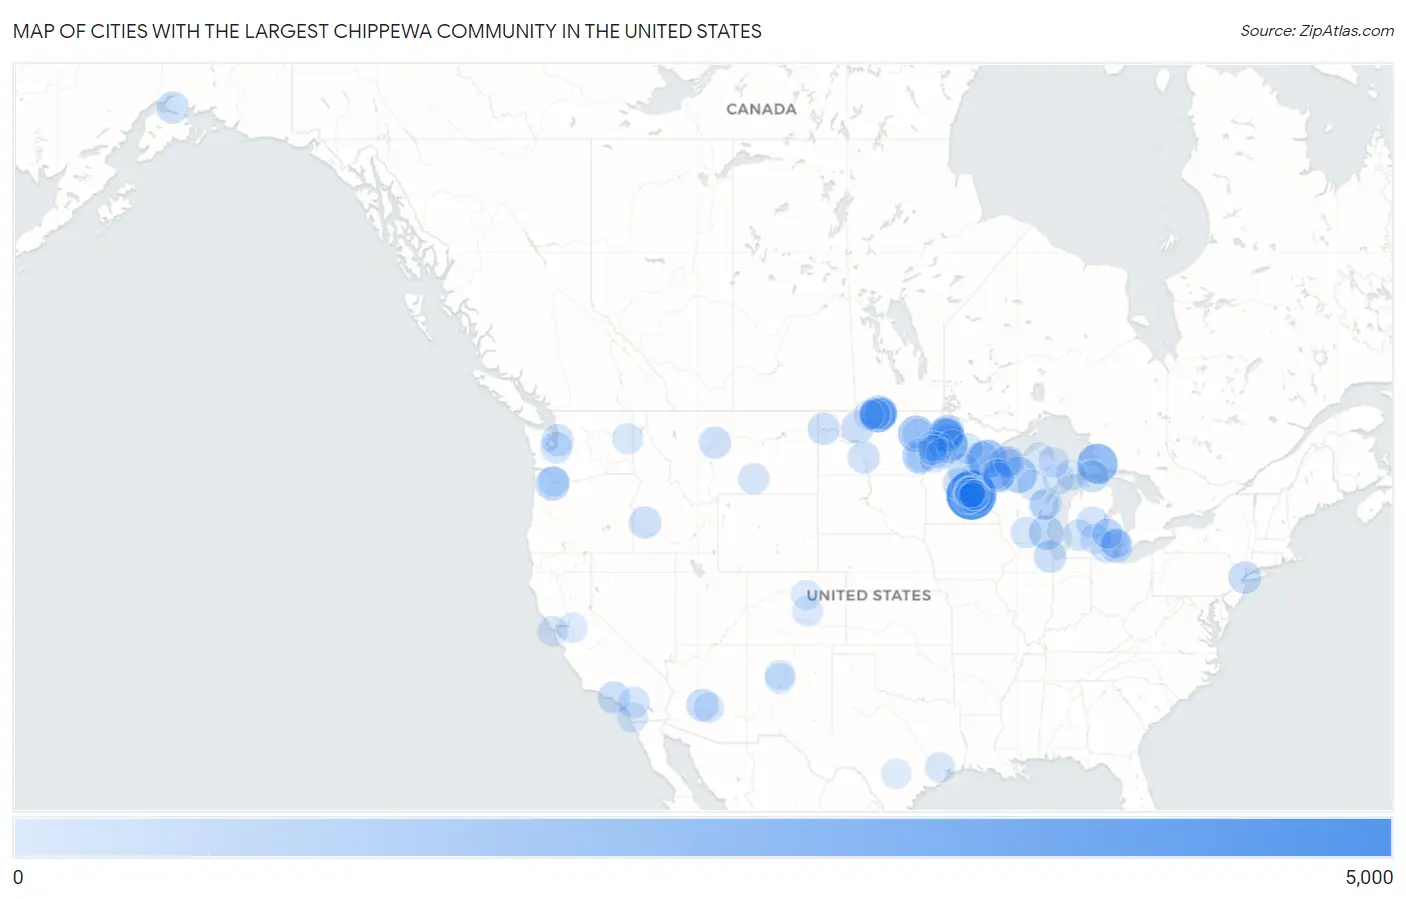
Map of Cities with the Largest Chippewa Community in the United States
0
5,000
Cities with the Largest Chippewa Community in the United States
| City | Chippewa | vs State | vs National | |
| 1. | Minneapolis | 4,274 | 52,447(8.15%)#1 | 191,286(2.23%)#1 |
| 2. | Sault Ste Marie | 2,246 | 35,959(6.25%)#1 | 191,286(1.17%)#2 |
| 3. | St Paul | 2,101 | 52,447(4.01%)#2 | 191,286(1.10%)#3 |
| 4. | Duluth | 1,826 | 52,447(3.48%)#3 | 191,286(0.95%)#4 |
| 5. | Bemidji | 1,775 | 52,447(3.38%)#4 | 191,286(0.93%)#5 |
| 6. | Belcourt | 1,549 | 17,713(8.74%)#1 | 191,286(0.81%)#6 |
| 7. | Grand Forks | 1,476 | 17,713(8.33%)#2 | 191,286(0.77%)#7 |
| 8. | Lac Du Flambeau | 1,361 | 22,253(6.12%)#1 | 191,286(0.71%)#8 |
| 9. | Red Lake | 1,328 | 52,447(2.53%)#5 | 191,286(0.69%)#9 |
| 10. | Fargo | 1,217 | 17,713(6.87%)#3 | 191,286(0.64%)#10 |
| 11. | Shell Valley | 1,168 | 17,713(6.59%)#4 | 191,286(0.61%)#11 |
| 12. | Milwaukee | 1,103 | 22,253(4.96%)#2 | 191,286(0.58%)#12 |
| 13. | Cloquet | 1,003 | 52,447(1.91%)#6 | 191,286(0.52%)#13 |
| 14. | Little Rock | 968 | 52,447(1.85%)#7 | 191,286(0.51%)#14 |
| 15. | Portland | 957 | 3,077(31.10%)#1 | 191,286(0.50%)#15 |
| 16. | Ponemah | 830 | 52,447(1.58%)#8 | 191,286(0.43%)#16 |
| 17. | Little Round Lake | 793 | 22,253(3.56%)#3 | 191,286(0.41%)#17 |
| 18. | Redby | 783 | 52,447(1.49%)#9 | 191,286(0.41%)#18 |
| 19. | Kincheloe | 775 | 35,959(2.16%)#2 | 191,286(0.41%)#19 |
| 20. | Green Acres | 762 | 17,713(4.30%)#5 | 191,286(0.40%)#20 |
| 21. | Detroit | 755 | 35,959(2.10%)#3 | 191,286(0.39%)#21 |
| 22. | Vineland | 715 | 52,447(1.36%)#10 | 191,286(0.37%)#22 |
| 23. | Chicago | 699 | 2,873(24.33%)#1 | 191,286(0.37%)#23 |
| 24. | Minot | 671 | 17,713(3.79%)#6 | 191,286(0.35%)#24 |
| 25. | New York | 669 | 1,507(44.39%)#1 | 191,286(0.35%)#25 |
| 26. | Phoenix | 661 | 2,789(23.70%)#1 | 191,286(0.35%)#26 |
| 27. | Boise City | 650 | 1,185(54.85%)#1 | 191,286(0.34%)#27 |
| 28. | St Ignace | 628 | 35,959(1.75%)#4 | 191,286(0.33%)#28 |
| 29. | Williston | 614 | 17,713(3.47%)#7 | 191,286(0.32%)#29 |
| 30. | Anchorage | 611 | 1,299(47.04%)#1 | 191,286(0.32%)#30 |
| 31. | Los Angeles | 608 | 9,421(6.45%)#1 | 191,286(0.32%)#31 |
| 32. | Great Falls | 600 | 4,828(12.43%)#1 | 191,286(0.31%)#32 |
| 33. | Bismarck | 586 | 17,713(3.31%)#8 | 191,286(0.31%)#33 |
| 34. | Ashland | 581 | 22,253(2.61%)#4 | 191,286(0.30%)#34 |
| 35. | St Cloud | 573 | 52,447(1.09%)#11 | 191,286(0.30%)#35 |
| 36. | Rolla | 569 | 17,713(3.21%)#9 | 191,286(0.30%)#36 |
| 37. | Mount Pleasant | 545 | 35,959(1.52%)#5 | 191,286(0.28%)#37 |
| 38. | Seattle | 527 | 7,750(6.80%)#1 | 191,286(0.28%)#38 |
| 39. | Tacoma | 523 | 7,750(6.75%)#2 | 191,286(0.27%)#39 |
| 40. | Green Bay | 519 | 22,253(2.33%)#5 | 191,286(0.27%)#40 |
| 41. | Bloomington | 504 | 52,447(0.96%)#12 | 191,286(0.26%)#41 |
| 42. | White Earth | 491 | 52,447(0.94%)#13 | 191,286(0.26%)#42 |
| 43. | Grand Rapids | 490 | 35,959(1.36%)#6 | 191,286(0.26%)#43 |
| 44. | Coon Rapids | 484 | 52,447(0.92%)#14 | 191,286(0.25%)#44 |
| 45. | Madison | 444 | 22,253(2.00%)#6 | 191,286(0.23%)#45 |
| 46. | Hemet | 443 | 9,421(4.70%)#2 | 191,286(0.23%)#46 |
| 47. | Blaine | 437 | 52,447(0.83%)#15 | 191,286(0.23%)#47 |
| 48. | Billings | 418 | 4,828(8.66%)#2 | 191,286(0.22%)#48 |
| 49. | Escanaba | 409 | 35,959(1.14%)#7 | 191,286(0.21%)#49 |
| 50. | Grand Rapids | 404 | 52,447(0.77%)#16 | 191,286(0.21%)#50 |
| 51. | Chief Lake | 399 | 22,253(1.79%)#7 | 191,286(0.21%)#51 |
| 52. | Dunseith | 397 | 17,713(2.24%)#10 | 191,286(0.21%)#52 |
| 53. | Naytahwaush | 386 | 52,447(0.74%)#17 | 191,286(0.20%)#53 |
| 54. | Moorhead | 384 | 52,447(0.73%)#18 | 191,286(0.20%)#54 |
| 55. | Maple Grove | 369 | 52,447(0.70%)#19 | 191,286(0.19%)#55 |
| 56. | East Dunseith | 369 | 17,713(2.08%)#11 | 191,286(0.19%)#56 |
| 57. | Spokane | 362 | 7,750(4.67%)#3 | 191,286(0.19%)#57 |
| 58. | Manistique | 358 | 35,959(1.00%)#8 | 191,286(0.19%)#58 |
| 59. | Ann Arbor | 355 | 35,959(0.99%)#9 | 191,286(0.19%)#59 |
| 60. | Baraga | 346 | 35,959(0.96%)#10 | 191,286(0.18%)#60 |
| 61. | Mole Lake | 345 | 22,253(1.55%)#8 | 191,286(0.18%)#61 |
| 62. | Brooklyn Center | 343 | 52,447(0.65%)#20 | 191,286(0.18%)#62 |
| 63. | Vancouver | 342 | 7,750(4.41%)#4 | 191,286(0.18%)#63 |
| 64. | San Francisco | 336 | 9,421(3.57%)#3 | 191,286(0.18%)#64 |
| 65. | Cass Lake | 317 | 52,447(0.60%)#21 | 191,286(0.17%)#65 |
| 66. | Colorado Springs | 313 | 1,906(16.42%)#1 | 191,286(0.16%)#66 |
| 67. | Lansing | 305 | 35,959(0.85%)#11 | 191,286(0.16%)#67 |
| 68. | Marquette | 302 | 35,959(0.84%)#12 | 191,286(0.16%)#68 |
| 69. | Hobart | 301 | 22,253(1.35%)#9 | 191,286(0.16%)#69 |
| 70. | Houston | 286 | 2,633(10.86%)#1 | 191,286(0.15%)#70 |
| 71. | Flint | 284 | 35,959(0.79%)#13 | 191,286(0.15%)#71 |
| 72. | Elk River | 283 | 52,447(0.54%)#22 | 191,286(0.15%)#72 |
| 73. | Shakopee | 281 | 52,447(0.54%)#23 | 191,286(0.15%)#73 |
| 74. | New Odanah | 281 | 22,253(1.26%)#10 | 191,286(0.15%)#74 |
| 75. | Mesa | 280 | 2,789(10.04%)#2 | 191,286(0.15%)#75 |
| 76. | Fridley | 279 | 52,447(0.53%)#24 | 191,286(0.15%)#76 |
| 77. | East Grand Forks | 279 | 52,447(0.53%)#25 | 191,286(0.15%)#77 |
| 78. | Bottineau | 277 | 17,713(1.56%)#12 | 191,286(0.14%)#78 |
| 79. | Brooklyn Park | 273 | 52,447(0.52%)#26 | 191,286(0.14%)#79 |
| 80. | St Louis Park | 268 | 52,447(0.51%)#27 | 191,286(0.14%)#80 |
| 81. | Birch Hill | 268 | 22,253(1.20%)#11 | 191,286(0.14%)#81 |
| 82. | Detroit Lakes | 262 | 52,447(0.50%)#28 | 191,286(0.14%)#82 |
| 83. | Albuquerque | 261 | 875(29.83%)#1 | 191,286(0.14%)#83 |
| 84. | Riverland | 261 | 52,447(0.50%)#29 | 191,286(0.14%)#84 |
| 85. | San Diego | 259 | 9,421(2.75%)#4 | 191,286(0.14%)#85 |
| 86. | Reserve | 258 | 22,253(1.16%)#12 | 191,286(0.13%)#86 |
| 87. | Maplewood | 254 | 52,447(0.48%)#30 | 191,286(0.13%)#87 |
| 88. | Hayward | 253 | 22,253(1.14%)#13 | 191,286(0.13%)#88 |
| 89. | Rio Rancho | 251 | 875(28.69%)#2 | 191,286(0.13%)#89 |
| 90. | Trenton | 251 | 17,713(1.42%)#13 | 191,286(0.13%)#90 |
| 91. | Pine Point | 247 | 52,447(0.47%)#31 | 191,286(0.13%)#91 |
| 92. | Eagan | 244 | 52,447(0.47%)#32 | 191,286(0.13%)#92 |
| 93. | Troy | 238 | 35,959(0.66%)#14 | 191,286(0.12%)#93 |
| 94. | Denver | 235 | 1,906(12.33%)#2 | 191,286(0.12%)#94 |
| 95. | Waubun | 229 | 52,447(0.44%)#33 | 191,286(0.12%)#95 |
| 96. | Burton | 227 | 35,959(0.63%)#15 | 191,286(0.12%)#96 |
| 97. | Stockton | 222 | 9,421(2.36%)#5 | 191,286(0.12%)#97 |
| 98. | San Antonio | 220 | 2,633(8.36%)#2 | 191,286(0.12%)#98 |
| 99. | Warren | 220 | 35,959(0.61%)#16 | 191,286(0.12%)#99 |
| 100. | Oakdale | 220 | 52,447(0.42%)#34 | 191,286(0.12%)#100 |
Common Questions
What are the Top 10 Cities with the Largest Chippewa Community in the United States?
Top 10 Cities with the Largest Chippewa Community in the United States are:
#1
4,274
#2
2,246
#3
2,101
#4
1,826
#5
1,775
#6
1,549
#7
1,476
#8
1,361
#9
1,328
#10
1,217
What city has the Largest Chippewa Community in the United States?
Minneapolis has the Largest Chippewa Community in the United States with 4,274.
What is the Total Chippewa Population in the United States?
Total Chippewa Population in the United States is 191,286.