Cities with the Highest Percentage of Estonian Population in the United States
RELATED REPORTS & OPTIONS
Estonian
United States
Compare Cities
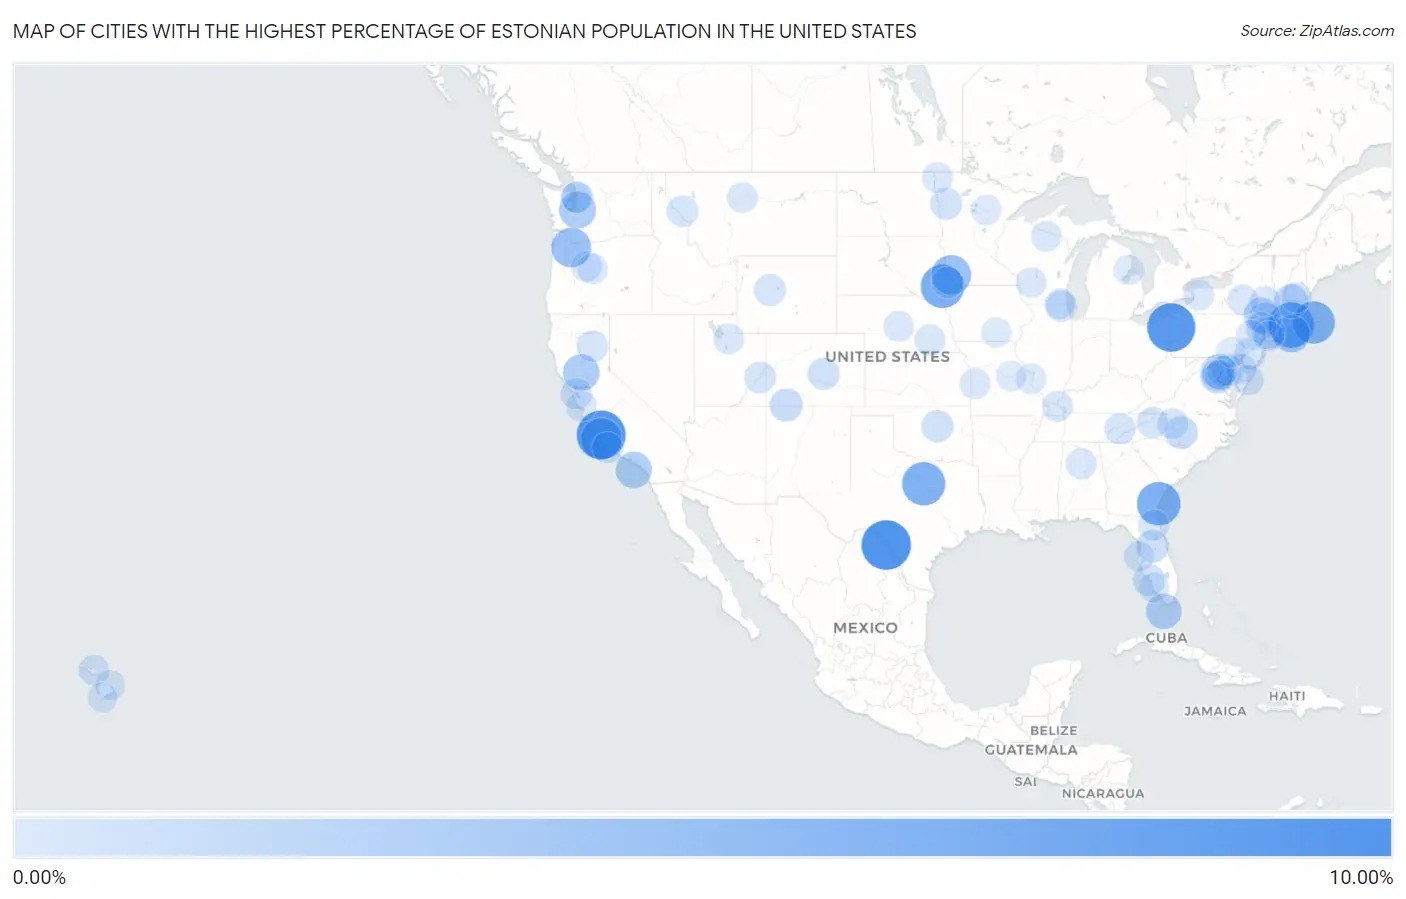
Map of Cities with the Highest Percentage of Estonian Population in the United States
0.00%
10.00%
Cities with the Highest Percentage of Estonian Population in the United States
| City | Estonian | vs State | vs National | |
| 1. | Radar Base | 8.11% | 0.0037%(+8.10)#1 | 0.0087%(+8.10)#1 |
| 2. | Garden Farms | 7.84% | 0.010%(+7.83)#1 | 0.0087%(+7.83)#2 |
| 3. | Orangeville | 7.60% | 0.0043%(+7.60)#1 | 0.0087%(+7.59)#3 |
| 4. | Gales Ferry | 6.47% | 0.031%(+6.44)#1 | 0.0087%(+6.46)#4 |
| 5. | Dilley | 5.74% | 0.028%(+5.71)#1 | 0.0087%(+5.73)#5 |
| 6. | Darien | 5.67% | 0.0022%(+5.66)#1 | 0.0087%(+5.66)#6 |
| 7. | Shindler | 5.64% | 0.0072%(+5.63)#1 | 0.0087%(+5.63)#7 |
| 8. | Horseshoe Bend | 5.57% | 0.0037%(+5.57)#2 | 0.0087%(+5.56)#8 |
| 9. | Seabrook | 5.21% | 0.015%(+5.20)#1 | 0.0087%(+5.20)#9 |
| 10. | Edna | 4.79% | 0.010%(+4.78)#2 | 0.0087%(+4.78)#10 |
| 11. | Lake Wilson | 4.23% | 0.0098%(+4.22)#1 | 0.0087%(+4.22)#11 |
| 12. | Stafford | 4.08% | 0.028%(+4.06)#2 | 0.0087%(+4.08)#12 |
| 13. | Rock Ridge | 3.35% | 0.031%(+3.32)#2 | 0.0087%(+3.34)#13 |
| 14. | Napeague | 3.25% | 0.013%(+3.23)#1 | 0.0087%(+3.24)#14 |
| 15. | North Puyallup | 3.04% | 0.021%(+3.02)#1 | 0.0087%(+3.04)#15 |
| 16. | Dunnigan | 2.87% | 0.010%(+2.86)#3 | 0.0087%(+2.86)#16 |
| 17. | Avalon | 2.82% | 0.010%(+2.81)#4 | 0.0087%(+2.81)#17 |
| 18. | Dixon Lane Meadow Creek | 2.56% | 0.010%(+2.55)#5 | 0.0087%(+2.55)#18 |
| 19. | Key Colony Beach | 2.46% | 0.0093%(+2.45)#1 | 0.0087%(+2.45)#19 |
| 20. | Shokan | 2.24% | 0.013%(+2.23)#2 | 0.0087%(+2.23)#20 |
| 21. | Glen Echo | 2.13% | 0.018%(+2.11)#1 | 0.0087%(+2.12)#21 |
| 22. | Occoquan | 1.96% | 0.013%(+1.95)#1 | 0.0087%(+1.95)#22 |
| 23. | Winchendon | 1.95% | 0.015%(+1.94)#2 | 0.0087%(+1.94)#23 |
| 24. | Buena Borough | 1.82% | 0.021%(+1.80)#1 | 0.0087%(+1.81)#24 |
| 25. | Rye Brook | 1.60% | 0.013%(+1.59)#3 | 0.0087%(+1.59)#25 |
| 26. | Haviland | 1.51% | 0.013%(+1.50)#4 | 0.0087%(+1.51)#26 |
| 27. | Seagrove | 1.48% | 0.0063%(+1.48)#1 | 0.0087%(+1.47)#27 |
| 28. | Southern Ute | 1.47% | 0.016%(+1.45)#1 | 0.0087%(+1.46)#28 |
| 29. | New Hope Borough | 1.37% | 0.0081%(+1.36)#1 | 0.0087%(+1.36)#29 |
| 30. | Yalaha | 1.35% | 0.0093%(+1.34)#2 | 0.0087%(+1.34)#30 |
| 31. | North Anson | 1.30% | 0.0085%(+1.29)#1 | 0.0087%(+1.29)#31 |
| 32. | Huntington | 1.19% | 0.0068%(+1.18)#1 | 0.0087%(+1.18)#32 |
| 33. | Narberth Borough | 1.18% | 0.0081%(+1.18)#2 | 0.0087%(+1.17)#33 |
| 34. | Tryon | 1.13% | 0.0043%(+1.13)#1 | 0.0087%(+1.13)#34 |
| 35. | Danby | 1.12% | 0.0068%(+1.12)#2 | 0.0087%(+1.11)#35 |
| 36. | Manitou Springs | 1.11% | 0.016%(+1.10)#2 | 0.0087%(+1.11)#36 |
| 37. | Fertile | 1.10% | 0.0098%(+1.09)#2 | 0.0087%(+1.09)#37 |
| 38. | Alderwood Manor | 1.10% | 0.021%(+1.08)#2 | 0.0087%(+1.09)#38 |
| 39. | Matlacha | 1.08% | 0.0093%(+1.07)#3 | 0.0087%(+1.07)#39 |
| 40. | Pavillion | 1.03% | 0.012%(+1.02)#1 | 0.0087%(+1.03)#40 |
| 41. | Castle Valley | 0.98% | 0.0057%(+0.972)#1 | 0.0087%(+0.969)#41 |
| 42. | Barclay | 0.98% | 0.021%(+0.956)#2 | 0.0087%(+0.968)#42 |
| 43. | Luverne | 0.94% | 0.0098%(+0.927)#3 | 0.0087%(+0.928)#43 |
| 44. | Spring Lake Borough | 0.93% | 0.021%(+0.912)#3 | 0.0087%(+0.924)#44 |
| 45. | Riverbend | 0.92% | 0.0053%(+0.918)#1 | 0.0087%(+0.915)#45 |
| 46. | Brisbane | 0.90% | 0.010%(+0.894)#6 | 0.0087%(+0.895)#46 |
| 47. | Green | 0.89% | 0.021%(+0.865)#4 | 0.0087%(+0.877)#47 |
| 48. | Arrowhead Beach | 0.88% | 0.0063%(+0.879)#2 | 0.0087%(+0.876)#48 |
| 49. | Chester | 0.88% | 0.010%(+0.870)#7 | 0.0087%(+0.872)#49 |
| 50. | Crownsville | 0.88% | 0.018%(+0.862)#2 | 0.0087%(+0.872)#50 |
| 51. | Mountain Lakes Borough | 0.87% | 0.021%(+0.846)#5 | 0.0087%(+0.858)#51 |
| 52. | Spring Grove | 0.86% | 0.0083%(+0.852)#1 | 0.0087%(+0.852)#52 |
| 53. | Friendsville | 0.82% | 0.0030%(+0.817)#1 | 0.0087%(+0.812)#53 |
| 54. | Sugar Mountain | 0.82% | 0.0063%(+0.812)#3 | 0.0087%(+0.809)#54 |
| 55. | Bryn Athyn Borough | 0.81% | 0.0081%(+0.799)#3 | 0.0087%(+0.798)#55 |
| 56. | Los Olivos | 0.78% | 0.010%(+0.774)#8 | 0.0087%(+0.776)#56 |
| 57. | Exeter | 0.76% | 0.0033%(+0.760)#1 | 0.0087%(+0.755)#57 |
| 58. | Asbury Lake | 0.76% | 0.0093%(+0.750)#4 | 0.0087%(+0.750)#58 |
| 59. | Ledbetter | 0.72% | 0.00056%(+0.716)#1 | 0.0087%(+0.708)#59 |
| 60. | Bermuda Run | 0.71% | 0.0063%(+0.699)#4 | 0.0087%(+0.697)#60 |
| 61. | Morris | 0.70% | 0.0019%(+0.702)#1 | 0.0087%(+0.695)#61 |
| 62. | Monroe | 0.68% | 0.013%(+0.666)#5 | 0.0087%(+0.671)#62 |
| 63. | Wilton | 0.68% | 0.016%(+0.660)#1 | 0.0087%(+0.666)#63 |
| 64. | Tarpon Springs | 0.67% | 0.0093%(+0.657)#5 | 0.0087%(+0.658)#64 |
| 65. | Butler | 0.66% | 0.0022%(+0.658)#1 | 0.0087%(+0.652)#65 |
| 66. | Las Campanas | 0.66% | 0.0095%(+0.648)#1 | 0.0087%(+0.649)#66 |
| 67. | Haiku Pauwela | 0.65% | 0.012%(+0.637)#1 | 0.0087%(+0.640)#67 |
| 68. | Camp Sherman | 0.64% | 0.028%(+0.611)#3 | 0.0087%(+0.630)#68 |
| 69. | Camden | 0.64% | 0.026%(+0.612)#1 | 0.0087%(+0.630)#69 |
| 70. | Earlville | 0.64% | 0.013%(+0.623)#6 | 0.0087%(+0.627)#70 |
| 71. | Clarence | 0.63% | 0.013%(+0.621)#7 | 0.0087%(+0.625)#71 |
| 72. | Hallock | 0.62% | 0.0098%(+0.614)#4 | 0.0087%(+0.615)#72 |
| 73. | Tokeneke | 0.62% | 0.031%(+0.590)#3 | 0.0087%(+0.613)#73 |
| 74. | Terrebonne | 0.62% | 0.028%(+0.588)#4 | 0.0087%(+0.608)#74 |
| 75. | Hillsboro | 0.61% | 0.0063%(+0.601)#1 | 0.0087%(+0.598)#75 |
| 76. | Westport | 0.60% | 0.031%(+0.568)#4 | 0.0087%(+0.591)#76 |
| 77. | Voorheesville | 0.60% | 0.013%(+0.585)#8 | 0.0087%(+0.590)#77 |
| 78. | Broken Bow | 0.60% | 0.0033%(+0.595)#2 | 0.0087%(+0.590)#78 |
| 79. | Esperance | 0.59% | 0.021%(+0.565)#3 | 0.0087%(+0.577)#79 |
| 80. | Fort Benton | 0.58% | 0.0053%(+0.578)#2 | 0.0087%(+0.574)#80 |
| 81. | Laurel Hill | 0.57% | 0.013%(+0.560)#2 | 0.0087%(+0.564)#81 |
| 82. | Eagle River | 0.57% | 0.0063%(+0.565)#2 | 0.0087%(+0.563)#82 |
| 83. | Fenwick Island | 0.57% | 0.026%(+0.545)#2 | 0.0087%(+0.563)#83 |
| 84. | Lake Ivanhoe | 0.56% | 0.0063%(+0.551)#3 | 0.0087%(+0.549)#84 |
| 85. | Summit Park | 0.55% | 0.0057%(+0.546)#2 | 0.0087%(+0.542)#85 |
| 86. | Scotts Valley | 0.55% | 0.010%(+0.537)#9 | 0.0087%(+0.539)#86 |
| 87. | Wilbur Park | 0.54% | 0.0022%(+0.534)#2 | 0.0087%(+0.527)#87 |
| 88. | East Tawas | 0.52% | 0.0056%(+0.517)#1 | 0.0087%(+0.514)#88 |
| 89. | Baxter Estates | 0.52% | 0.013%(+0.509)#9 | 0.0087%(+0.514)#89 |
| 90. | Cheverly | 0.52% | 0.018%(+0.504)#3 | 0.0087%(+0.513)#90 |
| 91. | Vineyards | 0.52% | 0.0093%(+0.511)#6 | 0.0087%(+0.512)#91 |
| 92. | Belle Haven | 0.52% | 0.013%(+0.506)#3 | 0.0087%(+0.510)#92 |
| 93. | Willow Street | 0.52% | 0.0081%(+0.511)#4 | 0.0087%(+0.510)#93 |
| 94. | Panther Valley | 0.50% | 0.021%(+0.484)#6 | 0.0087%(+0.495)#94 |
| 95. | Chamois | 0.50% | 0.0022%(+0.498)#3 | 0.0087%(+0.491)#95 |
| 96. | Albia | 0.49% | 0.0033%(+0.483)#1 | 0.0087%(+0.477)#96 |
| 97. | Honomu | 0.48% | 0.012%(+0.472)#2 | 0.0087%(+0.476)#97 |
| 98. | Discovery Harbour | 0.48% | 0.012%(+0.471)#3 | 0.0087%(+0.475)#98 |
| 99. | La Prairie | 0.48% | 0.0098%(+0.472)#5 | 0.0087%(+0.473)#99 |
| 100. | New Canaan | 0.48% | 0.031%(+0.450)#5 | 0.0087%(+0.472)#100 |
Common Questions
What are the Top 10 Cities with the Highest Percentage of Estonian Population in the United States?
Top 10 Cities with the Highest Percentage of Estonian Population in the United States are:
#1
8.11%
#2
7.84%
#3
7.60%
#4
6.47%
#5
5.67%
#6
5.64%
#7
5.57%
#8
5.21%
#9
4.79%
#10
4.23%
What city has the Highest Percentage of Estonian Population in the United States?
Radar Base has the Highest Percentage of Estonian Population in the United States with 8.11%.
What is the Percentage of Estonian Population in the United States?
Percentage of Estonian Population in the United States is 0.0087%.