Iowa Map & Demographics
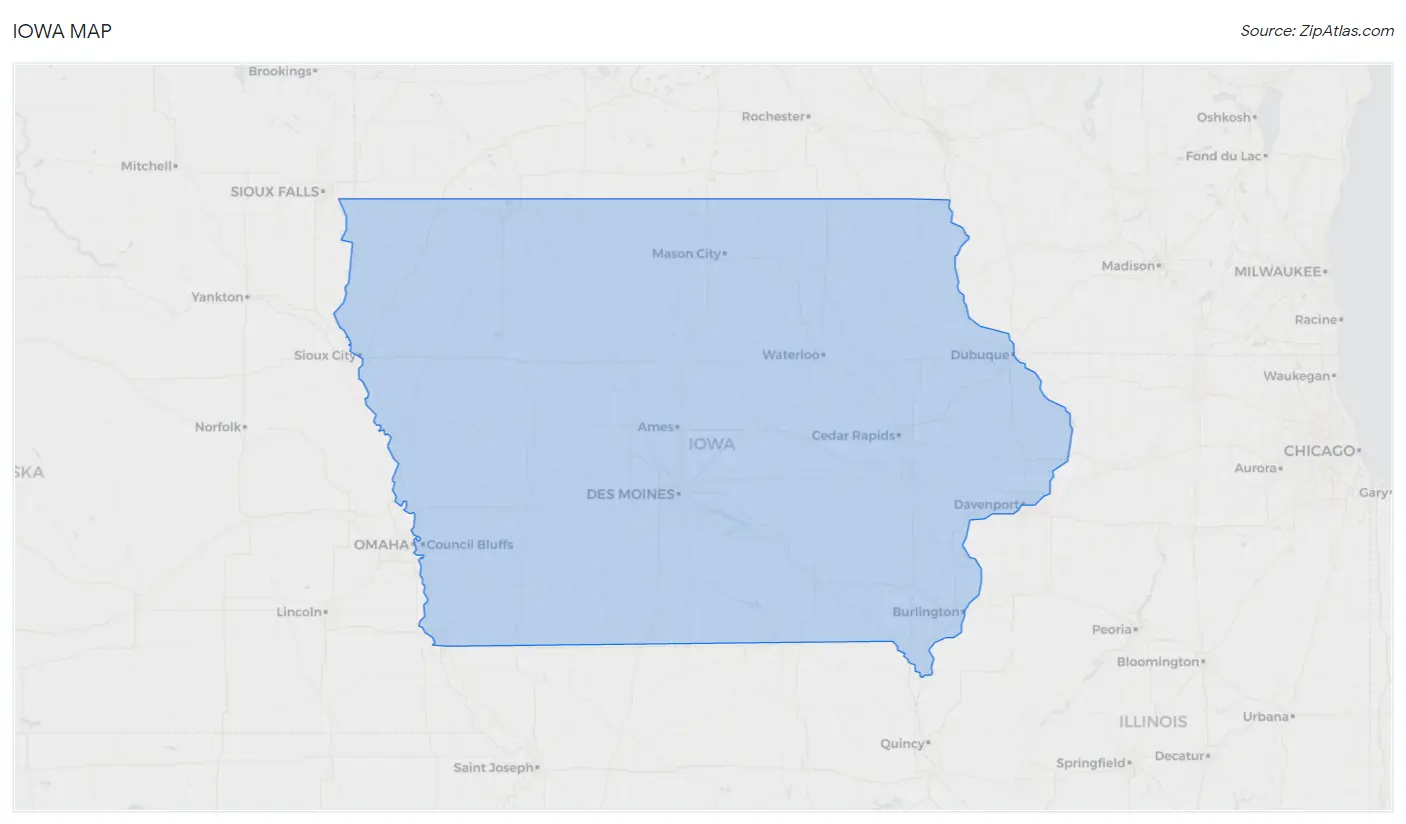
Iowa Map
Iowa Overview
Dec 28, 1846
INCORPORATED
56,273
TOTAL AREA [ SQ MI ]
55,858
LAND AREA [ SQ MI ]
415
WATER AREA [ SQ MI ]
1,100
ELEVATION AVG [ FT ]
1,670
ELEVATION HIGH [ FT ]
480
ELEVATION LOW [ FT ]
57.1
POP DENSITY [ PPL / SQ MI ]
$37,949
PER CAPITA INCOME
$90,921
AVG FAMILY INCOME
$70,571
AVG HOUSEHOLD INCOME
29.9%
WAGE / INCOME GAP [ % ]
70.1¢/ $1
WAGE / INCOME GAP [ $ ]
$10,739
FAMILY INCOME DEFICIT
0.44
INEQUALITY / GINI INDEX
50023
LARGEST ZIP CODE
Des Moines
LARGEST CITY
Polk County
LARGEST COUNTY
3,188,836
TOTAL POPULATION
1,598,555
MALE POPULATION
1,590,281
FEMALE POPULATION
100.52
MALES / 100 FEMALES
99.48
FEMALES / 100 MALES
38.4
MEDIAN AGE
3.0
AVG FAMILY SIZE
2.4
AVG HOUSEHOLD SIZE
1,694,783
LABOR FORCE [ PEOPLE ]
66.6%
PERCENT IN LABOR FORCE
3.8%
UNEMPLOYMENT RATE
Income in Iowa
Income Overview in Iowa
Per Capita Income in Iowa is $37,949, while median incomes of families and households are $90,921 and $70,571 respectively.
| Characteristic | Number | Measure |
| Per Capita Income | 3,188,836 | $37,949 |
| Median Family Income | 803,276 | $90,921 |
| Mean Family Income | 803,276 | $111,983 |
| Median Household Income | 1,290,139 | $70,571 |
| Mean Household Income | 1,290,139 | $92,053 |
| Income Deficit | 803,276 | $10,739 |
| Wage / Income Gap (%) | 3,188,836 | 29.91% |
| Wage / Income Gap ($) | 3,188,836 | 70.09¢ per $1 |
| Gini / Inequality Index | 3,188,836 | 0.44 |
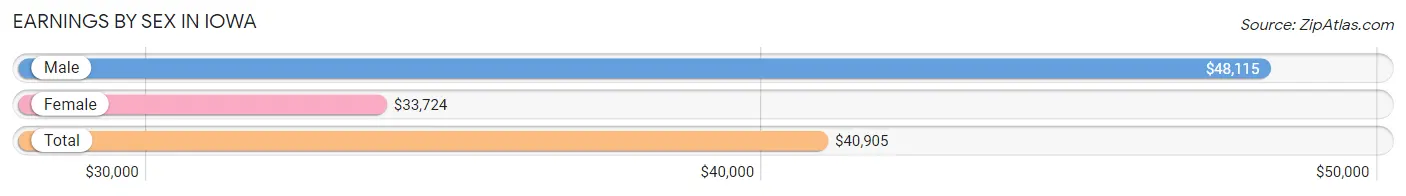
Earnings by Sex in Iowa
Average Earnings in Iowa are $40,905, $48,115 for men and $33,724 for women, a difference of 29.9%.
| Sex | Number | Average Earnings |
| Male | 953,471 (53.0%) | $48,115 |
| Female | 846,380 (47.0%) | $33,724 |
| Total | 1,799,851 (100.0%) | $40,905 |
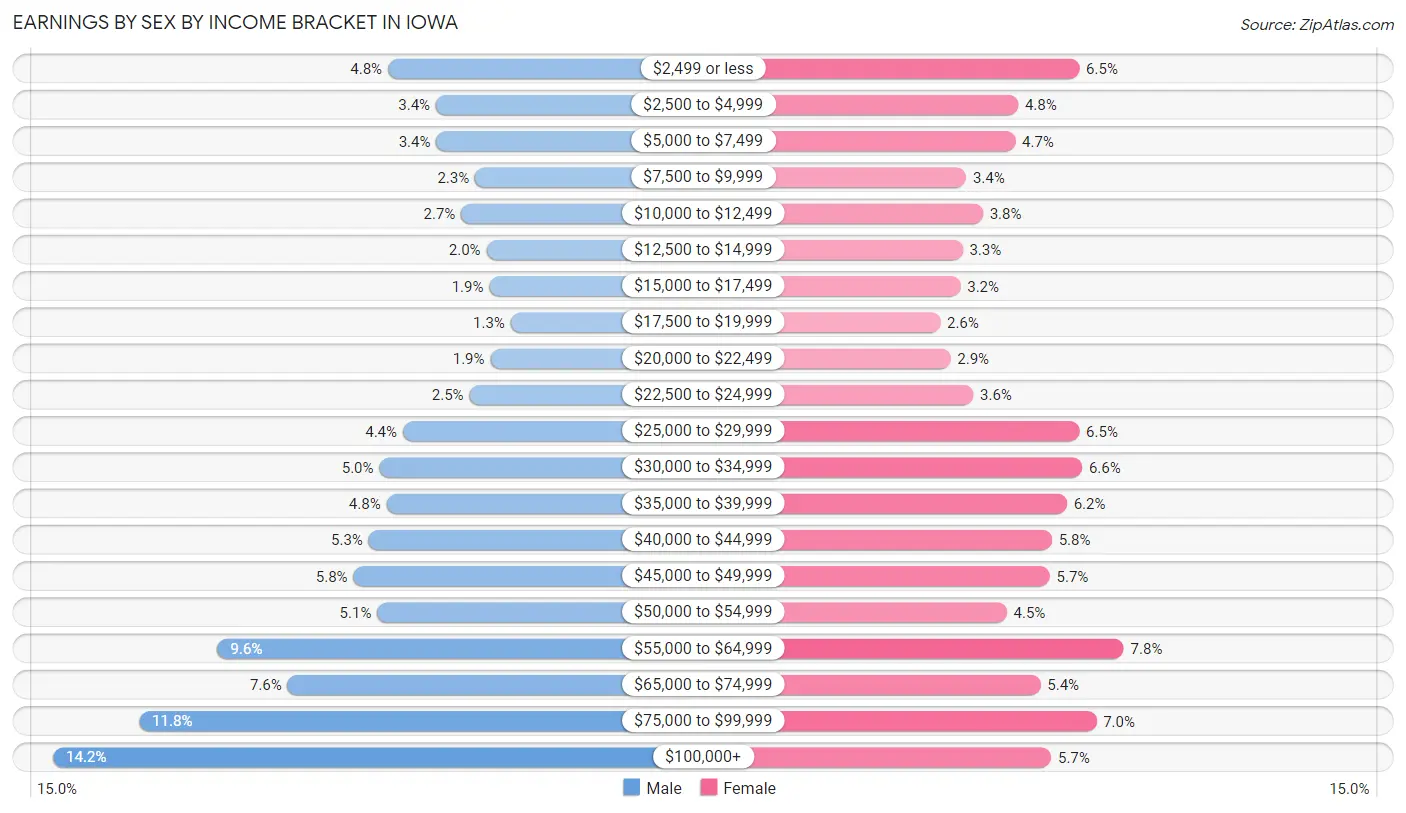
Earnings by Sex by Income Bracket in Iowa
The most common earnings brackets in Iowa are $100,000+ for men (135,377 | 14.2%) and $55,000 to $64,999 for women (65,807 | 7.8%).
| Income | Male | Female |
| $2,499 or less | 45,683 (4.8%) | 55,234 (6.5%) |
| $2,500 to $4,999 | 32,835 (3.4%) | 40,729 (4.8%) |
| $5,000 to $7,499 | 32,708 (3.4%) | 40,016 (4.7%) |
| $7,500 to $9,999 | 22,283 (2.3%) | 28,321 (3.4%) |
| $10,000 to $12,499 | 26,016 (2.7%) | 32,303 (3.8%) |
| $12,500 to $14,999 | 19,267 (2.0%) | 27,545 (3.3%) |
| $15,000 to $17,499 | 18,504 (1.9%) | 27,017 (3.2%) |
| $17,500 to $19,999 | 12,773 (1.3%) | 22,198 (2.6%) |
| $20,000 to $22,499 | 18,176 (1.9%) | 24,614 (2.9%) |
| $22,500 to $24,999 | 23,862 (2.5%) | 30,080 (3.5%) |
| $25,000 to $29,999 | 41,643 (4.4%) | 55,302 (6.5%) |
| $30,000 to $34,999 | 48,007 (5.0%) | 55,966 (6.6%) |
| $35,000 to $39,999 | 46,032 (4.8%) | 52,289 (6.2%) |
| $40,000 to $44,999 | 50,777 (5.3%) | 48,724 (5.8%) |
| $45,000 to $49,999 | 54,876 (5.8%) | 48,260 (5.7%) |
| $50,000 to $54,999 | 48,491 (5.1%) | 38,008 (4.5%) |
| $55,000 to $64,999 | 91,304 (9.6%) | 65,807 (7.8%) |
| $65,000 to $74,999 | 72,578 (7.6%) | 46,070 (5.4%) |
| $75,000 to $99,999 | 112,279 (11.8%) | 59,352 (7.0%) |
| $100,000+ | 135,377 (14.2%) | 48,545 (5.7%) |
| Total | 953,471 (100.0%) | 846,380 (100.0%) |
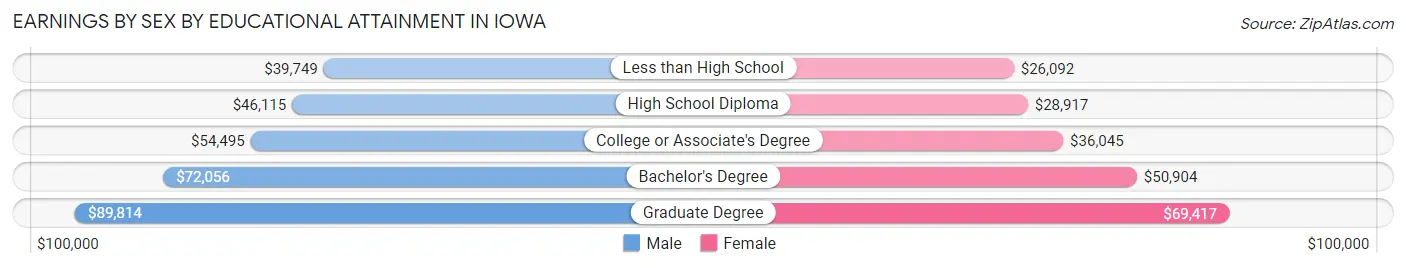
Earnings by Sex by Educational Attainment in Iowa
Average earnings in Iowa are $55,575 for men and $39,828 for women, a difference of 28.3%. Men with an educational attainment of graduate degree enjoy the highest average annual earnings of $89,814, while those with less than high school education earn the least with $39,749. Women with an educational attainment of graduate degree earn the most with the average annual earnings of $69,417, while those with less than high school education have the smallest earnings of $26,092.
| Educational Attainment | Male Income | Female Income |
| Less than High School | $39,749 | $26,092 |
| High School Diploma | $46,115 | $28,917 |
| College or Associate's Degree | $54,495 | $36,045 |
| Bachelor's Degree | $72,056 | $50,904 |
| Graduate Degree | $89,814 | $69,417 |
| Total | $55,575 | $39,828 |
Family Income in Iowa
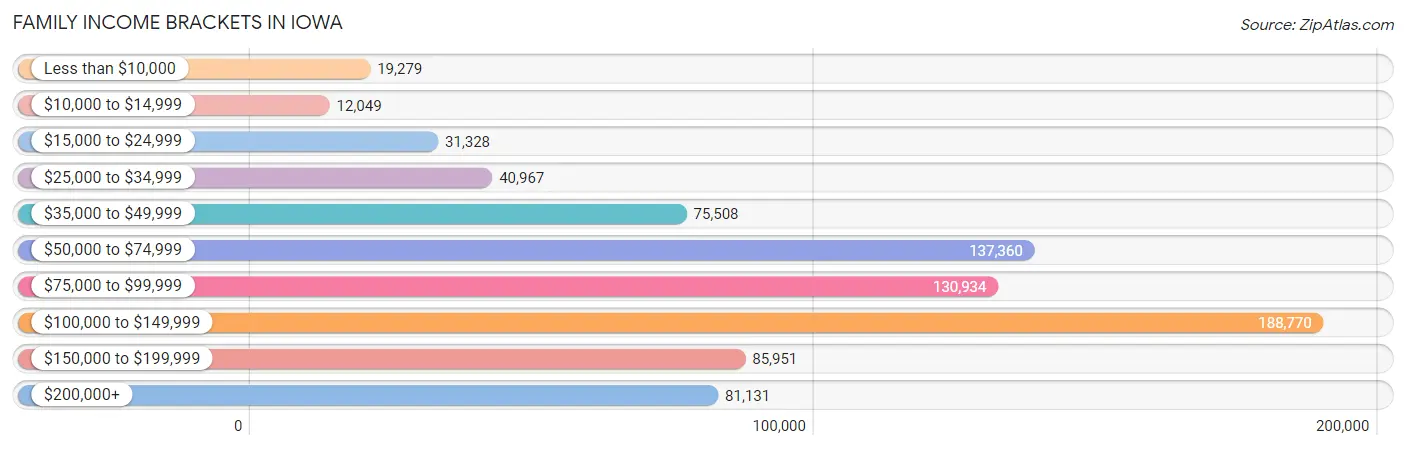
Family Income Brackets in Iowa
According to the Iowa family income data, there are 188,770 families falling into the $100,000 to $149,999 income range, which is the most common income bracket and makes up 23.5% of all families. Conversely, the $10,000 to $14,999 income bracket is the least frequent group with only 12,049 families (1.5%) belonging to this category.
| Income Bracket | # Families | % Families |
| Less than $10,000 | 19,279 | 2.4% |
| $10,000 to $14,999 | 12,049 | 1.5% |
| $15,000 to $24,999 | 31,328 | 3.9% |
| $25,000 to $34,999 | 40,967 | 5.1% |
| $35,000 to $49,999 | 75,508 | 9.4% |
| $50,000 to $74,999 | 137,360 | 17.1% |
| $75,000 to $99,999 | 130,934 | 16.3% |
| $100,000 to $149,999 | 188,770 | 23.5% |
| $150,000 to $199,999 | 85,951 | 10.7% |
| $200,000+ | 81,131 | 10.1% |
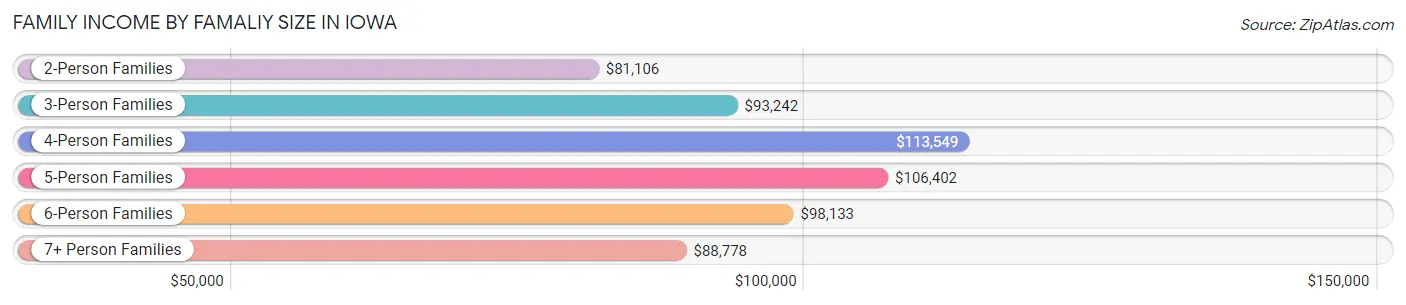
Family Income by Famaliy Size in Iowa
4-person families (135,164 | 16.8%) account for the highest median family income in Iowa with $113,549 per family, while 2-person families (415,126 | 51.7%) have the highest median income of $40,553 per family member.
| Income Bracket | # Families | Median Income |
| 2-Person Families | 415,126 (51.7%) | $81,106 |
| 3-Person Families | 154,451 (19.2%) | $93,242 |
| 4-Person Families | 135,164 (16.8%) | $113,549 |
| 5-Person Families | 66,329 (8.3%) | $106,402 |
| 6-Person Families | 21,625 (2.7%) | $98,133 |
| 7+ Person Families | 10,581 (1.3%) | $88,778 |
| Total | 803,276 (100.0%) | $90,921 |
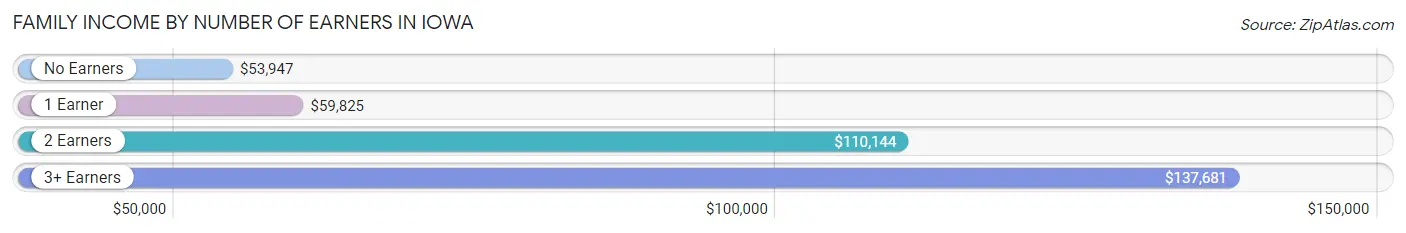
Family Income by Number of Earners in Iowa
The median family income in Iowa is $90,921, with families comprising 3+ earners (87,258) having the highest median family income of $137,681, while families with no earners (115,633) have the lowest median family income of $53,947, accounting for 10.9% and 14.4% of families, respectively.
| Number of Earners | # Families | Median Income |
| No Earners | 115,633 (14.4%) | $53,947 |
| 1 Earner | 223,709 (27.9%) | $59,825 |
| 2 Earners | 376,676 (46.9%) | $110,144 |
| 3+ Earners | 87,258 (10.9%) | $137,681 |
| Total | 803,276 (100.0%) | $90,921 |
Household Income in Iowa
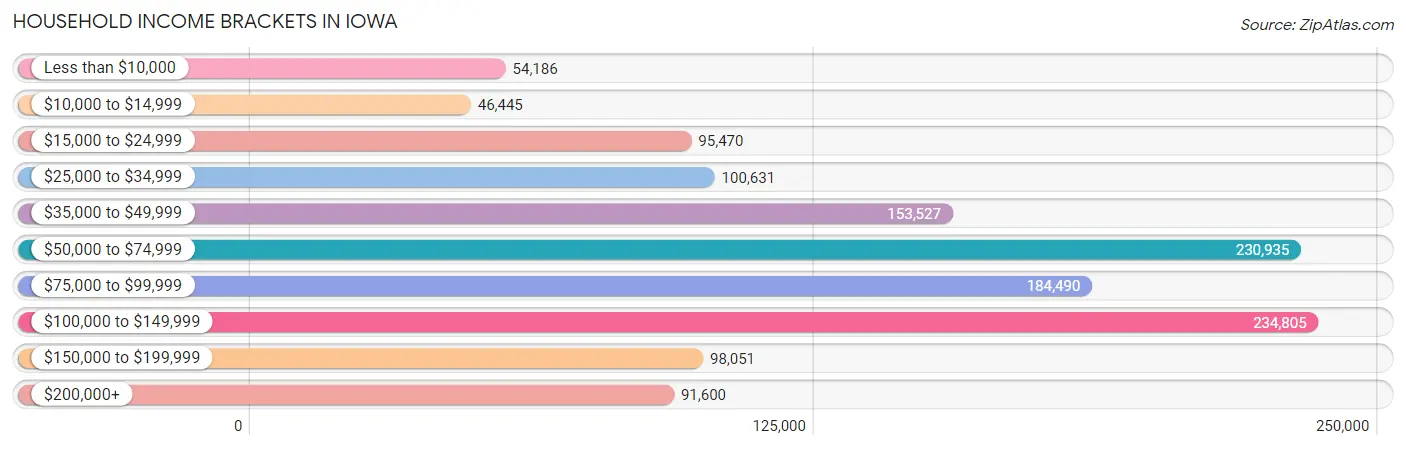
Household Income Brackets in Iowa
With 234,805 households falling in the category, the $100,000 to $149,999 income range is the most frequent in Iowa, accounting for 18.2% of all households. In contrast, only 46,445 households (3.6%) fall into the $10,000 to $14,999 income bracket, making it the least populous group.
| Income Bracket | # Households | % Households |
| Less than $10,000 | 54,186 | 4.2% |
| $10,000 to $14,999 | 46,445 | 3.6% |
| $15,000 to $24,999 | 95,470 | 7.4% |
| $25,000 to $34,999 | 100,631 | 7.8% |
| $35,000 to $49,999 | 153,527 | 11.9% |
| $50,000 to $74,999 | 230,935 | 17.9% |
| $75,000 to $99,999 | 184,490 | 14.3% |
| $100,000 to $149,999 | 234,805 | 18.2% |
| $150,000 to $199,999 | 98,051 | 7.6% |
| $200,000+ | 91,600 | 7.1% |
Household Income by Householder Age in Iowa
The median household income in Iowa is $70,571, with the highest median household income of $87,016 found in the 45 to 64 years age bracket for the primary householder. A total of 448,631 households (34.8%) fall into this category. Meanwhile, the 15 to 24 years age bracket for the primary householder has the lowest median household income of $42,113, with 77,338 households (6.0%) in this group.

| Income Bracket | # Households | Median Income |
| 15 to 24 Years | 77,338 (6.0%) | $42,113 |
| 25 to 44 Years | 412,181 (32.0%) | $80,820 |
| 45 to 64 Years | 448,631 (34.8%) | $87,016 |
| 65+ Years | 351,989 (27.3%) | $51,672 |
| Total | 1,290,139 (100.0%) | $70,571 |
Poverty in Iowa
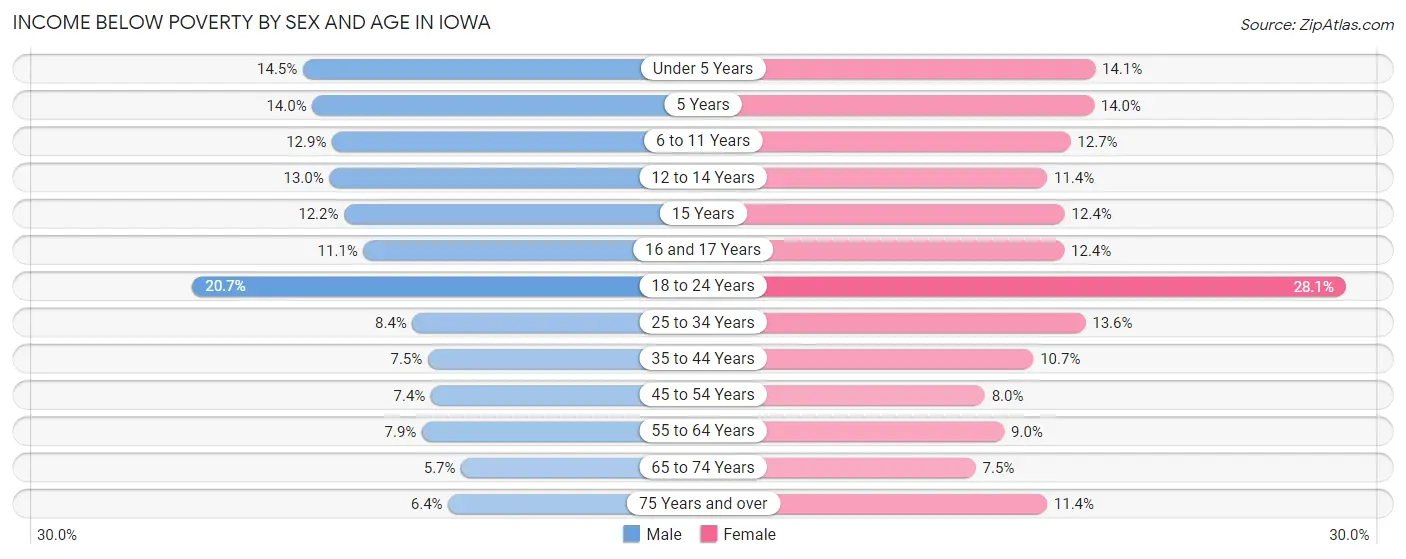
Income Below Poverty by Sex and Age in Iowa
With 10.0% poverty level for males and 12.2% for females among the residents of Iowa, 18 to 24 year old males and 18 to 24 year old females are the most vulnerable to poverty, with 29,812 males (20.7%) and 38,084 females (28.1%) in their respective age groups living below the poverty level.
| Age Bracket | Male | Female |
| Under 5 Years | 13,883 (14.5%) | 12,881 (14.1%) |
| 5 Years | 2,993 (14.0%) | 2,567 (14.0%) |
| 6 to 11 Years | 15,939 (12.9%) | 15,044 (12.7%) |
| 12 to 14 Years | 8,114 (13.0%) | 6,961 (11.4%) |
| 15 Years | 2,618 (12.2%) | 2,422 (12.4%) |
| 16 and 17 Years | 4,798 (11.1%) | 5,233 (12.4%) |
| 18 to 24 Years | 29,812 (20.7%) | 38,084 (28.1%) |
| 25 to 34 Years | 16,714 (8.4%) | 25,861 (13.6%) |
| 35 to 44 Years | 15,137 (7.5%) | 20,349 (10.7%) |
| 45 to 54 Years | 13,546 (7.4%) | 14,197 (8.0%) |
| 55 to 64 Years | 16,120 (7.9%) | 18,617 (9.0%) |
| 65 to 74 Years | 8,753 (5.7%) | 12,107 (7.4%) |
| 75 Years and over | 5,796 (6.4%) | 14,595 (11.4%) |
| Total | 154,223 (10.0%) | 188,918 (12.2%) |
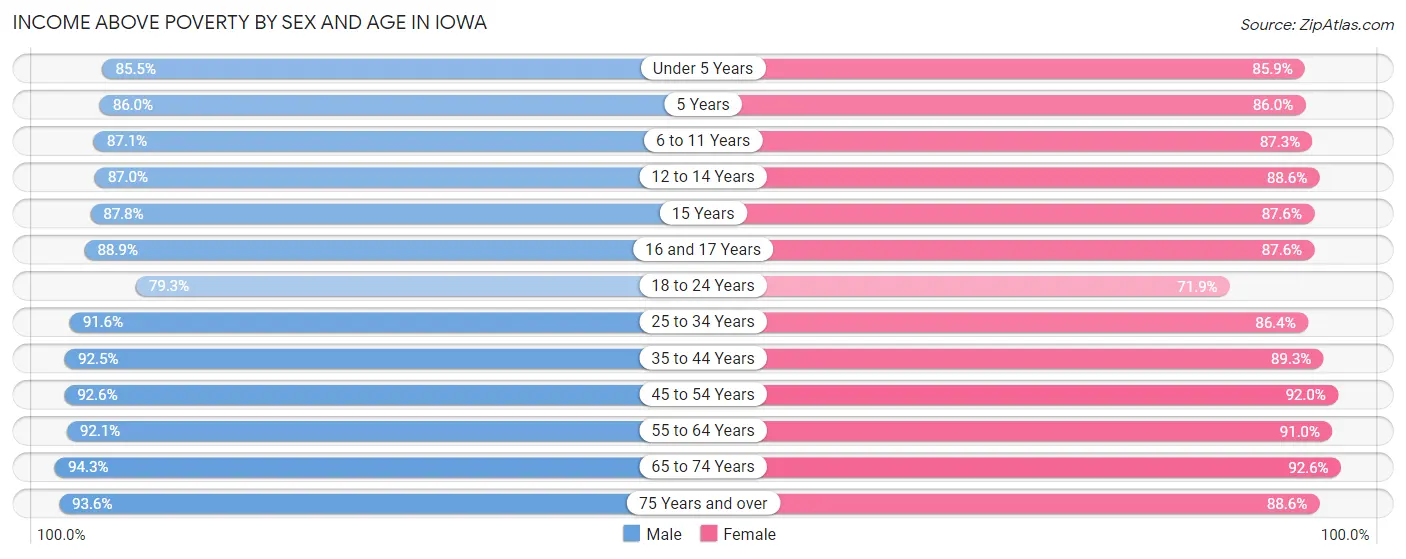
Income Above Poverty by Sex and Age in Iowa
According to the poverty statistics in Iowa, males aged 65 to 74 years and females aged 65 to 74 years are the age groups that are most secure financially, with 94.3% of males and 92.5% of females in these age groups living above the poverty line.
| Age Bracket | Male | Female |
| Under 5 Years | 81,899 (85.5%) | 78,501 (85.9%) |
| 5 Years | 18,429 (86.0%) | 15,731 (86.0%) |
| 6 to 11 Years | 107,874 (87.1%) | 103,103 (87.3%) |
| 12 to 14 Years | 54,194 (87.0%) | 53,949 (88.6%) |
| 15 Years | 18,833 (87.8%) | 17,092 (87.6%) |
| 16 and 17 Years | 38,350 (88.9%) | 37,049 (87.6%) |
| 18 to 24 Years | 114,514 (79.3%) | 97,659 (71.9%) |
| 25 to 34 Years | 182,446 (91.6%) | 164,914 (86.4%) |
| 35 to 44 Years | 185,889 (92.5%) | 170,536 (89.3%) |
| 45 to 54 Years | 170,603 (92.6%) | 164,263 (92.0%) |
| 55 to 64 Years | 189,089 (92.1%) | 187,367 (91.0%) |
| 65 to 74 Years | 145,330 (94.3%) | 150,295 (92.5%) |
| 75 Years and over | 84,737 (93.6%) | 113,212 (88.6%) |
| Total | 1,392,187 (90.0%) | 1,353,671 (87.7%) |
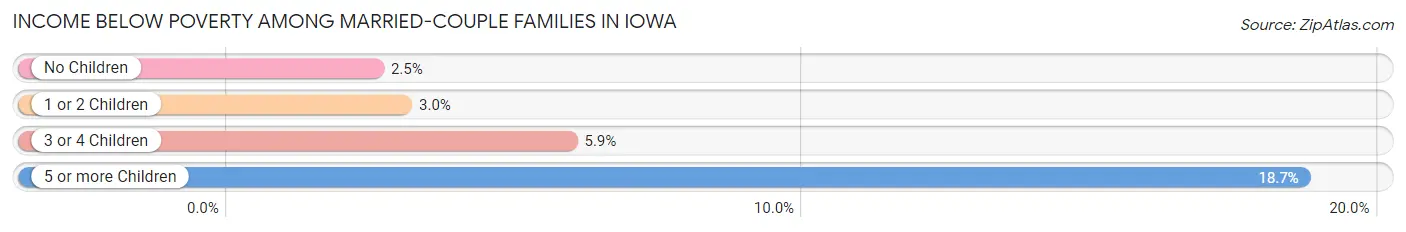
Income Below Poverty Among Married-Couple Families in Iowa
The poverty statistics for married-couple families in Iowa show that 3.2% or 19,892 of the total 630,424 families live below the poverty line. Families with 5 or more children have the highest poverty rate of 18.7%, comprising of 1,055 families. On the other hand, families with no children have the lowest poverty rate of 2.5%, which includes 9,648 families.
| Children | Above Poverty | Below Poverty |
| No Children | 370,517 (97.5%) | 9,648 (2.5%) |
| 1 or 2 Children | 177,542 (97.0%) | 5,552 (3.0%) |
| 3 or 4 Children | 57,877 (94.1%) | 3,637 (5.9%) |
| 5 or more Children | 4,596 (81.3%) | 1,055 (18.7%) |
| Total | 610,532 (96.8%) | 19,892 (3.2%) |
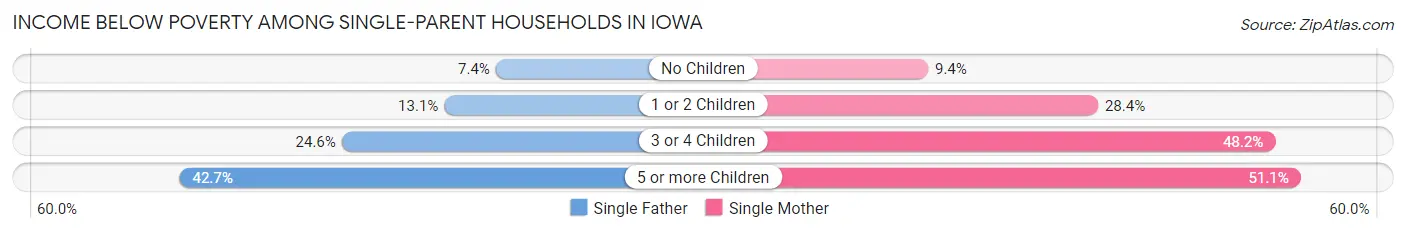
Income Below Poverty Among Single-Parent Households in Iowa
According to the poverty data in Iowa, 12.4% or 6,852 single-father households and 25.4% or 29,873 single-mother households are living below the poverty line. Among single-father households, those with 5 or more children have the highest poverty rate, with 137 households (42.7%) experiencing poverty. Likewise, among single-mother households, those with 5 or more children have the highest poverty rate, with 697 households (51.1%) falling below the poverty line.
| Children | Single Father | Single Mother |
| No Children | 1,450 (7.3%) | 3,359 (9.4%) |
| 1 or 2 Children | 3,921 (13.1%) | 18,614 (28.4%) |
| 3 or 4 Children | 1,344 (24.6%) | 7,203 (48.2%) |
| 5 or more Children | 137 (42.7%) | 697 (51.1%) |
| Total | 6,852 (12.4%) | 29,873 (25.4%) |
Income Below Poverty Among Married-Couple vs Single-Parent Households in Iowa
The poverty data for Iowa shows that 19,892 of the married-couple family households (3.2%) and 36,725 of the single-parent households (21.2%) are living below the poverty level. Within the married-couple family households, those with 5 or more children have the highest poverty rate, with 1,055 households (18.7%) falling below the poverty line. Among the single-parent households, those with 5 or more children have the highest poverty rate, with 834 household (49.5%) living below poverty.
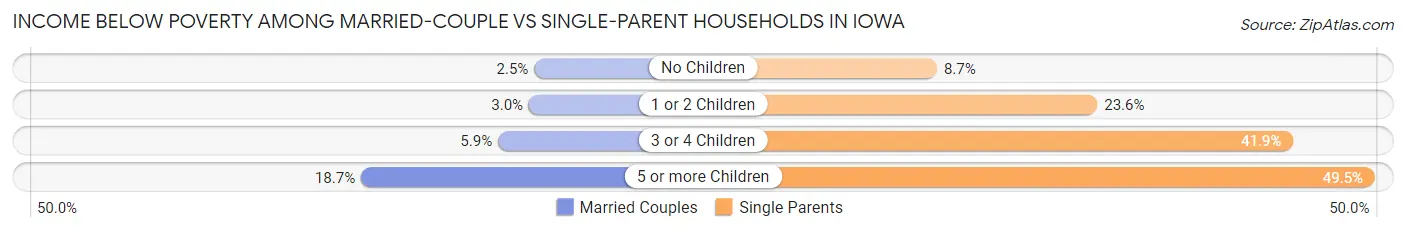
| Children | Married-Couple Families | Single-Parent Households |
| No Children | 9,648 (2.5%) | 4,809 (8.7%) |
| 1 or 2 Children | 5,552 (3.0%) | 22,535 (23.6%) |
| 3 or 4 Children | 3,637 (5.9%) | 8,547 (41.9%) |
| 5 or more Children | 1,055 (18.7%) | 834 (49.5%) |
| Total | 19,892 (3.2%) | 36,725 (21.2%) |
Largest Zip Codes by Population in Iowa
The largest zip codes in Iowa by population are 50023 (45,195), 50613 (43,732), 52001 (42,895), 52302 (42,803), and 52402 (42,648).
1.50023
45,195 (1.42%)
2.50613
43,732 (1.37%)
3.52001
42,895 (1.35%)
4.52302
42,803 (1.34%)
5.52402
42,648 (1.34%)
6.52404
41,433 (1.30%)
7.52722
40,639 (1.27%)
8.51503
37,081 (1.16%)
9.52240
36,475 (1.14%)
10.50315
36,355 (1.14%)
11.50266
35,508 (1.11%)
12.50317
35,466 (1.11%)
13.51501
35,400 (1.11%)
14.50010
33,397 (1.05%)
15.50265
33,222 (1.04%)
16.50310
31,976 (1.00%)
17.50322
31,917 (1.00%)
18.50014
31,376 (0.98%)
19.50158
31,047 (0.97%)
20.52501
30,535 (0.96%)
21.52761
30,357 (0.95%)
22.50701
30,128 (0.94%)
23.50401
28,909 (0.91%)
24.50501
28,530 (0.89%)
25.52806
27,733 (0.87%)
26.51106
27,652 (0.87%)
27.52601
27,592 (0.87%)
28.50021
27,375 (0.86%)
29.52804
26,812 (0.84%)
30.52405
26,259 (0.82%)
Largest Cities by Population in Iowa
The largest cities in Iowa by population are Des Moines (213,164), Cedar Rapids (136,929), Davenport (101,448), Sioux City (85,469), and Iowa City (74,878).
213,164 (6.68%)
136,929 (4.29%)
101,448 (3.18%)
85,469 (2.68%)
74,878 (2.35%)
68,744 (2.16%)
7.Ankeny
68,392 (2.14%)
8.Waterloo
67,256 (2.11%)
9.Ames
66,265 (2.08%)
62,670 (1.97%)
11.Dubuque
59,315 (1.86%)
12.Urbandale
45,591 (1.43%)
13.Marion
41,401 (1.30%)
14.Cedar Falls
40,686 (1.28%)
15.Bettendorf
38,997 (1.22%)
16.Marshalltown
27,511 (0.86%)
17.Mason City
27,271 (0.86%)
18.Ottumwa
25,359 (0.80%)
19.Waukee
25,045 (0.79%)
20.Fort Dodge
24,850 (0.78%)
21.Clinton
24,524 (0.77%)
22.Burlington
23,976 (0.75%)
23.Johnston
23,856 (0.75%)
24.Muscatine
23,671 (0.74%)
25.Coralville
22,494 (0.71%)
20,393 (0.64%)
27.Altoona
20,017 (0.63%)
28.Clive
18,576 (0.58%)
29.Indianola
15,845 (0.50%)
30.Newton
15,692 (0.49%)
Largest Counties by Population in Iowa
The largest counties in Iowa by population are Polk County (493,378), Linn County (229,308), Scott County (174,315), Johnson County (153,360), and Black Hawk County (131,041).
493,378 (15.47%)
229,308 (7.19%)
174,315 (5.47%)
153,360 (4.81%)
131,041 (4.11%)
105,526 (3.31%)
100,367 (3.15%)
98,812 (3.10%)
98,573 (3.09%)
93,543 (2.93%)
52,709 (1.65%)
46,488 (1.46%)
42,979 (1.35%)
42,968 (1.35%)
40,049 (1.26%)
38,824 (1.22%)
37,808 (1.19%)
36,986 (1.16%)
19.Sioux County
35,815 (1.12%)
35,292 (1.11%)
33,487 (1.05%)
22.Lee County
33,442 (1.05%)
23.Boone County
26,700 (0.84%)
25,652 (0.80%)
25,621 (0.80%)
25,012 (0.78%)
22,534 (0.71%)
22,059 (0.69%)
29.Jones County
20,733 (0.65%)
20,728 (0.65%)
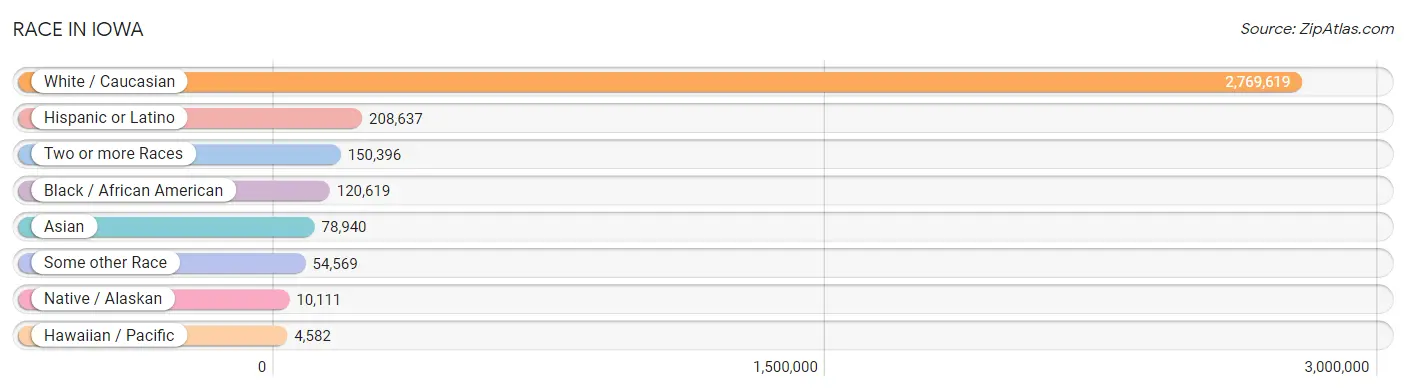
Race in Iowa
The most populous races in Iowa are White / Caucasian (2,769,619 | 86.9%), Hispanic or Latino (208,637 | 6.5%), and Two or more Races (150,396 | 4.7%).
| Race | # Population | % Population |
| Asian | 78,940 | 2.5% |
| Black / African American | 120,619 | 3.8% |
| Hawaiian / Pacific | 4,582 | 0.1% |
| Hispanic or Latino | 208,637 | 6.5% |
| Native / Alaskan | 10,111 | 0.3% |
| White / Caucasian | 2,769,619 | 86.9% |
| Two or more Races | 150,396 | 4.7% |
| Some other Race | 54,569 | 1.7% |
| Total | 3,188,836 | 100.0% |
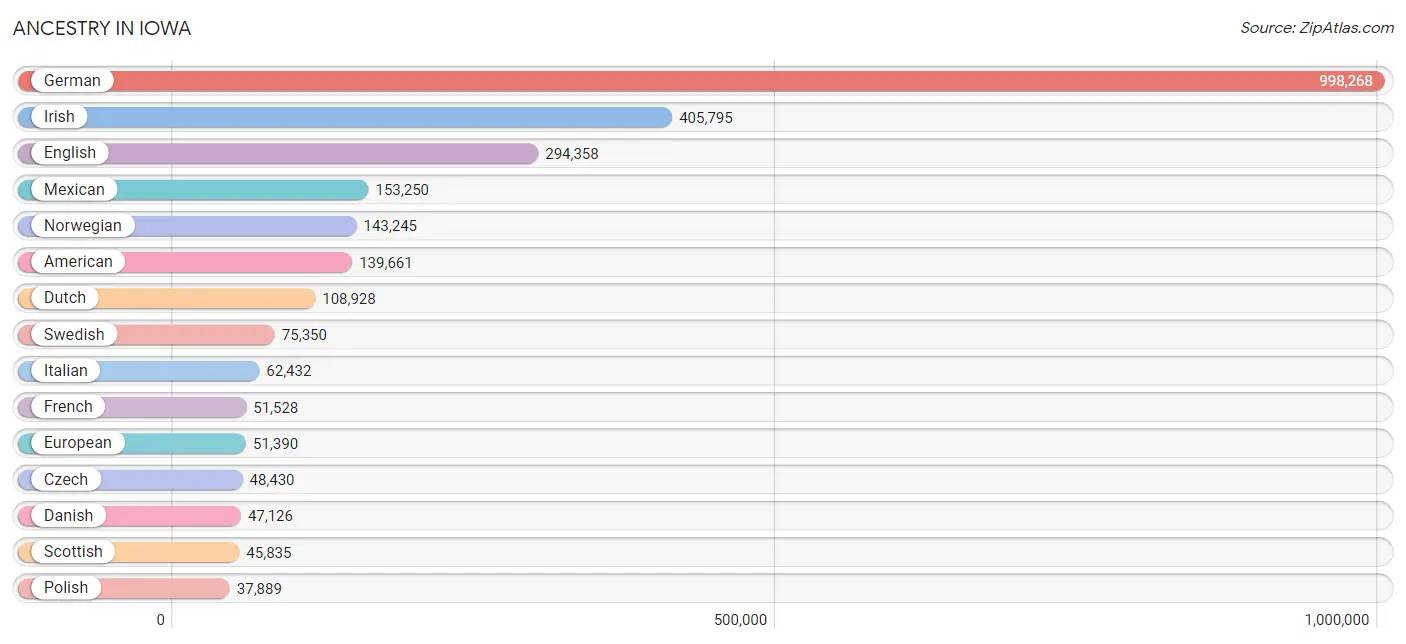
Ancestry in Iowa
The most populous ancestries reported in Iowa are German (998,268 | 31.3%), Irish (405,795 | 12.7%), English (294,358 | 9.2%), Mexican (153,250 | 4.8%), and Norwegian (143,245 | 4.5%), together accounting for 62.6% of all Iowa residents.
| Ancestry | # Population | % Population |
| Afghan | 766 | 0.0% |
| African | 13,713 | 0.4% |
| Alaska Native | 64 | 0.0% |
| Alaskan Athabascan | 60 | 0.0% |
| Albanian | 456 | 0.0% |
| Aleut | 15 | 0.0% |
| Alsatian | 7 | 0.0% |
| American | 139,661 | 4.4% |
| Apache | 545 | 0.0% |
| Arab | 10,232 | 0.3% |
| Arapaho | 8 | 0.0% |
| Argentinean | 295 | 0.0% |
| Armenian | 423 | 0.0% |
| Assyrian / Chaldean / Syriac | 56 | 0.0% |
| Australian | 574 | 0.0% |
| Austrian | 4,003 | 0.1% |
| Bahamian | 28 | 0.0% |
| Bangladeshi | 1,274 | 0.0% |
| Barbadian | 17 | 0.0% |
| Basque | 57 | 0.0% |
| Belgian | 7,259 | 0.2% |
| Belizean | 26 | 0.0% |
| Bhutanese | 4,118 | 0.1% |
| Blackfeet | 1,004 | 0.0% |
| Bolivian | 423 | 0.0% |
| Brazilian | 978 | 0.0% |
| British | 14,209 | 0.4% |
| British West Indian | 53 | 0.0% |
| Bulgarian | 486 | 0.0% |
| Burmese | 10,712 | 0.3% |
| Cajun | 110 | 0.0% |
| Cambodian | 219 | 0.0% |
| Canadian | 2,711 | 0.1% |
| Cape Verdean | 10 | 0.0% |
| Celtic | 419 | 0.0% |
| Central American | 23,933 | 0.7% |
| Central American Indian | 1,107 | 0.0% |
| Cherokee | 4,979 | 0.2% |
| Cheyenne | 249 | 0.0% |
| Chickasaw | 180 | 0.0% |
| Chilean | 510 | 0.0% |
| Chippewa | 722 | 0.0% |
| Choctaw | 789 | 0.0% |
| Colombian | 2,147 | 0.1% |
| Colville | 1 | 0.0% |
| Comanche | 208 | 0.0% |
| Costa Rican | 369 | 0.0% |
| Cree | 88 | 0.0% |
| Creek | 151 | 0.0% |
| Croatian | 3,255 | 0.1% |
| Crow | 71 | 0.0% |
| Cuban | 3,397 | 0.1% |
| Cypriot | 31 | 0.0% |
| Czech | 48,430 | 1.5% |
| Czechoslovakian | 4,533 | 0.1% |
| Danish | 47,126 | 1.5% |
| Delaware | 27 | 0.0% |
| Dominican | 1,168 | 0.0% |
| Dutch | 108,928 | 3.4% |
| Dutch West Indian | 17 | 0.0% |
| Eastern European | 4,292 | 0.1% |
| Ecuadorian | 891 | 0.0% |
| Egyptian | 1,006 | 0.0% |
| English | 294,358 | 9.2% |
| Estonian | 105 | 0.0% |
| Ethiopian | 2,151 | 0.1% |
| European | 51,390 | 1.6% |
| Fijian | 1,139 | 0.0% |
| Filipino | 386 | 0.0% |
| Finnish | 2,505 | 0.1% |
| French | 51,528 | 1.6% |
| French American Indian | 187 | 0.0% |
| French Canadian | 6,517 | 0.2% |
| German | 998,268 | 31.3% |
| German Russian | 95 | 0.0% |
| Ghanaian | 779 | 0.0% |
| Greek | 5,736 | 0.2% |
| Guamanian / Chamorro | 542 | 0.0% |
| Guatemalan | 10,561 | 0.3% |
| Guyanese | 102 | 0.0% |
| Haitian | 1,167 | 0.0% |
| Hmong | 1 | 0.0% |
| Honduran | 2,942 | 0.1% |
| Hopi | 38 | 0.0% |
| Houma | 6 | 0.0% |
| Hungarian | 3,666 | 0.1% |
| Icelander | 604 | 0.0% |
| Indian (Asian) | 15,279 | 0.5% |
| Indonesian | 7,226 | 0.2% |
| Inupiat | 252 | 0.0% |
| Iranian | 1,156 | 0.0% |
| Iraqi | 1,097 | 0.0% |
| Irish | 405,795 | 12.7% |
| Iroquois | 300 | 0.0% |
| Israeli | 272 | 0.0% |
| Italian | 62,432 | 2.0% |
| Jamaican | 1,543 | 0.1% |
| Japanese | 1,483 | 0.1% |
| Jordanian | 314 | 0.0% |
| Kenyan | 740 | 0.0% |
| Kiowa | 78 | 0.0% |
| Korean | 11,236 | 0.4% |
| Laotian | 470 | 0.0% |
| Latvian | 512 | 0.0% |
| Lebanese | 3,394 | 0.1% |
| Liberian | 3,682 | 0.1% |
| Lithuanian | 2,232 | 0.1% |
| Lumbee | 9 | 0.0% |
| Luxembourger | 5,295 | 0.2% |
| Macedonian | 235 | 0.0% |
| Malaysian | 7,331 | 0.2% |
| Maltese | 70 | 0.0% |
| Marshallese | 355 | 0.0% |
| Menominee | 37 | 0.0% |
| Mexican | 153,250 | 4.8% |
| Mexican American Indian | 1,819 | 0.1% |
| Mongolian | 357 | 0.0% |
| Moroccan | 657 | 0.0% |
| Native Hawaiian | 1,650 | 0.1% |
| Navajo | 697 | 0.0% |
| New Zealander | 127 | 0.0% |
| Nicaraguan | 836 | 0.0% |
| Nigerian | 1,590 | 0.1% |
| Northern European | 6,279 | 0.2% |
| Norwegian | 143,245 | 4.5% |
| Okinawan | 45 | 0.0% |
| Osage | 140 | 0.0% |
| Ottawa | 30 | 0.0% |
| Paiute | 41 | 0.0% |
| Pakistani | 2,787 | 0.1% |
| Palestinian | 445 | 0.0% |
| Panamanian | 667 | 0.0% |
| Paraguayan | 34 | 0.0% |
| Pennsylvania German | 3,041 | 0.1% |
| Peruvian | 1,004 | 0.0% |
| Pima | 13 | 0.0% |
| Polish | 37,889 | 1.2% |
| Portuguese | 1,779 | 0.1% |
| Potawatomi | 102 | 0.0% |
| Pueblo | 89 | 0.0% |
| Puerto Rican | 9,151 | 0.3% |
| Puget Sound Salish | 7 | 0.0% |
| Romanian | 1,464 | 0.1% |
| Russian | 8,417 | 0.3% |
| Salvadoran | 8,409 | 0.3% |
| Samoan | 674 | 0.0% |
| Scandinavian | 16,277 | 0.5% |
| Scotch-Irish | 20,955 | 0.7% |
| Scottish | 45,835 | 1.4% |
| Seminole | 85 | 0.0% |
| Senegalese | 149 | 0.0% |
| Serbian | 872 | 0.0% |
| Shoshone | 11 | 0.0% |
| Sierra Leonean | 65 | 0.0% |
| Sioux | 3,336 | 0.1% |
| Slavic | 790 | 0.0% |
| Slovak | 1,563 | 0.1% |
| Slovene | 630 | 0.0% |
| Somali | 1,664 | 0.1% |
| South African | 408 | 0.0% |
| South American | 6,200 | 0.2% |
| South American Indian | 141 | 0.0% |
| Spaniard | 2,382 | 0.1% |
| Spanish | 2,312 | 0.1% |
| Spanish American | 50 | 0.0% |
| Spanish American Indian | 40 | 0.0% |
| Sri Lankan | 11,650 | 0.4% |
| Subsaharan African | 36,995 | 1.2% |
| Sudanese | 6,802 | 0.2% |
| Swedish | 75,350 | 2.4% |
| Swiss | 14,259 | 0.4% |
| Syrian | 782 | 0.0% |
| Taiwanese | 17 | 0.0% |
| Thai | 17,300 | 0.5% |
| Tlingit-Haida | 43 | 0.0% |
| Tohono O'Odham | 4 | 0.0% |
| Tongan | 123 | 0.0% |
| Trinidadian and Tobagonian | 100 | 0.0% |
| Turkish | 489 | 0.0% |
| Ugandan | 122 | 0.0% |
| Ukrainian | 2,825 | 0.1% |
| Uruguayan | 67 | 0.0% |
| Ute | 27 | 0.0% |
| Venezuelan | 716 | 0.0% |
| Vietnamese | 582 | 0.0% |
| Welsh | 18,991 | 0.6% |
| West Indian | 332 | 0.0% |
| Yakama | 18 | 0.0% |
| Yaqui | 117 | 0.0% |
| Yugoslavian | 7,652 | 0.2% |
| Yuman | 7 | 0.0% |
| Yup'ik | 27 | 0.0% |
| Zimbabwean | 151 | 0.0% | View All 193 Rows |
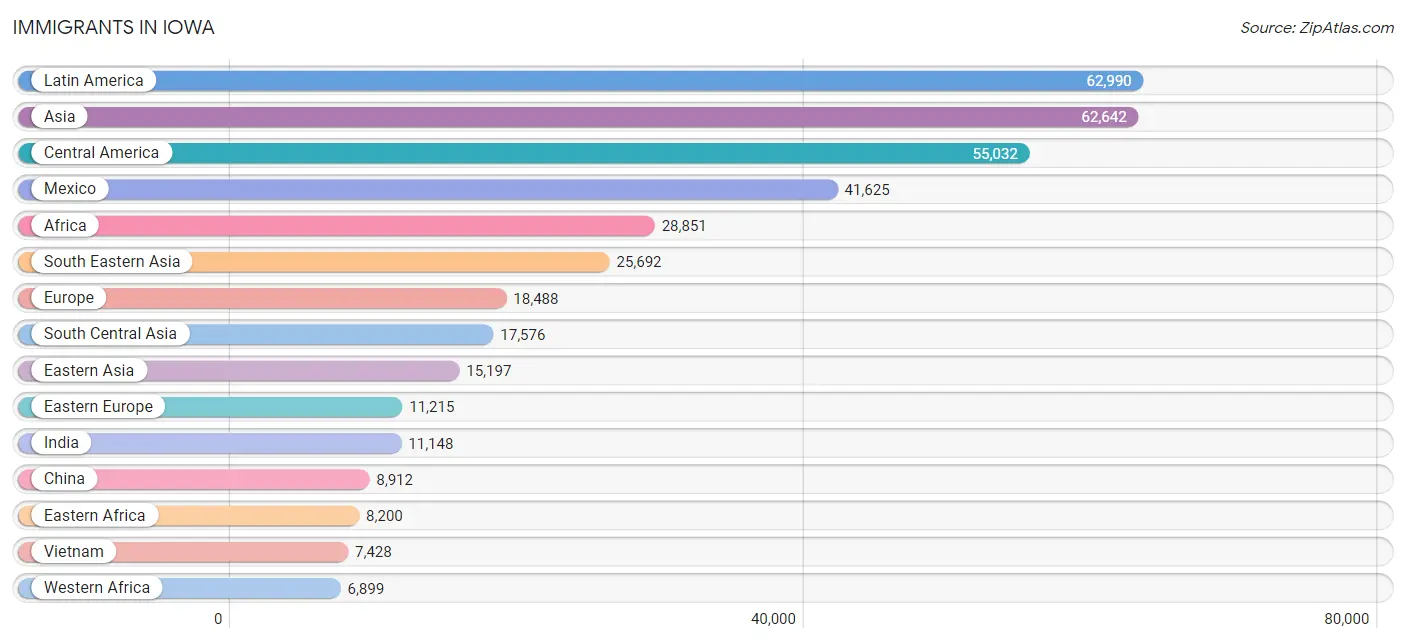
Immigrants in Iowa
The most numerous immigrant groups reported in Iowa came from Latin America (62,990 | 2.0%), Asia (62,642 | 2.0%), Central America (55,032 | 1.7%), Mexico (41,625 | 1.3%), and Africa (28,851 | 0.9%), together accounting for 7.9% of all Iowa residents.
| Immigration Origin | # Population | % Population |
| Afghanistan | 575 | 0.0% |
| Africa | 28,851 | 0.9% |
| Albania | 22 | 0.0% |
| Argentina | 201 | 0.0% |
| Armenia | 63 | 0.0% |
| Asia | 62,642 | 2.0% |
| Australia | 397 | 0.0% |
| Austria | 96 | 0.0% |
| Azores | 6 | 0.0% |
| Bahamas | 48 | 0.0% |
| Bangladesh | 768 | 0.0% |
| Barbados | 8 | 0.0% |
| Belarus | 50 | 0.0% |
| Belgium | 66 | 0.0% |
| Belize | 19 | 0.0% |
| Bolivia | 13 | 0.0% |
| Bosnia and Herzegovina | 5,751 | 0.2% |
| Brazil | 1,326 | 0.0% |
| Bulgaria | 309 | 0.0% |
| Cambodia | 441 | 0.0% |
| Cameroon | 269 | 0.0% |
| Canada | 2,873 | 0.1% |
| Caribbean | 3,270 | 0.1% |
| Central America | 55,032 | 1.7% |
| Chile | 254 | 0.0% |
| China | 8,912 | 0.3% |
| Colombia | 1,227 | 0.0% |
| Congo | 1,507 | 0.1% |
| Costa Rica | 129 | 0.0% |
| Croatia | 377 | 0.0% |
| Cuba | 1,342 | 0.0% |
| Czechoslovakia | 153 | 0.0% |
| Denmark | 59 | 0.0% |
| Dominican Republic | 455 | 0.0% |
| Eastern Africa | 8,200 | 0.3% |
| Eastern Asia | 15,197 | 0.5% |
| Eastern Europe | 11,215 | 0.4% |
| Ecuador | 381 | 0.0% |
| Egypt | 980 | 0.0% |
| El Salvador | 4,967 | 0.2% |
| England | 827 | 0.0% |
| Eritrea | 898 | 0.0% |
| Ethiopia | 1,858 | 0.1% |
| Europe | 18,488 | 0.6% |
| France | 121 | 0.0% |
| Germany | 2,525 | 0.1% |
| Ghana | 615 | 0.0% |
| Greece | 227 | 0.0% |
| Guatemala | 5,672 | 0.2% |
| Guyana | 178 | 0.0% |
| Haiti | 788 | 0.0% |
| Honduras | 1,803 | 0.1% |
| Hong Kong | 283 | 0.0% |
| Hungary | 101 | 0.0% |
| India | 11,148 | 0.4% |
| Indonesia | 437 | 0.0% |
| Iran | 602 | 0.0% |
| Iraq | 1,510 | 0.1% |
| Ireland | 126 | 0.0% |
| Israel | 147 | 0.0% |
| Italy | 405 | 0.0% |
| Jamaica | 303 | 0.0% |
| Japan | 920 | 0.0% |
| Jordan | 521 | 0.0% |
| Kazakhstan | 67 | 0.0% |
| Kenya | 1,188 | 0.0% |
| Korea | 5,155 | 0.2% |
| Kuwait | 162 | 0.0% |
| Laos | 3,682 | 0.1% |
| Latin America | 62,990 | 2.0% |
| Latvia | 213 | 0.0% |
| Lebanon | 713 | 0.0% |
| Liberia | 2,949 | 0.1% |
| Lithuania | 104 | 0.0% |
| Malaysia | 750 | 0.0% |
| Mexico | 41,625 | 1.3% |
| Micronesia | 1,305 | 0.0% |
| Middle Africa | 5,594 | 0.2% |
| Moldova | 137 | 0.0% |
| Morocco | 500 | 0.0% |
| Nepal | 1,209 | 0.0% |
| Netherlands | 471 | 0.0% |
| Nicaragua | 412 | 0.0% |
| Nigeria | 1,204 | 0.0% |
| North Macedonia | 213 | 0.0% |
| Northern Africa | 6,003 | 0.2% |
| Northern Europe | 2,528 | 0.1% |
| Norway | 193 | 0.0% |
| Oceania | 2,576 | 0.1% |
| Pakistan | 1,157 | 0.0% |
| Panama | 295 | 0.0% |
| Peru | 442 | 0.0% |
| Philippines | 4,675 | 0.2% |
| Poland | 520 | 0.0% |
| Portugal | 60 | 0.0% |
| Romania | 366 | 0.0% |
| Russia | 1,425 | 0.0% |
| Saudi Arabia | 370 | 0.0% |
| Scotland | 130 | 0.0% |
| Senegal | 117 | 0.0% |
| Serbia | 78 | 0.0% |
| Sierra Leone | 233 | 0.0% |
| Singapore | 147 | 0.0% |
| Somalia | 862 | 0.0% |
| South Africa | 719 | 0.0% |
| South America | 4,688 | 0.2% |
| South Central Asia | 17,576 | 0.5% |
| South Eastern Asia | 25,692 | 0.8% |
| Southern Europe | 1,316 | 0.0% |
| Spain | 603 | 0.0% |
| Sri Lanka | 470 | 0.0% |
| St. Vincent and the Grenadines | 1 | 0.0% |
| Sudan | 4,084 | 0.1% |
| Sweden | 321 | 0.0% |
| Switzerland | 74 | 0.0% |
| Syria | 57 | 0.0% |
| Taiwan | 435 | 0.0% |
| Thailand | 3,595 | 0.1% |
| Trinidad and Tobago | 83 | 0.0% |
| Turkey | 287 | 0.0% |
| Uganda | 179 | 0.0% |
| Ukraine | 816 | 0.0% |
| Uruguay | 180 | 0.0% |
| Uzbekistan | 73 | 0.0% |
| Venezuela | 440 | 0.0% |
| Vietnam | 7,428 | 0.2% |
| West Indies | 124 | 0.0% |
| Western Africa | 6,899 | 0.2% |
| Western Asia | 4,156 | 0.1% |
| Western Europe | 3,398 | 0.1% |
| Yemen | 24 | 0.0% |
| Zaire | 3,735 | 0.1% |
| Zimbabwe | 131 | 0.0% | View All 133 Rows |
Sex and Age in Iowa
Sex and Age in Iowa
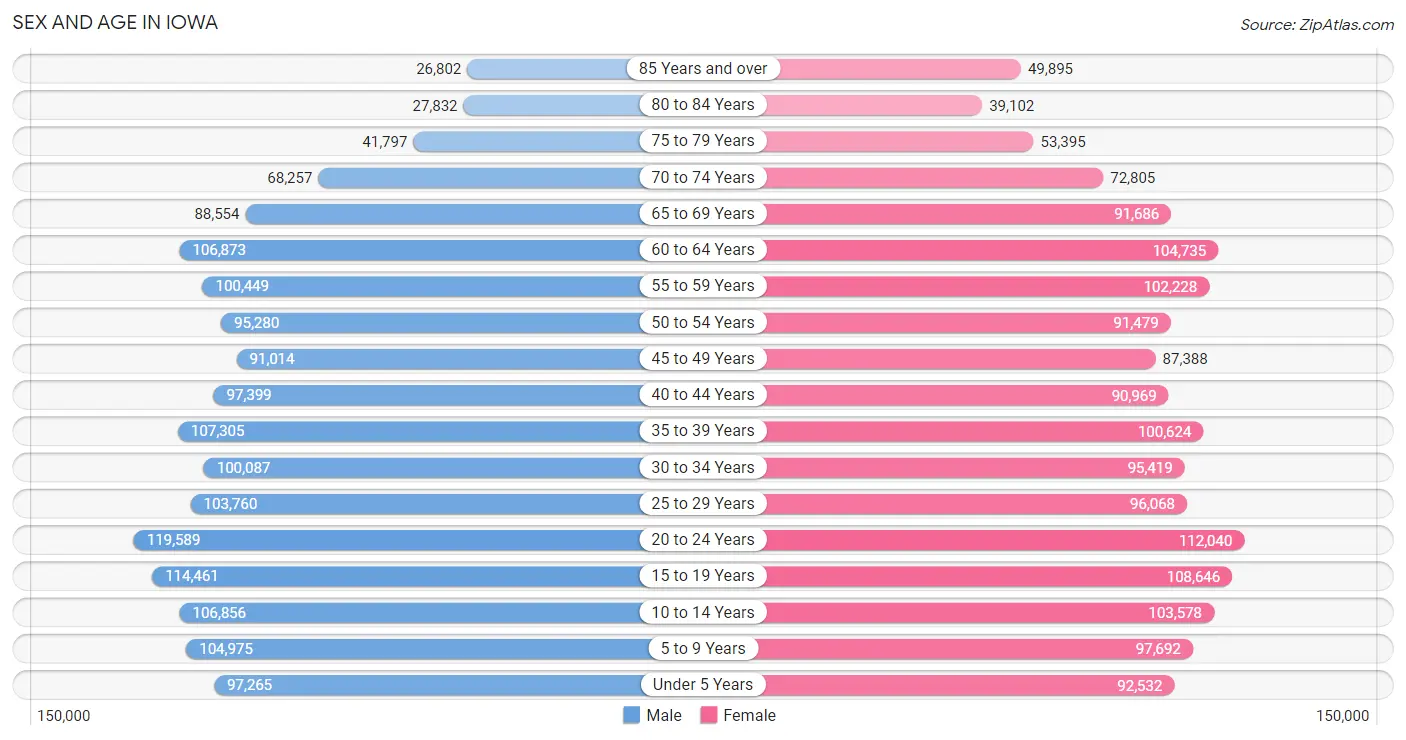
The most populous age groups in Iowa are 20 to 24 Years (119,589 | 7.5%) for men and 20 to 24 Years (112,040 | 7.0%) for women.
| Age Bracket | Male | Female |
| Under 5 Years | 97,265 (6.1%) | 92,532 (5.8%) |
| 5 to 9 Years | 104,975 (6.6%) | 97,692 (6.1%) |
| 10 to 14 Years | 106,856 (6.7%) | 103,578 (6.5%) |
| 15 to 19 Years | 114,461 (7.2%) | 108,646 (6.8%) |
| 20 to 24 Years | 119,589 (7.5%) | 112,040 (7.0%) |
| 25 to 29 Years | 103,760 (6.5%) | 96,068 (6.0%) |
| 30 to 34 Years | 100,087 (6.3%) | 95,419 (6.0%) |
| 35 to 39 Years | 107,305 (6.7%) | 100,624 (6.3%) |
| 40 to 44 Years | 97,399 (6.1%) | 90,969 (5.7%) |
| 45 to 49 Years | 91,014 (5.7%) | 87,388 (5.5%) |
| 50 to 54 Years | 95,280 (6.0%) | 91,479 (5.8%) |
| 55 to 59 Years | 100,449 (6.3%) | 102,228 (6.4%) |
| 60 to 64 Years | 106,873 (6.7%) | 104,735 (6.6%) |
| 65 to 69 Years | 88,554 (5.5%) | 91,686 (5.8%) |
| 70 to 74 Years | 68,257 (4.3%) | 72,805 (4.6%) |
| 75 to 79 Years | 41,797 (2.6%) | 53,395 (3.4%) |
| 80 to 84 Years | 27,832 (1.7%) | 39,102 (2.5%) |
| 85 Years and over | 26,802 (1.7%) | 49,895 (3.1%) |
| Total | 1,598,555 (100.0%) | 1,590,281 (100.0%) |
Families and Households in Iowa
Median Family Size in Iowa
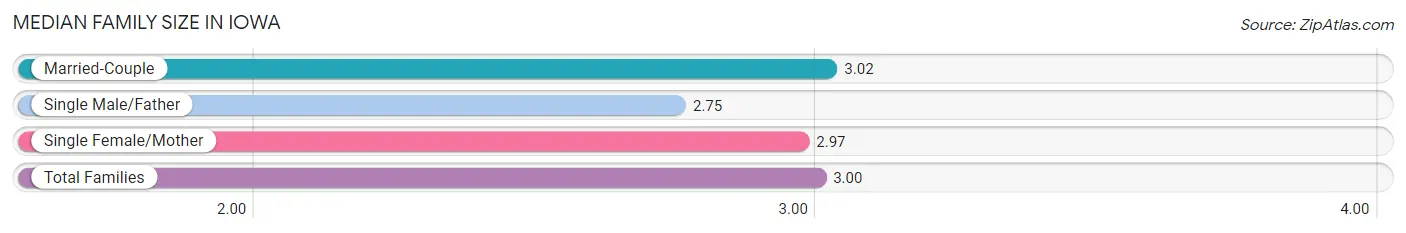
The median family size in Iowa is 3.00 persons per family, with married-couple families (630,424 | 78.5%) accounting for the largest median family size of 3.02 persons per family. On the other hand, single male/father families (55,449 | 6.9%) represent the smallest median family size with 2.75 persons per family.
| Family Type | # Families | Family Size |
| Married-Couple | 630,424 (78.5%) | 3.02 |
| Single Male/Father | 55,449 (6.9%) | 2.75 |
| Single Female/Mother | 117,403 (14.6%) | 2.97 |
| Total Families | 803,276 (100.0%) | 3.00 |
Median Household Size in Iowa
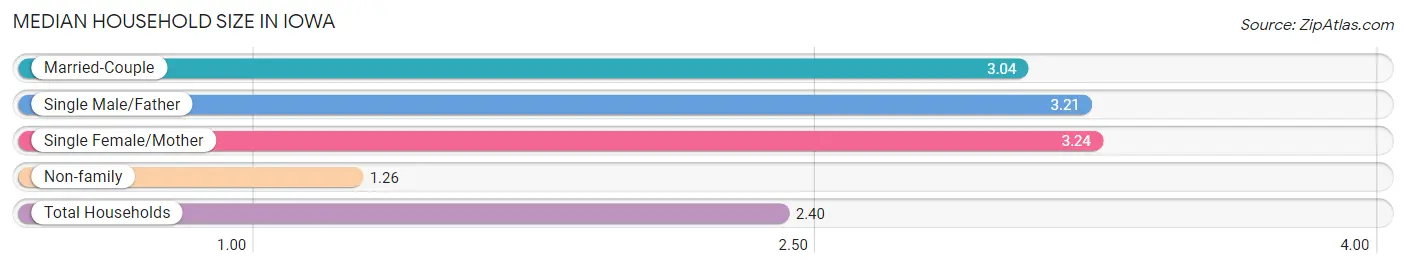
The median household size in Iowa is 2.40 persons per household, with single female/mother households (117,403 | 9.1%) accounting for the largest median household size of 3.24 persons per household. non-family households (486,863 | 37.7%) represent the smallest median household size with 1.26 persons per household.
| Household Type | # Households | Household Size |
| Married-Couple | 630,424 (48.9%) | 3.04 |
| Single Male/Father | 55,449 (4.3%) | 3.21 |
| Single Female/Mother | 117,403 (9.1%) | 3.24 |
| Non-family | 486,863 (37.7%) | 1.26 |
| Total Households | 1,290,139 (100.0%) | 2.40 |
Household Size by Marriage Status in Iowa
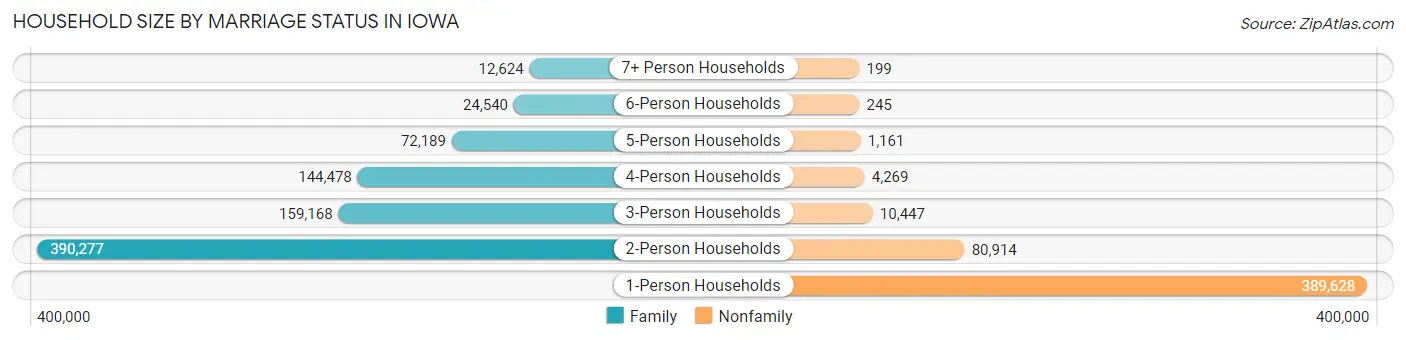
Out of a total of 1,290,139 households in Iowa, 803,276 (62.3%) are family households, while 486,863 (37.7%) are nonfamily households. The most numerous type of family households are 2-person households, comprising 390,277, and the most common type of nonfamily households are 1-person households, comprising 389,628.
| Household Size | Family Households | Nonfamily Households |
| 1-Person Households | - | 389,628 (30.2%) |
| 2-Person Households | 390,277 (30.2%) | 80,914 (6.3%) |
| 3-Person Households | 159,168 (12.3%) | 10,447 (0.8%) |
| 4-Person Households | 144,478 (11.2%) | 4,269 (0.3%) |
| 5-Person Households | 72,189 (5.6%) | 1,161 (0.1%) |
| 6-Person Households | 24,540 (1.9%) | 245 (0.0%) |
| 7+ Person Households | 12,624 (1.0%) | 199 (0.0%) |
| Total | 803,276 (62.3%) | 486,863 (37.7%) |
Female Fertility in Iowa
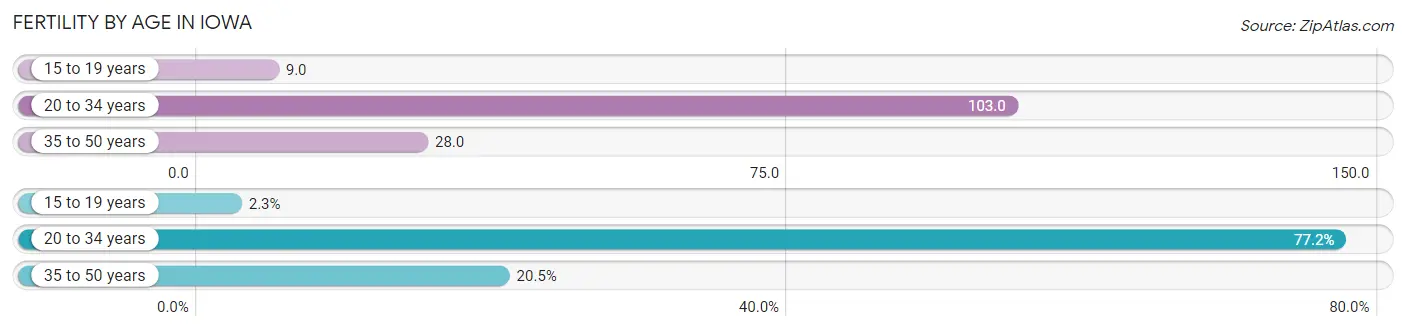
Fertility by Age in Iowa
Average fertility rate in Iowa is 57.0 births per 1,000 women. Women in the age bracket of 20 to 34 years have the highest fertility rate with 103.0 births per 1,000 women. Women in the age bracket of 20 to 34 years acount for 77.2% of all women with births.
| Age Bracket | Women with Births | Births / 1,000 Women |
| 15 to 19 years | 926 (2.3%) | 9.0 |
| 20 to 34 years | 31,225 (77.2%) | 103.0 |
| 35 to 50 years | 8,273 (20.5%) | 28.0 |
| Total | 40,424 (100.0%) | 57.0 |
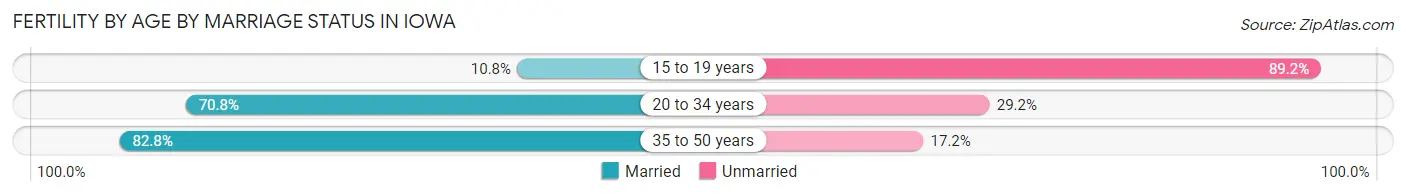
Fertility by Age by Marriage Status in Iowa
71.9% of women with births (40,424) in Iowa are married. The highest percentage of unmarried women with births falls into 15 to 19 years age bracket with 89.2% of them unmarried at the time of birth, while the lowest percentage of unmarried women with births belong to 35 to 50 years age bracket with 17.2% of them unmarried.
| Age Bracket | Married | Unmarried |
| 15 to 19 years | 100 (10.8%) | 826 (89.2%) |
| 20 to 34 years | 22,107 (70.8%) | 9,118 (29.2%) |
| 35 to 50 years | 6,850 (82.8%) | 1,423 (17.2%) |
| Total | 29,065 (71.9%) | 11,359 (28.1%) |
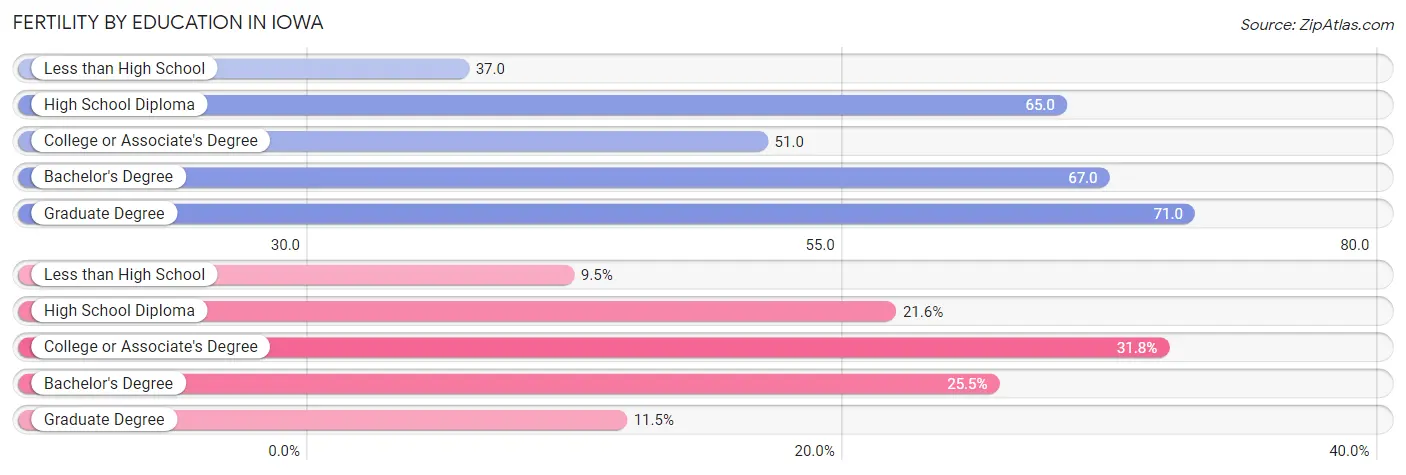
Fertility by Education in Iowa
Average fertility rate in Iowa is 57.0 births per 1,000 women. Women with the education attainment of graduate degree have the highest fertility rate of 71.0 births per 1,000 women, while women with the education attainment of less than high school have the lowest fertility at 37.0 births per 1,000 women. Women with the education attainment of college or associate's degree represent 31.8% of all women with births.
| Educational Attainment | Women with Births | Births / 1,000 Women |
| Less than High School | 3,858 (9.5%) | 37.0 |
| High School Diploma | 8,735 (21.6%) | 65.0 |
| College or Associate's Degree | 12,872 (31.8%) | 51.0 |
| Bachelor's Degree | 10,302 (25.5%) | 67.0 |
| Graduate Degree | 4,657 (11.5%) | 71.0 |
| Total | 40,424 (100.0%) | 57.0 |
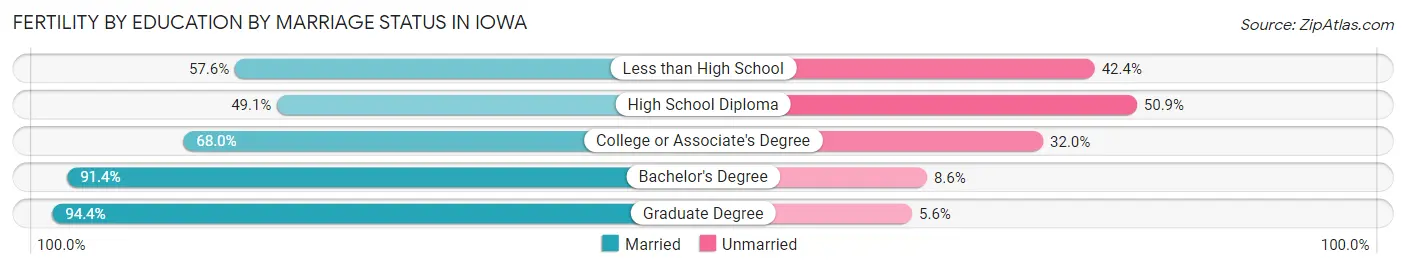
Fertility by Education by Marriage Status in Iowa
28.1% of women with births in Iowa are unmarried. Women with the educational attainment of graduate degree are most likely to be married with 94.4% of them married at childbirth, while women with the educational attainment of high school diploma are least likely to be married with 50.9% of them unmarried at childbirth.
| Educational Attainment | Married | Unmarried |
| Less than High School | 2,222 (57.6%) | 1,636 (42.4%) |
| High School Diploma | 4,289 (49.1%) | 4,446 (50.9%) |
| College or Associate's Degree | 8,753 (68.0%) | 4,119 (32.0%) |
| Bachelor's Degree | 9,416 (91.4%) | 886 (8.6%) |
| Graduate Degree | 4,396 (94.4%) | 261 (5.6%) |
| Total | 29,065 (71.9%) | 11,359 (28.1%) |
Employment Characteristics in Iowa
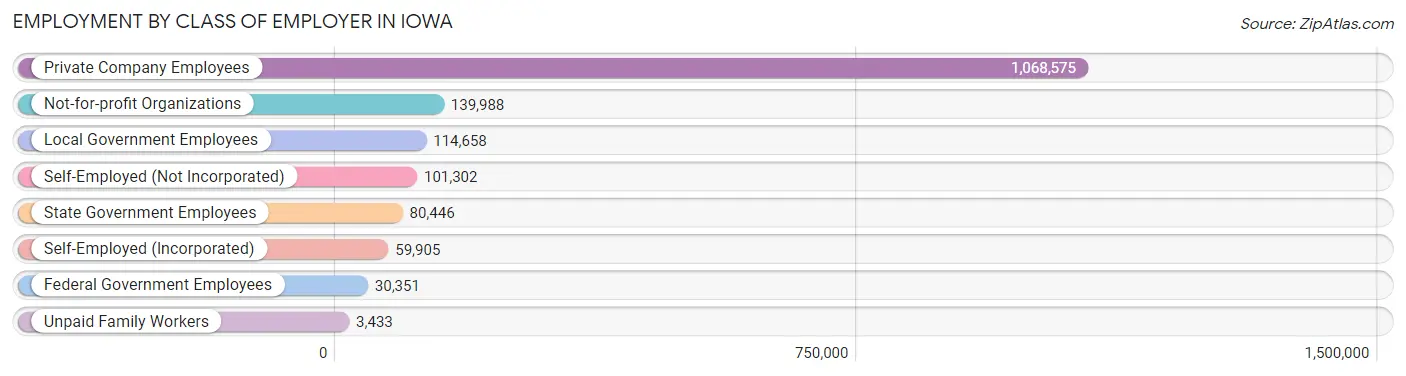
Employment by Class of Employer in Iowa
Among the 1,598,658 employed individuals in Iowa, private company employees (1,068,575 | 66.8%), not-for-profit organizations (139,988 | 8.8%), and local government employees (114,658 | 7.2%) make up the most common classes of employment.
| Employer Class | # Employees | % Employees |
| Private Company Employees | 1,068,575 | 66.8% |
| Self-Employed (Incorporated) | 59,905 | 3.7% |
| Self-Employed (Not Incorporated) | 101,302 | 6.3% |
| Not-for-profit Organizations | 139,988 | 8.8% |
| Local Government Employees | 114,658 | 7.2% |
| State Government Employees | 80,446 | 5.0% |
| Federal Government Employees | 30,351 | 1.9% |
| Unpaid Family Workers | 3,433 | 0.2% |
| Total | 1,598,658 | 100.0% |
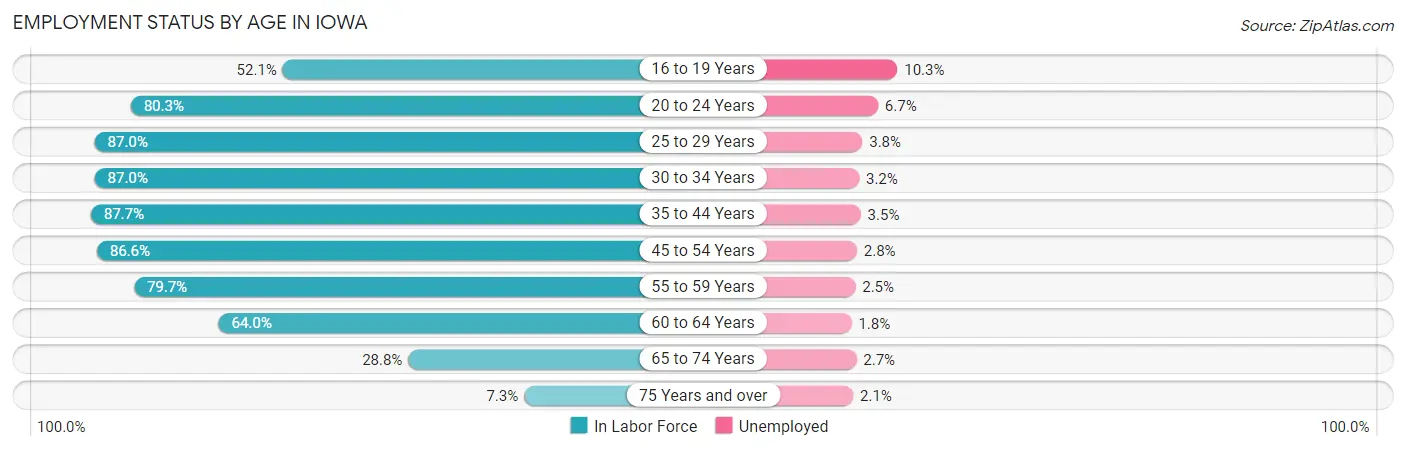
Employment Status by Age in Iowa
According to the labor force statistics for Iowa, out of the total population over 16 years of age (2,544,719), 66.6% or 1,694,783 individuals are in the labor force, with 3.8% or 64,402 of them unemployed. The age group with the highest labor force participation rate is 35 to 44 years, with 87.7% or 347,552 individuals in the labor force. Within the labor force, the 16 to 19 years age range has the highest percentage of unemployed individuals, with 10.3% or 9,761 of them being unemployed.
| Age Bracket | In Labor Force | Unemployed |
| 16 to 19 Years | 94,764 (52.1%) | 9,761 (10.3%) |
| 20 to 24 Years | 185,998 (80.3%) | 12,462 (6.7%) |
| 25 to 29 Years | 173,850 (87.0%) | 6,606 (3.8%) |
| 30 to 34 Years | 170,090 (87.0%) | 5,443 (3.2%) |
| 35 to 44 Years | 347,552 (87.7%) | 12,164 (3.5%) |
| 45 to 54 Years | 316,229 (86.6%) | 8,854 (2.8%) |
| 55 to 59 Years | 161,534 (79.7%) | 4,038 (2.5%) |
| 60 to 64 Years | 135,429 (64.0%) | 2,438 (1.8%) |
| 65 to 74 Years | 92,535 (28.8%) | 2,498 (2.7%) |
| 75 Years and over | 17,434 (7.3%) | 366 (2.1%) |
| Total | 1,694,783 (66.6%) | 64,402 (3.8%) |
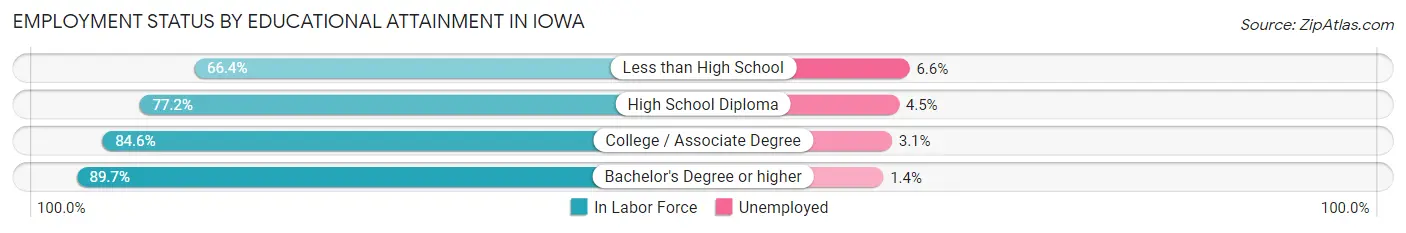
Employment Status by Educational Attainment in Iowa
According to labor force statistics for Iowa, 83.0% of individuals (1,303,994) out of the total population between 25 and 64 years of age (1,571,077) are in the labor force, with 3.0% or 39,120 of them being unemployed. The group with the highest labor force participation rate are those with the educational attainment of bachelor's degree or higher, with 89.7% or 457,399 individuals in the labor force. Within the labor force, individuals with less than high school education have the highest percentage of unemployment, with 6.6% or 4,584 of them being unemployed.
| Educational Attainment | In Labor Force | Unemployed |
| Less than High School | 69,448 (66.4%) | 6,903 (6.6%) |
| High School Diploma | 328,890 (77.2%) | 19,171 (4.5%) |
| College / Associate Degree | 448,839 (84.6%) | 16,447 (3.1%) |
| Bachelor's Degree or higher | 457,399 (89.7%) | 7,139 (1.4%) |
| Total | 1,303,994 (83.0%) | 47,132 (3.0%) |
Employment Occupations by Sex in Iowa
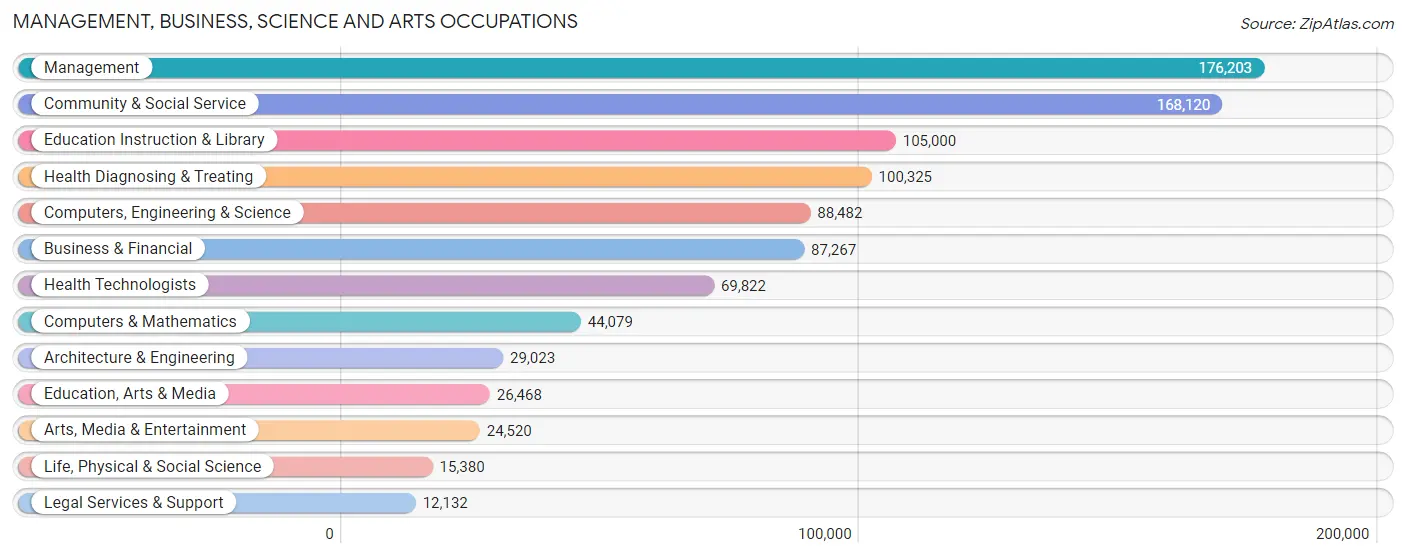
Management, Business, Science and Arts Occupations
The most common Management, Business, Science and Arts occupations in Iowa are Management (176,203 | 10.8%), Community & Social Service (168,120 | 10.3%), Education Instruction & Library (105,000 | 6.5%), Health Diagnosing & Treating (100,325 | 6.2%), and Computers, Engineering & Science (88,482 | 5.4%).
Management, Business, Science and Arts Occupations by Sex
Within the Management, Business, Science and Arts occupations in Iowa, the most male-oriented occupations are Architecture & Engineering (86.5%), Computers, Engineering & Science (75.7%), and Computers & Mathematics (73.9%), while the most female-oriented occupations are Health Diagnosing & Treating (80.1%), Health Technologists (78.6%), and Education Instruction & Library (73.6%).
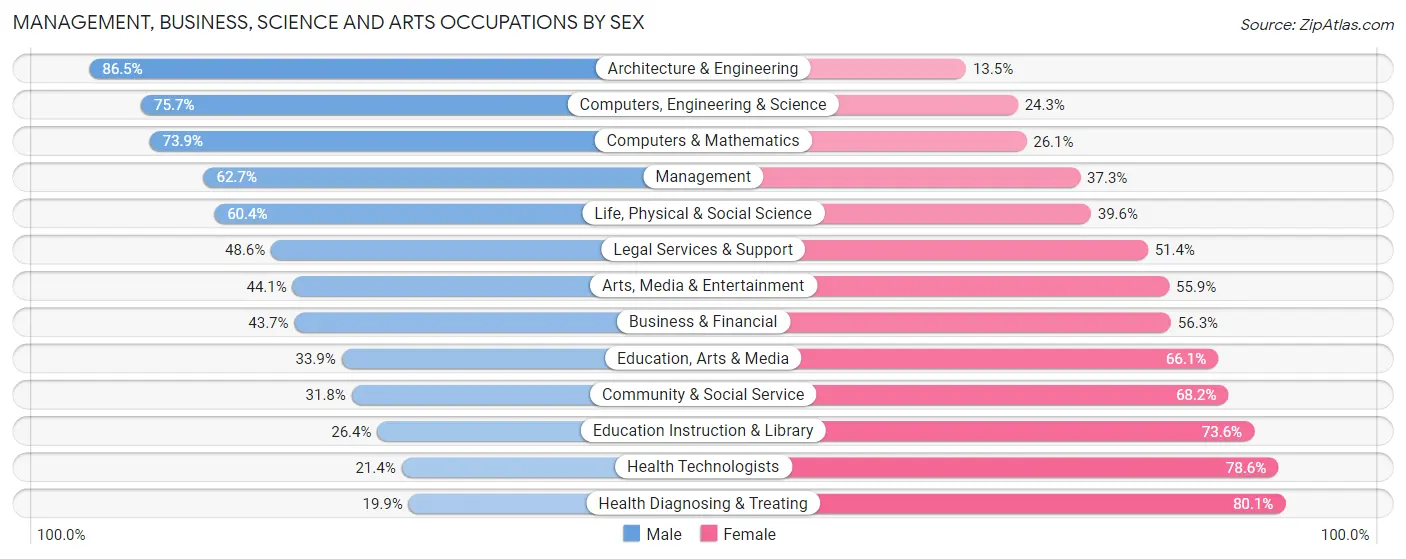
| Occupation | Male | Female |
| Management | 110,403 (62.7%) | 65,800 (37.3%) |
| Business & Financial | 38,165 (43.7%) | 49,102 (56.3%) |
| Computers, Engineering & Science | 66,969 (75.7%) | 21,513 (24.3%) |
| Computers & Mathematics | 32,575 (73.9%) | 11,504 (26.1%) |
| Architecture & Engineering | 25,098 (86.5%) | 3,925 (13.5%) |
| Life, Physical & Social Science | 9,296 (60.4%) | 6,084 (39.6%) |
| Community & Social Service | 53,425 (31.8%) | 114,695 (68.2%) |
| Education, Arts & Media | 8,970 (33.9%) | 17,498 (66.1%) |
| Legal Services & Support | 5,893 (48.6%) | 6,239 (51.4%) |
| Education Instruction & Library | 27,746 (26.4%) | 77,254 (73.6%) |
| Arts, Media & Entertainment | 10,816 (44.1%) | 13,704 (55.9%) |
| Health Diagnosing & Treating | 19,962 (19.9%) | 80,363 (80.1%) |
| Health Technologists | 14,925 (21.4%) | 54,897 (78.6%) |
| Total (Category) | 288,924 (46.6%) | 331,473 (53.4%) |
| Total (Overall) | 861,741 (52.9%) | 765,693 (47.0%) |
Services Occupations
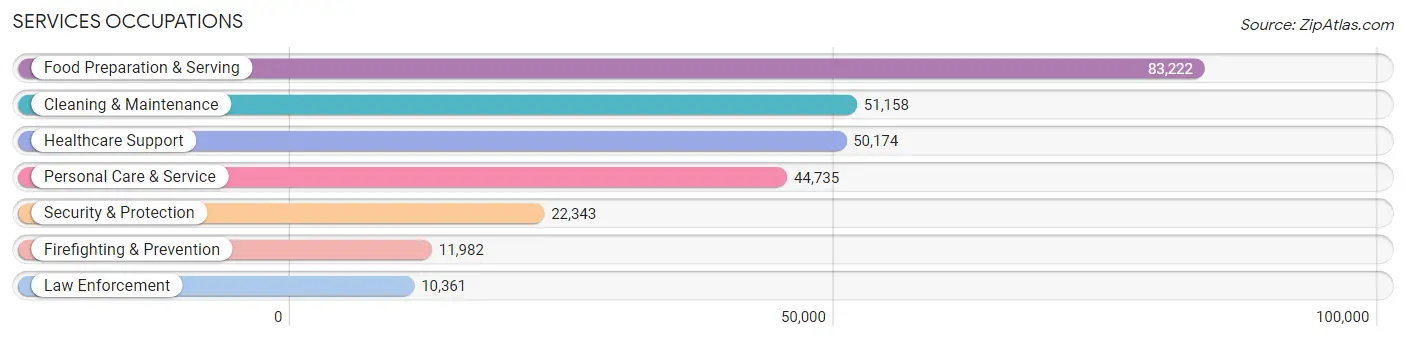
The most common Services occupations in Iowa are Food Preparation & Serving (83,222 | 5.1%), Cleaning & Maintenance (51,158 | 3.1%), Healthcare Support (50,174 | 3.1%), Personal Care & Service (44,735 | 2.8%), and Security & Protection (22,343 | 1.4%).
Services Occupations by Sex
Within the Services occupations in Iowa, the most male-oriented occupations are Law Enforcement (79.6%), Security & Protection (75.0%), and Firefighting & Prevention (70.9%), while the most female-oriented occupations are Healthcare Support (87.8%), Personal Care & Service (83.8%), and Food Preparation & Serving (60.9%).
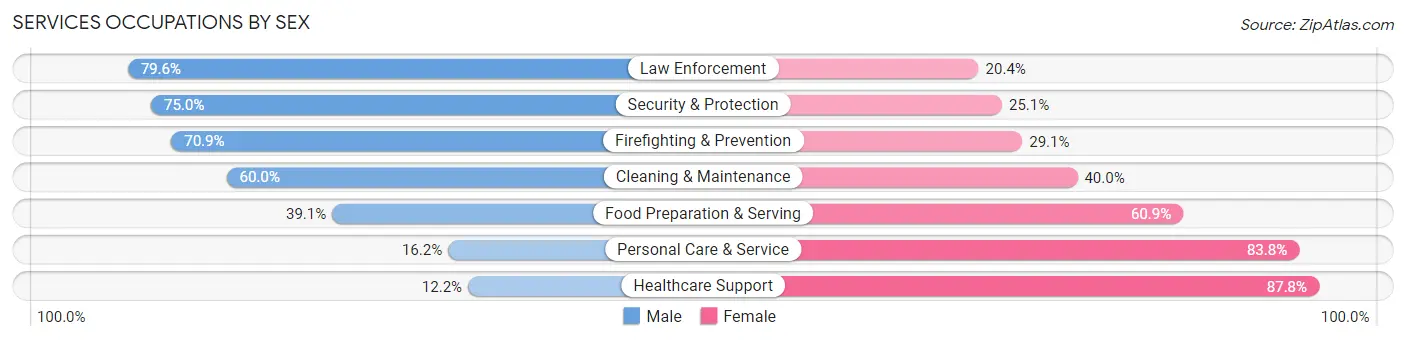
| Occupation | Male | Female |
| Healthcare Support | 6,133 (12.2%) | 44,041 (87.8%) |
| Security & Protection | 16,745 (75.0%) | 5,598 (25.1%) |
| Firefighting & Prevention | 8,500 (70.9%) | 3,482 (29.1%) |
| Law Enforcement | 8,245 (79.6%) | 2,116 (20.4%) |
| Food Preparation & Serving | 32,557 (39.1%) | 50,665 (60.9%) |
| Cleaning & Maintenance | 30,698 (60.0%) | 20,460 (40.0%) |
| Personal Care & Service | 7,227 (16.2%) | 37,508 (83.8%) |
| Total (Category) | 93,360 (37.1%) | 158,272 (62.9%) |
| Total (Overall) | 861,741 (52.9%) | 765,693 (47.0%) |
Sales and Office Occupations
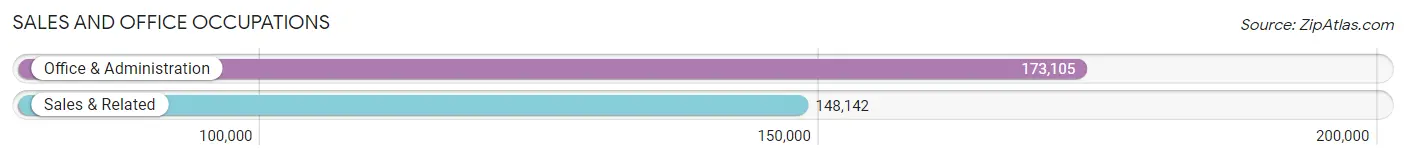
The most common Sales and Office occupations in Iowa are Office & Administration (173,105 | 10.6%), and Sales & Related (148,142 | 9.1%).
Sales and Office Occupations by Sex
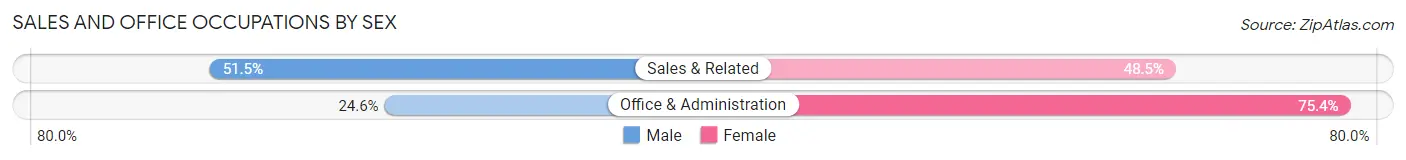
| Occupation | Male | Female |
| Sales & Related | 76,310 (51.5%) | 71,832 (48.5%) |
| Office & Administration | 42,649 (24.6%) | 130,456 (75.4%) |
| Total (Category) | 118,959 (37.0%) | 202,288 (63.0%) |
| Total (Overall) | 861,741 (52.9%) | 765,693 (47.0%) |
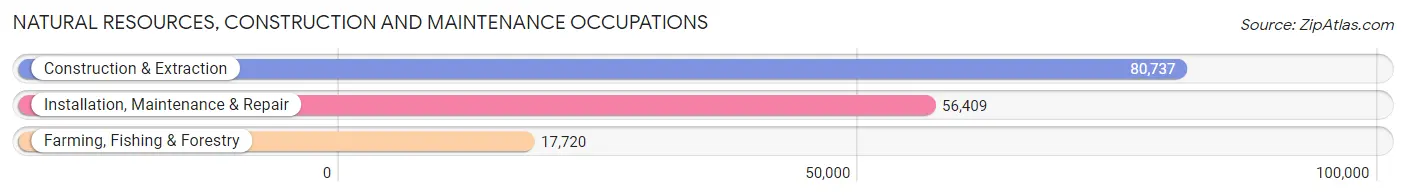
Natural Resources, Construction and Maintenance Occupations
The most common Natural Resources, Construction and Maintenance occupations in Iowa are Construction & Extraction (80,737 | 5.0%), Installation, Maintenance & Repair (56,409 | 3.5%), and Farming, Fishing & Forestry (17,720 | 1.1%).
Natural Resources, Construction and Maintenance Occupations by Sex
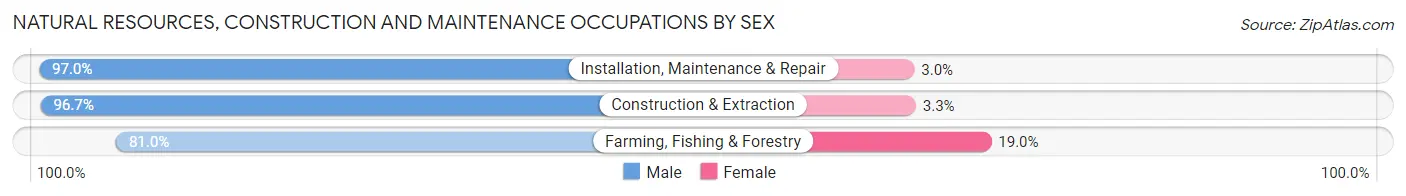
| Occupation | Male | Female |
| Farming, Fishing & Forestry | 14,349 (81.0%) | 3,371 (19.0%) |
| Construction & Extraction | 78,062 (96.7%) | 2,675 (3.3%) |
| Installation, Maintenance & Repair | 54,710 (97.0%) | 1,699 (3.0%) |
| Total (Category) | 147,121 (95.0%) | 7,745 (5.0%) |
| Total (Overall) | 861,741 (52.9%) | 765,693 (47.0%) |
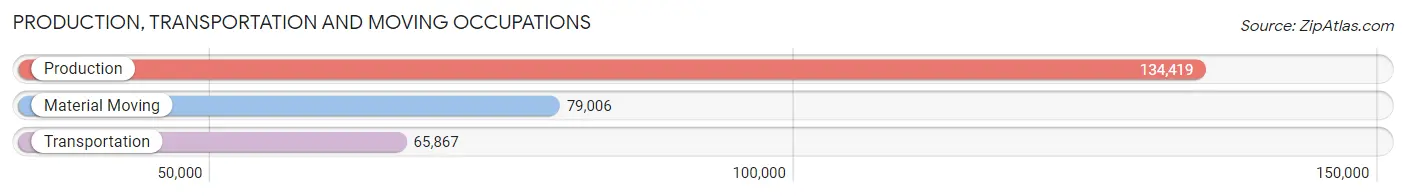
Production, Transportation and Moving Occupations
The most common Production, Transportation and Moving occupations in Iowa are Production (134,419 | 8.3%), Material Moving (79,006 | 4.9%), and Transportation (65,867 | 4.1%).
Production, Transportation and Moving Occupations by Sex
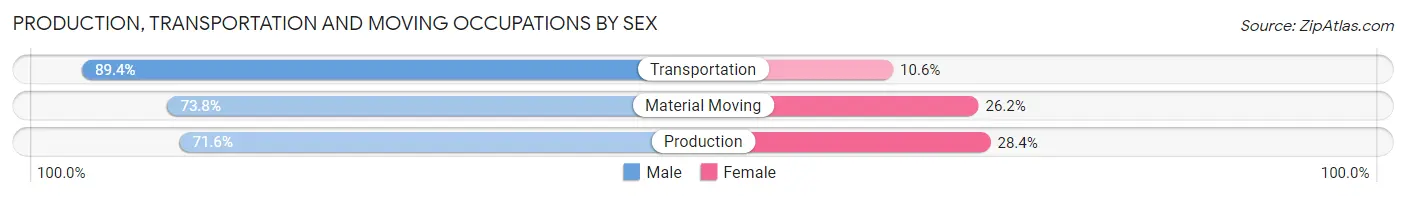
| Occupation | Male | Female |
| Production | 96,196 (71.6%) | 38,223 (28.4%) |
| Transportation | 58,907 (89.4%) | 6,960 (10.6%) |
| Material Moving | 58,274 (73.8%) | 20,732 (26.2%) |
| Total (Category) | 213,377 (76.4%) | 65,915 (23.6%) |
| Total (Overall) | 861,741 (52.9%) | 765,693 (47.0%) |
Employment Industries by Sex in Iowa
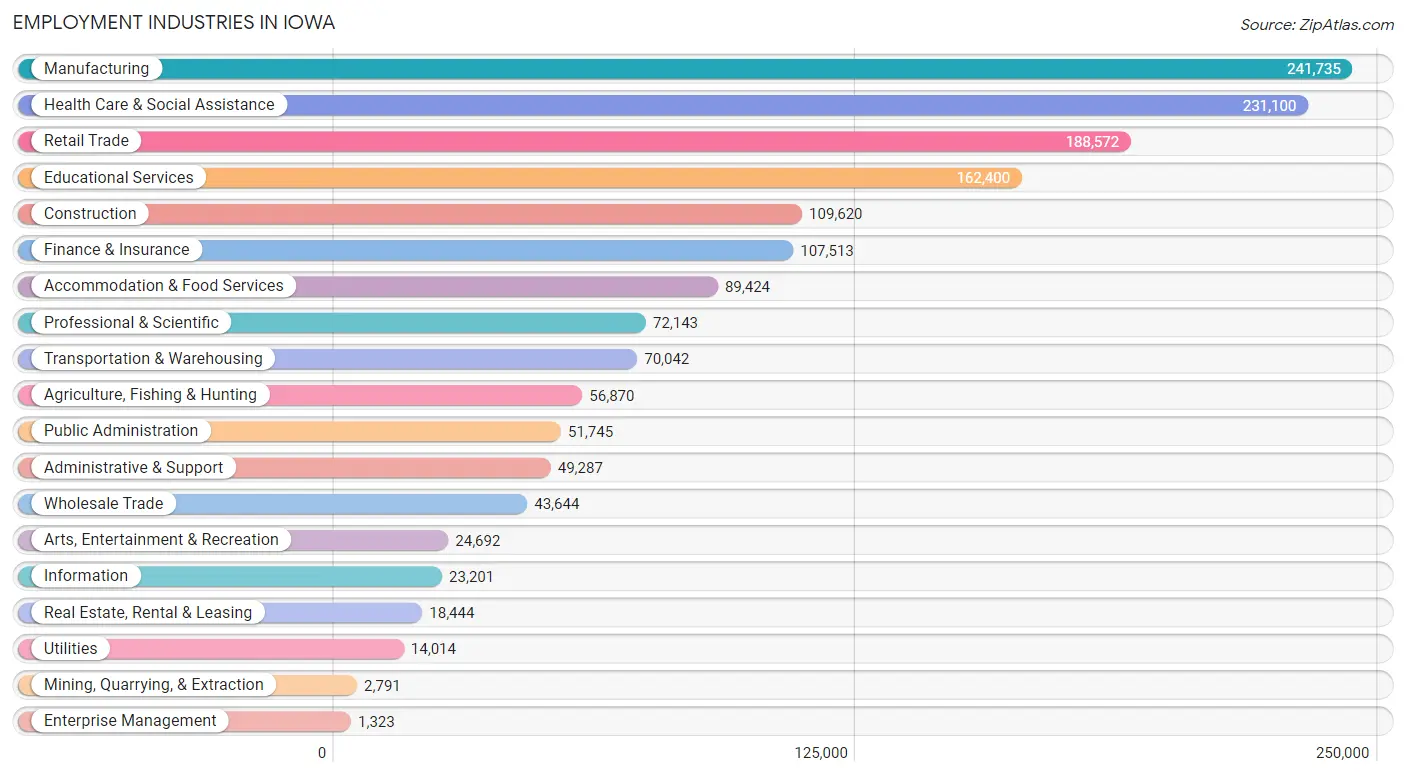
Employment Industries in Iowa
The major employment industries in Iowa include Manufacturing (241,735 | 14.8%), Health Care & Social Assistance (231,100 | 14.2%), Retail Trade (188,572 | 11.6%), Educational Services (162,400 | 10.0%), and Construction (109,620 | 6.7%).
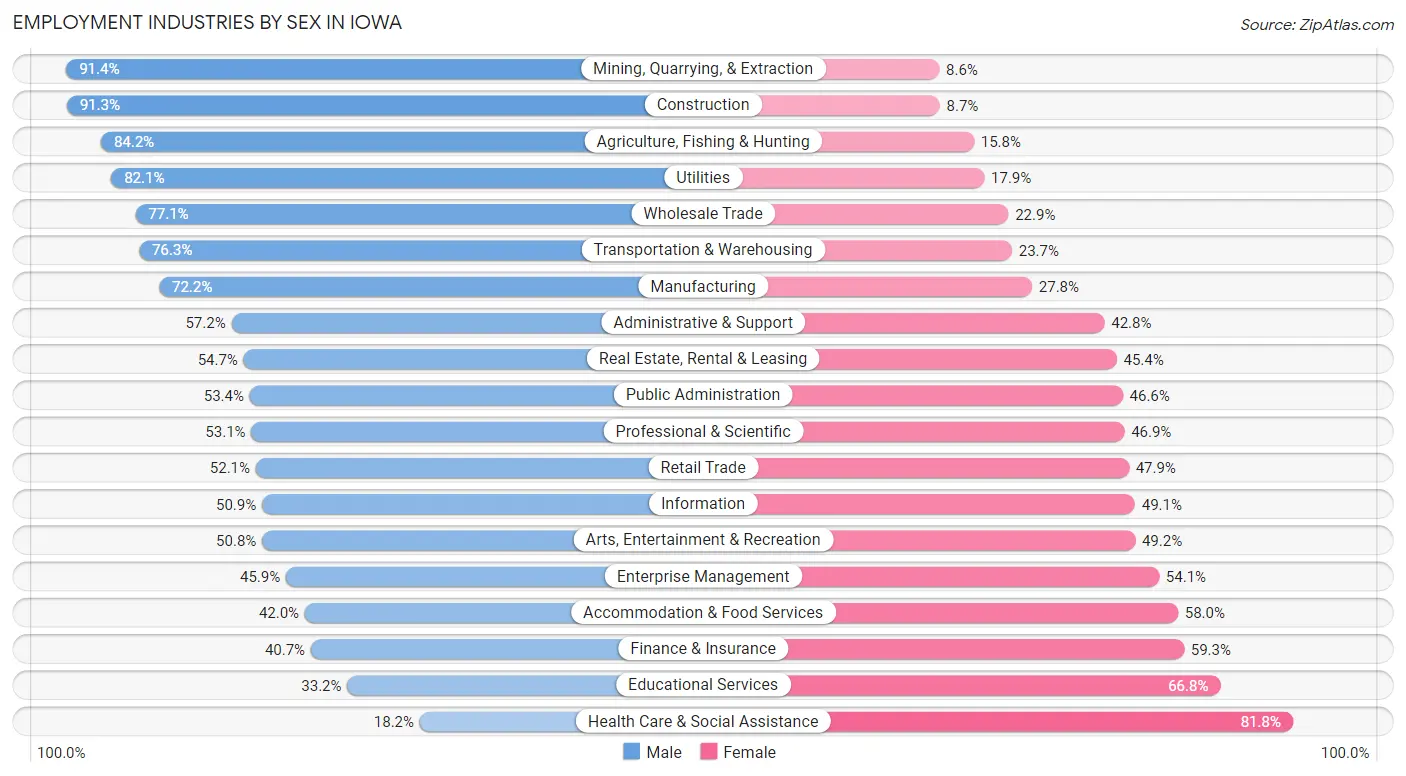
Employment Industries by Sex in Iowa
The Iowa industries that see more men than women are Mining, Quarrying, & Extraction (91.4%), Construction (91.3%), and Agriculture, Fishing & Hunting (84.2%), whereas the industries that tend to have a higher number of women are Health Care & Social Assistance (81.8%), Educational Services (66.8%), and Finance & Insurance (59.3%).
| Industry | Male | Female |
| Agriculture, Fishing & Hunting | 47,877 (84.2%) | 8,993 (15.8%) |
| Mining, Quarrying, & Extraction | 2,550 (91.4%) | 241 (8.6%) |
| Construction | 100,049 (91.3%) | 9,571 (8.7%) |
| Manufacturing | 174,454 (72.2%) | 67,281 (27.8%) |
| Wholesale Trade | 33,633 (77.1%) | 10,011 (22.9%) |
| Retail Trade | 98,310 (52.1%) | 90,262 (47.9%) |
| Transportation & Warehousing | 53,454 (76.3%) | 16,588 (23.7%) |
| Utilities | 11,500 (82.1%) | 2,514 (17.9%) |
| Information | 11,801 (50.9%) | 11,400 (49.1%) |
| Finance & Insurance | 43,788 (40.7%) | 63,725 (59.3%) |
| Real Estate, Rental & Leasing | 10,079 (54.6%) | 8,365 (45.4%) |
| Professional & Scientific | 38,278 (53.1%) | 33,865 (46.9%) |
| Enterprise Management | 607 (45.9%) | 716 (54.1%) |
| Administrative & Support | 28,182 (57.2%) | 21,105 (42.8%) |
| Educational Services | 53,903 (33.2%) | 108,497 (66.8%) |
| Health Care & Social Assistance | 42,008 (18.2%) | 189,092 (81.8%) |
| Arts, Entertainment & Recreation | 12,552 (50.8%) | 12,140 (49.2%) |
| Accommodation & Food Services | 37,534 (42.0%) | 51,890 (58.0%) |
| Public Administration | 27,628 (53.4%) | 24,117 (46.6%) |
| Total | 861,741 (52.9%) | 765,693 (47.0%) |
Education in Iowa
School Enrollment in Iowa
The most common levels of schooling among the 788,704 students in Iowa are college / undergraduate (171,798 | 21.8%), high school (166,941 | 21.2%), and middle school (165,360 | 21.0%).

| School Level | # Students | % Students |
| Nursery / Preschool | 50,295 | 6.4% |
| Kindergarten | 41,809 | 5.3% |
| Elementary School | 157,178 | 19.9% |
| Middle School | 165,360 | 21.0% |
| High School | 166,941 | 21.2% |
| College / Undergraduate | 171,798 | 21.8% |
| Graduate / Professional | 35,323 | 4.5% |
| Total | 788,704 | 100.0% |
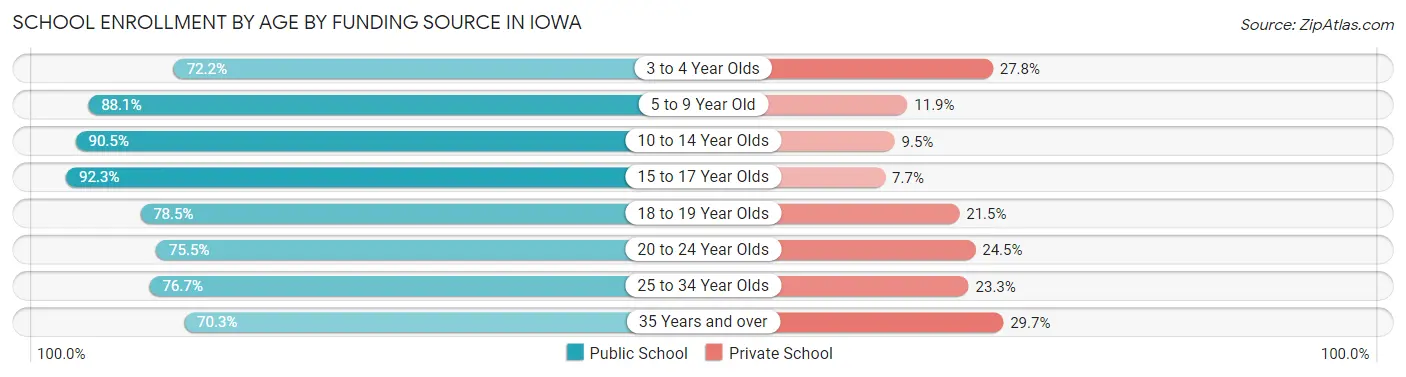
School Enrollment by Age by Funding Source in Iowa
Out of a total of 788,704 students who are enrolled in schools in Iowa, 117,517 (14.9%) attend a private institution, while the remaining 671,187 (85.1%) are enrolled in public schools. The age group of 35 years and over has the highest likelihood of being enrolled in private schools, with 8,696 (29.7% in the age bracket) enrolled. Conversely, the age group of 15 to 17 year olds has the lowest likelihood of being enrolled in a private school, with 113,415 (92.3% in the age bracket) attending a public institution.
| Age Bracket | Public School | Private School |
| 3 to 4 Year Olds | 24,888 (72.2%) | 9,571 (27.8%) |
| 5 to 9 Year Old | 169,999 (88.1%) | 22,873 (11.9%) |
| 10 to 14 Year Olds | 184,947 (90.5%) | 19,395 (9.5%) |
| 15 to 17 Year Olds | 113,415 (92.3%) | 9,507 (7.7%) |
| 18 to 19 Year Olds | 56,953 (78.5%) | 15,636 (21.5%) |
| 20 to 24 Year Olds | 73,068 (75.5%) | 23,722 (24.5%) |
| 25 to 34 Year Olds | 27,219 (76.7%) | 8,253 (23.3%) |
| 35 Years and over | 20,562 (70.3%) | 8,696 (29.7%) |
| Total | 671,187 (85.1%) | 117,517 (14.9%) |
Educational Attainment by Field of Study in Iowa
Business (140,997 | 20.0%), education (118,136 | 16.7%), science & technology (69,490 | 9.8%), bio, nature & agricultural (62,993 | 8.9%), and arts & humanities (48,214 | 6.8%) are the most common fields of study among 706,647 individuals in Iowa who have obtained a bachelor's degree or higher.
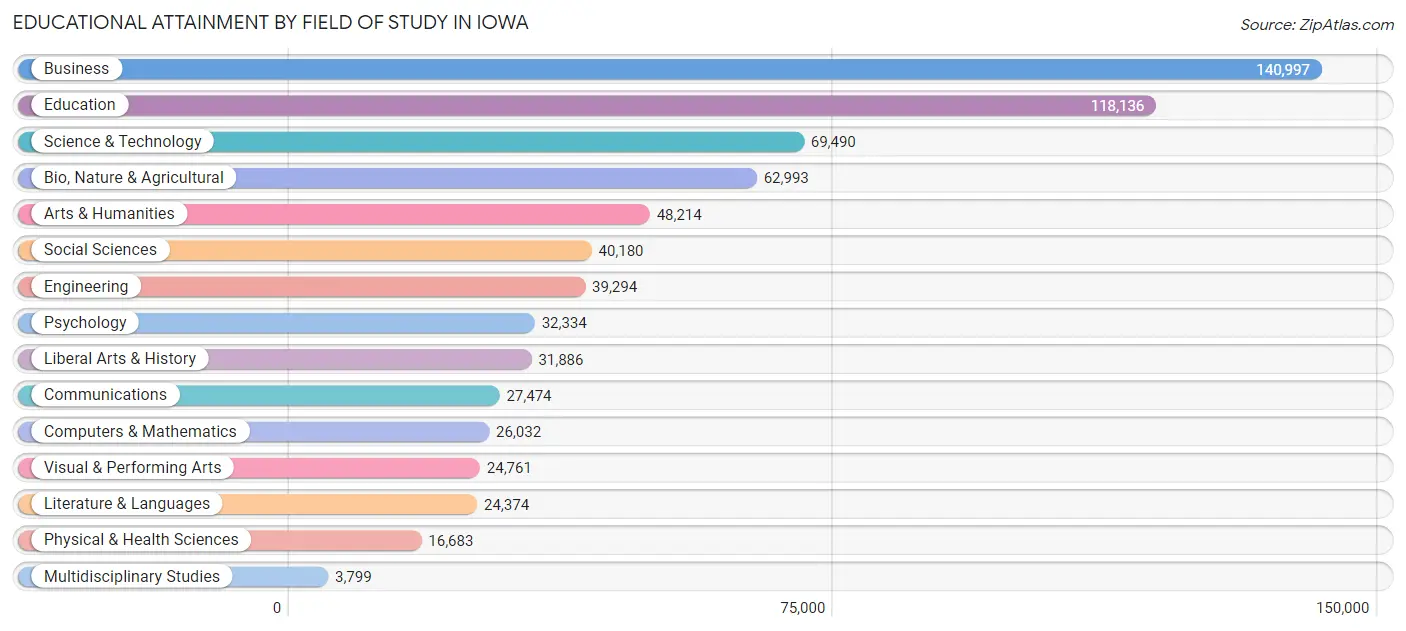
| Field of Study | # Graduates | % Graduates |
| Computers & Mathematics | 26,032 | 3.7% |
| Bio, Nature & Agricultural | 62,993 | 8.9% |
| Physical & Health Sciences | 16,683 | 2.4% |
| Psychology | 32,334 | 4.6% |
| Social Sciences | 40,180 | 5.7% |
| Engineering | 39,294 | 5.6% |
| Multidisciplinary Studies | 3,799 | 0.5% |
| Science & Technology | 69,490 | 9.8% |
| Business | 140,997 | 20.0% |
| Education | 118,136 | 16.7% |
| Literature & Languages | 24,374 | 3.5% |
| Liberal Arts & History | 31,886 | 4.5% |
| Visual & Performing Arts | 24,761 | 3.5% |
| Communications | 27,474 | 3.9% |
| Arts & Humanities | 48,214 | 6.8% |
| Total | 706,647 | 100.0% |
Transportation & Commute in Iowa
Vehicle Availability by Sex in Iowa
The most prevalent vehicle ownership categories in Iowa are males with 2 vehicles (350,934, accounting for 41.8%) and females with 2 vehicles (300,712, making up 47.6%).
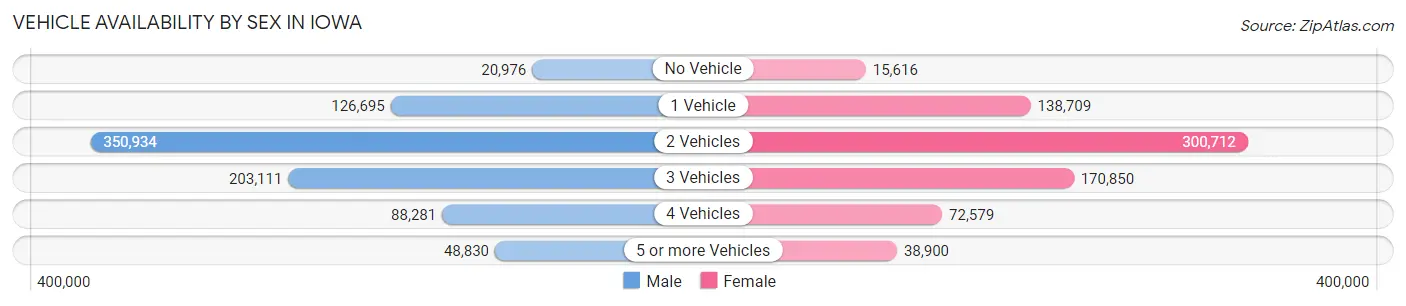
| Vehicles Available | Male | Female |
| No Vehicle | 20,976 (2.5%) | 15,616 (2.1%) |
| 1 Vehicle | 126,695 (15.1%) | 138,709 (18.8%) |
| 2 Vehicles | 350,934 (41.8%) | 300,712 (40.8%) |
| 3 Vehicles | 203,111 (24.2%) | 170,850 (23.2%) |
| 4 Vehicles | 88,281 (10.5%) | 72,579 (9.8%) |
| 5 or more Vehicles | 48,830 (5.8%) | 38,900 (5.3%) |
| Total | 838,827 (100.0%) | 737,366 (100.0%) |
Commute Time in Iowa
The most frequently occuring commute durations in Iowa are 10 to 14 minutes (259,576 commuters, 17.9%), 5 to 9 minutes (249,785 commuters, 17.2%), and 15 to 19 minutes (246,963 commuters, 17.0%).
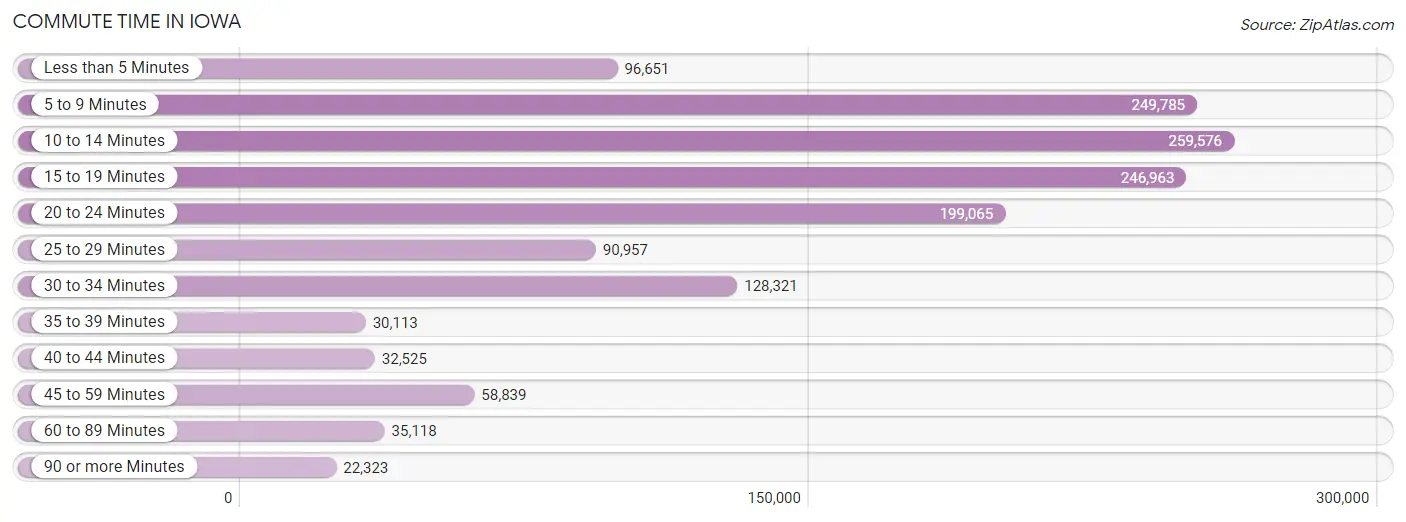
| Commute Time | # Commuters | % Commuters |
| Less than 5 Minutes | 96,651 | 6.7% |
| 5 to 9 Minutes | 249,785 | 17.2% |
| 10 to 14 Minutes | 259,576 | 17.9% |
| 15 to 19 Minutes | 246,963 | 17.0% |
| 20 to 24 Minutes | 199,065 | 13.7% |
| 25 to 29 Minutes | 90,957 | 6.3% |
| 30 to 34 Minutes | 128,321 | 8.8% |
| 35 to 39 Minutes | 30,113 | 2.1% |
| 40 to 44 Minutes | 32,525 | 2.2% |
| 45 to 59 Minutes | 58,839 | 4.1% |
| 60 to 89 Minutes | 35,118 | 2.4% |
| 90 or more Minutes | 22,323 | 1.5% |
Commute Time by Sex in Iowa
The most common commute times in Iowa are 10 to 14 minutes (135,553 commuters, 17.4%) for males and 10 to 14 minutes (124,023 commuters, 18.4%) for females.
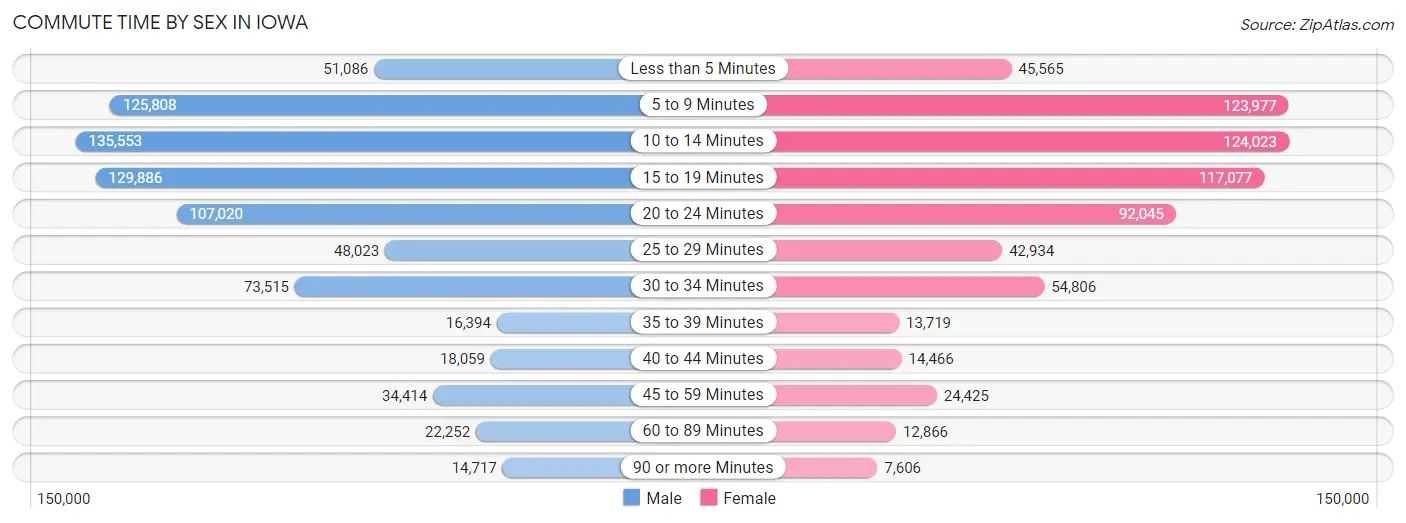
| Commute Time | Male | Female |
| Less than 5 Minutes | 51,086 (6.6%) | 45,565 (6.8%) |
| 5 to 9 Minutes | 125,808 (16.2%) | 123,977 (18.4%) |
| 10 to 14 Minutes | 135,553 (17.4%) | 124,023 (18.4%) |
| 15 to 19 Minutes | 129,886 (16.7%) | 117,077 (17.4%) |
| 20 to 24 Minutes | 107,020 (13.8%) | 92,045 (13.7%) |
| 25 to 29 Minutes | 48,023 (6.2%) | 42,934 (6.4%) |
| 30 to 34 Minutes | 73,515 (9.5%) | 54,806 (8.1%) |
| 35 to 39 Minutes | 16,394 (2.1%) | 13,719 (2.0%) |
| 40 to 44 Minutes | 18,059 (2.3%) | 14,466 (2.1%) |
| 45 to 59 Minutes | 34,414 (4.4%) | 24,425 (3.6%) |
| 60 to 89 Minutes | 22,252 (2.9%) | 12,866 (1.9%) |
| 90 or more Minutes | 14,717 (1.9%) | 7,606 (1.1%) |
Time of Departure to Work by Sex in Iowa
The most frequent times of departure to work in Iowa are 7:00 AM to 7:29 AM (111,555, 14.4%) for males and 7:30 AM to 7:59 AM (126,021, 18.7%) for females.
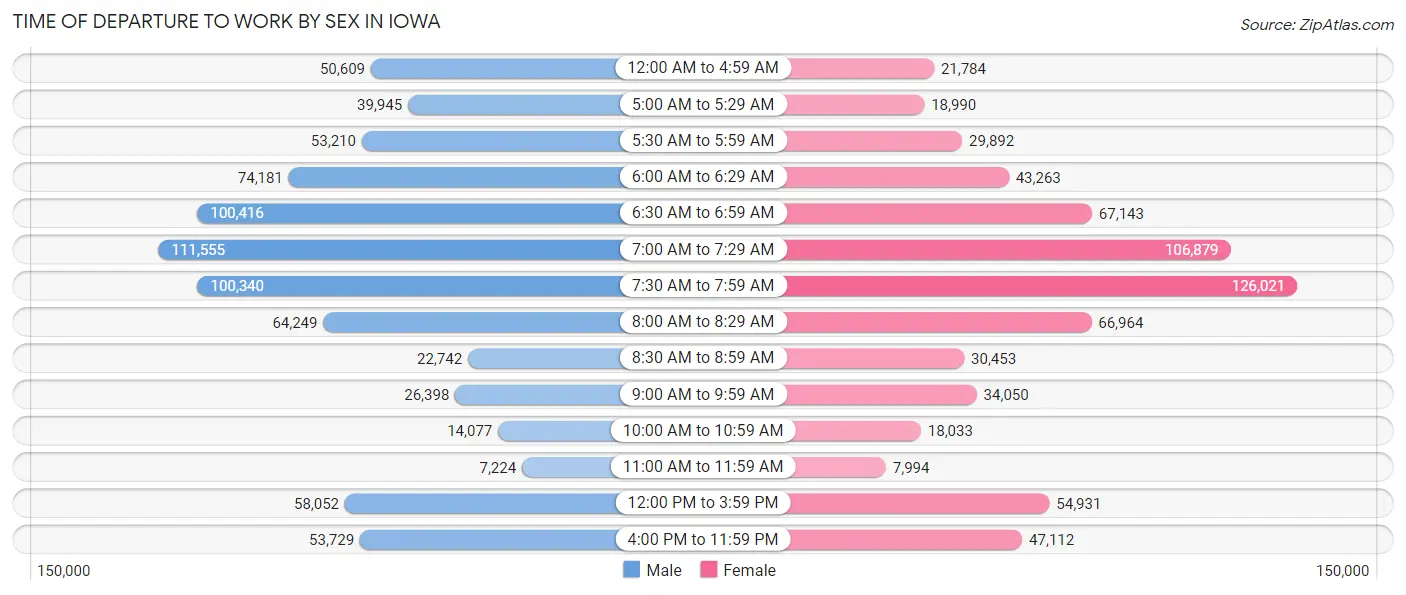
| Time of Departure | Male | Female |
| 12:00 AM to 4:59 AM | 50,609 (6.5%) | 21,784 (3.2%) |
| 5:00 AM to 5:29 AM | 39,945 (5.1%) | 18,990 (2.8%) |
| 5:30 AM to 5:59 AM | 53,210 (6.9%) | 29,892 (4.4%) |
| 6:00 AM to 6:29 AM | 74,181 (9.6%) | 43,263 (6.4%) |
| 6:30 AM to 6:59 AM | 100,416 (12.9%) | 67,143 (10.0%) |
| 7:00 AM to 7:29 AM | 111,555 (14.4%) | 106,879 (15.9%) |
| 7:30 AM to 7:59 AM | 100,340 (12.9%) | 126,021 (18.7%) |
| 8:00 AM to 8:29 AM | 64,249 (8.3%) | 66,964 (9.9%) |
| 8:30 AM to 8:59 AM | 22,742 (2.9%) | 30,453 (4.5%) |
| 9:00 AM to 9:59 AM | 26,398 (3.4%) | 34,050 (5.1%) |
| 10:00 AM to 10:59 AM | 14,077 (1.8%) | 18,033 (2.7%) |
| 11:00 AM to 11:59 AM | 7,224 (0.9%) | 7,994 (1.2%) |
| 12:00 PM to 3:59 PM | 58,052 (7.5%) | 54,931 (8.2%) |
| 4:00 PM to 11:59 PM | 53,729 (6.9%) | 47,112 (7.0%) |
| Total | 776,727 (100.0%) | 673,509 (100.0%) |
Housing Occupancy in Iowa
Occupancy by Ownership in Iowa
Of the total 1,290,139 dwellings in Iowa, owner-occupied units account for 922,684 (71.5%), while renter-occupied units make up 367,455 (28.5%).
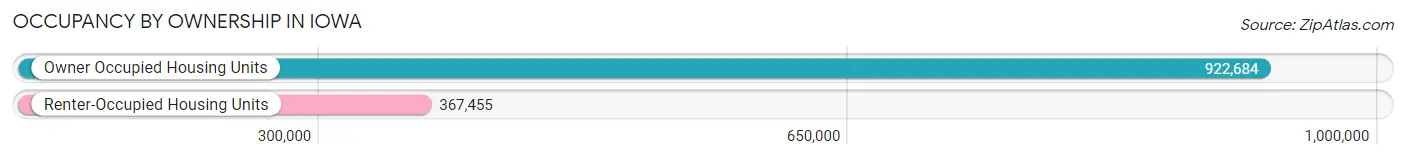
| Occupancy | # Housing Units | % Housing Units |
| Owner Occupied Housing Units | 922,684 | 71.5% |
| Renter-Occupied Housing Units | 367,455 | 28.5% |
| Total Occupied Housing Units | 1,290,139 | 100.0% |
Occupancy by Household Size in Iowa
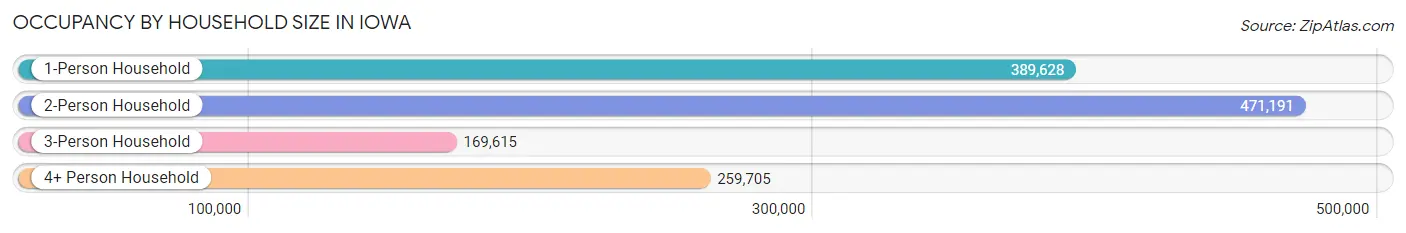
| Household Size | # Housing Units | % Housing Units |
| 1-Person Household | 389,628 | 30.2% |
| 2-Person Household | 471,191 | 36.5% |
| 3-Person Household | 169,615 | 13.2% |
| 4+ Person Household | 259,705 | 20.1% |
| Total Housing Units | 1,290,139 | 100.0% |
Occupancy by Ownership by Household Size in Iowa
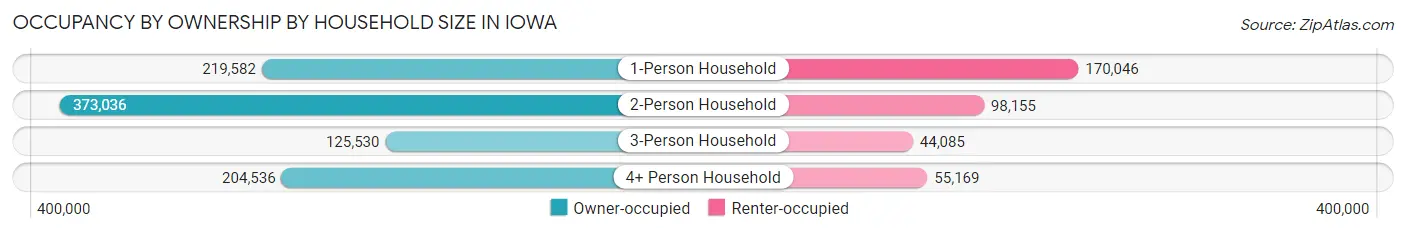
| Household Size | Owner-occupied | Renter-occupied |
| 1-Person Household | 219,582 (56.4%) | 170,046 (43.6%) |
| 2-Person Household | 373,036 (79.2%) | 98,155 (20.8%) |
| 3-Person Household | 125,530 (74.0%) | 44,085 (26.0%) |
| 4+ Person Household | 204,536 (78.8%) | 55,169 (21.2%) |
| Total Housing Units | 922,684 (71.5%) | 367,455 (28.5%) |
Occupancy by Educational Attainment in Iowa
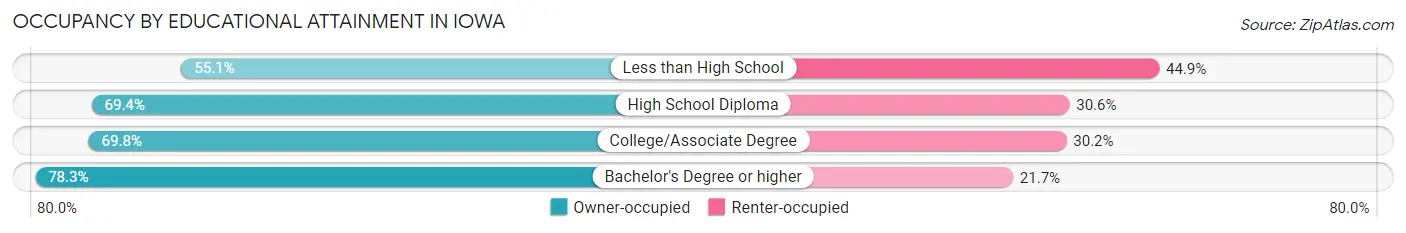
| Household Size | Owner-occupied | Renter-occupied |
| Less than High School | 42,238 (55.1%) | 34,384 (44.9%) |
| High School Diploma | 250,709 (69.4%) | 110,695 (30.6%) |
| College/Associate Degree | 309,015 (69.8%) | 133,530 (30.2%) |
| Bachelor's Degree or higher | 320,722 (78.3%) | 88,846 (21.7%) |
Occupancy by Age of Householder in Iowa
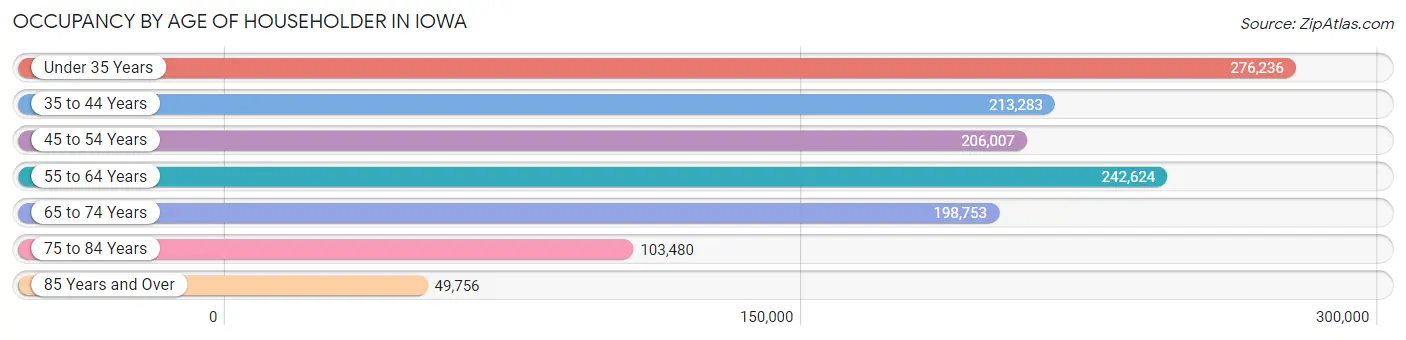
| Age Bracket | # Households | % Households |
| Under 35 Years | 276,236 | 21.4% |
| 35 to 44 Years | 213,283 | 16.5% |
| 45 to 54 Years | 206,007 | 16.0% |
| 55 to 64 Years | 242,624 | 18.8% |
| 65 to 74 Years | 198,753 | 15.4% |
| 75 to 84 Years | 103,480 | 8.0% |
| 85 Years and Over | 49,756 | 3.9% |
| Total | 1,290,139 | 100.0% |
Housing Finances in Iowa
Median Income by Occupancy in Iowa
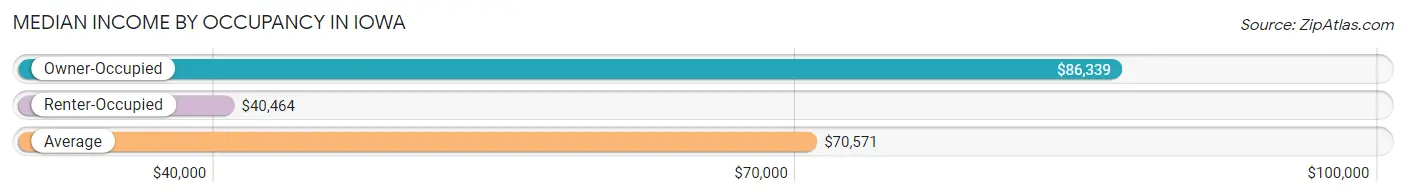
| Occupancy Type | # Households | Median Income |
| Owner-Occupied | 922,684 (71.5%) | $86,339 |
| Renter-Occupied | 367,455 (28.5%) | $40,464 |
| Average | 1,290,139 (100.0%) | $70,571 |
Occupancy by Householder Income Bracket in Iowa
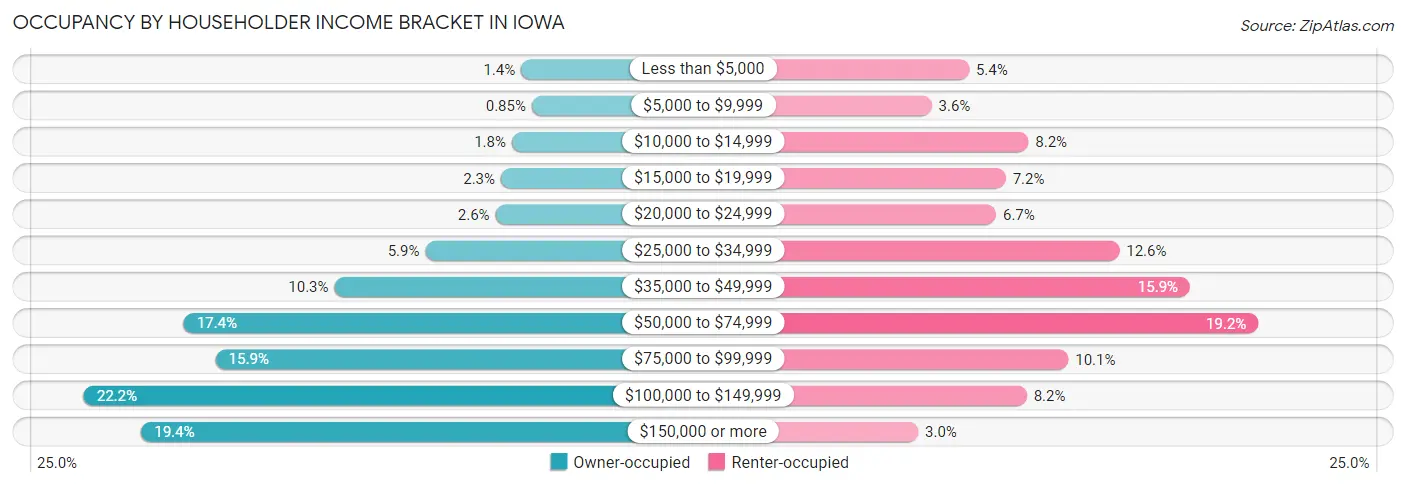
| Income Bracket | Owner-occupied | Renter-occupied |
| Less than $5,000 | 12,588 (1.4%) | 19,856 (5.4%) |
| $5,000 to $9,999 | 7,810 (0.9%) | 13,290 (3.6%) |
| $10,000 to $14,999 | 16,596 (1.8%) | 30,258 (8.2%) |
| $15,000 to $19,999 | 21,384 (2.3%) | 26,275 (7.1%) |
| $20,000 to $24,999 | 23,823 (2.6%) | 24,569 (6.7%) |
| $25,000 to $34,999 | 54,589 (5.9%) | 46,160 (12.6%) |
| $35,000 to $49,999 | 94,535 (10.2%) | 58,489 (15.9%) |
| $50,000 to $74,999 | 160,688 (17.4%) | 70,452 (19.2%) |
| $75,000 to $99,999 | 146,682 (15.9%) | 37,235 (10.1%) |
| $100,000 to $149,999 | 204,655 (22.2%) | 29,935 (8.2%) |
| $150,000 or more | 179,334 (19.4%) | 10,936 (3.0%) |
| Total | 922,684 (100.0%) | 367,455 (100.0%) |
Monthly Housing Cost Tiers in Iowa
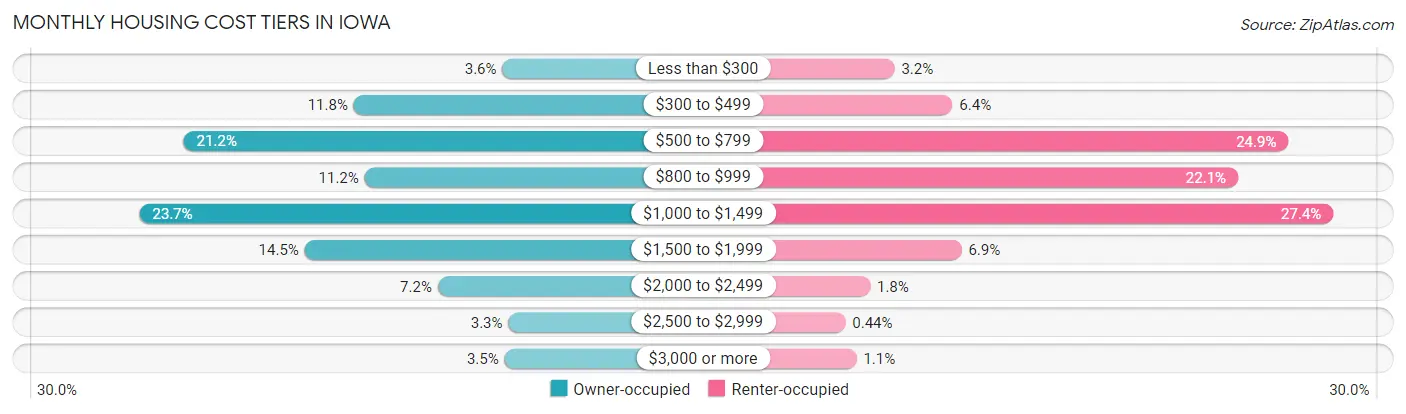
| Monthly Cost | Owner-occupied | Renter-occupied |
| Less than $300 | 33,298 (3.6%) | 11,557 (3.2%) |
| $300 to $499 | 109,079 (11.8%) | 23,325 (6.4%) |
| $500 to $799 | 195,766 (21.2%) | 91,483 (24.9%) |
| $800 to $999 | 103,552 (11.2%) | 81,286 (22.1%) |
| $1,000 to $1,499 | 218,298 (23.7%) | 100,595 (27.4%) |
| $1,500 to $1,999 | 134,039 (14.5%) | 25,182 (6.9%) |
| $2,000 to $2,499 | 66,222 (7.2%) | 6,597 (1.8%) |
| $2,500 to $2,999 | 30,228 (3.3%) | 1,606 (0.4%) |
| $3,000 or more | 32,202 (3.5%) | 3,854 (1.1%) |
| Total | 922,684 (100.0%) | 367,455 (100.0%) |
Physical Housing Characteristics in Iowa
Housing Structures in Iowa
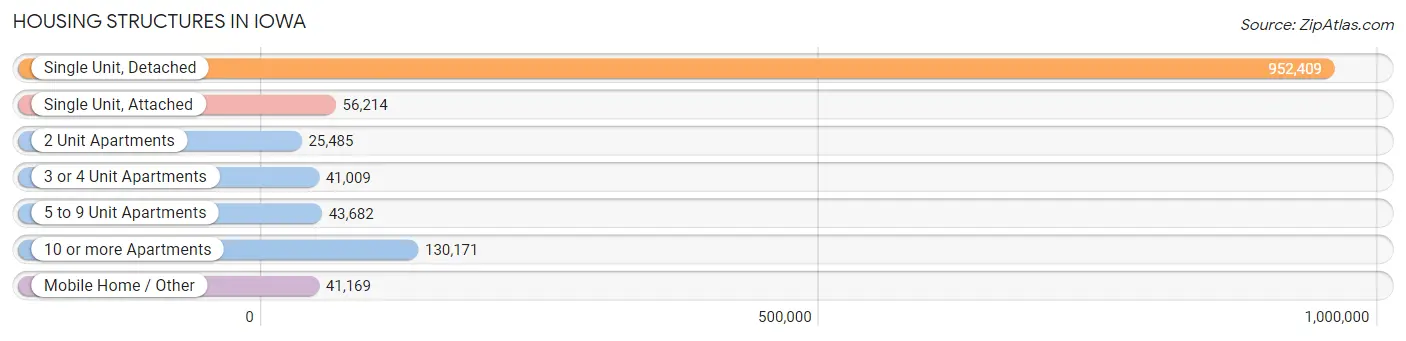
| Structure Type | # Housing Units | % Housing Units |
| Single Unit, Detached | 952,409 | 73.8% |
| Single Unit, Attached | 56,214 | 4.4% |
| 2 Unit Apartments | 25,485 | 2.0% |
| 3 or 4 Unit Apartments | 41,009 | 3.2% |
| 5 to 9 Unit Apartments | 43,682 | 3.4% |
| 10 or more Apartments | 130,171 | 10.1% |
| Mobile Home / Other | 41,169 | 3.2% |
| Total | 1,290,139 | 100.0% |
Housing Structures by Occupancy in Iowa
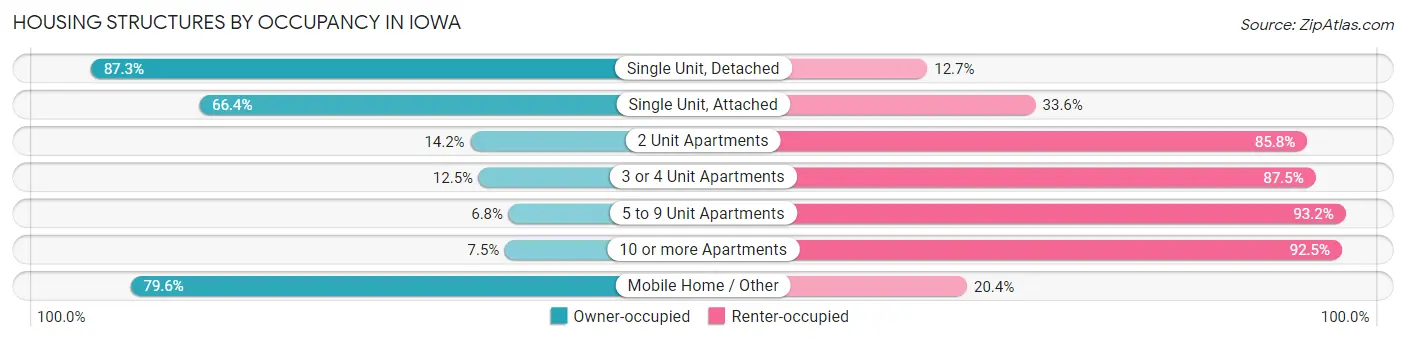
| Structure Type | Owner-occupied | Renter-occupied |
| Single Unit, Detached | 831,152 (87.3%) | 121,257 (12.7%) |
| Single Unit, Attached | 37,333 (66.4%) | 18,881 (33.6%) |
| 2 Unit Apartments | 3,609 (14.2%) | 21,876 (85.8%) |
| 3 or 4 Unit Apartments | 5,139 (12.5%) | 35,870 (87.5%) |
| 5 to 9 Unit Apartments | 2,953 (6.8%) | 40,729 (93.2%) |
| 10 or more Apartments | 9,721 (7.5%) | 120,450 (92.5%) |
| Mobile Home / Other | 32,777 (79.6%) | 8,392 (20.4%) |
| Total | 922,684 (71.5%) | 367,455 (28.5%) |
Housing Structures by Number of Rooms in Iowa
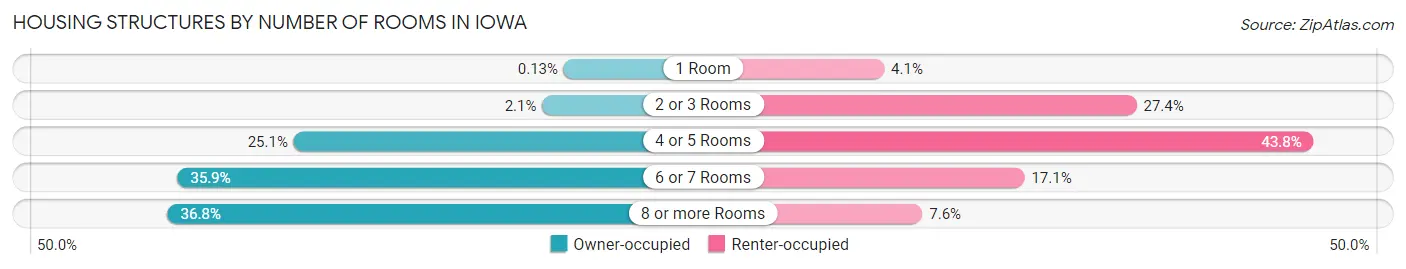
| Number of Rooms | Owner-occupied | Renter-occupied |
| 1 Room | 1,244 (0.1%) | 15,026 (4.1%) |
| 2 or 3 Rooms | 19,515 (2.1%) | 100,790 (27.4%) |
| 4 or 5 Rooms | 231,692 (25.1%) | 160,934 (43.8%) |
| 6 or 7 Rooms | 330,922 (35.9%) | 62,707 (17.1%) |
| 8 or more Rooms | 339,311 (36.8%) | 27,998 (7.6%) |
| Total | 922,684 (100.0%) | 367,455 (100.0%) |
Housing Structure by Heating Type in Iowa
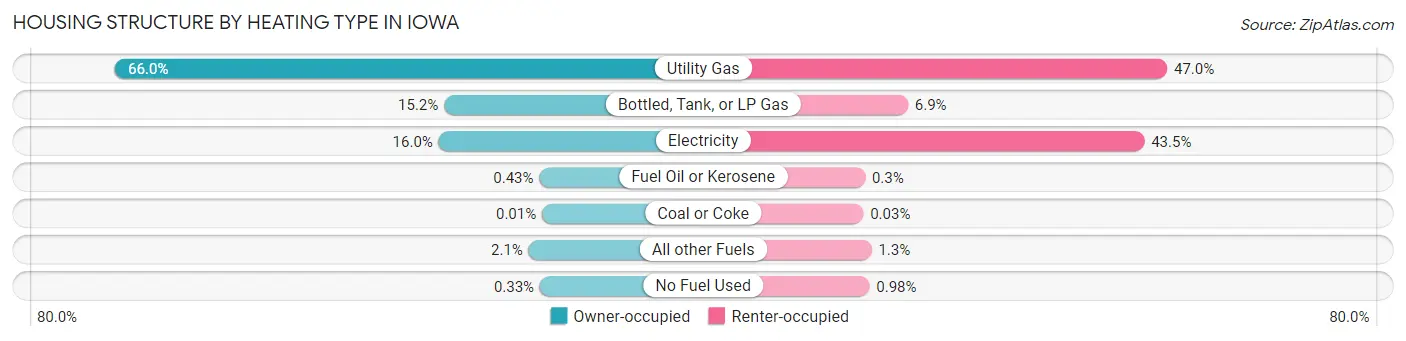
| Heating Type | Owner-occupied | Renter-occupied |
| Utility Gas | 609,037 (66.0%) | 172,655 (47.0%) |
| Bottled, Tank, or LP Gas | 139,812 (15.1%) | 25,448 (6.9%) |
| Electricity | 147,505 (16.0%) | 159,726 (43.5%) |
| Fuel Oil or Kerosene | 3,968 (0.4%) | 1,106 (0.3%) |
| Coal or Coke | 118 (0.0%) | 114 (0.0%) |
| All other Fuels | 19,181 (2.1%) | 4,792 (1.3%) |
| No Fuel Used | 3,063 (0.3%) | 3,614 (1.0%) |
| Total | 922,684 (100.0%) | 367,455 (100.0%) |
Household Vehicle Usage in Iowa
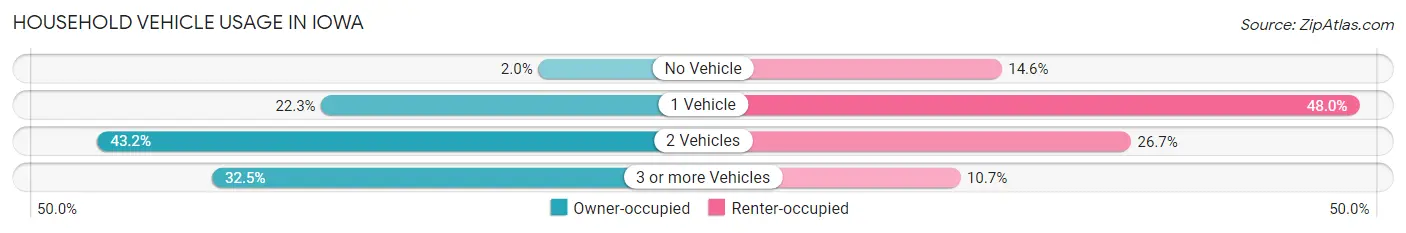
| Vehicles per Household | Owner-occupied | Renter-occupied |
| No Vehicle | 18,715 (2.0%) | 53,664 (14.6%) |
| 1 Vehicle | 205,671 (22.3%) | 176,379 (48.0%) |
| 2 Vehicles | 398,541 (43.2%) | 97,959 (26.7%) |
| 3 or more Vehicles | 299,757 (32.5%) | 39,453 (10.7%) |
| Total | 922,684 (100.0%) | 367,455 (100.0%) |
Real Estate & Mortgages in Iowa
Real Estate and Mortgage Overview in Iowa
| Characteristic | Without Mortgage | With Mortgage |
| Housing Units | 370,412 | 552,272 |
| Median Property Value | $162,200 | $194,000 |
| Median Household Income | $65,580 | $129,965 |
| Monthly Housing Costs | $572 | $31,649 |
| Real Estate Taxes | $2,434 | $10,432 |
Property Value by Mortgage Status in Iowa
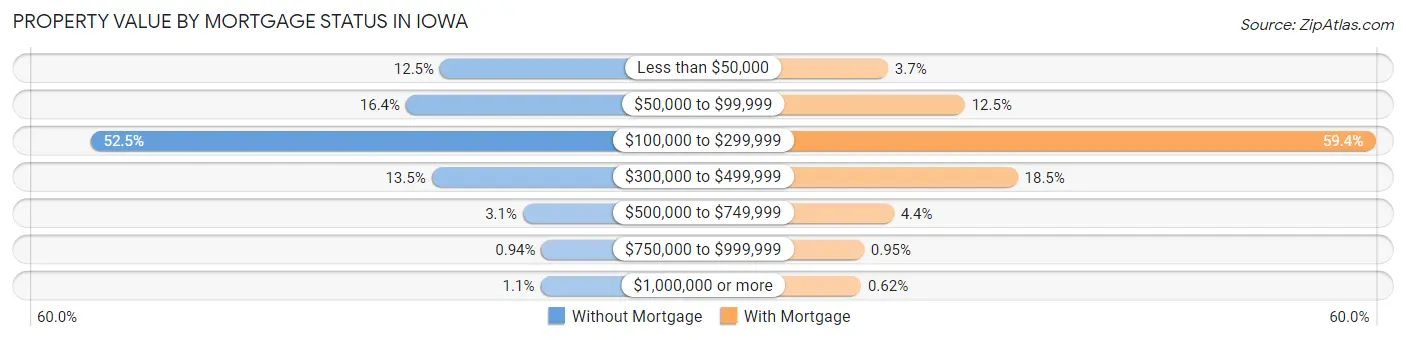
| Property Value | Without Mortgage | With Mortgage |
| Less than $50,000 | 46,451 (12.5%) | 20,438 (3.7%) |
| $50,000 to $99,999 | 60,867 (16.4%) | 68,916 (12.5%) |
| $100,000 to $299,999 | 194,321 (52.5%) | 327,897 (59.4%) |
| $300,000 to $499,999 | 49,989 (13.5%) | 102,280 (18.5%) |
| $500,000 to $749,999 | 11,348 (3.1%) | 24,063 (4.4%) |
| $750,000 to $999,999 | 3,487 (0.9%) | 5,246 (0.9%) |
| $1,000,000 or more | 3,949 (1.1%) | 3,432 (0.6%) |
| Total | 370,412 (100.0%) | 552,272 (100.0%) |
Household Income by Mortgage Status in Iowa
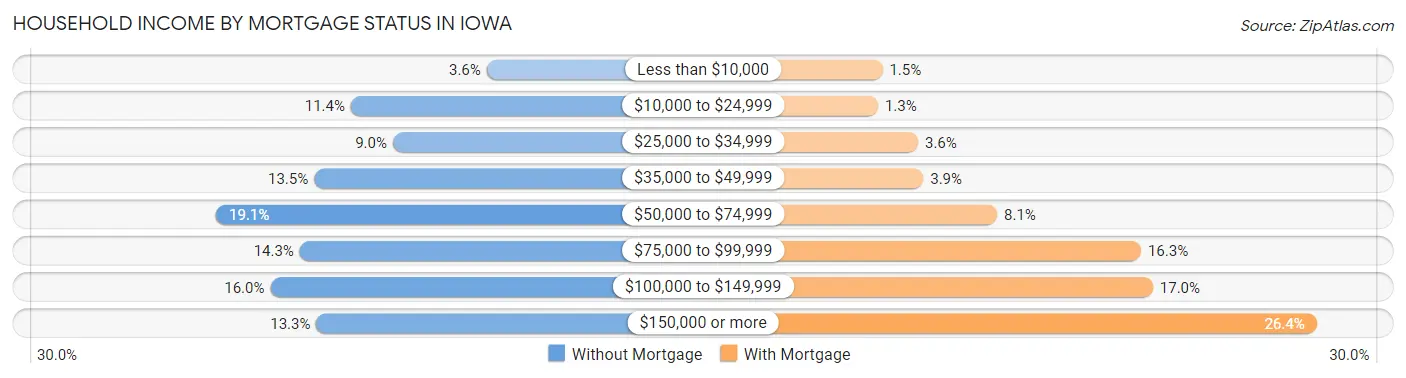
| Household Income | Without Mortgage | With Mortgage |
| Less than $10,000 | 13,332 (3.6%) | 8,478 (1.5%) |
| $10,000 to $24,999 | 42,081 (11.4%) | 7,066 (1.3%) |
| $25,000 to $34,999 | 33,199 (9.0%) | 19,722 (3.6%) |
| $35,000 to $49,999 | 49,852 (13.5%) | 21,390 (3.9%) |
| $50,000 to $74,999 | 70,587 (19.1%) | 44,683 (8.1%) |
| $75,000 to $99,999 | 52,877 (14.3%) | 90,101 (16.3%) |
| $100,000 to $149,999 | 59,115 (16.0%) | 93,805 (17.0%) |
| $150,000 or more | 49,369 (13.3%) | 145,540 (26.4%) |
| Total | 370,412 (100.0%) | 552,272 (100.0%) |
Property Value to Household Income Ratio in Iowa
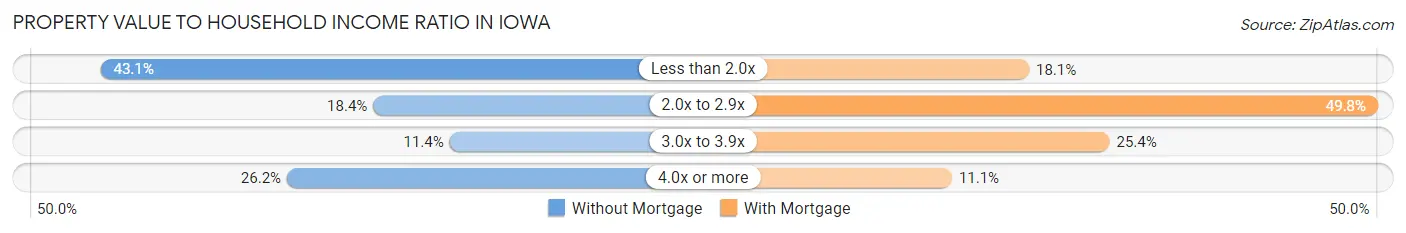
| Value-to-Income Ratio | Without Mortgage | With Mortgage |
| Less than 2.0x | 159,645 (43.1%) | 99,833 (18.1%) |
| 2.0x to 2.9x | 67,955 (18.3%) | 274,770 (49.7%) |
| 3.0x to 3.9x | 42,251 (11.4%) | 140,226 (25.4%) |
| 4.0x or more | 96,992 (26.2%) | 61,215 (11.1%) |
| Total | 370,412 (100.0%) | 552,272 (100.0%) |
Real Estate Taxes by Mortgage Status in Iowa
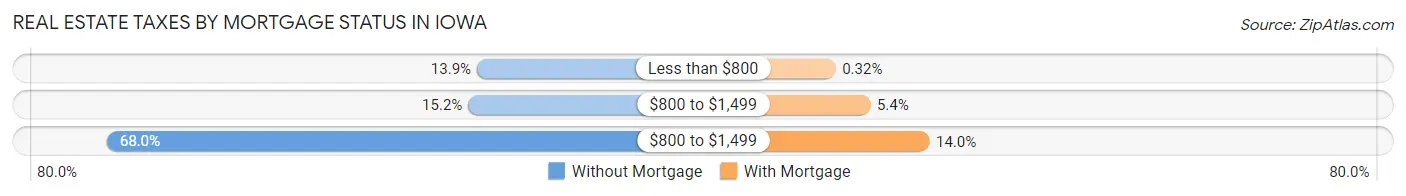
| Property Taxes | Without Mortgage | With Mortgage |
| Less than $800 | 51,511 (13.9%) | 1,767 (0.3%) |
| $800 to $1,499 | 56,261 (15.2%) | 29,749 (5.4%) |
| $800 to $1,499 | 251,845 (68.0%) | 77,464 (14.0%) |
| Total | 370,412 (100.0%) | 552,272 (100.0%) |
Health & Disability in Iowa
Health Insurance Coverage by Age in Iowa
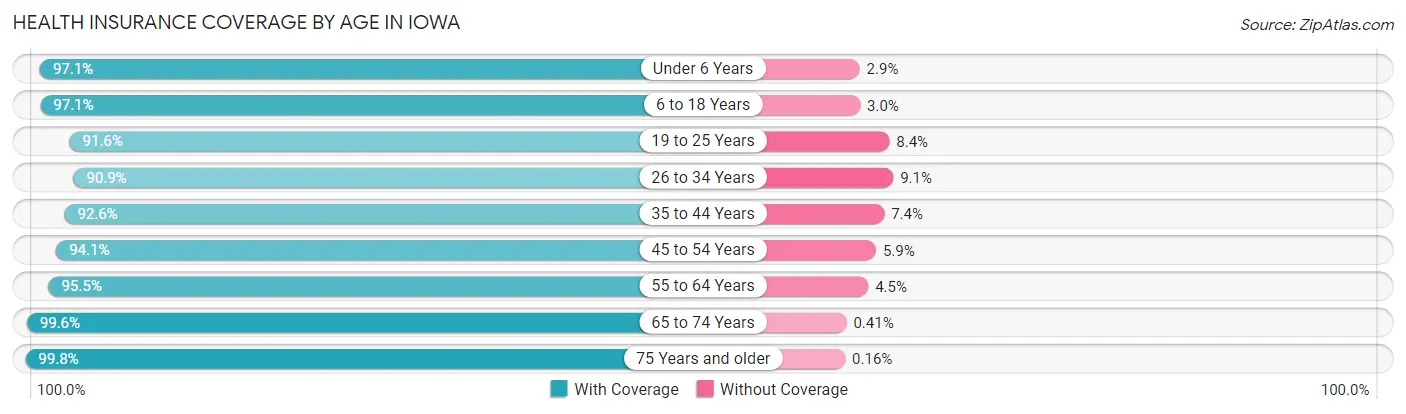
| Age Bracket | With Coverage | Without Coverage |
| Under 6 Years | 223,829 (97.1%) | 6,618 (2.9%) |
| 6 to 18 Years | 530,550 (97.1%) | 16,133 (2.9%) |
| 19 to 25 Years | 288,132 (91.6%) | 26,425 (8.4%) |
| 26 to 34 Years | 319,528 (90.9%) | 32,068 (9.1%) |
| 35 to 44 Years | 362,138 (92.6%) | 29,124 (7.4%) |
| 45 to 54 Years | 340,744 (94.1%) | 21,389 (5.9%) |
| 55 to 64 Years | 392,814 (95.5%) | 18,341 (4.5%) |
| 65 to 74 Years | 315,193 (99.6%) | 1,292 (0.4%) |
| 75 Years and older | 217,980 (99.8%) | 360 (0.2%) |
| Total | 2,990,908 (95.2%) | 151,750 (4.8%) |
Health Insurance Coverage by Citizenship Status in Iowa
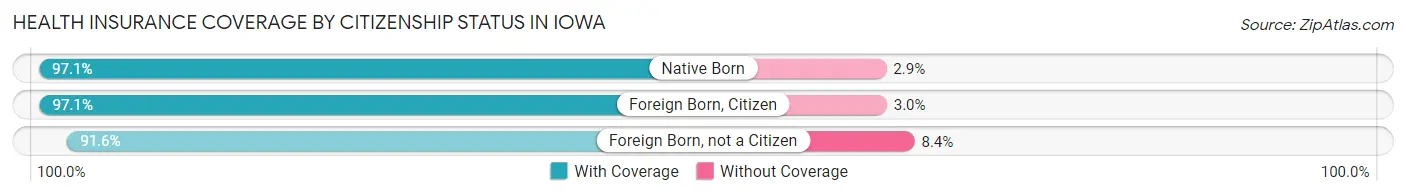
| Citizenship Status | With Coverage | Without Coverage |
| Native Born | 223,829 (97.1%) | 6,618 (2.9%) |
| Foreign Born, Citizen | 530,550 (97.1%) | 16,133 (2.9%) |
| Foreign Born, not a Citizen | 288,132 (91.6%) | 26,425 (8.4%) |
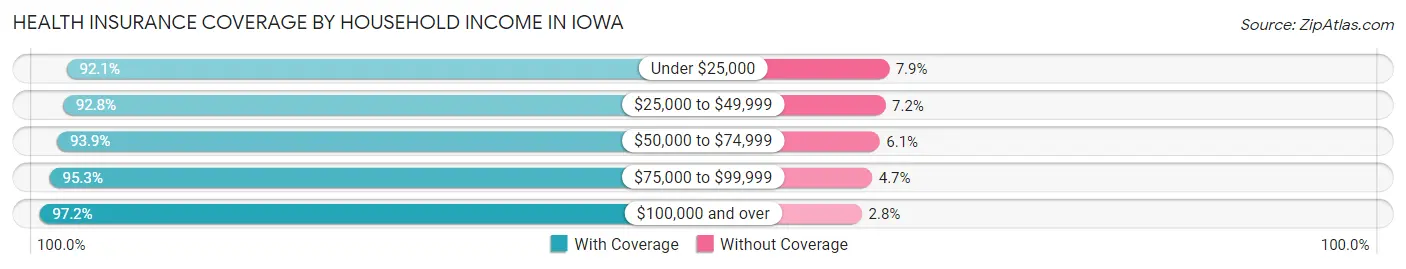
Health Insurance Coverage by Household Income in Iowa
| Household Income | With Coverage | Without Coverage |
| Under $25,000 | 292,175 (92.1%) | 24,932 (7.9%) |
| $25,000 to $49,999 | 448,370 (92.8%) | 34,611 (7.2%) |
| $50,000 to $74,999 | 494,327 (93.9%) | 32,089 (6.1%) |
| $75,000 to $99,999 | 458,418 (95.3%) | 22,491 (4.7%) |
| $100,000 and over | 1,244,421 (97.2%) | 35,464 (2.8%) |
Public vs Private Health Insurance Coverage by Age in Iowa

| Age Bracket | Public Insurance | Private Insurance |
| Under 6 | 95,746 (41.5%) | 142,768 (62.0%) |
| 6 to 18 Years | 190,458 (34.8%) | 375,010 (68.6%) |
| 19 to 25 Years | 57,715 (18.3%) | 242,070 (77.0%) |
| 25 to 34 Years | 68,370 (19.5%) | 263,506 (75.0%) |
| 35 to 44 Years | 68,054 (17.4%) | 307,800 (78.7%) |
| 45 to 54 Years | 55,164 (15.2%) | 298,233 (82.4%) |
| 55 to 64 Years | 82,261 (20.0%) | 331,885 (80.7%) |
| 65 to 74 Years | 303,687 (96.0%) | 196,084 (62.0%) |
| 75 Years and over | 216,923 (99.4%) | 148,939 (68.2%) |
| Total | 1,138,378 (36.2%) | 2,306,295 (73.4%) |
Disability Status by Sex by Age in Iowa
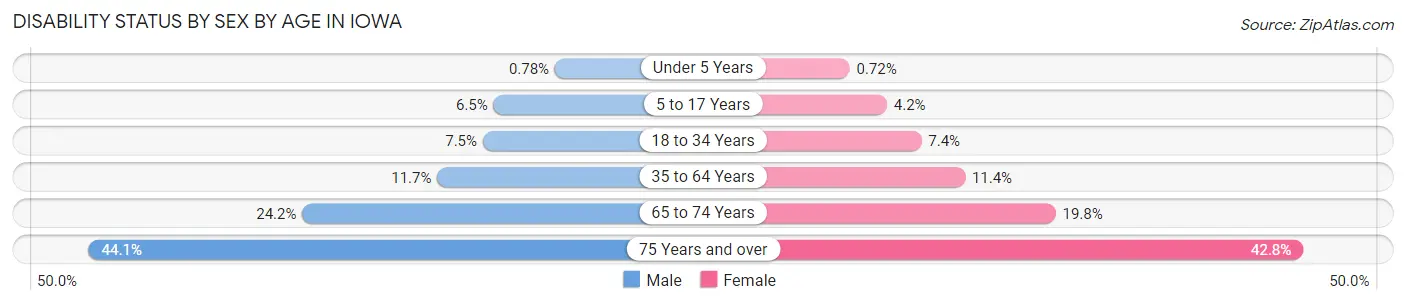
| Age Bracket | Male | Female |
| Under 5 Years | 754 (0.8%) | 669 (0.7%) |
| 5 to 17 Years | 17,863 (6.5%) | 10,991 (4.2%) |
| 18 to 34 Years | 27,279 (7.5%) | 25,758 (7.4%) |
| 35 to 64 Years | 68,926 (11.7%) | 65,765 (11.4%) |
| 65 to 74 Years | 37,340 (24.2%) | 32,225 (19.8%) |
| 75 Years and over | 39,877 (44.1%) | 54,716 (42.8%) |
Disability Class by Sex by Age in Iowa
Disability Class: Hearing Difficulty
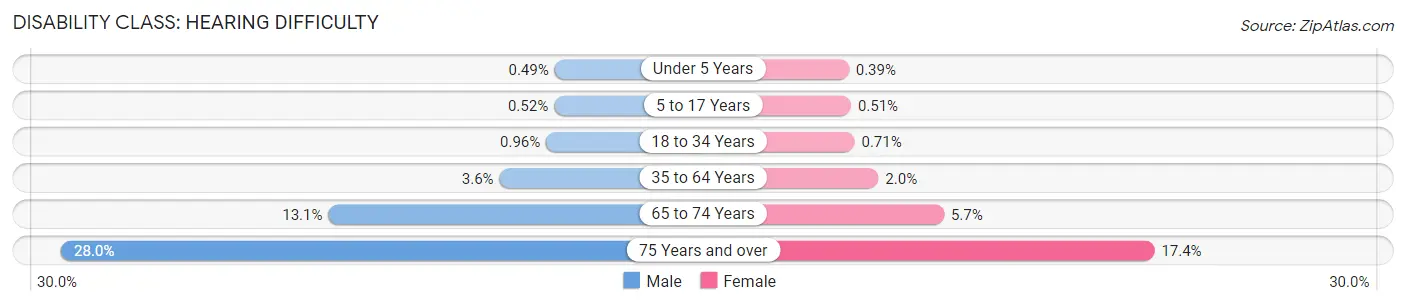
| Age Bracket | Male | Female |
| Under 5 Years | 477 (0.5%) | 358 (0.4%) |
| 5 to 17 Years | 1,437 (0.5%) | 1,340 (0.5%) |
| 18 to 34 Years | 3,492 (1.0%) | 2,485 (0.7%) |
| 35 to 64 Years | 20,967 (3.6%) | 11,760 (2.0%) |
| 65 to 74 Years | 20,177 (13.1%) | 9,247 (5.7%) |
| 75 Years and over | 25,318 (28.0%) | 22,253 (17.4%) |
Disability Class: Vision Difficulty
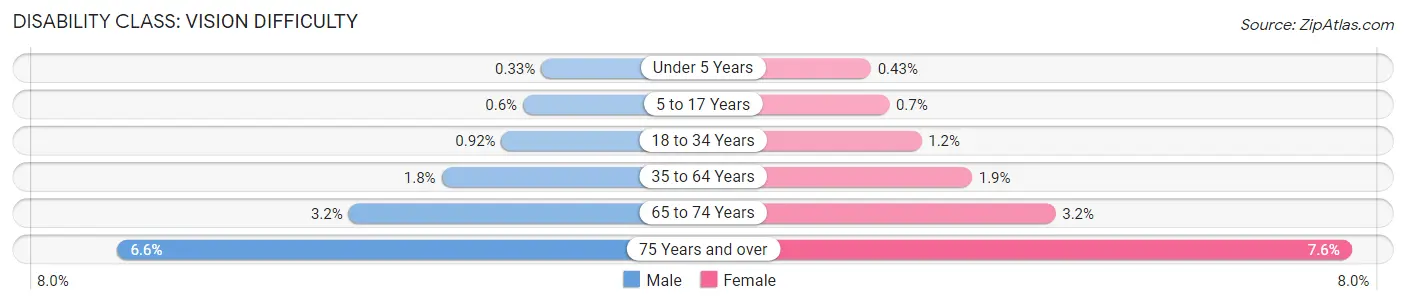
| Age Bracket | Male | Female |
| Under 5 Years | 319 (0.3%) | 398 (0.4%) |
| 5 to 17 Years | 1,670 (0.6%) | 1,833 (0.7%) |
| 18 to 34 Years | 3,376 (0.9%) | 4,132 (1.2%) |
| 35 to 64 Years | 10,689 (1.8%) | 11,122 (1.9%) |
| 65 to 74 Years | 4,920 (3.2%) | 5,145 (3.2%) |
| 75 Years and over | 5,996 (6.6%) | 9,670 (7.6%) |
Disability Class: Cognitive Difficulty
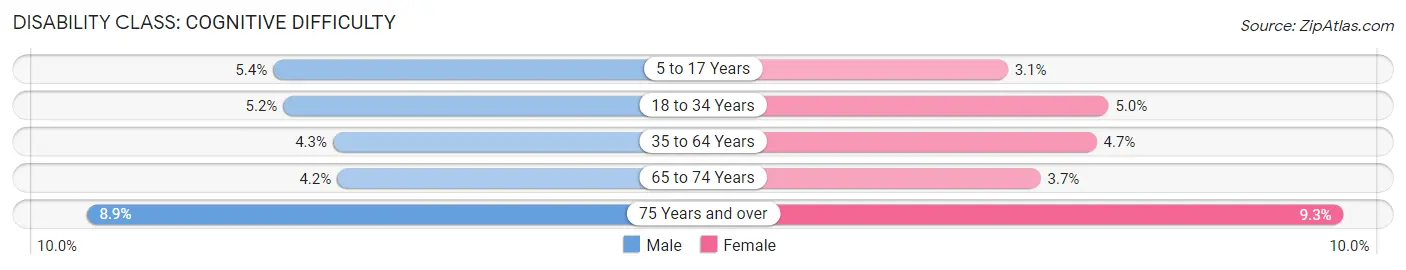
| Age Bracket | Male | Female |
| 5 to 17 Years | 14,897 (5.4%) | 8,101 (3.1%) |
| 18 to 34 Years | 19,005 (5.2%) | 17,278 (5.0%) |
| 35 to 64 Years | 25,221 (4.3%) | 27,216 (4.7%) |
| 65 to 74 Years | 6,479 (4.2%) | 5,994 (3.7%) |
| 75 Years and over | 8,010 (8.8%) | 11,893 (9.3%) |
Disability Class: Ambulatory Difficulty
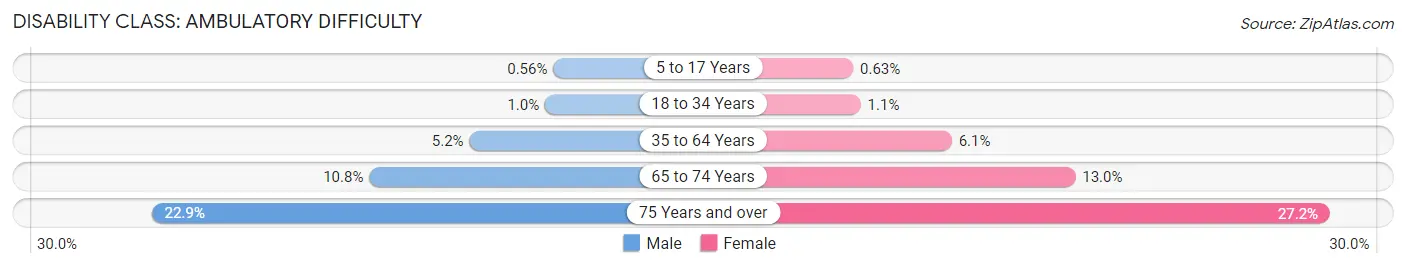
| Age Bracket | Male | Female |
| 5 to 17 Years | 1,539 (0.6%) | 1,644 (0.6%) |
| 18 to 34 Years | 3,711 (1.0%) | 3,666 (1.1%) |
| 35 to 64 Years | 30,833 (5.2%) | 35,196 (6.1%) |
| 65 to 74 Years | 16,657 (10.8%) | 21,110 (13.0%) |
| 75 Years and over | 20,762 (22.9%) | 34,733 (27.2%) |
Disability Class: Self-Care Difficulty
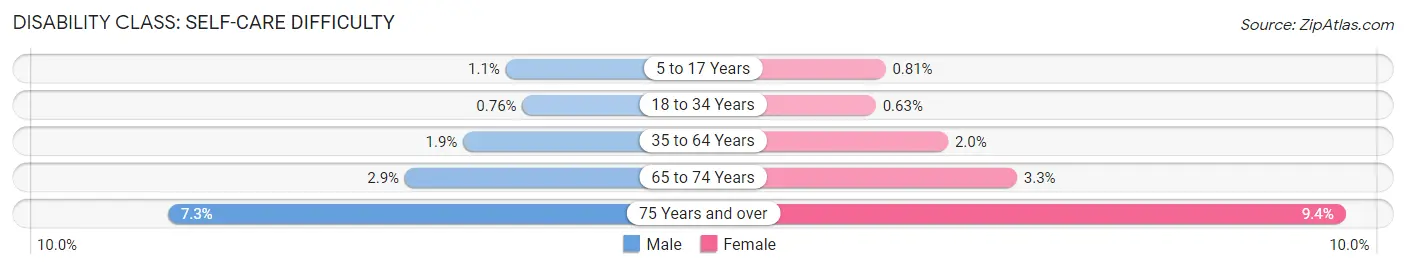
| Age Bracket | Male | Female |
| 5 to 17 Years | 2,952 (1.1%) | 2,130 (0.8%) |
| 18 to 34 Years | 2,786 (0.8%) | 2,201 (0.6%) |
| 35 to 64 Years | 10,961 (1.9%) | 11,306 (2.0%) |
| 65 to 74 Years | 4,528 (2.9%) | 5,283 (3.3%) |
| 75 Years and over | 6,645 (7.3%) | 11,953 (9.3%) |
Technology Access in Iowa
Computing Device Access in Iowa
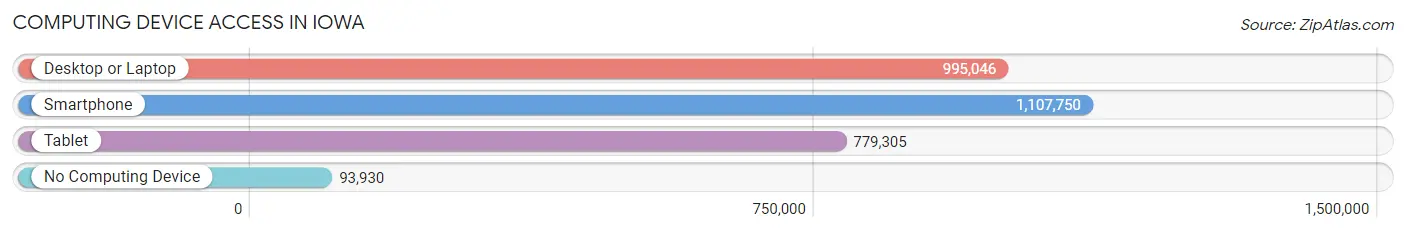
| Device Type | # Households | % Households |
| Desktop or Laptop | 995,046 | 77.1% |
| Smartphone | 1,107,750 | 85.9% |
| Tablet | 779,305 | 60.4% |
| No Computing Device | 93,930 | 7.3% |
| Total | 1,290,139 | 100.0% |
Internet Access in Iowa
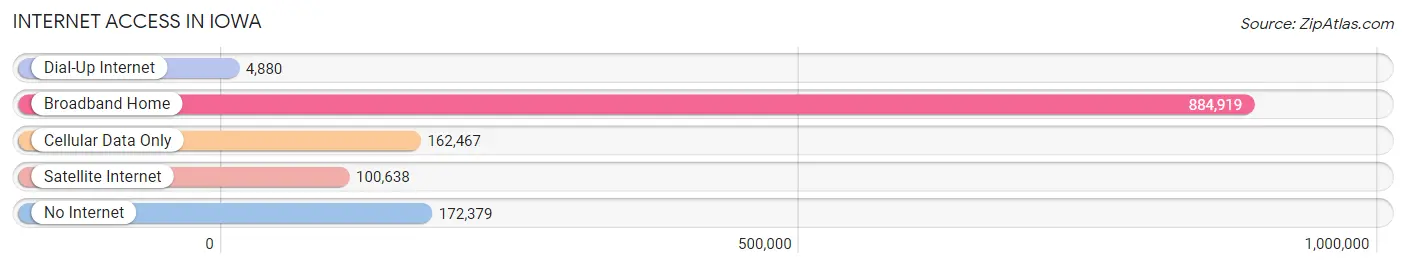
| Internet Type | # Households | % Households |
| Dial-Up Internet | 4,880 | 0.4% |
| Broadband Home | 884,919 | 68.6% |
| Cellular Data Only | 162,467 | 12.6% |
| Satellite Internet | 100,638 | 7.8% |
| No Internet | 172,379 | 13.4% |
| Total | 1,290,139 | 100.0% |
Iowa Summary
Iowa is a state located in the Midwestern United States. It is bordered by Minnesota to the north, Wisconsin and Illinois to the east, Missouri to the south, and South Dakota and Nebraska to the west. Iowa is the 26th most populous state in the United States, with a population of 3.2 million people as of 2019.
Geography
Iowa is located in the Midwestern United States, bordered by Minnesota to the north, Wisconsin and Illinois to the east, Missouri to the south, and South Dakota and Nebraska to the west. The state has an area of 56,272 square miles, making it the 26th largest state in the country. Iowa is divided into 99 counties and has five major geographic regions: the Driftless Area in the northeast, the Central Plains in the east, the Des Moines Lobe in the south, the Loess Hills in the southwest, and the Great Plains in the northwest.
The state is home to a variety of landscapes, including rolling hills, prairies, and woodlands. The highest point in Iowa is Hawkeye Point, located in the Loess Hills region, at 1,670 feet above sea level. The state is also home to several major rivers, including the Mississippi, Missouri, and Big Sioux.
History
The first inhabitants of Iowa were Native American tribes, including the Sioux, Fox, and Ioway. The first Europeans to explore the area were French explorers in the late 17th century. The area was part of the Louisiana Purchase in 1803, and became part of the United States in 1804.
Iowa was part of the Wisconsin Territory until 1838, when it became its own territory. In 1846, Iowa became the 29th state in the Union. During the Civil War, Iowa was a major supplier of food and other supplies to the Union Army.
Economy
Iowa has a diverse economy, with a mix of agriculture, manufacturing, and services. The state is a major producer of corn, soybeans, pork, and eggs. Iowa is also a major producer of ethanol and biodiesel.
Manufacturing is a major part of the state’s economy, with products ranging from farm equipment to food processing. Iowa is also home to a number of technology companies, including Rockwell Collins and Microsoft.
The state’s service sector is also important, with a focus on finance, insurance, and real estate. Tourism is also a major industry, with attractions such as the Amana Colonies, the Field of Dreams movie site, and the Iowa State Fair.
Demographics
As of 2019, Iowa had a population of 3.2 million people. The state is predominantly white, with a population that is 85.3% non-Hispanic white. The state also has a significant Hispanic population, at 6.2%, and a small African American population, at 3.3%.
The median household income in Iowa is $58,906, and the median home value is $156,400. The state’s poverty rate is 11.2%, slightly lower than the national average.
Conclusion
Iowa is a state located in the Midwestern United States, with a population of 3.2 million people. The state has a diverse economy, with a mix of agriculture, manufacturing, and services. Iowa is predominantly white, with a significant Hispanic population and a small African American population. The state has a median household income of $58,906 and a median home value of $156,400.
Common Questions
When was Iowa Incorporated?
Iowa was Incorporated into the Union on Dec 28, 1846.
What is the Total Area of Iowa?
Total Area of Iowa is 56,273 Square Miles.
What is the Total Land Area of Iowa?
Total Land Area of Iowa is 55,858 Square Miles.
What is the Total Water Area of Iowa?
Total Water Area of Iowa is 415 Square Miles.
What is the Average Elevation in Iowa?
Average Elevation in Iowa is 1,100 Feet.
What is the Highest Elevation in Iowa?
Highest Elevation in Iowa is 1,670 Feet.
What is the Lowest Elevation in Iowa?
Lowest Elevation in Iowa is 480 Feet.
What is the Population Density in Iowa?
Population Density in Iowa is 57.1 People per Square Mile.
What is Per Capita Income in Iowa?
Per Capita income in Iowa is $37,949.
What is the Median Family Income in Iowa?
Median Family Income in Iowa is $90,921.
What is the Median Household income in Iowa?
Median Household Income in Iowa is $70,571.
What is Income or Wage Gap in Iowa?
Income or Wage Gap in Iowa is 29.9%.
Women in Iowa earn 70.1 cents for every dollar earned by a man.
What is Family Income Deficit in Iowa?
Family Income Deficit in Iowa is $10,739.
Families that are below poverty line in Iowa earn $10,739 less on average than the poverty threshold level.
What is Inequality or Gini Index in Iowa?
Inequality or Gini Index in Iowa is 0.44.
What is the Total Population of Iowa?
Total Population of Iowa is 3,188,836.
What is the Total Male Population of Iowa?
Total Male Population of Iowa is 1,598,555.
What is the Total Female Population of Iowa?
Total Female Population of Iowa is 1,590,281.
What is the Ratio of Males per 100 Females in Iowa?
There are 100.52 Males per 100 Females in Iowa.
What is the Ratio of Females per 100 Males in Iowa?
There are 99.48 Females per 100 Males in Iowa.
What is the Median Population Age in Iowa?
Median Population Age in Iowa is 38.4 Years.
What is the Average Family Size in Iowa
Average Family Size in Iowa is 3.0 People.
What is the Average Household Size in Iowa
Average Household Size in Iowa is 2.4 People.
How Large is the Labor Force in Iowa?
There are 1,694,783 People in the Labor Forcein in Iowa.
What is the Percentage of People in the Labor Force in Iowa?
66.6% of People are in the Labor Force in Iowa.
What is the Unemployment Rate in Iowa?
Unemployment Rate in Iowa is 3.8%.