Cities with the Highest Percentage of State Government Employees in the United States
RELATED REPORTS & OPTIONS
State Government Employees
United States
Compare Cities
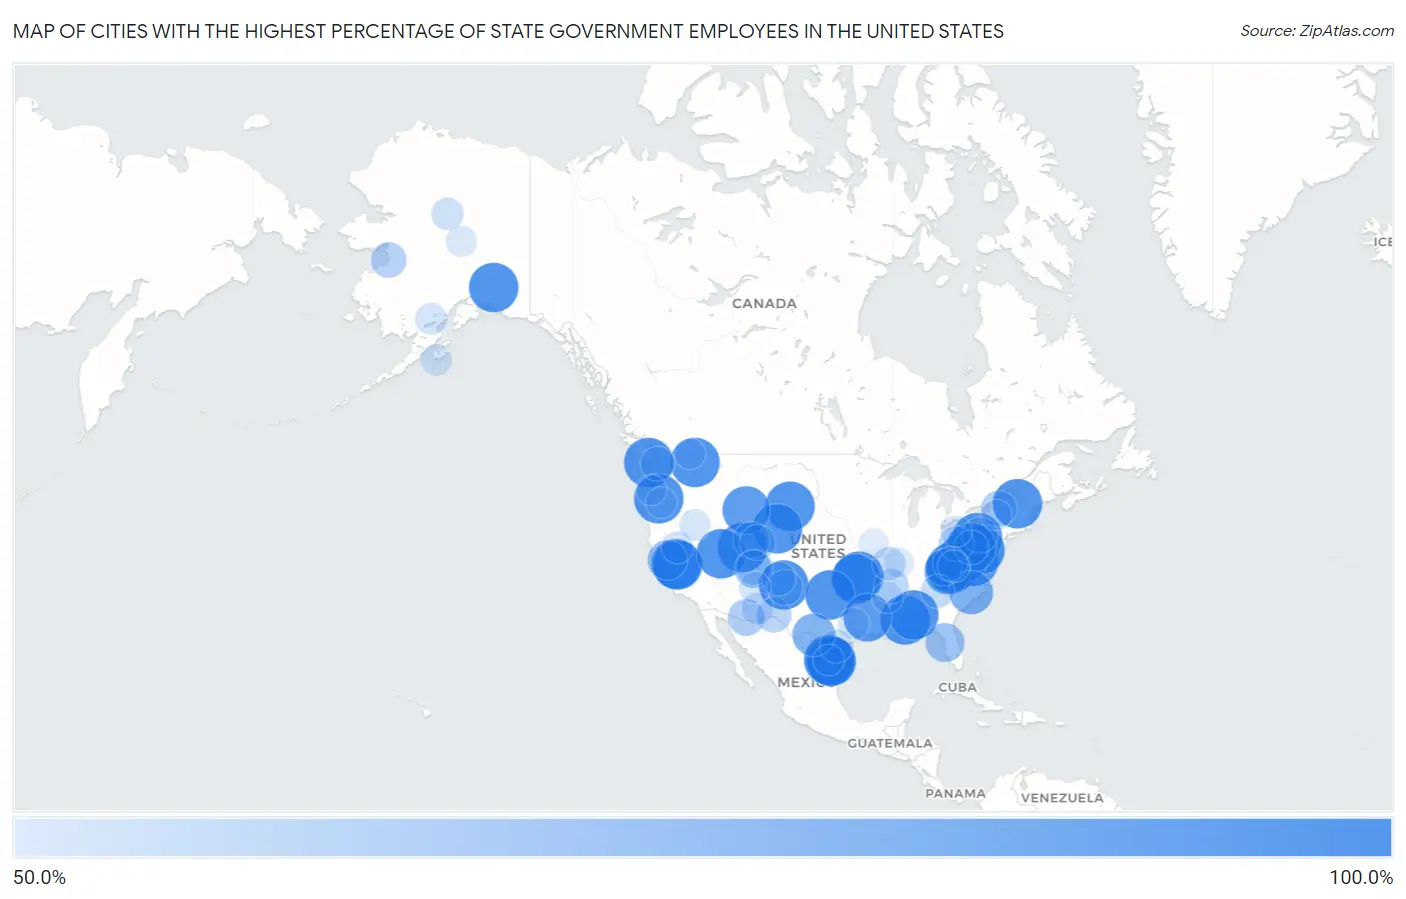
Map of Cities with the Highest Percentage of State Government Employees in the United States
0.0%
100.0%
Cities with the Highest Percentage of State Government Employees in the United States
| City | % State Government Employees | vs State | vs National | |
| 1. | Chaparrito | 100.0% | 4.1%(+95.9)#1 | 4.2%(+95.8)#1 |
| 2. | Berwind | 100.0% | 8.1%(+91.9)#1 | 4.2%(+95.8)#2 |
| 3. | North Escobares | 100.0% | 4.1%(+95.9)#2 | 4.2%(+95.8)#3 |
| 4. | Free Union | 100.0% | 4.1%(+95.9)#1 | 4.2%(+95.8)#4 |
| 5. | Roderfield | 100.0% | 8.1%(+91.9)#2 | 4.2%(+95.8)#5 |
| 6. | Baileyville | 100.0% | 3.1%(+96.9)#1 | 4.2%(+95.8)#6 |
| 7. | Brush Creek | 100.0% | 6.1%(+93.9)#1 | 4.2%(+95.8)#7 |
| 8. | Bud | 100.0% | 8.1%(+91.9)#3 | 4.2%(+95.8)#8 |
| 9. | Valley | 100.0% | 5.3%(+94.7)#1 | 4.2%(+95.8)#9 |
| 10. | Foresta | 100.0% | 4.1%(+95.9)#1 | 4.2%(+95.8)#10 |
| 11. | Tibbie | 100.0% | 5.5%(+94.5)#1 | 4.2%(+95.8)#11 |
| 12. | East Montpelier | 100.0% | 4.6%(+95.4)#1 | 4.2%(+95.8)#12 |
| 13. | Antietam | 100.0% | 4.3%(+95.7)#1 | 4.2%(+95.8)#13 |
| 14. | Sekiu | 100.0% | 5.3%(+94.7)#2 | 4.2%(+95.8)#14 |
| 15. | Chinese Camp | 100.0% | 4.1%(+95.9)#2 | 4.2%(+95.8)#16 |
| 16. | Unity | 100.0% | 3.4%(+96.6)#1 | 4.2%(+95.8)#17 |
| 17. | Mcdowell | 100.0% | 4.1%(+95.9)#2 | 4.2%(+95.8)#18 |
| 18. | Scott | 100.0% | 8.2%(+91.8)#1 | 4.2%(+95.8)#19 |
| 19. | Iron Post | 100.0% | 6.1%(+93.9)#2 | 4.2%(+95.8)#20 |
| 20. | West Scio | 100.0% | 5.3%(+94.7)#1 | 4.2%(+95.8)#21 |
| 21. | Valley Head | 100.0% | 8.1%(+91.9)#4 | 4.2%(+95.8)#22 |
| 22. | Osage | 100.0% | 6.9%(+93.1)#1 | 4.2%(+95.8)#23 |
| 23. | Tolsona | 100.0% | 8.4%(+91.6)#1 | 4.2%(+95.8)#24 |
| 24. | National | 100.0% | 4.3%(+95.7)#2 | 4.2%(+95.8)#25 |
| 25. | Coulterville | 100.0% | 4.1%(+95.9)#3 | 4.2%(+95.8)#26 |
| 26. | Tecolote | 100.0% | 7.5%(+92.5)#1 | 4.2%(+95.8)#27 |
| 27. | Clear Creek | 100.0% | 5.3%(+94.7)#1 | 4.2%(+95.8)#28 |
| 28. | Baker | 100.0% | 3.3%(+96.7)#1 | 4.2%(+95.8)#29 |
| 29. | Oak Hill | 100.0% | 5.5%(+94.5)#2 | 4.2%(+95.8)#30 |
| 30. | Knob Lick | 100.0% | 3.9%(+96.1)#1 | 4.2%(+95.8)#31 |
| 31. | Needham | 100.0% | 3.3%(+96.7)#1 | 4.2%(+95.8)#32 |
| 32. | Gregory | 100.0% | 6.6%(+93.4)#1 | 4.2%(+95.8)#33 |
| 33. | Gutierrez | 100.0% | 4.1%(+95.9)#3 | 4.2%(+95.8)#34 |
| 34. | Princeton | 100.0% | 6.6%(+93.4)#2 | 4.2%(+95.8)#35 |
| 35. | Hopeton | 100.0% | 6.1%(+93.9)#3 | 4.2%(+95.8)#36 |
| 36. | Loveland | 100.0% | 6.1%(+93.9)#4 | 4.2%(+95.8)#37 |
| 37. | Arlington | 100.0% | 6.9%(+93.1)#2 | 4.2%(+95.8)#38 |
| 38. | Belmont | 96.4% | 5.8%(+90.7)#1 | 4.2%(+92.2)#39 |
| 39. | Kelly | 95.5% | 6.9%(+88.6)#3 | 4.2%(+91.2)#40 |
| 40. | Dante | 91.7% | 4.1%(+87.6)#3 | 4.2%(+87.4)#41 |
| 41. | Statesville | 87.8% | 3.8%(+84.0)#1 | 4.2%(+83.5)#42 |
| 42. | Butters | 86.2% | 5.4%(+80.8)#1 | 4.2%(+82.0)#43 |
| 43. | Box Canyon | 84.2% | 4.1%(+80.1)#4 | 4.2%(+80.0)#44 |
| 44. | Salineno | 79.2% | 4.1%(+75.1)#5 | 4.2%(+74.9)#45 |
| 45. | Courtland | 77.4% | 4.1%(+73.3)#4 | 4.2%(+73.1)#46 |
| 46. | Pine Island | 75.4% | 2.9%(+72.6)#1 | 4.2%(+71.2)#47 |
| 47. | Bluff | 74.1% | 5.3%(+68.8)#2 | 4.2%(+69.8)#48 |
| 48. | Roots | 73.8% | 3.1%(+70.7)#2 | 4.2%(+69.6)#49 |
| 49. | Torreon Cdp Torrance County | 71.6% | 7.5%(+64.0)#2 | 4.2%(+67.3)#50 |
| 50. | Elgin | 70.4% | 4.4%(+66.0)#1 | 4.2%(+66.1)#51 |
| 51. | Mcdowell | 69.8% | 5.5%(+64.3)#1 | 4.2%(+65.6)#52 |
| 52. | Whiterocks | 69.2% | 5.3%(+64.0)#3 | 4.2%(+65.0)#53 |
| 53. | Thendara | 68.3% | 4.3%(+64.0)#1 | 4.2%(+64.0)#54 |
| 54. | Hublersburg | 67.6% | 3.1%(+64.6)#3 | 4.2%(+63.4)#55 |
| 55. | Unalakleet | 67.4% | 8.4%(+59.0)#2 | 4.2%(+63.2)#56 |
| 56. | Dinosaur | 67.3% | 3.8%(+63.5)#1 | 4.2%(+63.1)#57 |
| 57. | Prado Verde | 67.0% | 4.1%(+62.9)#6 | 4.2%(+62.7)#58 |
| 58. | Anton Chico | 66.7% | 7.5%(+59.1)#3 | 4.2%(+62.4)#59 |
| 59. | Bridger | 66.7% | 4.5%(+62.2)#1 | 4.2%(+62.4)#60 |
| 60. | Bannock | 66.0% | 3.1%(+62.9)#1 | 4.2%(+61.8)#61 |
| 61. | White Mesa | 65.4% | 5.3%(+60.1)#4 | 4.2%(+61.1)#62 |
| 62. | Jericho | 65.2% | 6.6%(+58.6)#3 | 4.2%(+61.0)#63 |
| 63. | Jamestown | 64.7% | 5.3%(+59.4)#3 | 4.2%(+60.5)#64 |
| 64. | Grahamtown | 64.5% | 4.3%(+60.1)#3 | 4.2%(+60.2)#65 |
| 65. | Monaville | 64.3% | 8.1%(+56.2)#5 | 4.2%(+60.0)#66 |
| 66. | Runnelstown | 63.9% | 8.2%(+55.7)#2 | 4.2%(+59.6)#67 |
| 67. | Lyden | 63.5% | 7.5%(+55.9)#4 | 4.2%(+59.2)#68 |
| 68. | Deer Creek | 63.2% | 3.3%(+59.8)#2 | 4.2%(+58.9)#69 |
| 69. | Sautee Nacoochee | 62.6% | 4.2%(+58.4)#1 | 4.2%(+58.4)#70 |
| 70. | Wortham | 62.5% | 3.9%(+58.6)#2 | 4.2%(+58.3)#71 |
| 71. | Edgewater Estates | 61.9% | 4.1%(+57.8)#7 | 4.2%(+57.7)#72 |
| 72. | Talma | 60.0% | 3.3%(+56.7)#3 | 4.2%(+55.8)#73 |
| 73. | Matheson | 60.0% | 3.8%(+56.2)#2 | 4.2%(+55.8)#74 |
| 74. | Allakaket | 59.7% | 8.4%(+51.3)#3 | 4.2%(+55.5)#75 |
| 75. | Virden | 59.3% | 7.5%(+51.7)#5 | 4.2%(+55.0)#76 |
| 76. | Walesboro | 59.2% | 3.3%(+55.9)#4 | 4.2%(+55.0)#77 |
| 77. | Sierra Brooks | 59.1% | 4.1%(+55.0)#5 | 4.2%(+54.8)#78 |
| 78. | Corinne | 58.8% | 8.1%(+50.8)#6 | 4.2%(+54.6)#79 |
| 79. | Nondalton | 58.8% | 8.4%(+50.4)#4 | 4.2%(+54.6)#80 |
| 80. | Sanders | 58.5% | 4.4%(+54.1)#2 | 4.2%(+54.2)#81 |
| 81. | Riverside | 58.4% | 4.1%(+54.3)#8 | 4.2%(+54.1)#82 |
| 82. | Emet | 58.3% | 6.1%(+52.2)#5 | 4.2%(+54.1)#83 |
| 83. | Golden Acres | 58.2% | 7.5%(+50.6)#6 | 4.2%(+53.9)#84 |
| 84. | University Of California-Santa Barbara | 57.9% | 4.1%(+53.8)#6 | 4.2%(+53.7)#85 |
| 85. | Akhiok | 57.9% | 8.4%(+49.5)#5 | 4.2%(+53.7)#86 |
| 86. | Mcdermitt | 57.6% | 3.3%(+54.3)#2 | 4.2%(+53.4)#87 |
| 87. | Parkman | 57.5% | 3.1%(+54.4)#2 | 4.2%(+53.3)#88 |
| 88. | Duncan | 57.4% | 8.2%(+49.2)#3 | 4.2%(+53.1)#89 |
| 89. | Cascadia | 57.1% | 5.3%(+51.9)#2 | 4.2%(+52.9)#90 |
| 90. | Manley Hot Springs | 57.1% | 8.4%(+48.7)#6 | 4.2%(+52.9)#91 |
| 91. | Caddo Gap | 56.8% | 6.6%(+50.2)#4 | 4.2%(+52.6)#92 |
| 92. | Black Sands | 56.8% | 8.8%(+47.9)#1 | 4.2%(+52.5)#93 |
| 93. | Danville | 56.5% | 5.3%(+51.3)#4 | 4.2%(+52.3)#94 |
| 94. | Benton | 56.4% | 8.2%(+48.3)#4 | 4.2%(+52.2)#95 |
| 95. | Rancho Viejo | 56.4% | 4.1%(+52.3)#9 | 4.2%(+52.1)#96 |
| 96. | Timberlake | 56.2% | 7.5%(+48.7)#7 | 4.2%(+52.0)#97 |
| 97. | Westmoreland | 56.1% | 4.3%(+51.9)#2 | 4.2%(+51.9)#98 |
| 98. | Cape Meares | 55.6% | 5.3%(+50.3)#3 | 4.2%(+51.3)#99 |
| 99. | Mulkeytown | 55.6% | 3.4%(+52.1)#2 | 4.2%(+51.3)#100 |
| 100. | South Gifford | 55.6% | 3.9%(+51.6)#3 | 4.2%(+51.3)#101 |
Common Questions
What are the Top 10 Cities with the Highest Percentage of State Government Employees in the United States?
Top 10 Cities with the Highest Percentage of State Government Employees in the United States are:
#1
100.0%
#2
100.0%
#3
100.0%
#4
100.0%
#5
100.0%
#6
100.0%
#7
100.0%
#8
100.0%
#9
100.0%
#10
100.0%
What city has the Highest Percentage of State Government Employees in the United States?
Chaparrito has the Highest Percentage of State Government Employees in the United States with 100.0%.
What is the Percentage of State Government Employees in the United States?
Percentage of State Government Employees in the United States is 4.2%.