Greer, SC Map & Demographics
Greer Map
Greer Overview
$37,238
PER CAPITA INCOME
$86,944
AVG FAMILY INCOME
$73,534
AVG HOUSEHOLD INCOME
27.7%
WAGE / INCOME GAP [ % ]
72.3¢/ $1
WAGE / INCOME GAP [ $ ]
$11,132
FAMILY INCOME DEFICIT
0.44
INEQUALITY / GINI INDEX
37,010
TOTAL POPULATION
18,340
MALE POPULATION
18,670
FEMALE POPULATION
98.23
MALES / 100 FEMALES
101.80
FEMALES / 100 MALES
34.6
MEDIAN AGE
3.2
AVG FAMILY SIZE
2.6
AVG HOUSEHOLD SIZE
19,226
LABOR FORCE [ PEOPLE ]
68.4%
PERCENT IN LABOR FORCE
3.5%
UNEMPLOYMENT RATE
Greer Area Codes
Income in Greer
Income Overview in Greer
Per Capita Income in Greer is $37,238, while median incomes of families and households are $86,944 and $73,534 respectively.
| Characteristic | Number | Measure |
| Per Capita Income | 37,010 | $37,238 |
| Median Family Income | 9,480 | $86,944 |
| Mean Family Income | 9,480 | $109,323 |
| Median Household Income | 14,177 | $73,534 |
| Mean Household Income | 14,177 | $94,901 |
| Income Deficit | 9,480 | $11,132 |
| Wage / Income Gap (%) | 37,010 | 27.74% |
| Wage / Income Gap ($) | 37,010 | 72.26¢ per $1 |
| Gini / Inequality Index | 37,010 | 0.44 |
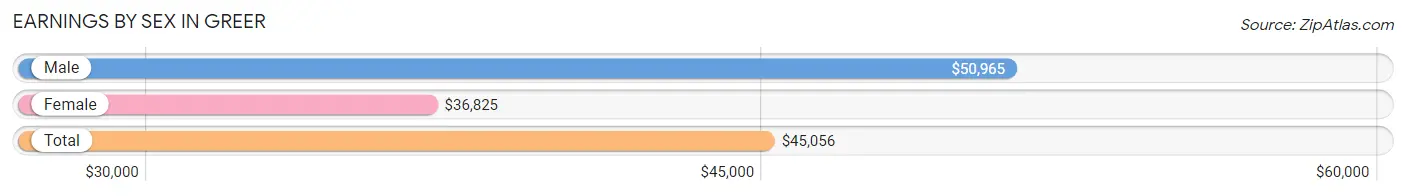
Earnings by Sex in Greer
Average Earnings in Greer are $45,056, $50,965 for men and $36,825 for women, a difference of 27.7%.
| Sex | Number | Average Earnings |
| Male | 10,635 (53.7%) | $50,965 |
| Female | 9,153 (46.3%) | $36,825 |
| Total | 19,788 (100.0%) | $45,056 |
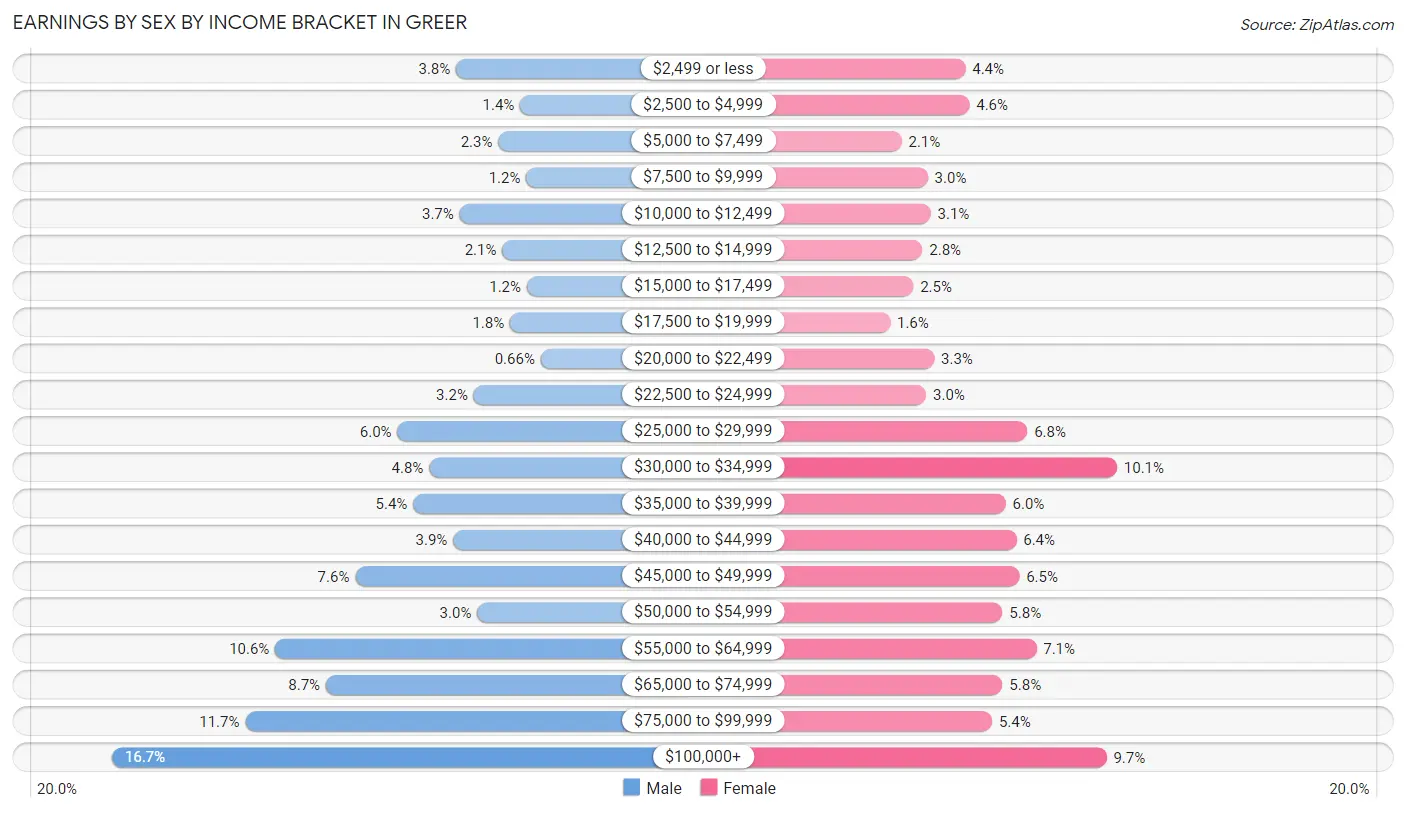
Earnings by Sex by Income Bracket in Greer
The most common earnings brackets in Greer are $100,000+ for men (1,779 | 16.7%) and $30,000 to $34,999 for women (926 | 10.1%).
| Income | Male | Female |
| $2,499 or less | 407 (3.8%) | 406 (4.4%) |
| $2,500 to $4,999 | 152 (1.4%) | 420 (4.6%) |
| $5,000 to $7,499 | 239 (2.2%) | 188 (2.1%) |
| $7,500 to $9,999 | 128 (1.2%) | 277 (3.0%) |
| $10,000 to $12,499 | 393 (3.7%) | 287 (3.1%) |
| $12,500 to $14,999 | 223 (2.1%) | 259 (2.8%) |
| $15,000 to $17,499 | 126 (1.2%) | 228 (2.5%) |
| $17,500 to $19,999 | 193 (1.8%) | 148 (1.6%) |
| $20,000 to $22,499 | 70 (0.7%) | 299 (3.3%) |
| $22,500 to $24,999 | 337 (3.2%) | 272 (3.0%) |
| $25,000 to $29,999 | 641 (6.0%) | 619 (6.8%) |
| $30,000 to $34,999 | 515 (4.8%) | 926 (10.1%) |
| $35,000 to $39,999 | 579 (5.4%) | 545 (5.9%) |
| $40,000 to $44,999 | 419 (3.9%) | 581 (6.4%) |
| $45,000 to $49,999 | 809 (7.6%) | 591 (6.5%) |
| $50,000 to $54,999 | 323 (3.0%) | 534 (5.8%) |
| $55,000 to $64,999 | 1,128 (10.6%) | 650 (7.1%) |
| $65,000 to $74,999 | 926 (8.7%) | 534 (5.8%) |
| $75,000 to $99,999 | 1,248 (11.7%) | 498 (5.4%) |
| $100,000+ | 1,779 (16.7%) | 891 (9.7%) |
| Total | 10,635 (100.0%) | 9,153 (100.0%) |
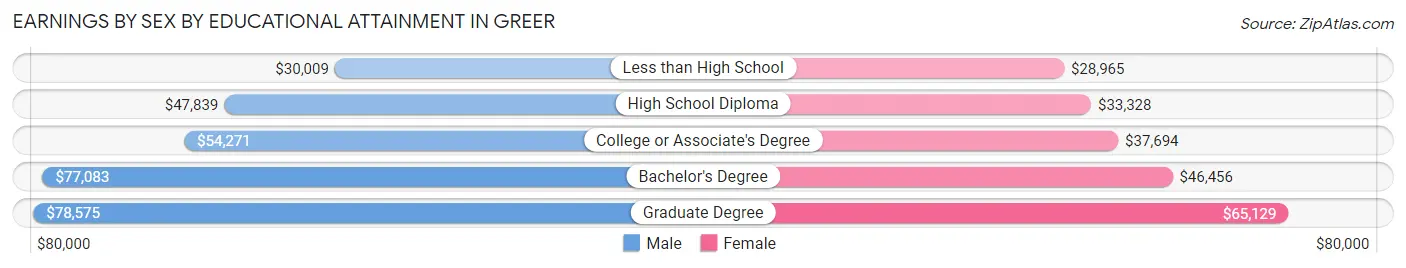
Earnings by Sex by Educational Attainment in Greer
Average earnings in Greer are $58,147 for men and $41,485 for women, a difference of 28.6%. Men with an educational attainment of graduate degree enjoy the highest average annual earnings of $78,575, while those with less than high school education earn the least with $30,009. Women with an educational attainment of graduate degree earn the most with the average annual earnings of $65,129, while those with less than high school education have the smallest earnings of $28,965.
| Educational Attainment | Male Income | Female Income |
| Less than High School | $30,009 | $28,965 |
| High School Diploma | $47,839 | $33,328 |
| College or Associate's Degree | $54,271 | $37,694 |
| Bachelor's Degree | $77,083 | $46,456 |
| Graduate Degree | $78,575 | $65,129 |
| Total | $58,147 | $41,485 |
Family Income in Greer
Family Income Brackets in Greer
According to the Greer family income data, there are 1,915 families falling into the $100,000 to $149,999 income range, which is the most common income bracket and makes up 20.2% of all families. Conversely, the $10,000 to $14,999 income bracket is the least frequent group with only 38 families (0.4%) belonging to this category.
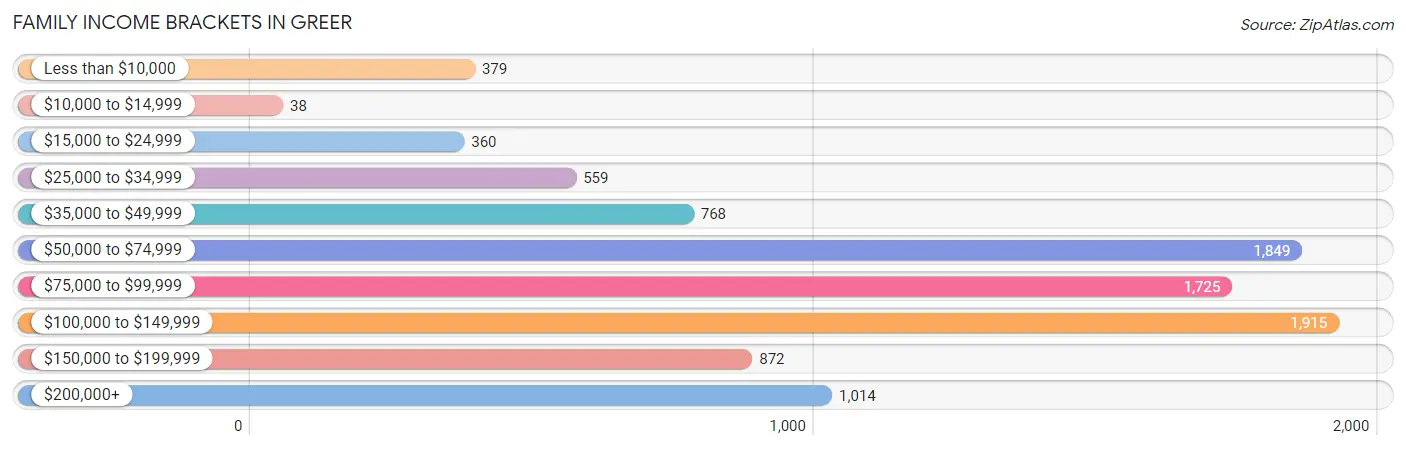
| Income Bracket | # Families | % Families |
| Less than $10,000 | 379 | 4.0% |
| $10,000 to $14,999 | 38 | 0.4% |
| $15,000 to $24,999 | 360 | 3.8% |
| $25,000 to $34,999 | 559 | 5.9% |
| $35,000 to $49,999 | 768 | 8.1% |
| $50,000 to $74,999 | 1,849 | 19.5% |
| $75,000 to $99,999 | 1,725 | 18.2% |
| $100,000 to $149,999 | 1,915 | 20.2% |
| $150,000 to $199,999 | 872 | 9.2% |
| $200,000+ | 1,014 | 10.7% |
Family Income by Famaliy Size in Greer
6-person families (221 | 2.3%) account for the highest median family income in Greer with $124,779 per family, while 2-person families (3,778 | 39.9%) have the highest median income of $38,538 per family member.
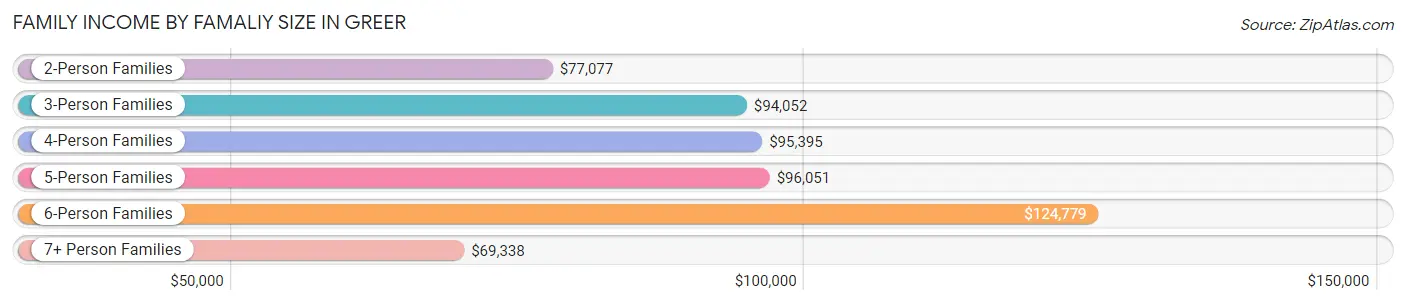
| Income Bracket | # Families | Median Income |
| 2-Person Families | 3,778 (39.9%) | $77,077 |
| 3-Person Families | 2,437 (25.7%) | $94,052 |
| 4-Person Families | 1,884 (19.9%) | $95,395 |
| 5-Person Families | 1,065 (11.2%) | $96,051 |
| 6-Person Families | 221 (2.3%) | $124,779 |
| 7+ Person Families | 95 (1.0%) | $69,338 |
| Total | 9,480 (100.0%) | $86,944 |
Family Income by Number of Earners in Greer
The median family income in Greer is $86,944, with families comprising 3+ earners (1,013) having the highest median family income of $124,213, while families with no earners (843) have the lowest median family income of $39,201, accounting for 10.7% and 8.9% of families, respectively.
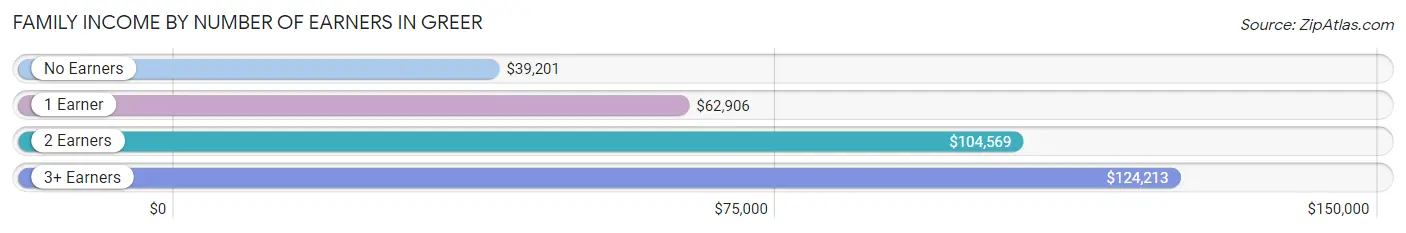
| Number of Earners | # Families | Median Income |
| No Earners | 843 (8.9%) | $39,201 |
| 1 Earner | 3,461 (36.5%) | $62,906 |
| 2 Earners | 4,163 (43.9%) | $104,569 |
| 3+ Earners | 1,013 (10.7%) | $124,213 |
| Total | 9,480 (100.0%) | $86,944 |
Household Income in Greer
Household Income Brackets in Greer
With 3,020 households falling in the category, the $50,000 to $74,999 income range is the most frequent in Greer, accounting for 21.3% of all households. In contrast, only 397 households (2.8%) fall into the $10,000 to $14,999 income bracket, making it the least populous group.
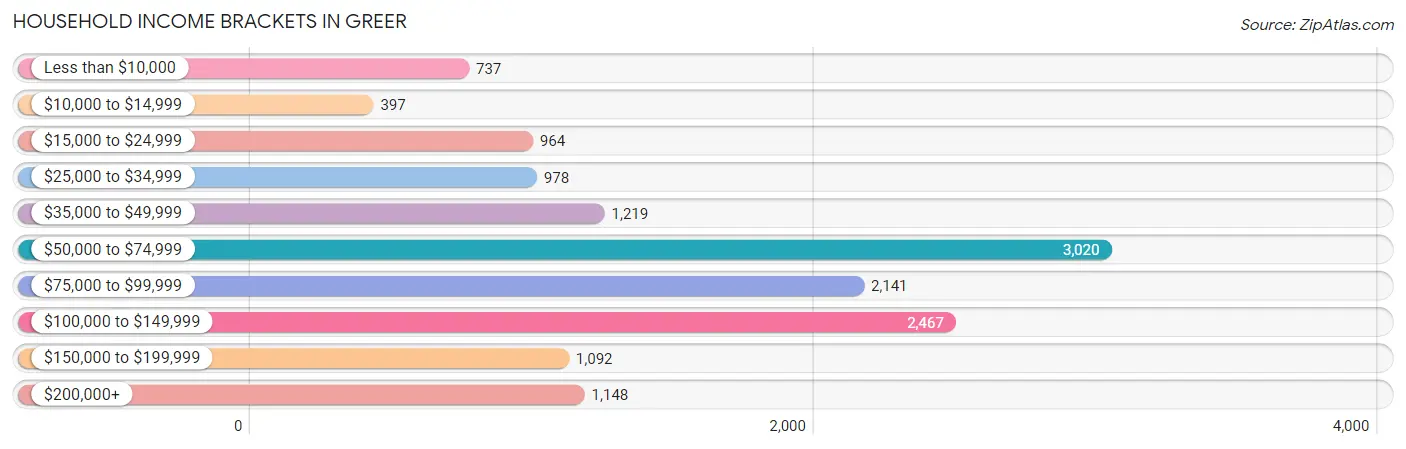
| Income Bracket | # Households | % Households |
| Less than $10,000 | 737 | 5.2% |
| $10,000 to $14,999 | 397 | 2.8% |
| $15,000 to $24,999 | 964 | 6.8% |
| $25,000 to $34,999 | 978 | 6.9% |
| $35,000 to $49,999 | 1,219 | 8.6% |
| $50,000 to $74,999 | 3,020 | 21.3% |
| $75,000 to $99,999 | 2,141 | 15.1% |
| $100,000 to $149,999 | 2,467 | 17.4% |
| $150,000 to $199,999 | 1,092 | 7.7% |
| $200,000+ | 1,148 | 8.1% |
Household Income by Householder Age in Greer
The median household income in Greer is $73,534, with the highest median household income of $83,823 found in the 45 to 64 years age bracket for the primary householder. A total of 5,079 households (35.8%) fall into this category. Meanwhile, the 15 to 24 years age bracket for the primary householder has the lowest median household income of $0, with 462 households (3.3%) in this group.
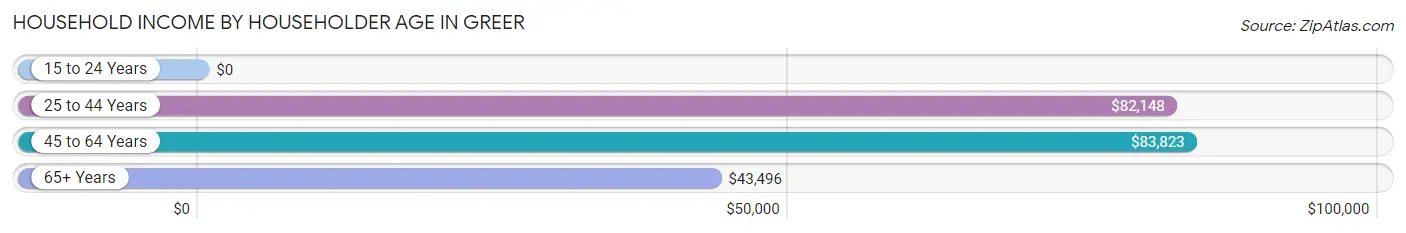
| Income Bracket | # Households | Median Income |
| 15 to 24 Years | 462 (3.3%) | $0 |
| 25 to 44 Years | 5,721 (40.4%) | $82,148 |
| 45 to 64 Years | 5,079 (35.8%) | $83,823 |
| 65+ Years | 2,915 (20.6%) | $43,496 |
| Total | 14,177 (100.0%) | $73,534 |
Poverty in Greer
Income Below Poverty by Sex and Age in Greer
With 8.3% poverty level for males and 12.9% for females among the residents of Greer, 15 year old males and 5 year old females are the most vulnerable to poverty, with 65 males (27.9%) and 198 females (73.3%) in their respective age groups living below the poverty level.
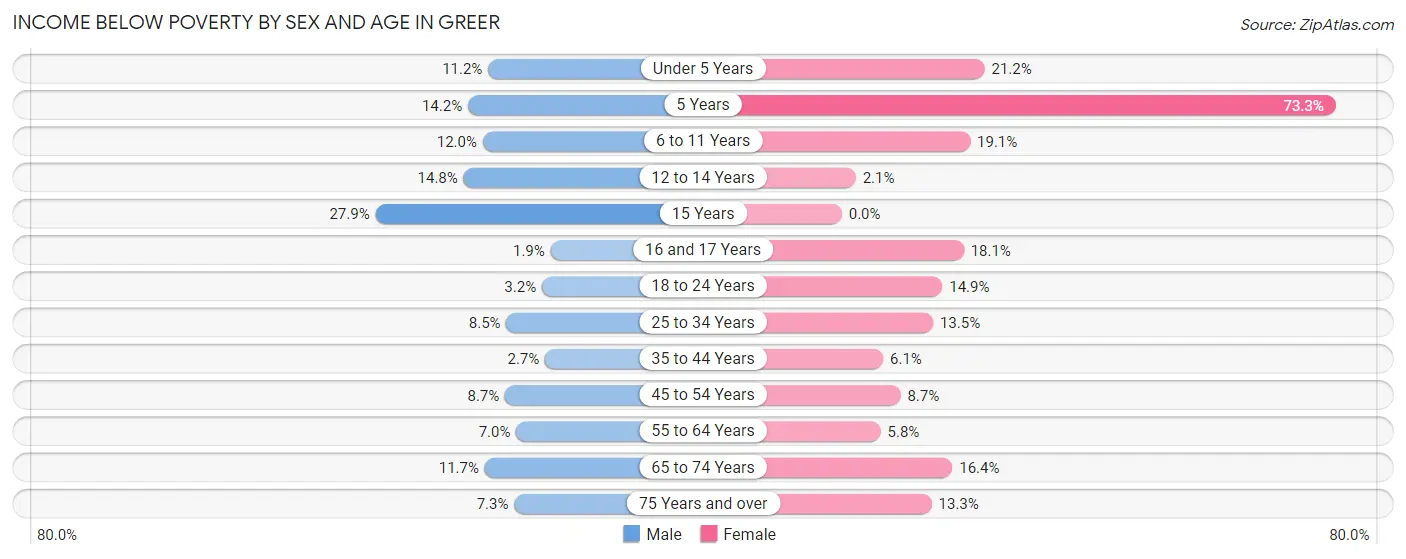
| Age Bracket | Male | Female |
| Under 5 Years | 154 (11.2%) | 265 (21.2%) |
| 5 Years | 33 (14.2%) | 198 (73.3%) |
| 6 to 11 Years | 211 (12.0%) | 351 (19.1%) |
| 12 to 14 Years | 146 (14.8%) | 15 (2.1%) |
| 15 Years | 65 (27.9%) | 0 (0.0%) |
| 16 and 17 Years | 13 (1.9%) | 76 (18.1%) |
| 18 to 24 Years | 47 (3.2%) | 143 (14.9%) |
| 25 to 34 Years | 263 (8.5%) | 435 (13.5%) |
| 35 to 44 Years | 70 (2.7%) | 153 (6.1%) |
| 45 to 54 Years | 203 (8.6%) | 236 (8.7%) |
| 55 to 64 Years | 111 (7.0%) | 99 (5.8%) |
| 65 to 74 Years | 151 (11.7%) | 275 (16.4%) |
| 75 Years and over | 37 (7.3%) | 141 (13.3%) |
| Total | 1,504 (8.3%) | 2,387 (12.9%) |
Income Above Poverty by Sex and Age in Greer
According to the poverty statistics in Greer, males aged 16 and 17 years and females aged 15 years are the age groups that are most secure financially, with 98.1% of males and 100.0% of females in these age groups living above the poverty line.
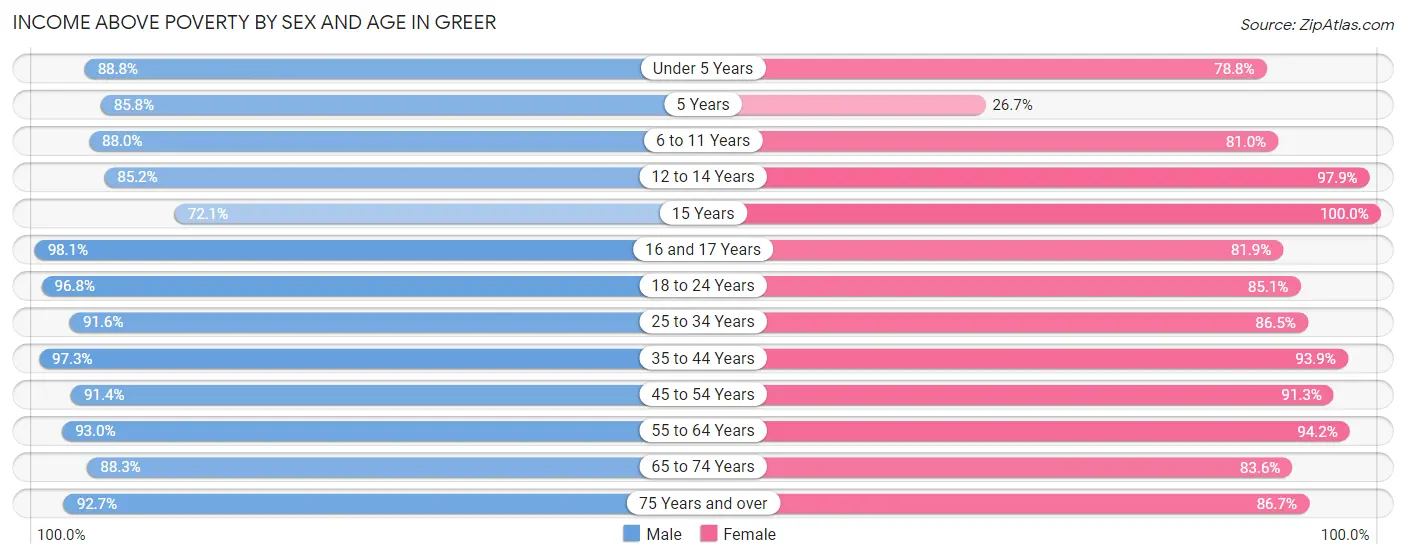
| Age Bracket | Male | Female |
| Under 5 Years | 1,226 (88.8%) | 985 (78.8%) |
| 5 Years | 200 (85.8%) | 72 (26.7%) |
| 6 to 11 Years | 1,553 (88.0%) | 1,492 (80.9%) |
| 12 to 14 Years | 840 (85.2%) | 709 (97.9%) |
| 15 Years | 168 (72.1%) | 207 (100.0%) |
| 16 and 17 Years | 676 (98.1%) | 344 (81.9%) |
| 18 to 24 Years | 1,434 (96.8%) | 815 (85.1%) |
| 25 to 34 Years | 2,851 (91.5%) | 2,778 (86.5%) |
| 35 to 44 Years | 2,516 (97.3%) | 2,342 (93.9%) |
| 45 to 54 Years | 2,145 (91.3%) | 2,472 (91.3%) |
| 55 to 64 Years | 1,477 (93.0%) | 1,619 (94.2%) |
| 65 to 74 Years | 1,144 (88.3%) | 1,401 (83.6%) |
| 75 Years and over | 471 (92.7%) | 916 (86.7%) |
| Total | 16,701 (91.7%) | 16,152 (87.1%) |
Income Below Poverty Among Married-Couple Families in Greer
The poverty statistics for married-couple families in Greer show that 3.7% or 248 of the total 6,737 families live below the poverty line. Families with 3 or 4 children have the highest poverty rate of 5.7%, comprising of 42 families. On the other hand, families with no children have the lowest poverty rate of 2.3%, which includes 67 families.
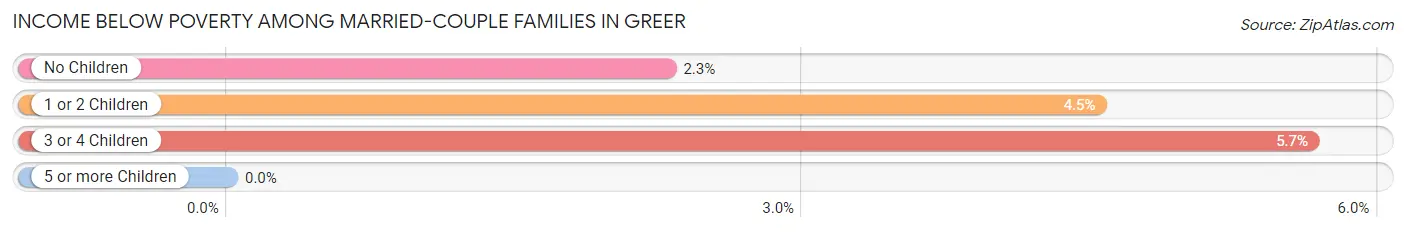
| Children | Above Poverty | Below Poverty |
| No Children | 2,863 (97.7%) | 67 (2.3%) |
| 1 or 2 Children | 2,924 (95.5%) | 139 (4.5%) |
| 3 or 4 Children | 702 (94.4%) | 42 (5.7%) |
| 5 or more Children | 0 (0.0%) | 0 (0.0%) |
| Total | 6,489 (96.3%) | 248 (3.7%) |
Income Below Poverty Among Single-Parent Households in Greer
According to the poverty data in Greer, 8.8% or 68 single-father households and 21.2% or 419 single-mother households are living below the poverty line. Among single-father households, those with 3 or 4 children have the highest poverty rate, with 35 households (49.3%) experiencing poverty. Likewise, among single-mother households, those with 3 or 4 children have the highest poverty rate, with 103 households (83.1%) falling below the poverty line.
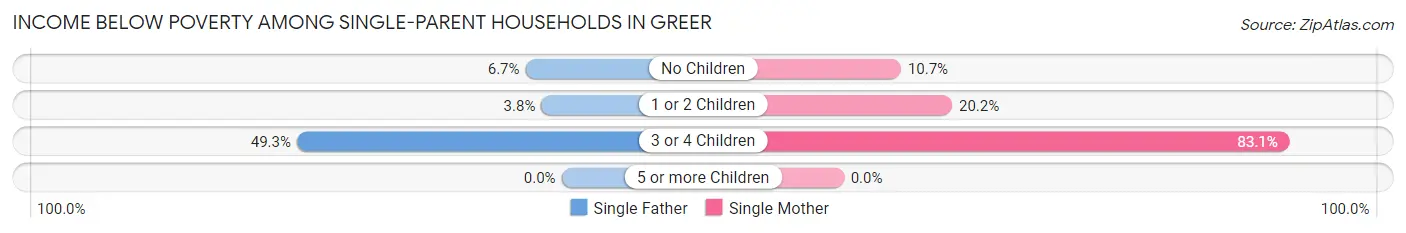
| Children | Single Father | Single Mother |
| No Children | 15 (6.7%) | 64 (10.7%) |
| 1 or 2 Children | 18 (3.8%) | 252 (20.2%) |
| 3 or 4 Children | 35 (49.3%) | 103 (83.1%) |
| 5 or more Children | 0 (0.0%) | 0 (0.0%) |
| Total | 68 (8.8%) | 419 (21.2%) |
Income Below Poverty Among Married-Couple vs Single-Parent Households in Greer
The poverty data for Greer shows that 248 of the married-couple family households (3.7%) and 487 of the single-parent households (17.7%) are living below the poverty level. Within the married-couple family households, those with 3 or 4 children have the highest poverty rate, with 42 households (5.7%) falling below the poverty line. Among the single-parent households, those with 3 or 4 children have the highest poverty rate, with 138 household (70.8%) living below poverty.
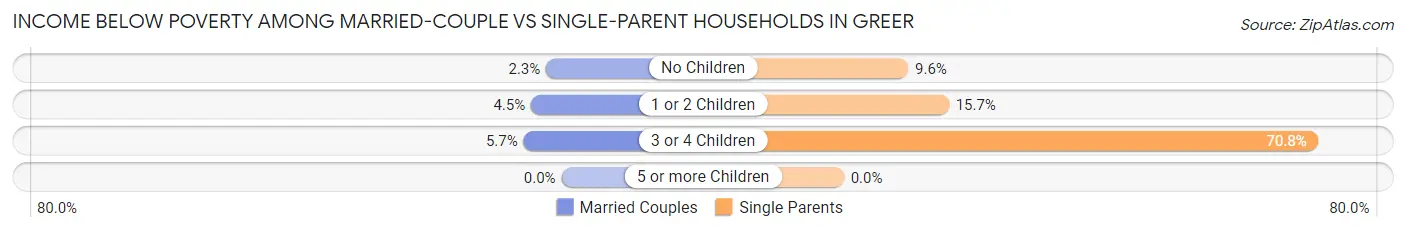
| Children | Married-Couple Families | Single-Parent Households |
| No Children | 67 (2.3%) | 79 (9.6%) |
| 1 or 2 Children | 139 (4.5%) | 270 (15.7%) |
| 3 or 4 Children | 42 (5.7%) | 138 (70.8%) |
| 5 or more Children | 0 (0.0%) | 0 (0.0%) |
| Total | 248 (3.7%) | 487 (17.7%) |
Race in Greer
The most populous races in Greer are White / Caucasian (23,888 | 64.5%), Black / African American (6,191 | 16.7%), and Hispanic or Latino (5,830 | 15.8%).
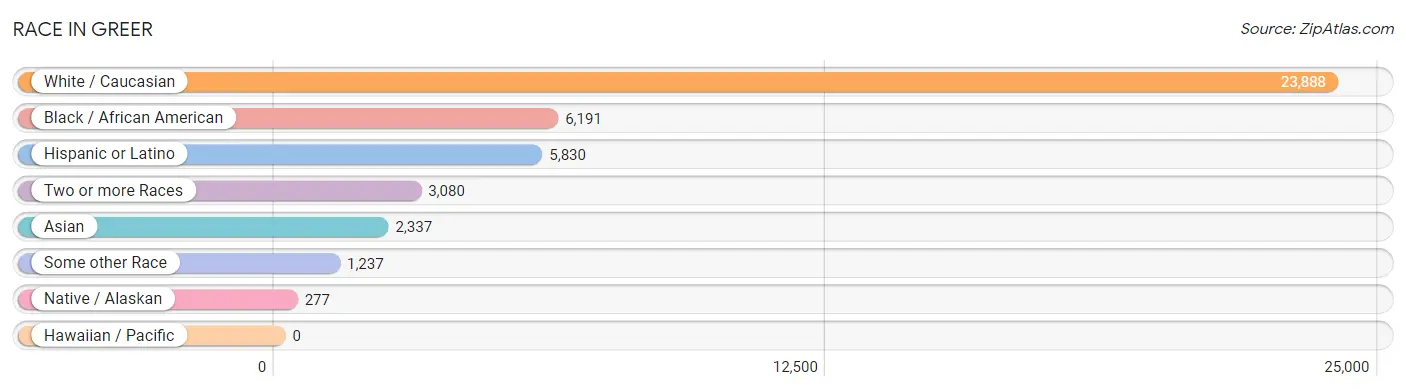
| Race | # Population | % Population |
| Asian | 2,337 | 6.3% |
| Black / African American | 6,191 | 16.7% |
| Hawaiian / Pacific | 0 | 0.0% |
| Hispanic or Latino | 5,830 | 15.8% |
| Native / Alaskan | 277 | 0.7% |
| White / Caucasian | 23,888 | 64.5% |
| Two or more Races | 3,080 | 8.3% |
| Some other Race | 1,237 | 3.3% |
| Total | 37,010 | 100.0% |
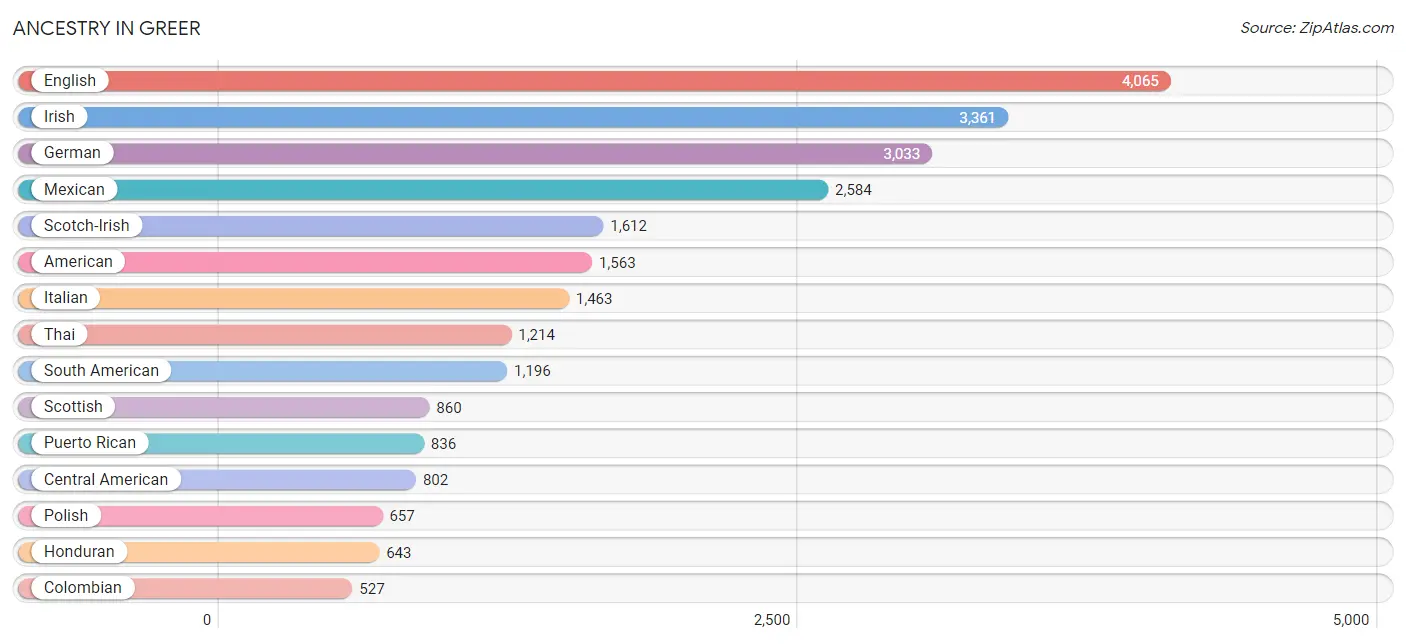
Ancestry in Greer
The most populous ancestries reported in Greer are English (4,065 | 11.0%), Irish (3,361 | 9.1%), German (3,033 | 8.2%), Mexican (2,584 | 7.0%), and Scotch-Irish (1,612 | 4.4%), together accounting for 39.6% of all Greer residents.
| Ancestry | # Population | % Population |
| African | 119 | 0.3% |
| American | 1,563 | 4.2% |
| Arab | 264 | 0.7% |
| Argentinean | 57 | 0.2% |
| Austrian | 16 | 0.0% |
| Barbadian | 13 | 0.0% |
| Basque | 88 | 0.2% |
| Belgian | 18 | 0.1% |
| Bhutanese | 89 | 0.2% |
| Brazilian | 55 | 0.2% |
| British | 244 | 0.7% |
| British West Indian | 37 | 0.1% |
| Burmese | 143 | 0.4% |
| Canadian | 87 | 0.2% |
| Celtic | 56 | 0.2% |
| Central American | 802 | 2.2% |
| Central American Indian | 51 | 0.1% |
| Cherokee | 112 | 0.3% |
| Colombian | 527 | 1.4% |
| Costa Rican | 27 | 0.1% |
| Croatian | 103 | 0.3% |
| Cuban | 224 | 0.6% |
| Czech | 79 | 0.2% |
| Danish | 52 | 0.1% |
| Dominican | 43 | 0.1% |
| Dutch | 152 | 0.4% |
| Eastern European | 98 | 0.3% |
| Egyptian | 15 | 0.0% |
| English | 4,065 | 11.0% |
| Ethiopian | 21 | 0.1% |
| European | 286 | 0.8% |
| Finnish | 139 | 0.4% |
| French | 316 | 0.9% |
| French Canadian | 114 | 0.3% |
| German | 3,033 | 8.2% |
| Greek | 123 | 0.3% |
| Guamanian / Chamorro | 11 | 0.0% |
| Guatemalan | 49 | 0.1% |
| Haitian | 47 | 0.1% |
| Honduran | 643 | 1.7% |
| Hungarian | 52 | 0.1% |
| Indian (Asian) | 142 | 0.4% |
| Indonesian | 7 | 0.0% |
| Irish | 3,361 | 9.1% |
| Italian | 1,463 | 4.0% |
| Korean | 226 | 0.6% |
| Lebanese | 93 | 0.3% |
| Mexican | 2,584 | 7.0% |
| Mexican American Indian | 240 | 0.6% |
| Moroccan | 41 | 0.1% |
| Northern European | 94 | 0.3% |
| Norwegian | 279 | 0.7% |
| Pakistani | 113 | 0.3% |
| Pennsylvania German | 19 | 0.1% |
| Peruvian | 94 | 0.3% |
| Polish | 657 | 1.8% |
| Portuguese | 12 | 0.0% |
| Puerto Rican | 836 | 2.3% |
| Russian | 113 | 0.3% |
| Salvadoran | 83 | 0.2% |
| Scandinavian | 152 | 0.4% |
| Scotch-Irish | 1,612 | 4.4% |
| Scottish | 860 | 2.3% |
| Senegalese | 42 | 0.1% |
| Shoshone | 8 | 0.0% |
| Slavic | 22 | 0.1% |
| Slovak | 59 | 0.2% |
| Slovene | 15 | 0.0% |
| South American | 1,196 | 3.2% |
| Spaniard | 33 | 0.1% |
| Spanish | 20 | 0.1% |
| Sri Lankan | 295 | 0.8% |
| Subsaharan African | 182 | 0.5% |
| Swedish | 128 | 0.4% |
| Swiss | 191 | 0.5% |
| Syrian | 87 | 0.2% |
| Thai | 1,214 | 3.3% |
| Trinidadian and Tobagonian | 74 | 0.2% |
| Turkish | 48 | 0.1% |
| Uruguayan | 123 | 0.3% |
| Venezuelan | 395 | 1.1% |
| Welsh | 51 | 0.1% | View All 82 Rows |
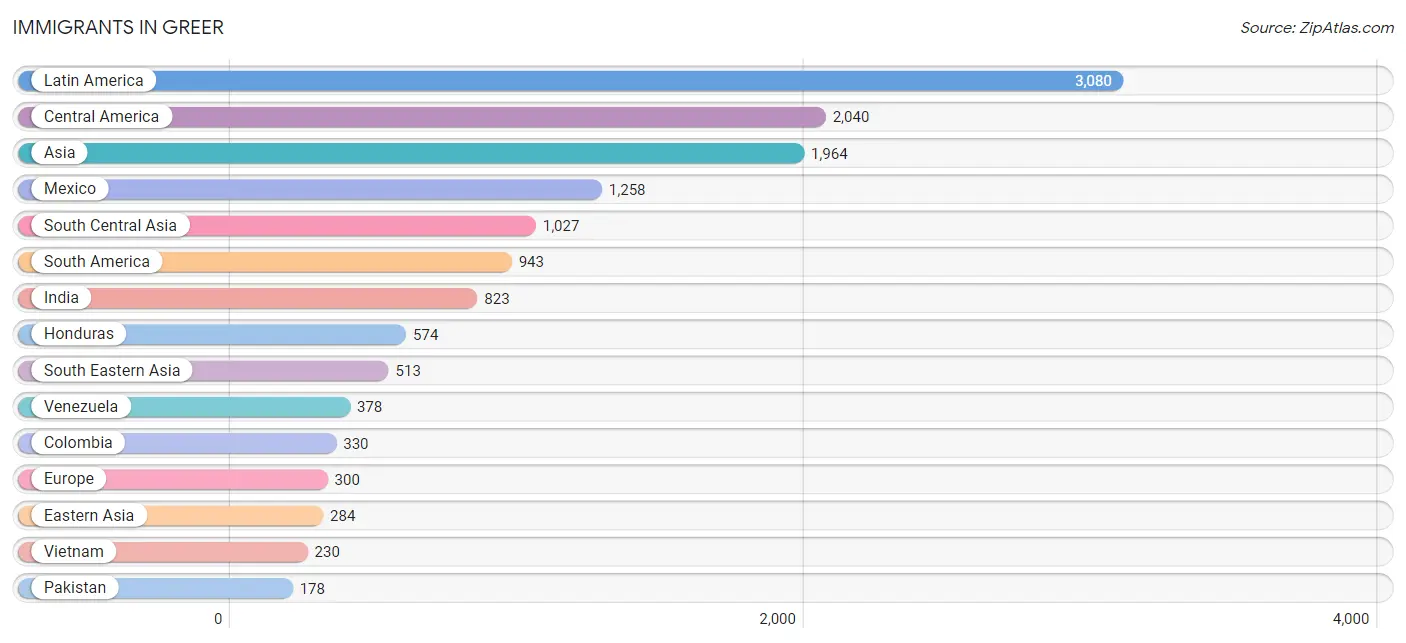
Immigrants in Greer
The most numerous immigrant groups reported in Greer came from Latin America (3,080 | 8.3%), Central America (2,040 | 5.5%), Asia (1,964 | 5.3%), Mexico (1,258 | 3.4%), and South Central Asia (1,027 | 2.8%), together accounting for 25.3% of all Greer residents.
| Immigration Origin | # Population | % Population |
| Africa | 115 | 0.3% |
| Argentina | 124 | 0.3% |
| Asia | 1,964 | 5.3% |
| Brazil | 42 | 0.1% |
| Bulgaria | 14 | 0.0% |
| Canada | 134 | 0.4% |
| Caribbean | 97 | 0.3% |
| Central America | 2,040 | 5.5% |
| China | 72 | 0.2% |
| Colombia | 330 | 0.9% |
| Costa Rica | 27 | 0.1% |
| Cuba | 60 | 0.2% |
| Eastern Africa | 74 | 0.2% |
| Eastern Asia | 284 | 0.8% |
| Eastern Europe | 14 | 0.0% |
| El Salvador | 147 | 0.4% |
| England | 33 | 0.1% |
| Ethiopia | 21 | 0.1% |
| Europe | 300 | 0.8% |
| Fiji | 23 | 0.1% |
| Germany | 86 | 0.2% |
| Greece | 11 | 0.0% |
| Grenada | 37 | 0.1% |
| Guatemala | 17 | 0.1% |
| Honduras | 574 | 1.5% |
| India | 823 | 2.2% |
| Israel | 22 | 0.1% |
| Japan | 71 | 0.2% |
| Kenya | 25 | 0.1% |
| Korea | 141 | 0.4% |
| Latin America | 3,080 | 8.3% |
| Lebanon | 23 | 0.1% |
| Mexico | 1,258 | 3.4% |
| Micronesia | 17 | 0.1% |
| Nepal | 26 | 0.1% |
| Netherlands | 25 | 0.1% |
| Northern Africa | 16 | 0.0% |
| Northern Europe | 137 | 0.4% |
| Oceania | 40 | 0.1% |
| Pakistan | 178 | 0.5% |
| Panama | 17 | 0.1% |
| Peru | 69 | 0.2% |
| Philippines | 111 | 0.3% |
| Scotland | 16 | 0.0% |
| Senegal | 25 | 0.1% |
| South America | 943 | 2.5% |
| South Central Asia | 1,027 | 2.8% |
| South Eastern Asia | 513 | 1.4% |
| Southern Europe | 38 | 0.1% |
| Spain | 27 | 0.1% |
| Syria | 74 | 0.2% |
| Thailand | 82 | 0.2% |
| Turkey | 21 | 0.1% |
| Venezuela | 378 | 1.0% |
| Vietnam | 230 | 0.6% |
| Western Africa | 25 | 0.1% |
| Western Asia | 140 | 0.4% |
| Western Europe | 111 | 0.3% | View All 58 Rows |
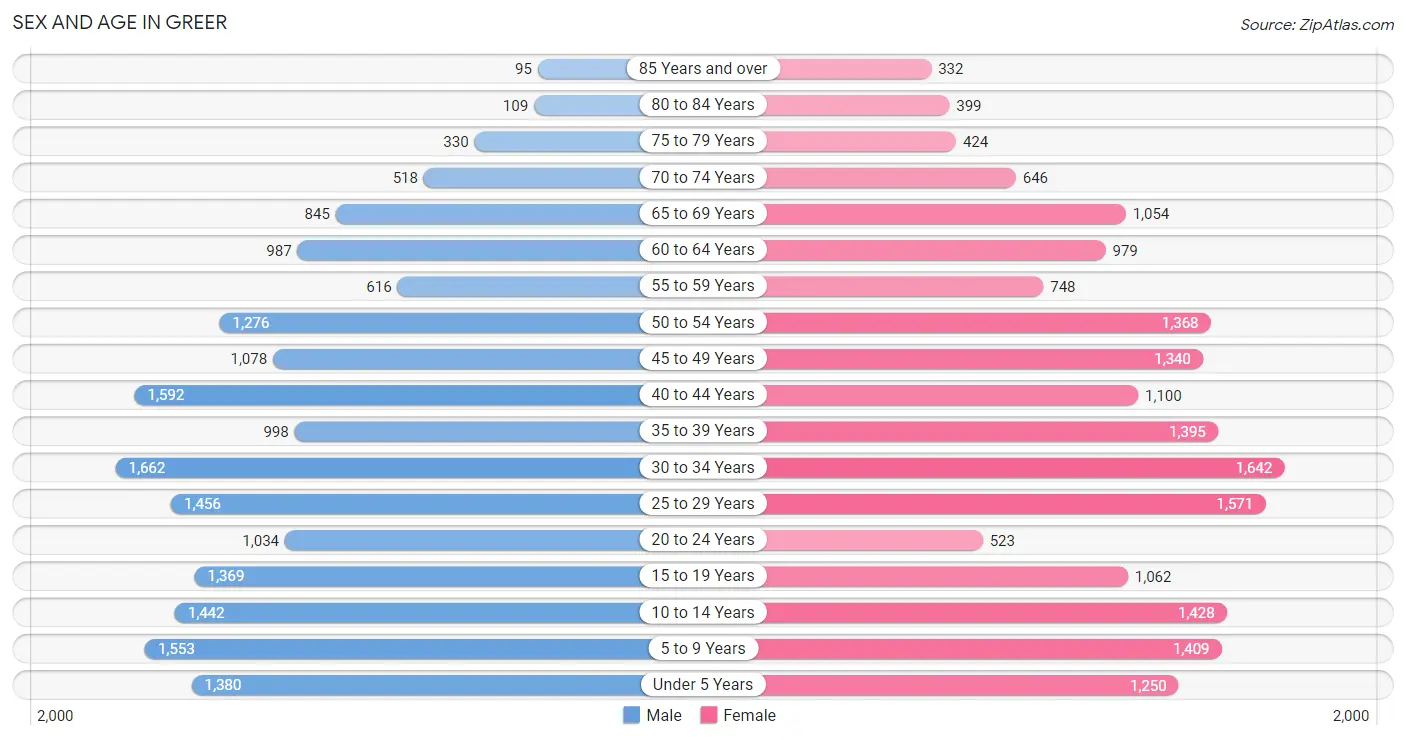
Sex and Age in Greer
Sex and Age in Greer
The most populous age groups in Greer are 30 to 34 Years (1,662 | 9.1%) for men and 30 to 34 Years (1,642 | 8.8%) for women.
| Age Bracket | Male | Female |
| Under 5 Years | 1,380 (7.5%) | 1,250 (6.7%) |
| 5 to 9 Years | 1,553 (8.5%) | 1,409 (7.5%) |
| 10 to 14 Years | 1,442 (7.9%) | 1,428 (7.6%) |
| 15 to 19 Years | 1,369 (7.5%) | 1,062 (5.7%) |
| 20 to 24 Years | 1,034 (5.6%) | 523 (2.8%) |
| 25 to 29 Years | 1,456 (7.9%) | 1,571 (8.4%) |
| 30 to 34 Years | 1,662 (9.1%) | 1,642 (8.8%) |
| 35 to 39 Years | 998 (5.4%) | 1,395 (7.5%) |
| 40 to 44 Years | 1,592 (8.7%) | 1,100 (5.9%) |
| 45 to 49 Years | 1,078 (5.9%) | 1,340 (7.2%) |
| 50 to 54 Years | 1,276 (7.0%) | 1,368 (7.3%) |
| 55 to 59 Years | 616 (3.4%) | 748 (4.0%) |
| 60 to 64 Years | 987 (5.4%) | 979 (5.2%) |
| 65 to 69 Years | 845 (4.6%) | 1,054 (5.7%) |
| 70 to 74 Years | 518 (2.8%) | 646 (3.5%) |
| 75 to 79 Years | 330 (1.8%) | 424 (2.3%) |
| 80 to 84 Years | 109 (0.6%) | 399 (2.1%) |
| 85 Years and over | 95 (0.5%) | 332 (1.8%) |
| Total | 18,340 (100.0%) | 18,670 (100.0%) |
Families and Households in Greer
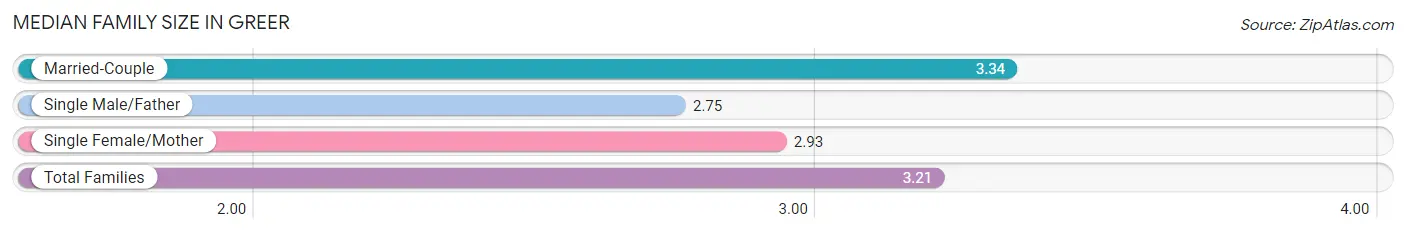
Median Family Size in Greer
The median family size in Greer is 3.21 persons per family, with married-couple families (6,737 | 71.1%) accounting for the largest median family size of 3.34 persons per family. On the other hand, single male/father families (771 | 8.1%) represent the smallest median family size with 2.75 persons per family.
| Family Type | # Families | Family Size |
| Married-Couple | 6,737 (71.1%) | 3.34 |
| Single Male/Father | 771 (8.1%) | 2.75 |
| Single Female/Mother | 1,972 (20.8%) | 2.93 |
| Total Families | 9,480 (100.0%) | 3.21 |
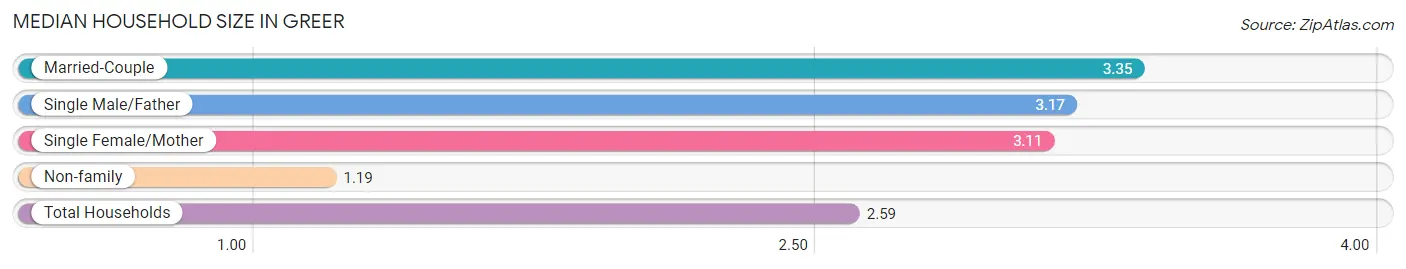
Median Household Size in Greer
The median household size in Greer is 2.59 persons per household, with married-couple households (6,737 | 47.5%) accounting for the largest median household size of 3.35 persons per household. non-family households (4,697 | 33.1%) represent the smallest median household size with 1.19 persons per household.
| Household Type | # Households | Household Size |
| Married-Couple | 6,737 (47.5%) | 3.35 |
| Single Male/Father | 771 (5.4%) | 3.17 |
| Single Female/Mother | 1,972 (13.9%) | 3.11 |
| Non-family | 4,697 (33.1%) | 1.19 |
| Total Households | 14,177 (100.0%) | 2.59 |
Household Size by Marriage Status in Greer
Out of a total of 14,177 households in Greer, 9,480 (66.9%) are family households, while 4,697 (33.1%) are nonfamily households. The most numerous type of family households are 2-person households, comprising 3,497, and the most common type of nonfamily households are 1-person households, comprising 4,035.
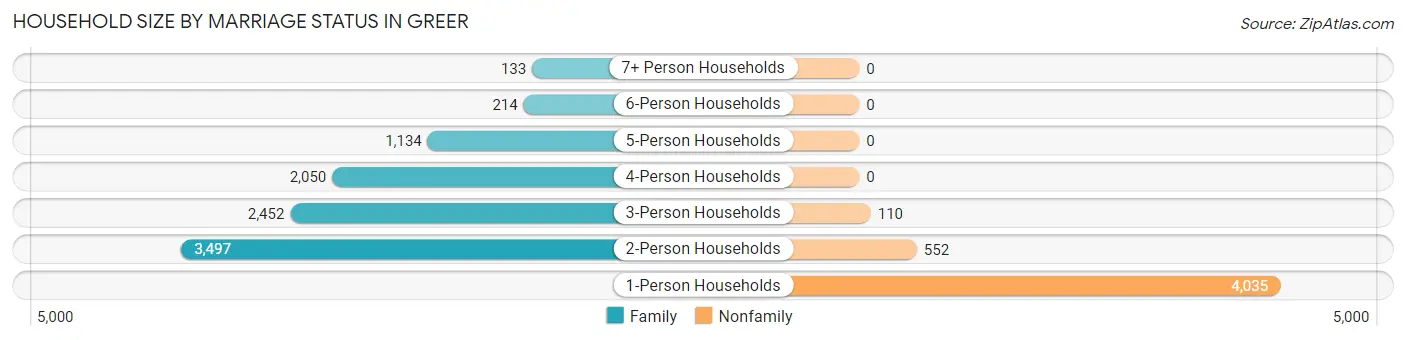
| Household Size | Family Households | Nonfamily Households |
| 1-Person Households | - | 4,035 (28.5%) |
| 2-Person Households | 3,497 (24.7%) | 552 (3.9%) |
| 3-Person Households | 2,452 (17.3%) | 110 (0.8%) |
| 4-Person Households | 2,050 (14.5%) | 0 (0.0%) |
| 5-Person Households | 1,134 (8.0%) | 0 (0.0%) |
| 6-Person Households | 214 (1.5%) | 0 (0.0%) |
| 7+ Person Households | 133 (0.9%) | 0 (0.0%) |
| Total | 9,480 (66.9%) | 4,697 (33.1%) |
Female Fertility in Greer
Fertility by Age in Greer
Average fertility rate in Greer is 62.0 births per 1,000 women. Women in the age bracket of 20 to 34 years have the highest fertility rate with 92.0 births per 1,000 women. Women in the age bracket of 20 to 34 years acount for 62.5% of all women with births.
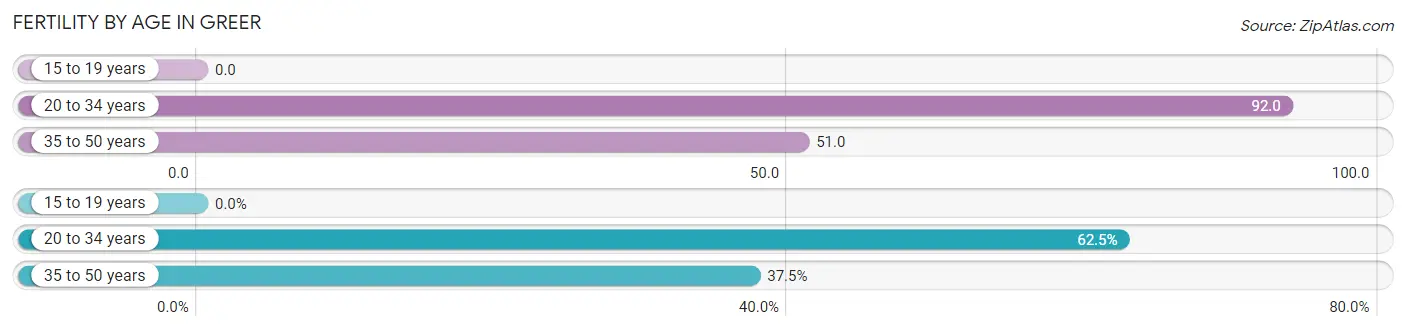
| Age Bracket | Women with Births | Births / 1,000 Women |
| 15 to 19 years | 0 (0.0%) | 0.0 |
| 20 to 34 years | 342 (62.5%) | 92.0 |
| 35 to 50 years | 205 (37.5%) | 51.0 |
| Total | 547 (100.0%) | 62.0 |
Fertility by Age by Marriage Status in Greer
72.8% of women with births (547) in Greer are married. The highest percentage of unmarried women with births falls into 20 to 34 years age bracket with 33.0% of them unmarried at the time of birth, while the lowest percentage of unmarried women with births belong to 35 to 50 years age bracket with 17.6% of them unmarried.
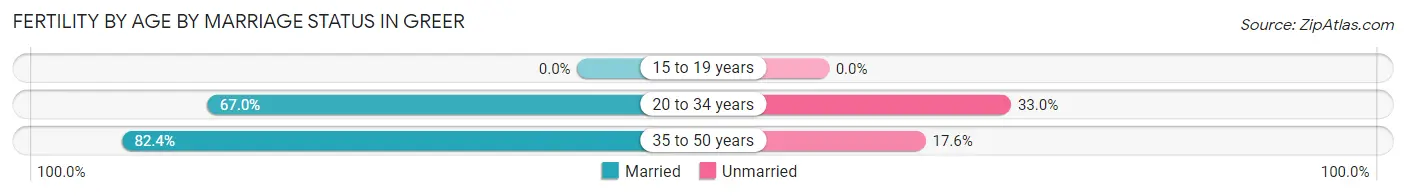
| Age Bracket | Married | Unmarried |
| 15 to 19 years | 0 (0.0%) | 0 (0.0%) |
| 20 to 34 years | 229 (67.0%) | 113 (33.0%) |
| 35 to 50 years | 169 (82.4%) | 36 (17.6%) |
| Total | 398 (72.8%) | 149 (27.2%) |
Fertility by Education in Greer
Average fertility rate in Greer is 62.0 births per 1,000 women. Women with the education attainment of graduate degree have the highest fertility rate of 89.0 births per 1,000 women, while women with the education attainment of less than high school have the lowest fertility at 34.0 births per 1,000 women. Women with the education attainment of high school diploma represent 25.4% of all women with births.
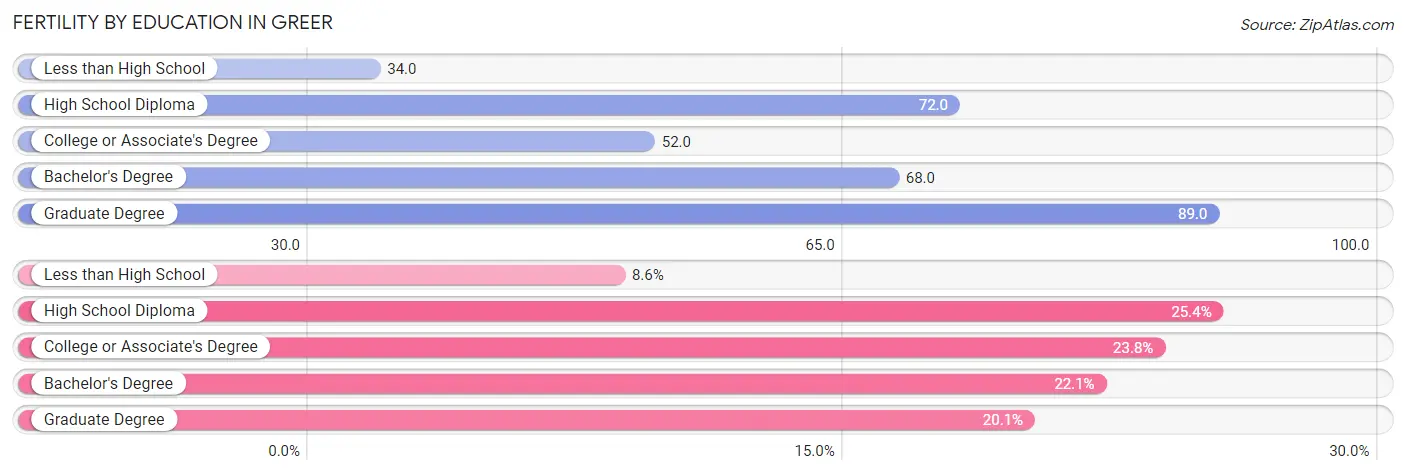
| Educational Attainment | Women with Births | Births / 1,000 Women |
| Less than High School | 47 (8.6%) | 34.0 |
| High School Diploma | 139 (25.4%) | 72.0 |
| College or Associate's Degree | 130 (23.8%) | 52.0 |
| Bachelor's Degree | 121 (22.1%) | 68.0 |
| Graduate Degree | 110 (20.1%) | 89.0 |
| Total | 547 (100.0%) | 62.0 |
Fertility by Education by Marriage Status in Greer
27.2% of women with births in Greer are unmarried. Women with the educational attainment of bachelor's degree are most likely to be married with 94.2% of them married at childbirth, while women with the educational attainment of less than high school are least likely to be married with 80.8% of them unmarried at childbirth.
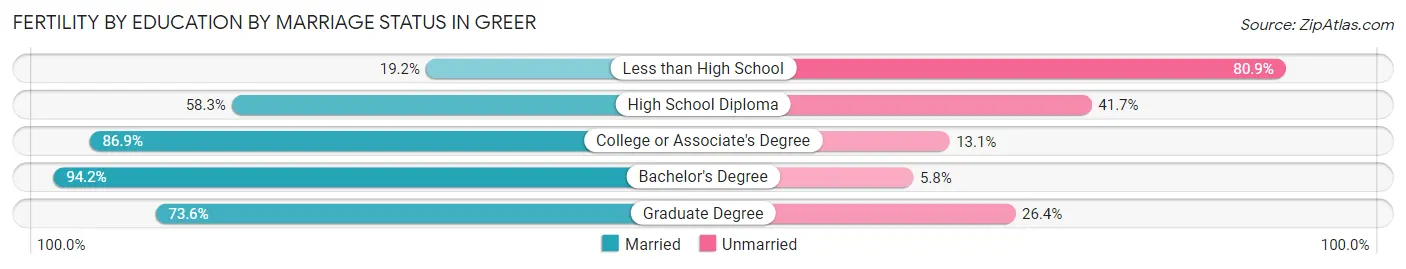
| Educational Attainment | Married | Unmarried |
| Less than High School | 9 (19.2%) | 38 (80.8%) |
| High School Diploma | 81 (58.3%) | 58 (41.7%) |
| College or Associate's Degree | 113 (86.9%) | 17 (13.1%) |
| Bachelor's Degree | 114 (94.2%) | 7 (5.8%) |
| Graduate Degree | 81 (73.6%) | 29 (26.4%) |
| Total | 398 (72.8%) | 149 (27.2%) |
Employment Characteristics in Greer
Employment by Class of Employer in Greer
Among the 18,311 employed individuals in Greer, private company employees (13,276 | 72.5%), not-for-profit organizations (1,383 | 7.5%), and self-employed (not incorporated) (1,029 | 5.6%) make up the most common classes of employment.
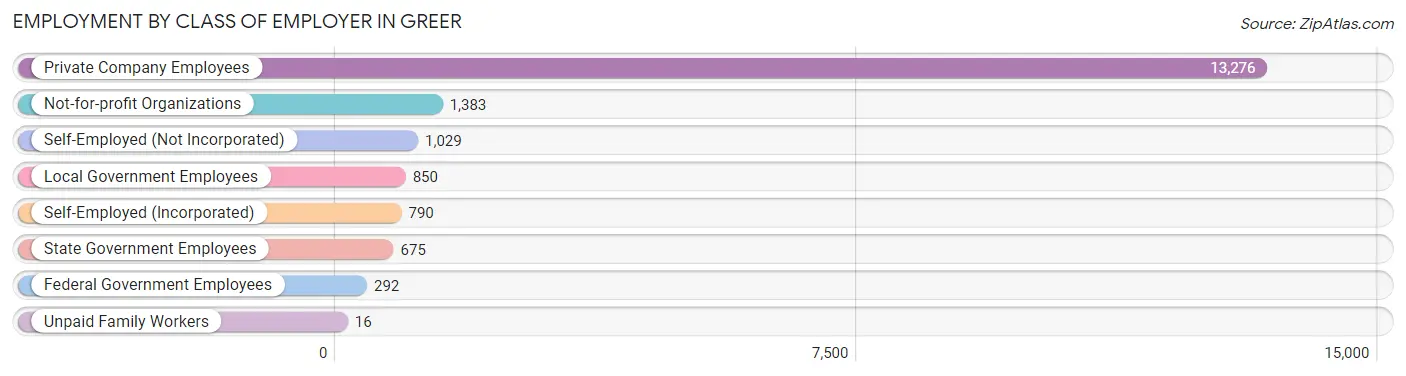
| Employer Class | # Employees | % Employees |
| Private Company Employees | 13,276 | 72.5% |
| Self-Employed (Incorporated) | 790 | 4.3% |
| Self-Employed (Not Incorporated) | 1,029 | 5.6% |
| Not-for-profit Organizations | 1,383 | 7.5% |
| Local Government Employees | 850 | 4.6% |
| State Government Employees | 675 | 3.7% |
| Federal Government Employees | 292 | 1.6% |
| Unpaid Family Workers | 16 | 0.1% |
| Total | 18,311 | 100.0% |
Employment Status by Age in Greer
According to the labor force statistics for Greer, out of the total population over 16 years of age (28,108), 68.4% or 19,226 individuals are in the labor force, with 3.5% or 673 of them unemployed. The age group with the highest labor force participation rate is 20 to 24 years, with 92.9% or 1,446 individuals in the labor force. Within the labor force, the 16 to 19 years age range has the highest percentage of unemployed individuals, with 7.3% or 53 of them being unemployed.
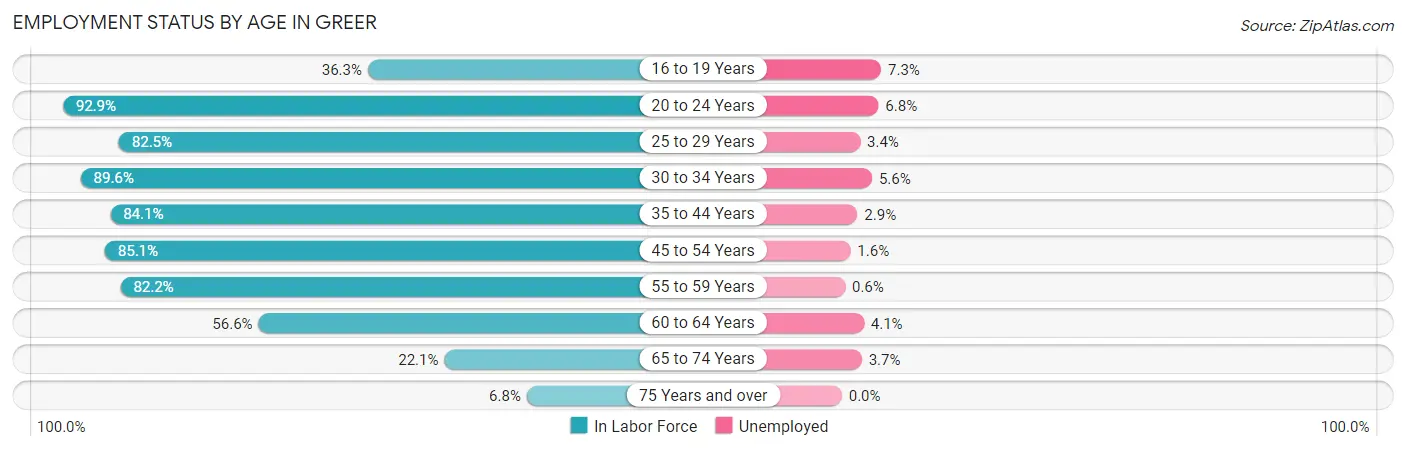
| Age Bracket | In Labor Force | Unemployed |
| 16 to 19 Years | 723 (36.3%) | 53 (7.3%) |
| 20 to 24 Years | 1,446 (92.9%) | 98 (6.8%) |
| 25 to 29 Years | 2,497 (82.5%) | 85 (3.4%) |
| 30 to 34 Years | 2,960 (89.6%) | 166 (5.6%) |
| 35 to 44 Years | 4,276 (84.1%) | 124 (2.9%) |
| 45 to 54 Years | 4,308 (85.1%) | 69 (1.6%) |
| 55 to 59 Years | 1,121 (82.2%) | 7 (0.6%) |
| 60 to 64 Years | 1,113 (56.6%) | 46 (4.1%) |
| 65 to 74 Years | 677 (22.1%) | 25 (3.7%) |
| 75 Years and over | 115 (6.8%) | 0 (0.0%) |
| Total | 19,226 (68.4%) | 673 (3.5%) |
Employment Status by Educational Attainment in Greer
According to labor force statistics for Greer, 82.2% of individuals (16,282) out of the total population between 25 and 64 years of age (19,808) are in the labor force, with 3.0% or 488 of them being unemployed. The group with the highest labor force participation rate are those with the educational attainment of bachelor's degree or higher, with 89.7% or 7,128 individuals in the labor force. Within the labor force, individuals with high school diploma education have the highest percentage of unemployment, with 7.3% or 229 of them being unemployed.

| Educational Attainment | In Labor Force | Unemployed |
| Less than High School | 1,276 (71.7%) | 93 (5.2%) |
| High School Diploma | 3,134 (70.5%) | 324 (7.3%) |
| College / Associate Degree | 4,735 (84.0%) | 130 (2.3%) |
| Bachelor's Degree or higher | 7,128 (89.7%) | 95 (1.2%) |
| Total | 16,282 (82.2%) | 594 (3.0%) |
Employment Occupations by Sex in Greer
Management, Business, Science and Arts Occupations
The most common Management, Business, Science and Arts occupations in Greer are Management (2,246 | 12.1%), Community & Social Service (1,979 | 10.7%), Health Diagnosing & Treating (1,239 | 6.7%), Computers, Engineering & Science (1,125 | 6.1%), and Business & Financial (1,061 | 5.7%).
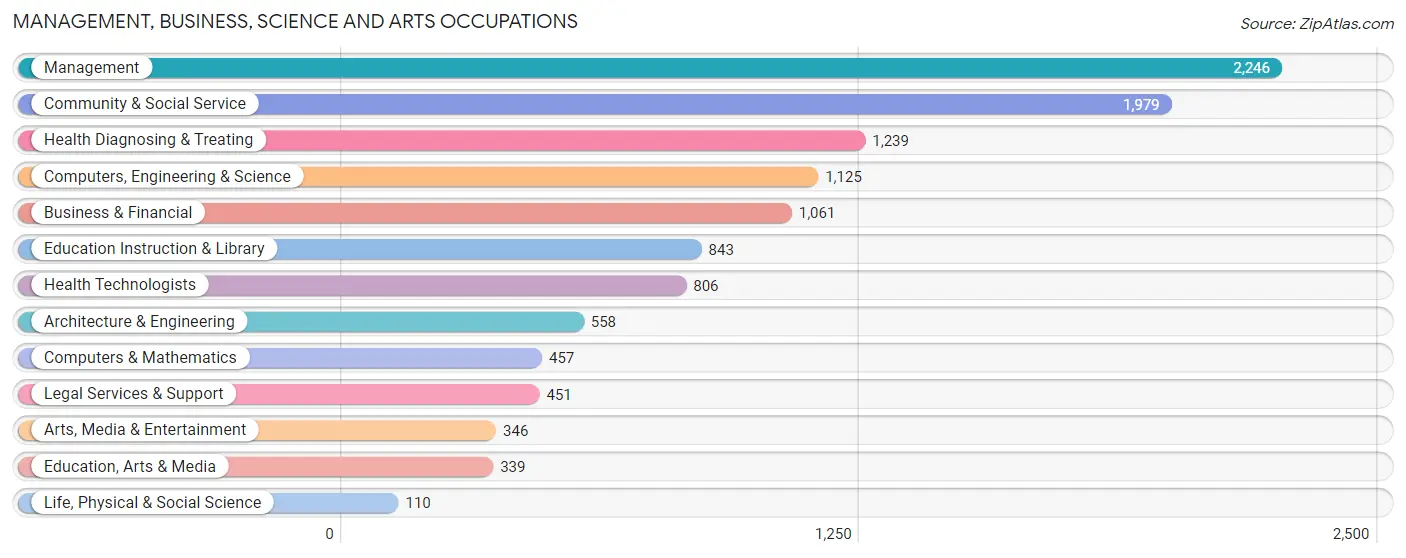
Management, Business, Science and Arts Occupations by Sex
Within the Management, Business, Science and Arts occupations in Greer, the most male-oriented occupations are Architecture & Engineering (88.3%), Computers, Engineering & Science (82.8%), and Computers & Mathematics (81.8%), while the most female-oriented occupations are Education Instruction & Library (92.2%), Education, Arts & Media (78.2%), and Health Diagnosing & Treating (75.1%).
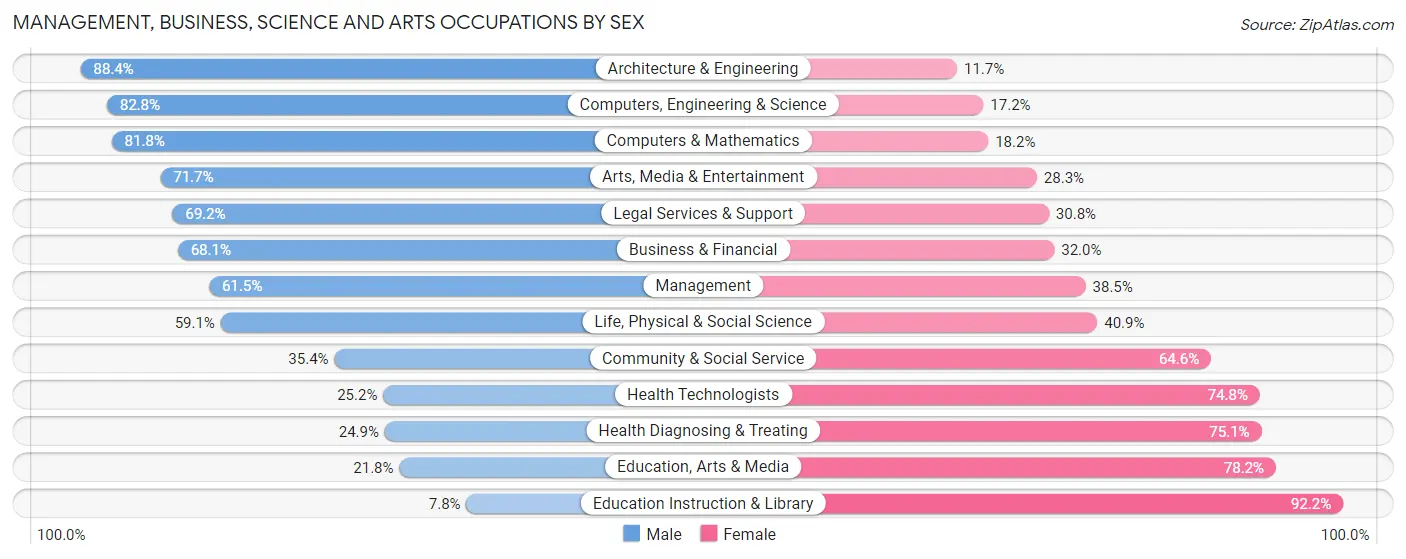
| Occupation | Male | Female |
| Management | 1,382 (61.5%) | 864 (38.5%) |
| Business & Financial | 722 (68.0%) | 339 (32.0%) |
| Computers, Engineering & Science | 932 (82.8%) | 193 (17.2%) |
| Computers & Mathematics | 374 (81.8%) | 83 (18.2%) |
| Architecture & Engineering | 493 (88.3%) | 65 (11.7%) |
| Life, Physical & Social Science | 65 (59.1%) | 45 (40.9%) |
| Community & Social Service | 700 (35.4%) | 1,279 (64.6%) |
| Education, Arts & Media | 74 (21.8%) | 265 (78.2%) |
| Legal Services & Support | 312 (69.2%) | 139 (30.8%) |
| Education Instruction & Library | 66 (7.8%) | 777 (92.2%) |
| Arts, Media & Entertainment | 248 (71.7%) | 98 (28.3%) |
| Health Diagnosing & Treating | 308 (24.9%) | 931 (75.1%) |
| Health Technologists | 203 (25.2%) | 603 (74.8%) |
| Total (Category) | 4,044 (52.9%) | 3,606 (47.1%) |
| Total (Overall) | 10,096 (54.4%) | 8,470 (45.6%) |
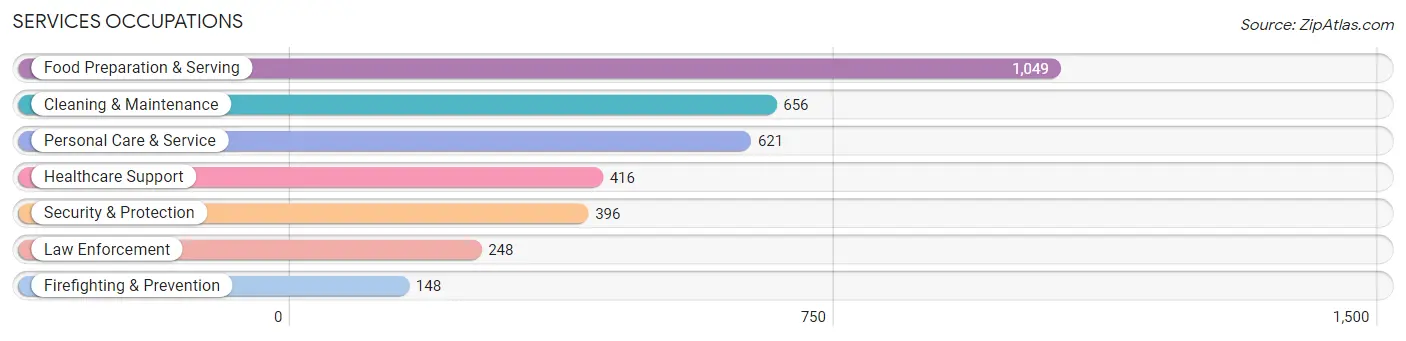
Services Occupations
The most common Services occupations in Greer are Food Preparation & Serving (1,049 | 5.7%), Cleaning & Maintenance (656 | 3.5%), Personal Care & Service (621 | 3.3%), Healthcare Support (416 | 2.2%), and Security & Protection (396 | 2.1%).
Services Occupations by Sex
Within the Services occupations in Greer, the most male-oriented occupations are Law Enforcement (80.6%), Security & Protection (77.0%), and Cleaning & Maintenance (73.0%), while the most female-oriented occupations are Healthcare Support (80.0%), Personal Care & Service (76.0%), and Food Preparation & Serving (62.3%).
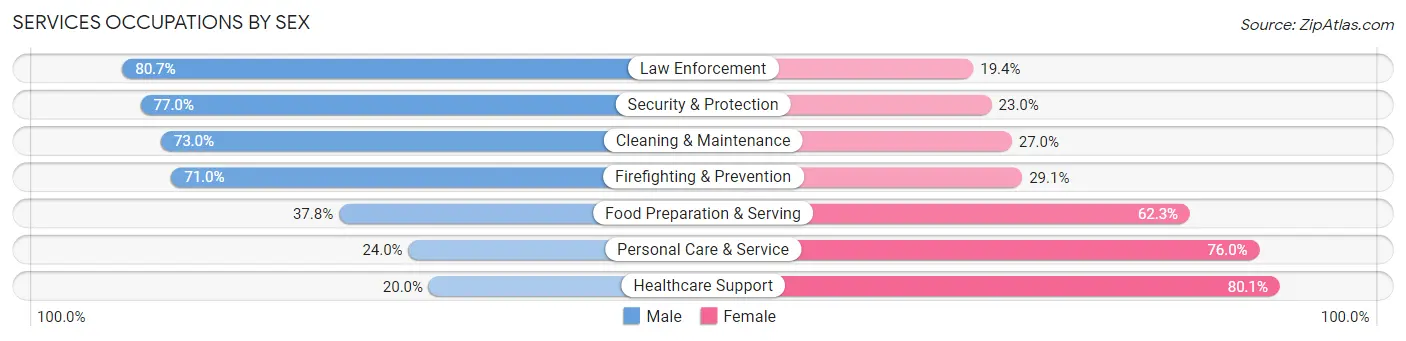
| Occupation | Male | Female |
| Healthcare Support | 83 (20.0%) | 333 (80.0%) |
| Security & Protection | 305 (77.0%) | 91 (23.0%) |
| Firefighting & Prevention | 105 (71.0%) | 43 (29.0%) |
| Law Enforcement | 200 (80.6%) | 48 (19.4%) |
| Food Preparation & Serving | 396 (37.8%) | 653 (62.3%) |
| Cleaning & Maintenance | 479 (73.0%) | 177 (27.0%) |
| Personal Care & Service | 149 (24.0%) | 472 (76.0%) |
| Total (Category) | 1,412 (45.0%) | 1,726 (55.0%) |
| Total (Overall) | 10,096 (54.4%) | 8,470 (45.6%) |
Sales and Office Occupations
The most common Sales and Office occupations in Greer are Sales & Related (2,118 | 11.4%), and Office & Administration (1,829 | 9.9%).

Sales and Office Occupations by Sex

| Occupation | Male | Female |
| Sales & Related | 1,114 (52.6%) | 1,004 (47.4%) |
| Office & Administration | 533 (29.1%) | 1,296 (70.9%) |
| Total (Category) | 1,647 (41.7%) | 2,300 (58.3%) |
| Total (Overall) | 10,096 (54.4%) | 8,470 (45.6%) |
Natural Resources, Construction and Maintenance Occupations
The most common Natural Resources, Construction and Maintenance occupations in Greer are Construction & Extraction (786 | 4.2%), Installation, Maintenance & Repair (337 | 1.8%), and Farming, Fishing & Forestry (37 | 0.2%).

Natural Resources, Construction and Maintenance Occupations by Sex

| Occupation | Male | Female |
| Farming, Fishing & Forestry | 37 (100.0%) | 0 (0.0%) |
| Construction & Extraction | 662 (84.2%) | 124 (15.8%) |
| Installation, Maintenance & Repair | 337 (100.0%) | 0 (0.0%) |
| Total (Category) | 1,036 (89.3%) | 124 (10.7%) |
| Total (Overall) | 10,096 (54.4%) | 8,470 (45.6%) |
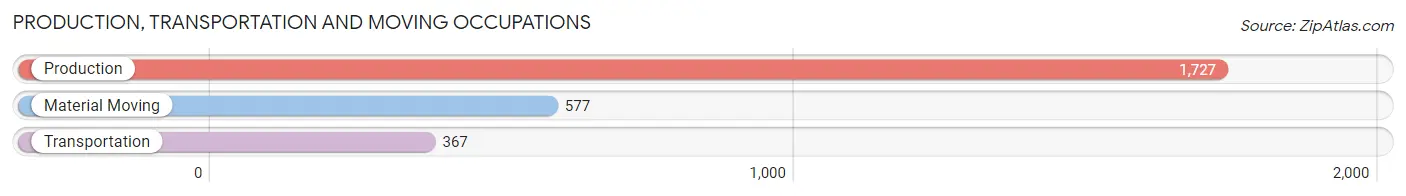
Production, Transportation and Moving Occupations
The most common Production, Transportation and Moving occupations in Greer are Production (1,727 | 9.3%), Material Moving (577 | 3.1%), and Transportation (367 | 2.0%).
Production, Transportation and Moving Occupations by Sex
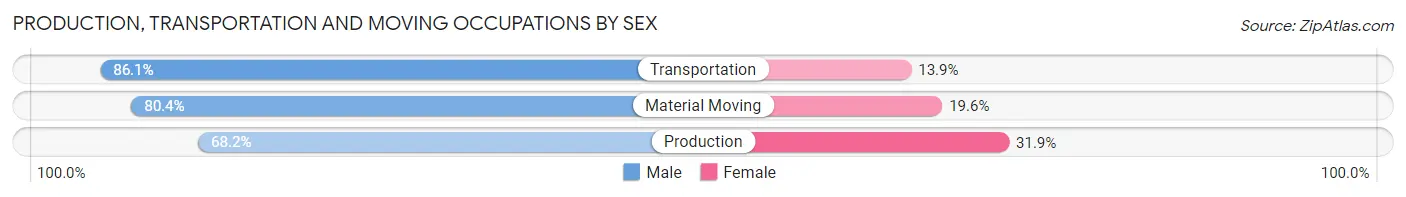
| Occupation | Male | Female |
| Production | 1,177 (68.1%) | 550 (31.9%) |
| Transportation | 316 (86.1%) | 51 (13.9%) |
| Material Moving | 464 (80.4%) | 113 (19.6%) |
| Total (Category) | 1,957 (73.3%) | 714 (26.7%) |
| Total (Overall) | 10,096 (54.4%) | 8,470 (45.6%) |
Employment Industries by Sex in Greer
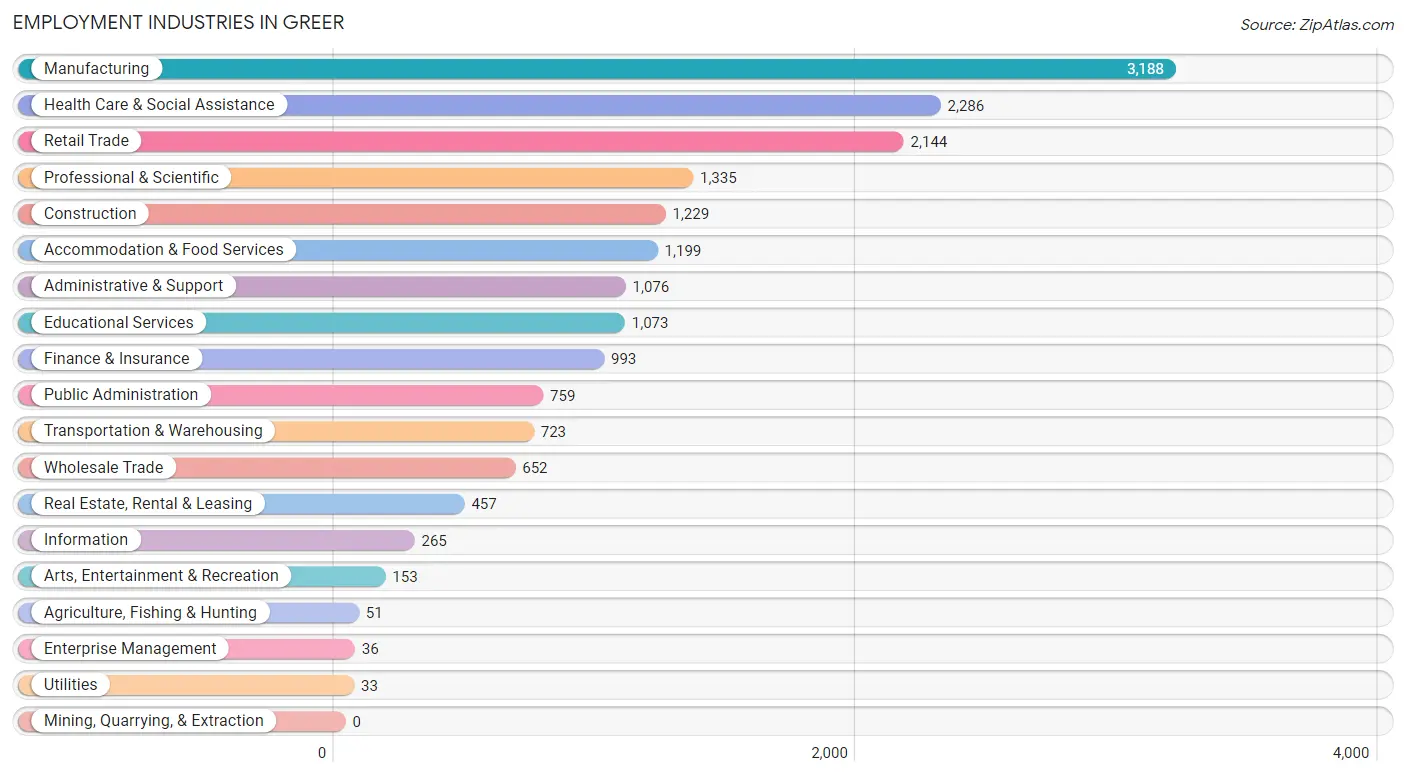
Employment Industries in Greer
The major employment industries in Greer include Manufacturing (3,188 | 17.2%), Health Care & Social Assistance (2,286 | 12.3%), Retail Trade (2,144 | 11.6%), Professional & Scientific (1,335 | 7.2%), and Construction (1,229 | 6.6%).
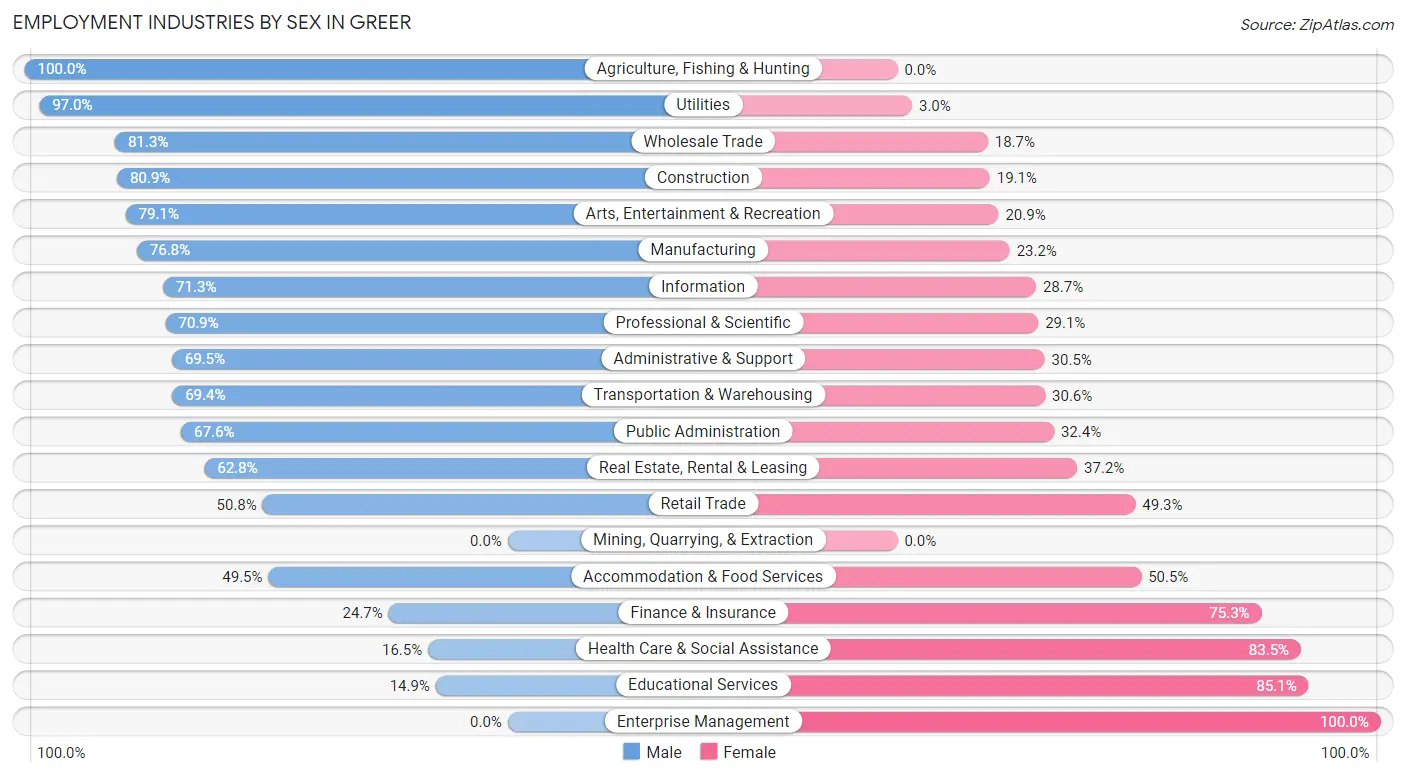
Employment Industries by Sex in Greer
The Greer industries that see more men than women are Agriculture, Fishing & Hunting (100.0%), Utilities (97.0%), and Wholesale Trade (81.3%), whereas the industries that tend to have a higher number of women are Enterprise Management (100.0%), Educational Services (85.1%), and Health Care & Social Assistance (83.5%).
| Industry | Male | Female |
| Agriculture, Fishing & Hunting | 51 (100.0%) | 0 (0.0%) |
| Mining, Quarrying, & Extraction | 0 (0.0%) | 0 (0.0%) |
| Construction | 994 (80.9%) | 235 (19.1%) |
| Manufacturing | 2,447 (76.8%) | 741 (23.2%) |
| Wholesale Trade | 530 (81.3%) | 122 (18.7%) |
| Retail Trade | 1,088 (50.7%) | 1,056 (49.2%) |
| Transportation & Warehousing | 502 (69.4%) | 221 (30.6%) |
| Utilities | 32 (97.0%) | 1 (3.0%) |
| Information | 189 (71.3%) | 76 (28.7%) |
| Finance & Insurance | 245 (24.7%) | 748 (75.3%) |
| Real Estate, Rental & Leasing | 287 (62.8%) | 170 (37.2%) |
| Professional & Scientific | 946 (70.9%) | 389 (29.1%) |
| Enterprise Management | 0 (0.0%) | 36 (100.0%) |
| Administrative & Support | 748 (69.5%) | 328 (30.5%) |
| Educational Services | 160 (14.9%) | 913 (85.1%) |
| Health Care & Social Assistance | 377 (16.5%) | 1,909 (83.5%) |
| Arts, Entertainment & Recreation | 121 (79.1%) | 32 (20.9%) |
| Accommodation & Food Services | 594 (49.5%) | 605 (50.5%) |
| Public Administration | 513 (67.6%) | 246 (32.4%) |
| Total | 10,096 (54.4%) | 8,470 (45.6%) |
Education in Greer
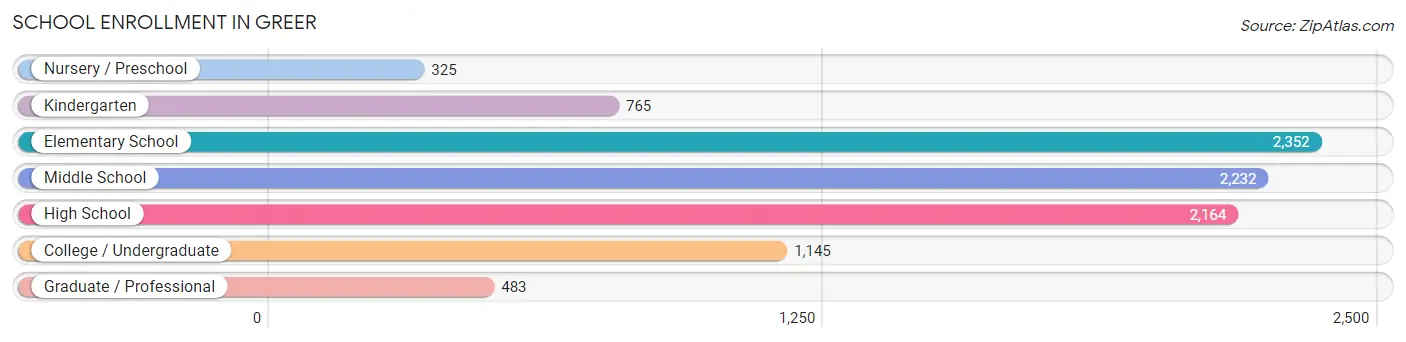
School Enrollment in Greer
The most common levels of schooling among the 9,466 students in Greer are elementary school (2,352 | 24.8%), middle school (2,232 | 23.6%), and high school (2,164 | 22.9%).
| School Level | # Students | % Students |
| Nursery / Preschool | 325 | 3.4% |
| Kindergarten | 765 | 8.1% |
| Elementary School | 2,352 | 24.8% |
| Middle School | 2,232 | 23.6% |
| High School | 2,164 | 22.9% |
| College / Undergraduate | 1,145 | 12.1% |
| Graduate / Professional | 483 | 5.1% |
| Total | 9,466 | 100.0% |
School Enrollment by Age by Funding Source in Greer
Out of a total of 9,466 students who are enrolled in schools in Greer, 1,297 (13.7%) attend a private institution, while the remaining 8,169 (86.3%) are enrolled in public schools. The age group of 3 to 4 year olds has the highest likelihood of being enrolled in private schools, with 217 (72.3% in the age bracket) enrolled. Conversely, the age group of 15 to 17 year olds has the lowest likelihood of being enrolled in a private school, with 1,458 (98.9% in the age bracket) attending a public institution.
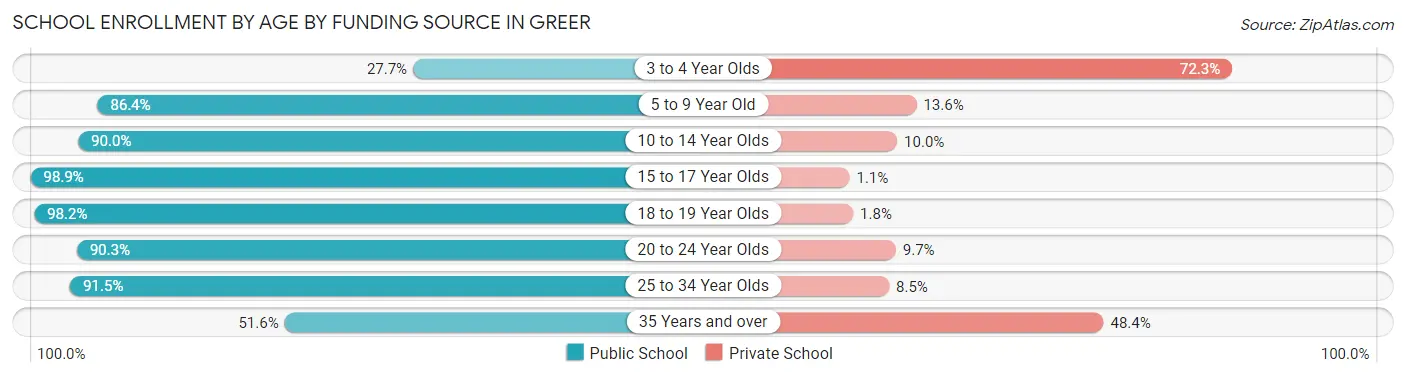
| Age Bracket | Public School | Private School |
| 3 to 4 Year Olds | 83 (27.7%) | 217 (72.3%) |
| 5 to 9 Year Old | 2,461 (86.4%) | 386 (13.6%) |
| 10 to 14 Year Olds | 2,496 (90.0%) | 276 (10.0%) |
| 15 to 17 Year Olds | 1,458 (98.9%) | 16 (1.1%) |
| 18 to 19 Year Olds | 611 (98.2%) | 11 (1.8%) |
| 20 to 24 Year Olds | 288 (90.3%) | 31 (9.7%) |
| 25 to 34 Year Olds | 433 (91.5%) | 40 (8.5%) |
| 35 Years and over | 340 (51.6%) | 319 (48.4%) |
| Total | 8,169 (86.3%) | 1,297 (13.7%) |
Educational Attainment by Field of Study in Greer
Business (2,495 | 24.7%), education (1,141 | 11.3%), science & technology (1,126 | 11.2%), engineering (785 | 7.8%), and psychology (677 | 6.7%) are the most common fields of study among 10,094 individuals in Greer who have obtained a bachelor's degree or higher.
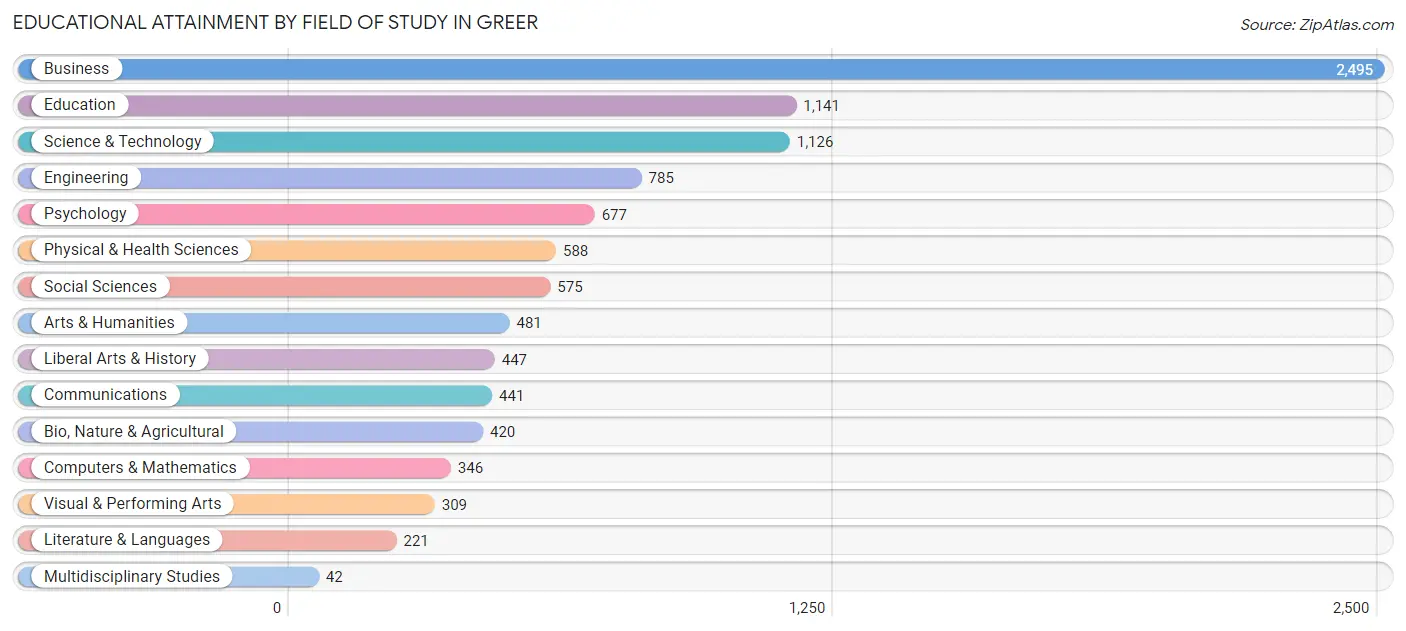
| Field of Study | # Graduates | % Graduates |
| Computers & Mathematics | 346 | 3.4% |
| Bio, Nature & Agricultural | 420 | 4.2% |
| Physical & Health Sciences | 588 | 5.8% |
| Psychology | 677 | 6.7% |
| Social Sciences | 575 | 5.7% |
| Engineering | 785 | 7.8% |
| Multidisciplinary Studies | 42 | 0.4% |
| Science & Technology | 1,126 | 11.2% |
| Business | 2,495 | 24.7% |
| Education | 1,141 | 11.3% |
| Literature & Languages | 221 | 2.2% |
| Liberal Arts & History | 447 | 4.4% |
| Visual & Performing Arts | 309 | 3.1% |
| Communications | 441 | 4.4% |
| Arts & Humanities | 481 | 4.8% |
| Total | 10,094 | 100.0% |
Transportation & Commute in Greer
Vehicle Availability by Sex in Greer
The most prevalent vehicle ownership categories in Greer are males with 2 vehicles (4,847, accounting for 48.6%) and females with 2 vehicles (3,715, making up 58.1%).
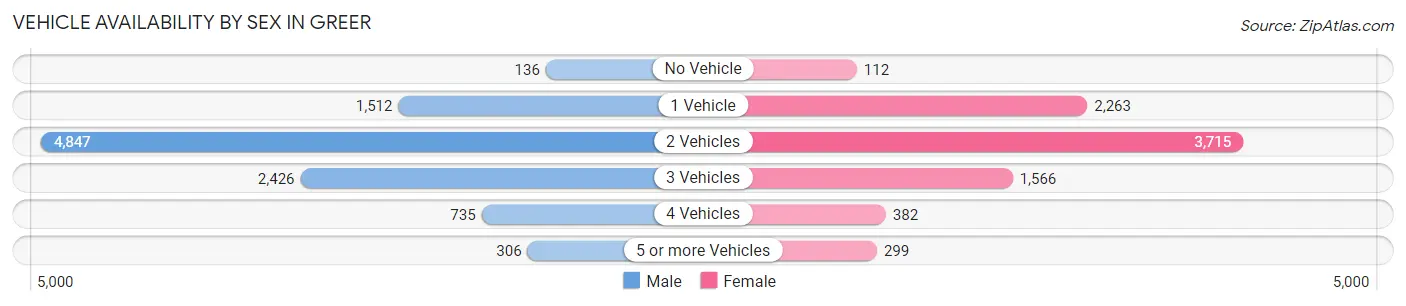
| Vehicles Available | Male | Female |
| No Vehicle | 136 (1.4%) | 112 (1.3%) |
| 1 Vehicle | 1,512 (15.2%) | 2,263 (27.1%) |
| 2 Vehicles | 4,847 (48.6%) | 3,715 (44.6%) |
| 3 Vehicles | 2,426 (24.3%) | 1,566 (18.8%) |
| 4 Vehicles | 735 (7.4%) | 382 (4.6%) |
| 5 or more Vehicles | 306 (3.1%) | 299 (3.6%) |
| Total | 9,962 (100.0%) | 8,337 (100.0%) |
Commute Time in Greer
The most frequently occuring commute durations in Greer are 30 to 34 minutes (2,888 commuters, 17.9%), 20 to 24 minutes (2,704 commuters, 16.7%), and 10 to 14 minutes (2,466 commuters, 15.2%).
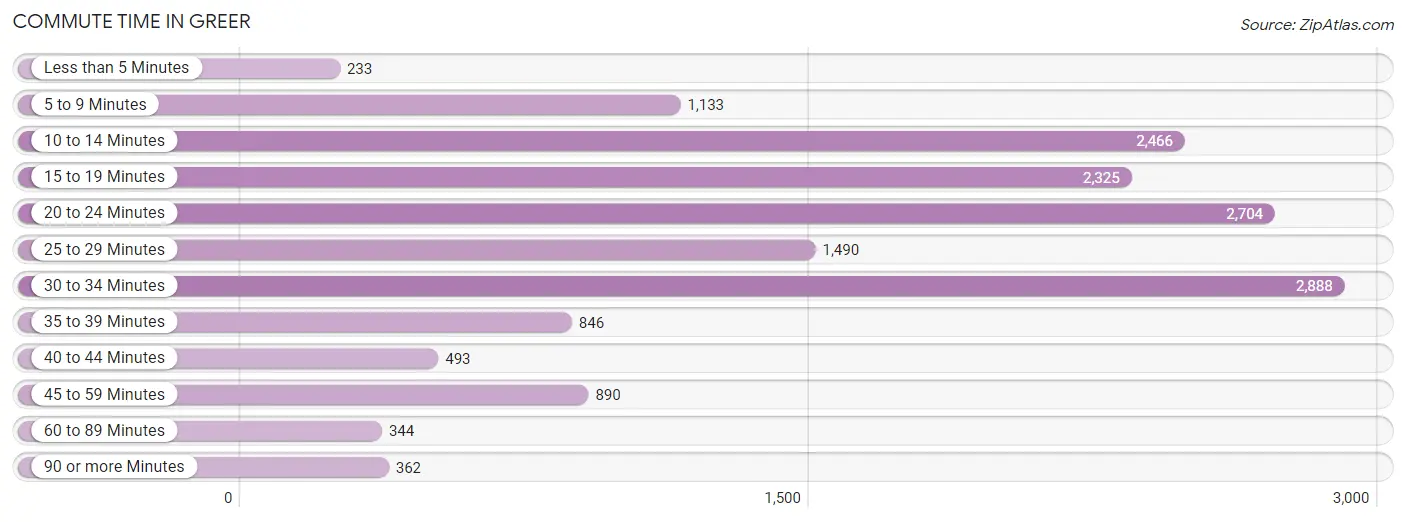
| Commute Time | # Commuters | % Commuters |
| Less than 5 Minutes | 233 | 1.4% |
| 5 to 9 Minutes | 1,133 | 7.0% |
| 10 to 14 Minutes | 2,466 | 15.2% |
| 15 to 19 Minutes | 2,325 | 14.4% |
| 20 to 24 Minutes | 2,704 | 16.7% |
| 25 to 29 Minutes | 1,490 | 9.2% |
| 30 to 34 Minutes | 2,888 | 17.9% |
| 35 to 39 Minutes | 846 | 5.2% |
| 40 to 44 Minutes | 493 | 3.0% |
| 45 to 59 Minutes | 890 | 5.5% |
| 60 to 89 Minutes | 344 | 2.1% |
| 90 or more Minutes | 362 | 2.2% |
Commute Time by Sex in Greer
The most common commute times in Greer are 10 to 14 minutes (1,706 commuters, 19.6%) for males and 30 to 34 minutes (1,433 commuters, 19.2%) for females.
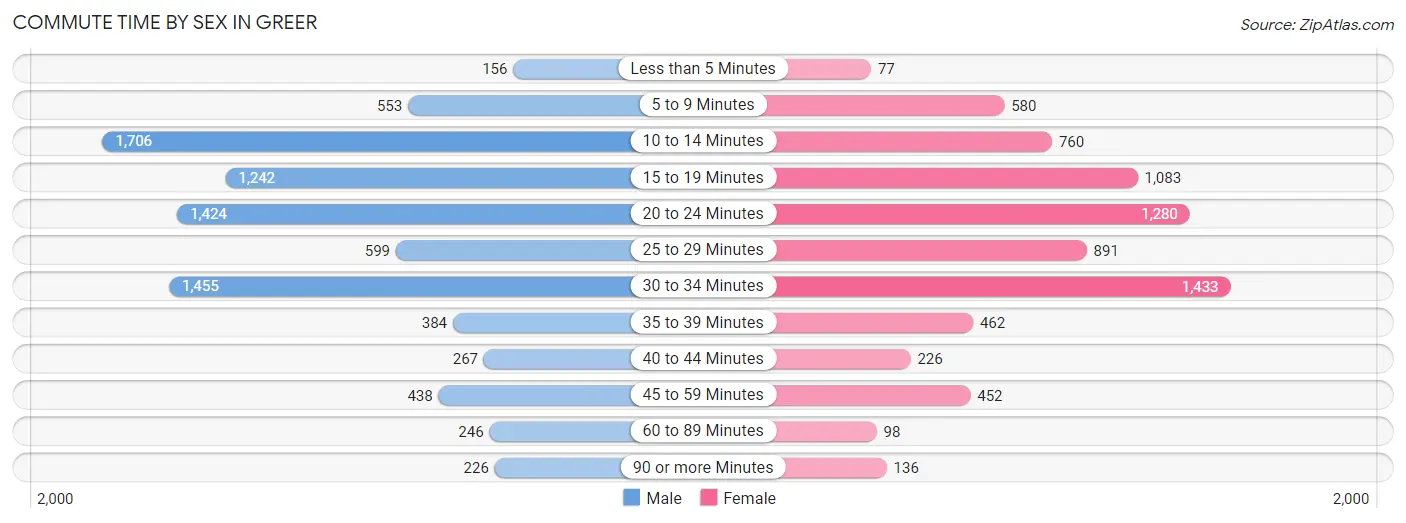
| Commute Time | Male | Female |
| Less than 5 Minutes | 156 (1.8%) | 77 (1.0%) |
| 5 to 9 Minutes | 553 (6.4%) | 580 (7.8%) |
| 10 to 14 Minutes | 1,706 (19.6%) | 760 (10.2%) |
| 15 to 19 Minutes | 1,242 (14.3%) | 1,083 (14.5%) |
| 20 to 24 Minutes | 1,424 (16.4%) | 1,280 (17.1%) |
| 25 to 29 Minutes | 599 (6.9%) | 891 (11.9%) |
| 30 to 34 Minutes | 1,455 (16.7%) | 1,433 (19.2%) |
| 35 to 39 Minutes | 384 (4.4%) | 462 (6.2%) |
| 40 to 44 Minutes | 267 (3.1%) | 226 (3.0%) |
| 45 to 59 Minutes | 438 (5.0%) | 452 (6.0%) |
| 60 to 89 Minutes | 246 (2.8%) | 98 (1.3%) |
| 90 or more Minutes | 226 (2.6%) | 136 (1.8%) |
Time of Departure to Work by Sex in Greer
The most frequent times of departure to work in Greer are 7:00 AM to 7:29 AM (1,508, 17.3%) for males and 7:00 AM to 7:29 AM (1,237, 16.5%) for females.
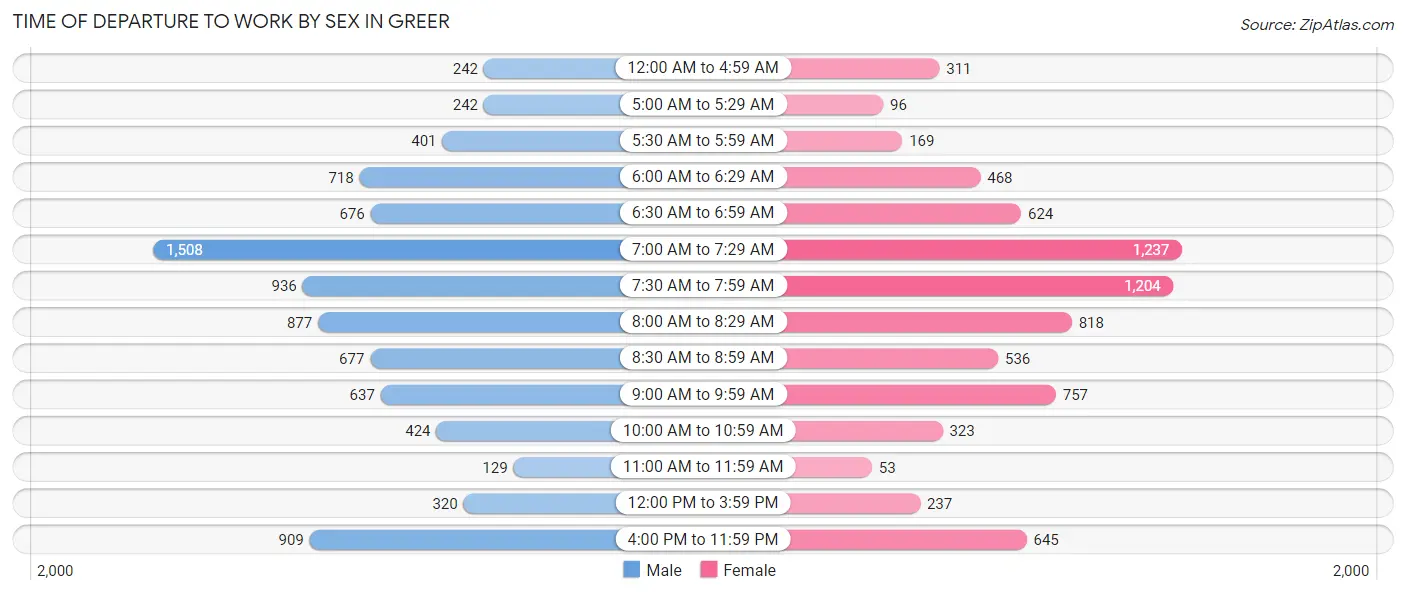
| Time of Departure | Male | Female |
| 12:00 AM to 4:59 AM | 242 (2.8%) | 311 (4.2%) |
| 5:00 AM to 5:29 AM | 242 (2.8%) | 96 (1.3%) |
| 5:30 AM to 5:59 AM | 401 (4.6%) | 169 (2.3%) |
| 6:00 AM to 6:29 AM | 718 (8.3%) | 468 (6.3%) |
| 6:30 AM to 6:59 AM | 676 (7.8%) | 624 (8.3%) |
| 7:00 AM to 7:29 AM | 1,508 (17.3%) | 1,237 (16.5%) |
| 7:30 AM to 7:59 AM | 936 (10.8%) | 1,204 (16.1%) |
| 8:00 AM to 8:29 AM | 877 (10.1%) | 818 (10.9%) |
| 8:30 AM to 8:59 AM | 677 (7.8%) | 536 (7.2%) |
| 9:00 AM to 9:59 AM | 637 (7.3%) | 757 (10.1%) |
| 10:00 AM to 10:59 AM | 424 (4.9%) | 323 (4.3%) |
| 11:00 AM to 11:59 AM | 129 (1.5%) | 53 (0.7%) |
| 12:00 PM to 3:59 PM | 320 (3.7%) | 237 (3.2%) |
| 4:00 PM to 11:59 PM | 909 (10.4%) | 645 (8.6%) |
| Total | 8,696 (100.0%) | 7,478 (100.0%) |
Housing Occupancy in Greer
Occupancy by Ownership in Greer
Of the total 14,177 dwellings in Greer, owner-occupied units account for 10,067 (71.0%), while renter-occupied units make up 4,110 (29.0%).
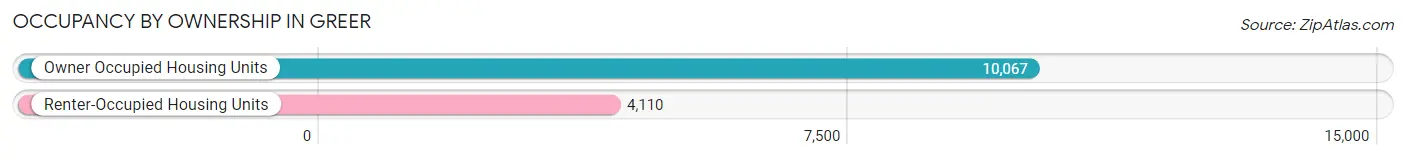
| Occupancy | # Housing Units | % Housing Units |
| Owner Occupied Housing Units | 10,067 | 71.0% |
| Renter-Occupied Housing Units | 4,110 | 29.0% |
| Total Occupied Housing Units | 14,177 | 100.0% |
Occupancy by Household Size in Greer
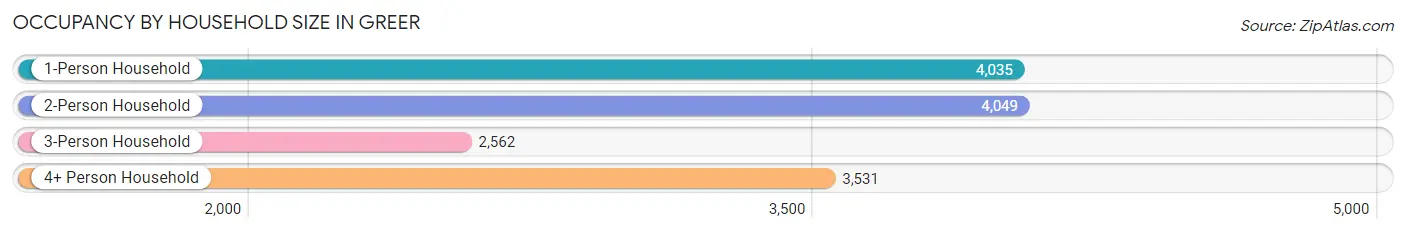
| Household Size | # Housing Units | % Housing Units |
| 1-Person Household | 4,035 | 28.5% |
| 2-Person Household | 4,049 | 28.6% |
| 3-Person Household | 2,562 | 18.1% |
| 4+ Person Household | 3,531 | 24.9% |
| Total Housing Units | 14,177 | 100.0% |
Occupancy by Ownership by Household Size in Greer
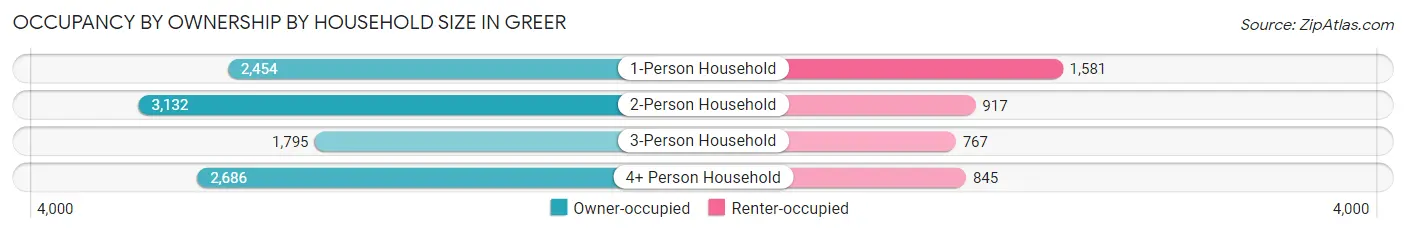
| Household Size | Owner-occupied | Renter-occupied |
| 1-Person Household | 2,454 (60.8%) | 1,581 (39.2%) |
| 2-Person Household | 3,132 (77.3%) | 917 (22.7%) |
| 3-Person Household | 1,795 (70.1%) | 767 (29.9%) |
| 4+ Person Household | 2,686 (76.1%) | 845 (23.9%) |
| Total Housing Units | 10,067 (71.0%) | 4,110 (29.0%) |
Occupancy by Educational Attainment in Greer
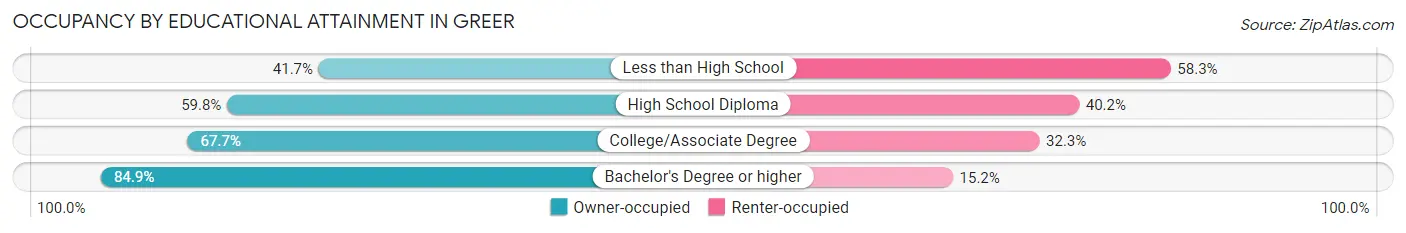
| Household Size | Owner-occupied | Renter-occupied |
| Less than High School | 462 (41.7%) | 647 (58.3%) |
| High School Diploma | 1,737 (59.8%) | 1,166 (40.2%) |
| College/Associate Degree | 2,985 (67.7%) | 1,425 (32.3%) |
| Bachelor's Degree or higher | 4,883 (84.9%) | 872 (15.1%) |
Occupancy by Age of Householder in Greer
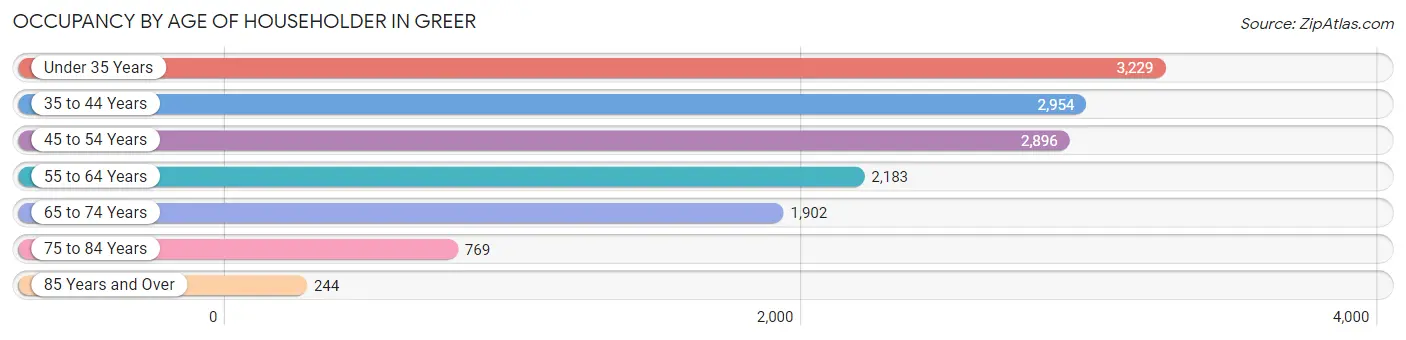
| Age Bracket | # Households | % Households |
| Under 35 Years | 3,229 | 22.8% |
| 35 to 44 Years | 2,954 | 20.8% |
| 45 to 54 Years | 2,896 | 20.4% |
| 55 to 64 Years | 2,183 | 15.4% |
| 65 to 74 Years | 1,902 | 13.4% |
| 75 to 84 Years | 769 | 5.4% |
| 85 Years and Over | 244 | 1.7% |
| Total | 14,177 | 100.0% |
Housing Finances in Greer
Median Income by Occupancy in Greer
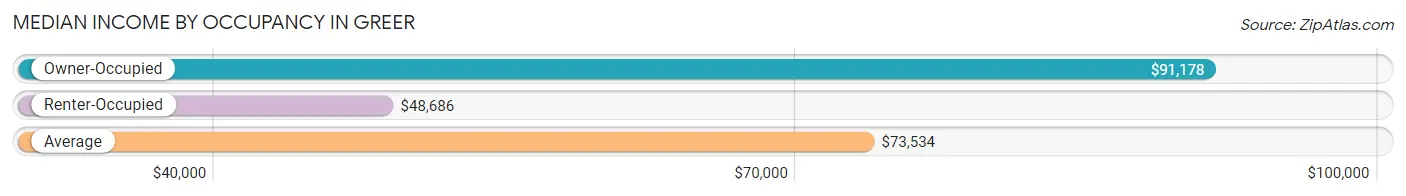
| Occupancy Type | # Households | Median Income |
| Owner-Occupied | 10,067 (71.0%) | $91,178 |
| Renter-Occupied | 4,110 (29.0%) | $48,686 |
| Average | 14,177 (100.0%) | $73,534 |
Occupancy by Householder Income Bracket in Greer
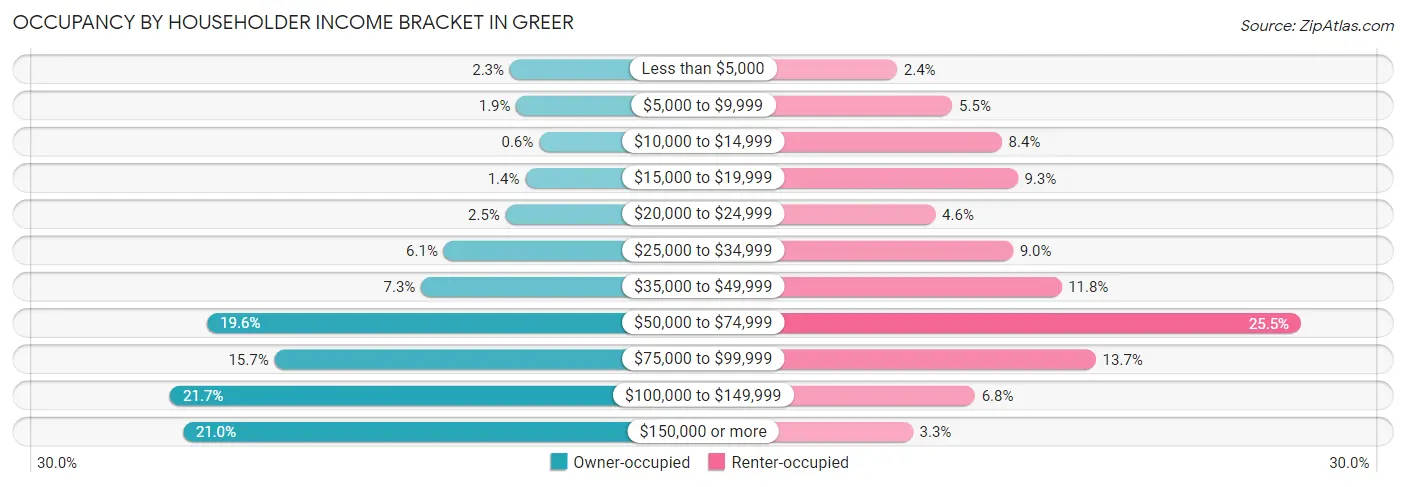
| Income Bracket | Owner-occupied | Renter-occupied |
| Less than $5,000 | 229 (2.3%) | 97 (2.4%) |
| $5,000 to $9,999 | 191 (1.9%) | 227 (5.5%) |
| $10,000 to $14,999 | 60 (0.6%) | 343 (8.4%) |
| $15,000 to $19,999 | 140 (1.4%) | 380 (9.2%) |
| $20,000 to $24,999 | 253 (2.5%) | 187 (4.5%) |
| $25,000 to $34,999 | 609 (6.0%) | 369 (9.0%) |
| $35,000 to $49,999 | 739 (7.3%) | 483 (11.7%) |
| $50,000 to $74,999 | 1,970 (19.6%) | 1,046 (25.5%) |
| $75,000 to $99,999 | 1,583 (15.7%) | 564 (13.7%) |
| $100,000 to $149,999 | 2,183 (21.7%) | 280 (6.8%) |
| $150,000 or more | 2,110 (21.0%) | 134 (3.3%) |
| Total | 10,067 (100.0%) | 4,110 (100.0%) |
Monthly Housing Cost Tiers in Greer
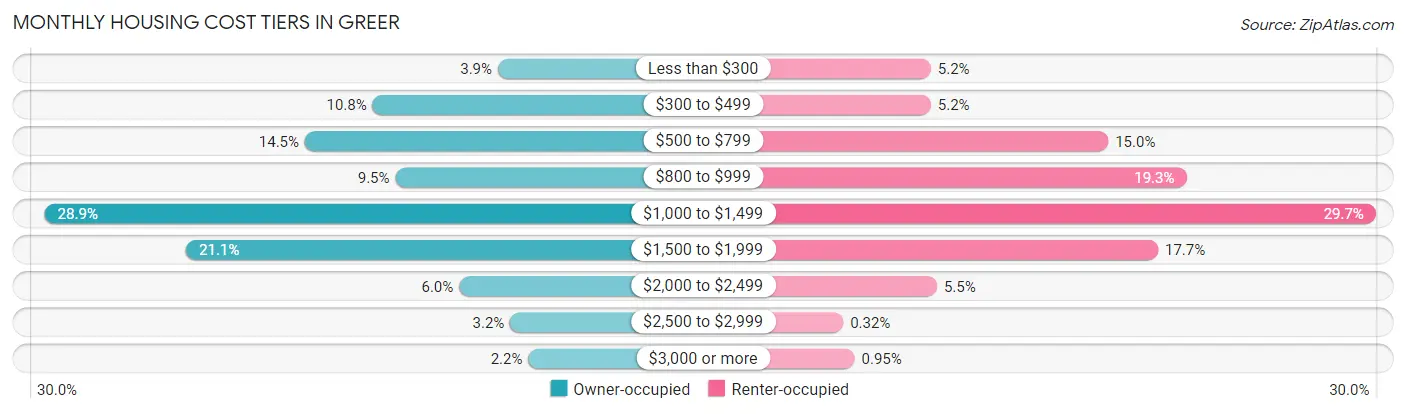
| Monthly Cost | Owner-occupied | Renter-occupied |
| Less than $300 | 389 (3.9%) | 212 (5.2%) |
| $300 to $499 | 1,085 (10.8%) | 212 (5.2%) |
| $500 to $799 | 1,462 (14.5%) | 615 (15.0%) |
| $800 to $999 | 958 (9.5%) | 792 (19.3%) |
| $1,000 to $1,499 | 2,908 (28.9%) | 1,222 (29.7%) |
| $1,500 to $1,999 | 2,122 (21.1%) | 728 (17.7%) |
| $2,000 to $2,499 | 604 (6.0%) | 226 (5.5%) |
| $2,500 to $2,999 | 320 (3.2%) | 13 (0.3%) |
| $3,000 or more | 219 (2.2%) | 39 (0.9%) |
| Total | 10,067 (100.0%) | 4,110 (100.0%) |
Physical Housing Characteristics in Greer
Housing Structures in Greer
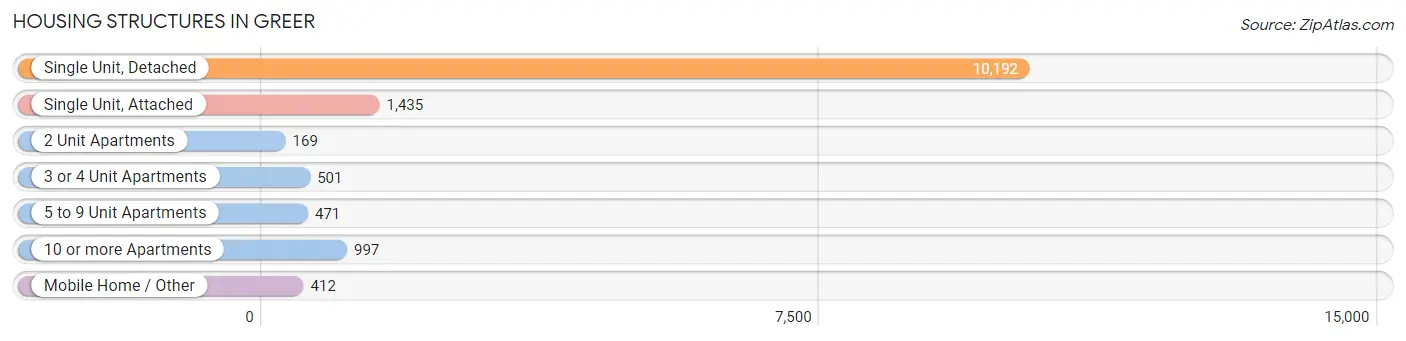
| Structure Type | # Housing Units | % Housing Units |
| Single Unit, Detached | 10,192 | 71.9% |
| Single Unit, Attached | 1,435 | 10.1% |
| 2 Unit Apartments | 169 | 1.2% |
| 3 or 4 Unit Apartments | 501 | 3.5% |
| 5 to 9 Unit Apartments | 471 | 3.3% |
| 10 or more Apartments | 997 | 7.0% |
| Mobile Home / Other | 412 | 2.9% |
| Total | 14,177 | 100.0% |
Housing Structures by Occupancy in Greer
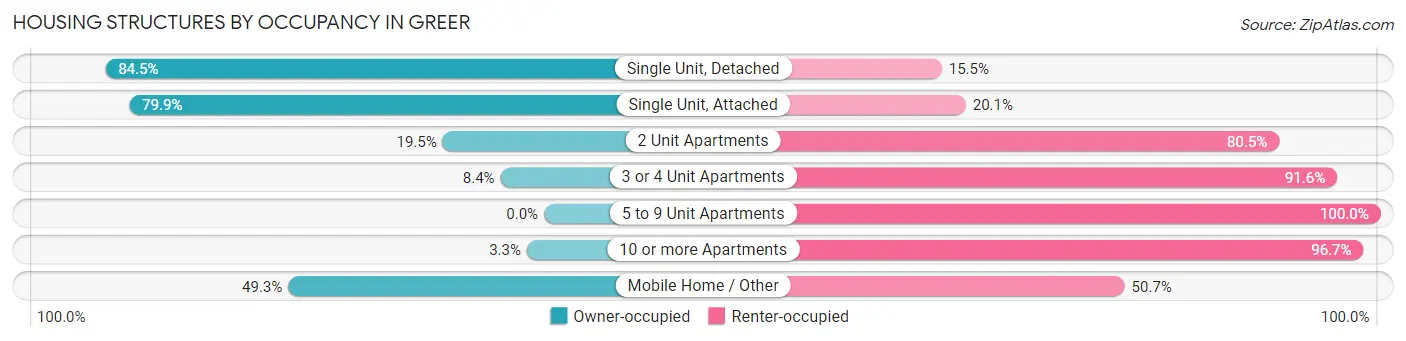
| Structure Type | Owner-occupied | Renter-occupied |
| Single Unit, Detached | 8,610 (84.5%) | 1,582 (15.5%) |
| Single Unit, Attached | 1,146 (79.9%) | 289 (20.1%) |
| 2 Unit Apartments | 33 (19.5%) | 136 (80.5%) |
| 3 or 4 Unit Apartments | 42 (8.4%) | 459 (91.6%) |
| 5 to 9 Unit Apartments | 0 (0.0%) | 471 (100.0%) |
| 10 or more Apartments | 33 (3.3%) | 964 (96.7%) |
| Mobile Home / Other | 203 (49.3%) | 209 (50.7%) |
| Total | 10,067 (71.0%) | 4,110 (29.0%) |
Housing Structures by Number of Rooms in Greer
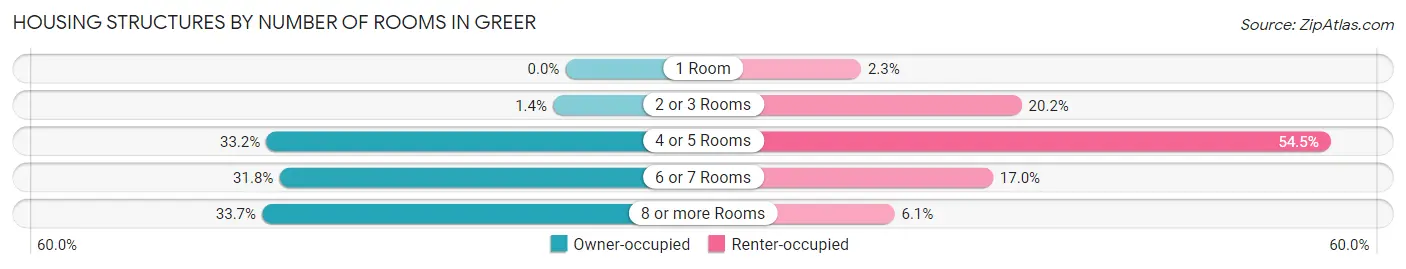
| Number of Rooms | Owner-occupied | Renter-occupied |
| 1 Room | 0 (0.0%) | 96 (2.3%) |
| 2 or 3 Rooms | 139 (1.4%) | 829 (20.2%) |
| 4 or 5 Rooms | 3,342 (33.2%) | 2,238 (54.4%) |
| 6 or 7 Rooms | 3,196 (31.8%) | 698 (17.0%) |
| 8 or more Rooms | 3,390 (33.7%) | 249 (6.1%) |
| Total | 10,067 (100.0%) | 4,110 (100.0%) |
Housing Structure by Heating Type in Greer
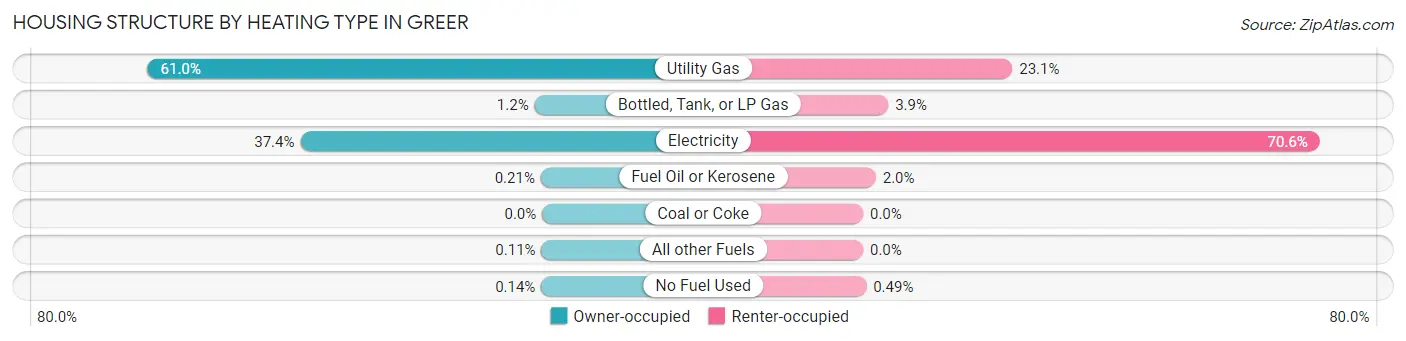
| Heating Type | Owner-occupied | Renter-occupied |
| Utility Gas | 6,139 (61.0%) | 948 (23.1%) |
| Bottled, Tank, or LP Gas | 119 (1.2%) | 160 (3.9%) |
| Electricity | 3,763 (37.4%) | 2,901 (70.6%) |
| Fuel Oil or Kerosene | 21 (0.2%) | 81 (2.0%) |
| Coal or Coke | 0 (0.0%) | 0 (0.0%) |
| All other Fuels | 11 (0.1%) | 0 (0.0%) |
| No Fuel Used | 14 (0.1%) | 20 (0.5%) |
| Total | 10,067 (100.0%) | 4,110 (100.0%) |
Household Vehicle Usage in Greer
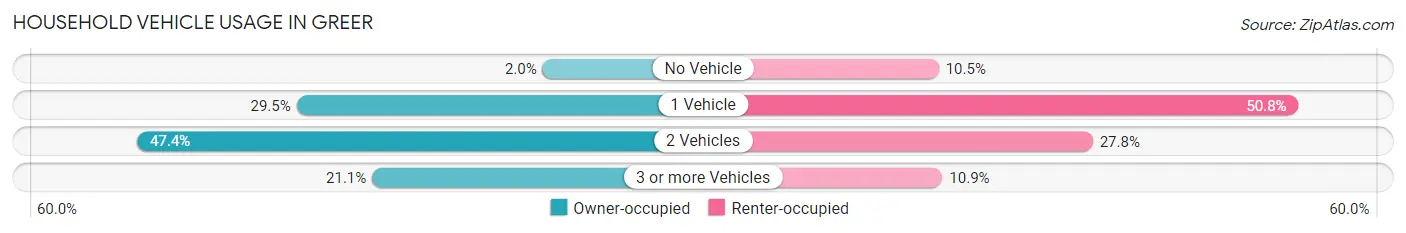
| Vehicles per Household | Owner-occupied | Renter-occupied |
| No Vehicle | 199 (2.0%) | 432 (10.5%) |
| 1 Vehicle | 2,974 (29.5%) | 2,088 (50.8%) |
| 2 Vehicles | 4,773 (47.4%) | 1,141 (27.8%) |
| 3 or more Vehicles | 2,121 (21.1%) | 449 (10.9%) |
| Total | 10,067 (100.0%) | 4,110 (100.0%) |
Real Estate & Mortgages in Greer
Real Estate and Mortgage Overview in Greer
| Characteristic | Without Mortgage | With Mortgage |
| Housing Units | 2,860 | 7,207 |
| Median Property Value | $210,800 | $247,700 |
| Median Household Income | $69,529 | $1,728 |
| Monthly Housing Costs | $498 | $214 |
| Real Estate Taxes | $1,338 | $85 |
Property Value by Mortgage Status in Greer
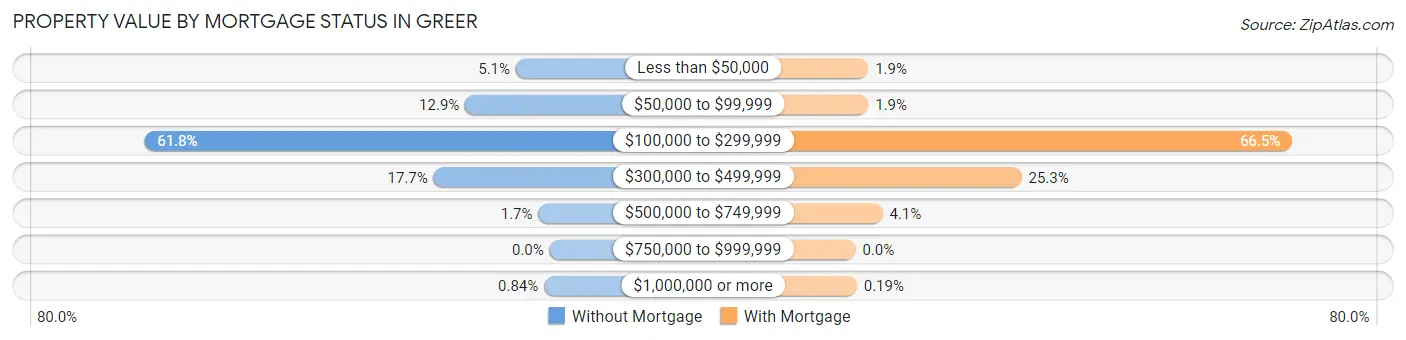
| Property Value | Without Mortgage | With Mortgage |
| Less than $50,000 | 147 (5.1%) | 139 (1.9%) |
| $50,000 to $99,999 | 368 (12.9%) | 140 (1.9%) |
| $100,000 to $299,999 | 1,766 (61.8%) | 4,795 (66.5%) |
| $300,000 to $499,999 | 506 (17.7%) | 1,823 (25.3%) |
| $500,000 to $749,999 | 49 (1.7%) | 296 (4.1%) |
| $750,000 to $999,999 | 0 (0.0%) | 0 (0.0%) |
| $1,000,000 or more | 24 (0.8%) | 14 (0.2%) |
| Total | 2,860 (100.0%) | 7,207 (100.0%) |
Household Income by Mortgage Status in Greer
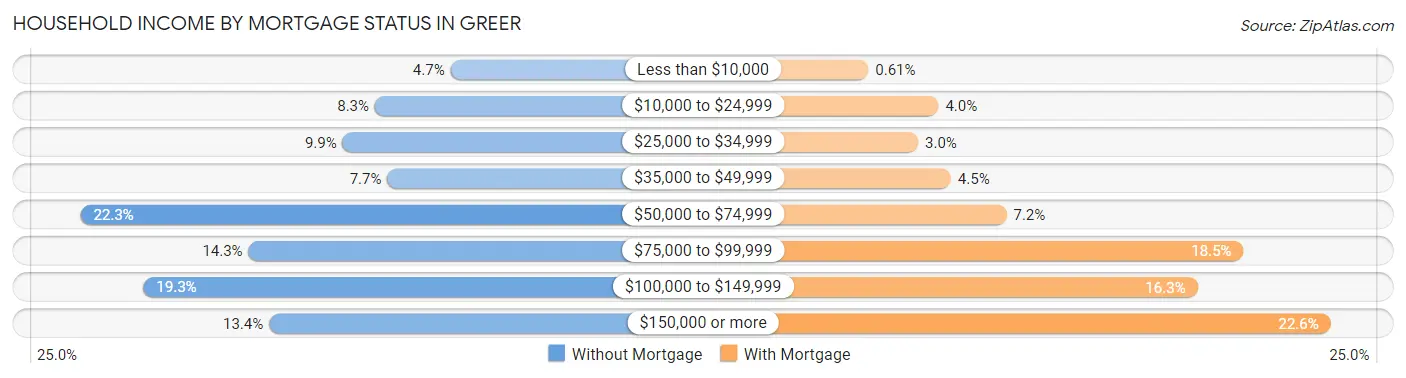
| Household Income | Without Mortgage | With Mortgage |
| Less than $10,000 | 135 (4.7%) | 44 (0.6%) |
| $10,000 to $24,999 | 238 (8.3%) | 285 (4.0%) |
| $25,000 to $34,999 | 282 (9.9%) | 215 (3.0%) |
| $35,000 to $49,999 | 221 (7.7%) | 327 (4.5%) |
| $50,000 to $74,999 | 639 (22.3%) | 518 (7.2%) |
| $75,000 to $99,999 | 410 (14.3%) | 1,331 (18.5%) |
| $100,000 to $149,999 | 553 (19.3%) | 1,173 (16.3%) |
| $150,000 or more | 382 (13.4%) | 1,630 (22.6%) |
| Total | 2,860 (100.0%) | 7,207 (100.0%) |
Property Value to Household Income Ratio in Greer
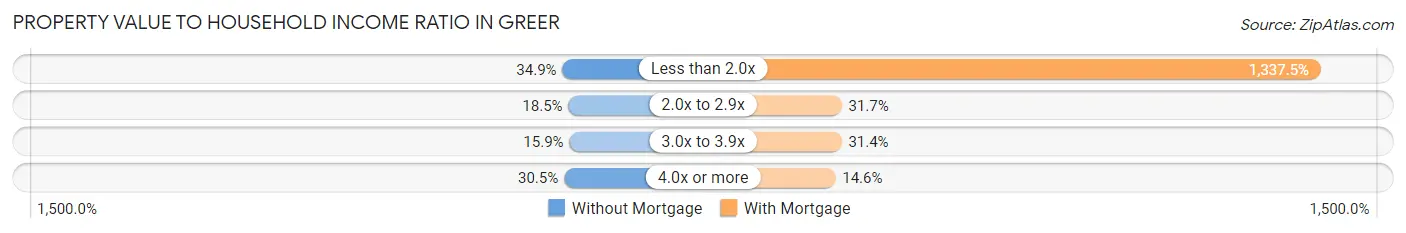
| Value-to-Income Ratio | Without Mortgage | With Mortgage |
| Less than 2.0x | 997 (34.9%) | 96,391 (1,337.5%) |
| 2.0x to 2.9x | 530 (18.5%) | 2,287 (31.7%) |
| 3.0x to 3.9x | 454 (15.9%) | 2,261 (31.4%) |
| 4.0x or more | 871 (30.4%) | 1,051 (14.6%) |
| Total | 2,860 (100.0%) | 7,207 (100.0%) |
Real Estate Taxes by Mortgage Status in Greer
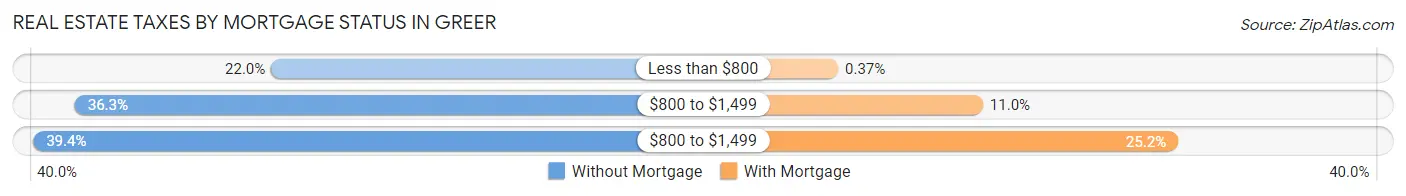
| Property Taxes | Without Mortgage | With Mortgage |
| Less than $800 | 629 (22.0%) | 27 (0.4%) |
| $800 to $1,499 | 1,039 (36.3%) | 789 (11.0%) |
| $800 to $1,499 | 1,126 (39.4%) | 1,817 (25.2%) |
| Total | 2,860 (100.0%) | 7,207 (100.0%) |
Health & Disability in Greer
Health Insurance Coverage by Age in Greer
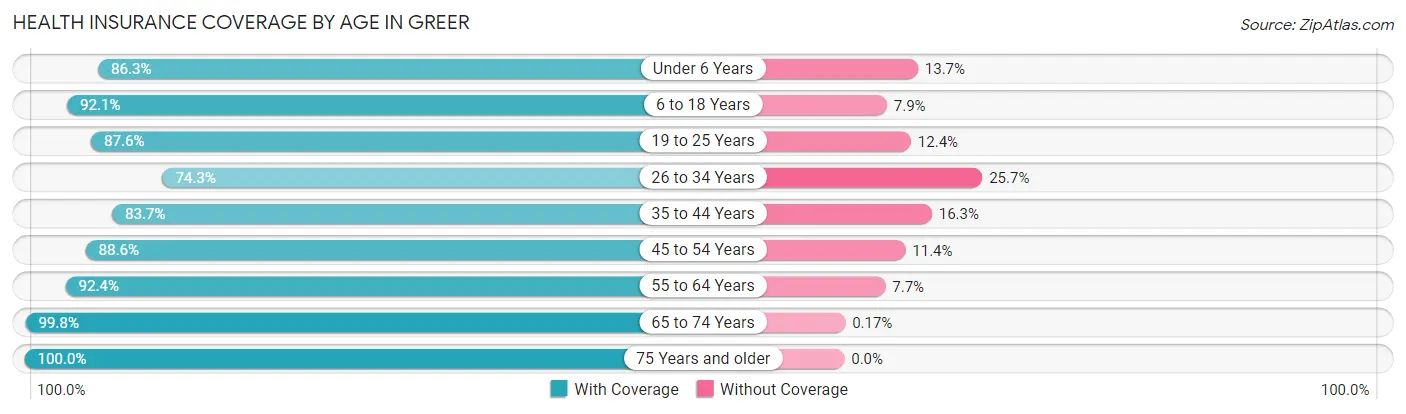
| Age Bracket | With Coverage | Without Coverage |
| Under 6 Years | 2,703 (86.3%) | 430 (13.7%) |
| 6 to 18 Years | 6,823 (92.1%) | 588 (7.9%) |
| 19 to 25 Years | 2,116 (87.6%) | 300 (12.4%) |
| 26 to 34 Years | 4,321 (74.3%) | 1,496 (25.7%) |
| 35 to 44 Years | 4,252 (83.7%) | 829 (16.3%) |
| 45 to 54 Years | 4,480 (88.6%) | 576 (11.4%) |
| 55 to 64 Years | 3,053 (92.3%) | 253 (7.6%) |
| 65 to 74 Years | 2,966 (99.8%) | 5 (0.2%) |
| 75 Years and older | 1,565 (100.0%) | 0 (0.0%) |
| Total | 32,279 (87.8%) | 4,477 (12.2%) |
Health Insurance Coverage by Citizenship Status in Greer

| Citizenship Status | With Coverage | Without Coverage |
| Native Born | 2,703 (86.3%) | 430 (13.7%) |
| Foreign Born, Citizen | 6,823 (92.1%) | 588 (7.9%) |
| Foreign Born, not a Citizen | 2,116 (87.6%) | 300 (12.4%) |
Health Insurance Coverage by Household Income in Greer
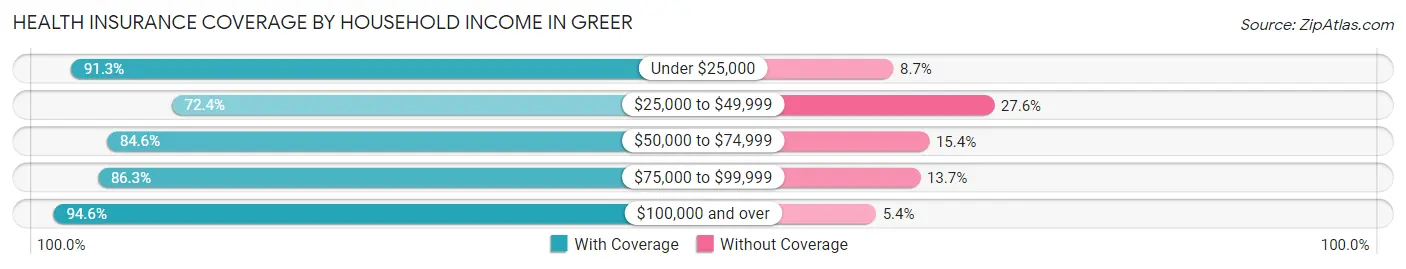
| Household Income | With Coverage | Without Coverage |
| Under $25,000 | 3,172 (91.3%) | 301 (8.7%) |
| $25,000 to $49,999 | 3,511 (72.4%) | 1,336 (27.6%) |
| $50,000 to $74,999 | 6,761 (84.6%) | 1,231 (15.4%) |
| $75,000 to $99,999 | 5,238 (86.3%) | 832 (13.7%) |
| $100,000 and over | 13,572 (94.6%) | 777 (5.4%) |
Public vs Private Health Insurance Coverage by Age in Greer
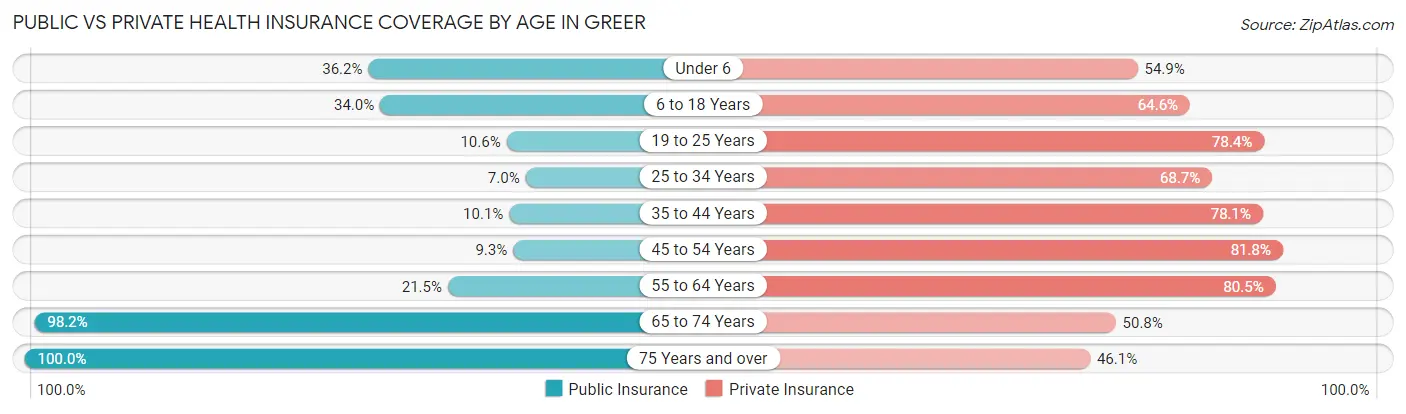
| Age Bracket | Public Insurance | Private Insurance |
| Under 6 | 1,134 (36.2%) | 1,720 (54.9%) |
| 6 to 18 Years | 2,522 (34.0%) | 4,788 (64.6%) |
| 19 to 25 Years | 255 (10.5%) | 1,894 (78.4%) |
| 25 to 34 Years | 409 (7.0%) | 3,998 (68.7%) |
| 35 to 44 Years | 511 (10.1%) | 3,970 (78.1%) |
| 45 to 54 Years | 472 (9.3%) | 4,138 (81.8%) |
| 55 to 64 Years | 709 (21.4%) | 2,661 (80.5%) |
| 65 to 74 Years | 2,917 (98.2%) | 1,510 (50.8%) |
| 75 Years and over | 1,565 (100.0%) | 721 (46.1%) |
| Total | 10,494 (28.5%) | 25,400 (69.1%) |
Disability Status by Sex by Age in Greer
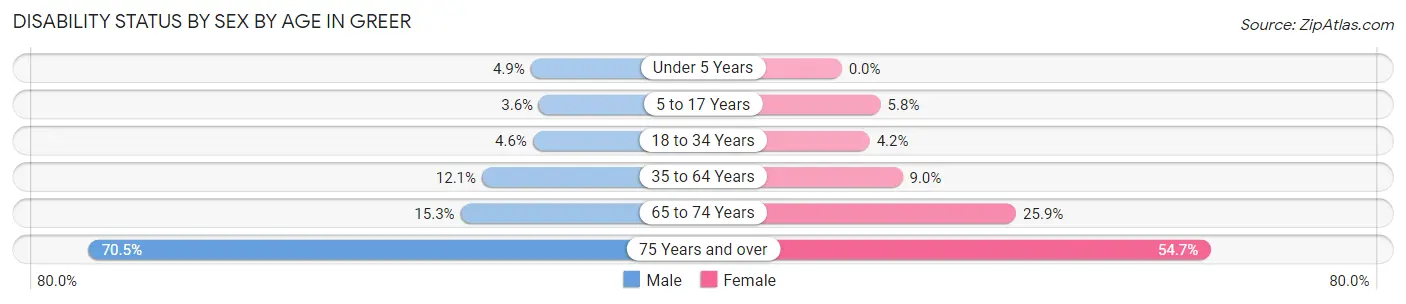
| Age Bracket | Male | Female |
| Under 5 Years | 67 (4.9%) | 0 (0.0%) |
| 5 to 17 Years | 142 (3.6%) | 200 (5.8%) |
| 18 to 34 Years | 209 (4.5%) | 173 (4.2%) |
| 35 to 64 Years | 789 (12.1%) | 624 (9.0%) |
| 65 to 74 Years | 198 (15.3%) | 434 (25.9%) |
| 75 Years and over | 358 (70.5%) | 578 (54.7%) |
Disability Class by Sex by Age in Greer
Disability Class: Hearing Difficulty
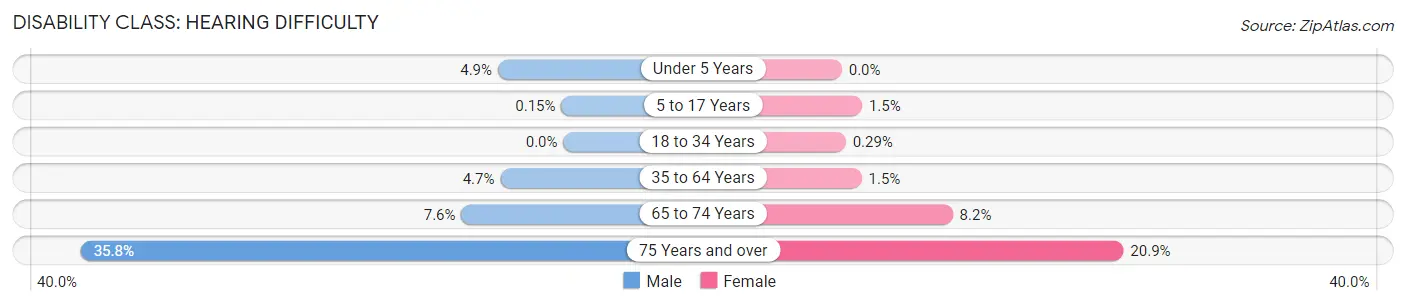
| Age Bracket | Male | Female |
| Under 5 Years | 67 (4.9%) | 0 (0.0%) |
| 5 to 17 Years | 6 (0.2%) | 52 (1.5%) |
| 18 to 34 Years | 0 (0.0%) | 12 (0.3%) |
| 35 to 64 Years | 305 (4.7%) | 102 (1.5%) |
| 65 to 74 Years | 98 (7.6%) | 138 (8.2%) |
| 75 Years and over | 182 (35.8%) | 221 (20.9%) |
Disability Class: Vision Difficulty
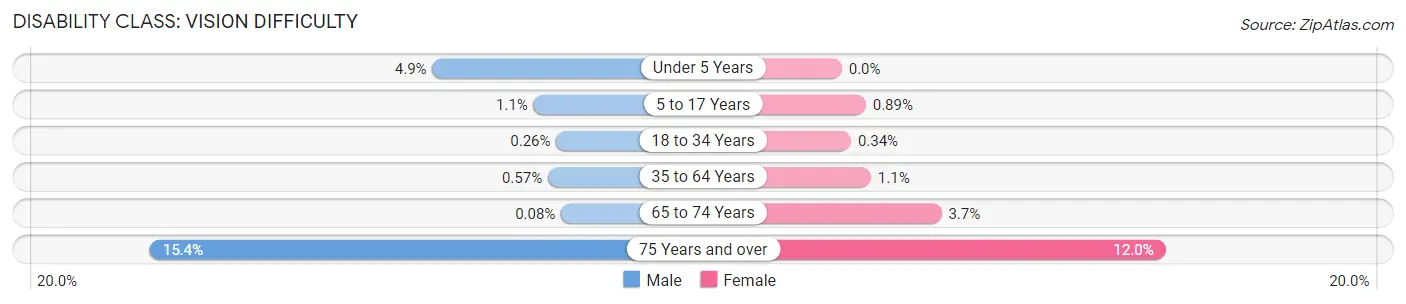
| Age Bracket | Male | Female |
| Under 5 Years | 67 (4.9%) | 0 (0.0%) |
| 5 to 17 Years | 43 (1.1%) | 31 (0.9%) |
| 18 to 34 Years | 12 (0.3%) | 14 (0.3%) |
| 35 to 64 Years | 37 (0.6%) | 75 (1.1%) |
| 65 to 74 Years | 1 (0.1%) | 62 (3.7%) |
| 75 Years and over | 78 (15.3%) | 127 (12.0%) |
Disability Class: Cognitive Difficulty
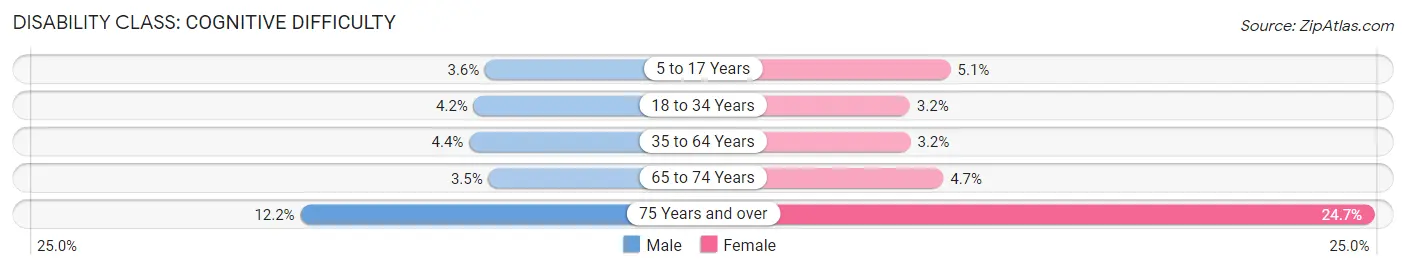
| Age Bracket | Male | Female |
| 5 to 17 Years | 142 (3.6%) | 175 (5.1%) |
| 18 to 34 Years | 191 (4.2%) | 132 (3.2%) |
| 35 to 64 Years | 285 (4.4%) | 221 (3.2%) |
| 65 to 74 Years | 45 (3.5%) | 79 (4.7%) |
| 75 Years and over | 62 (12.2%) | 261 (24.7%) |
Disability Class: Ambulatory Difficulty
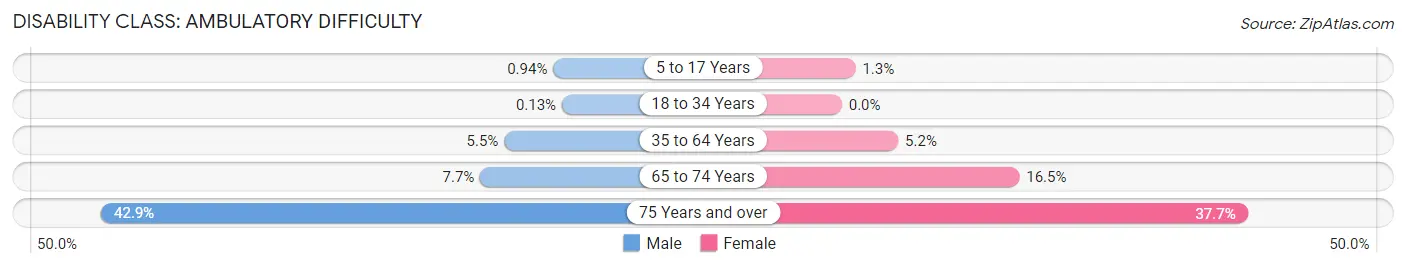
| Age Bracket | Male | Female |
| 5 to 17 Years | 37 (0.9%) | 44 (1.3%) |
| 18 to 34 Years | 6 (0.1%) | 0 (0.0%) |
| 35 to 64 Years | 358 (5.5%) | 362 (5.2%) |
| 65 to 74 Years | 100 (7.7%) | 276 (16.5%) |
| 75 Years and over | 218 (42.9%) | 398 (37.7%) |
Disability Class: Self-Care Difficulty
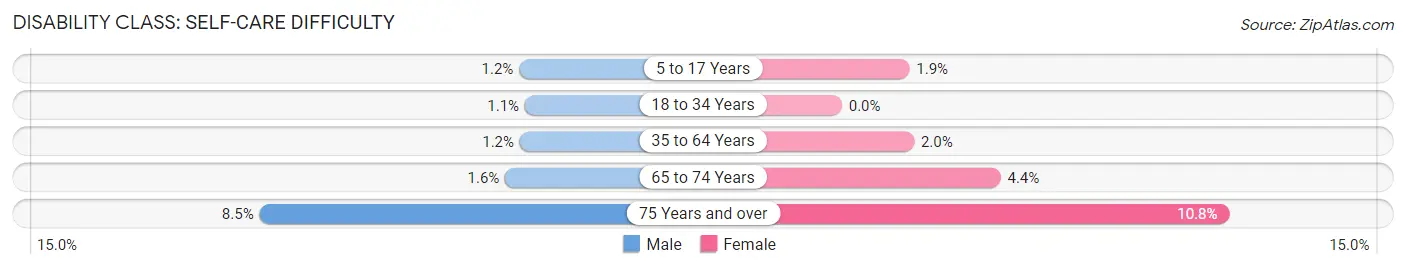
| Age Bracket | Male | Female |
| 5 to 17 Years | 48 (1.2%) | 65 (1.9%) |
| 18 to 34 Years | 49 (1.1%) | 0 (0.0%) |
| 35 to 64 Years | 79 (1.2%) | 139 (2.0%) |
| 65 to 74 Years | 21 (1.6%) | 74 (4.4%) |
| 75 Years and over | 43 (8.5%) | 114 (10.8%) |
Technology Access in Greer
Computing Device Access in Greer
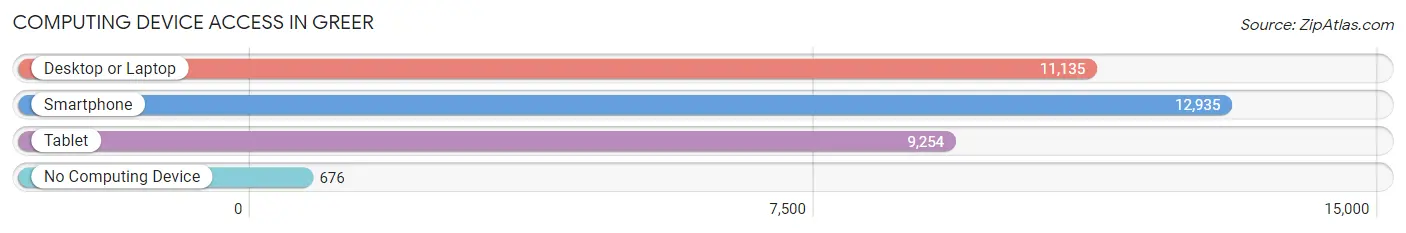
| Device Type | # Households | % Households |
| Desktop or Laptop | 11,135 | 78.5% |
| Smartphone | 12,935 | 91.2% |
| Tablet | 9,254 | 65.3% |
| No Computing Device | 676 | 4.8% |
| Total | 14,177 | 100.0% |
Internet Access in Greer
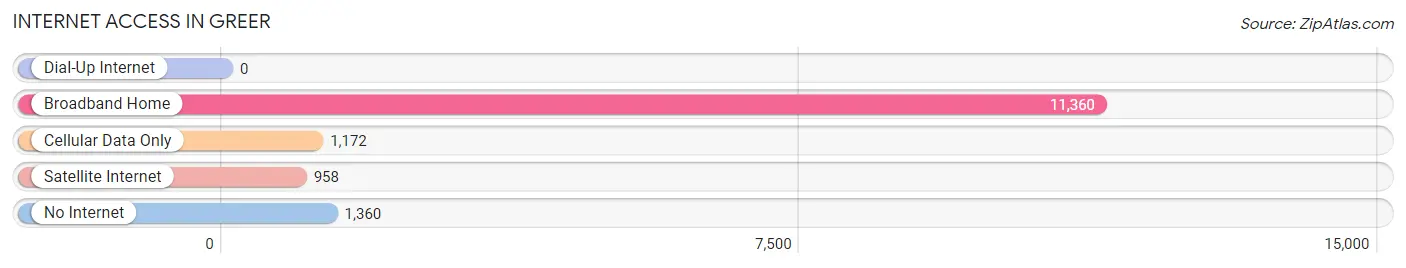
| Internet Type | # Households | % Households |
| Dial-Up Internet | 0 | 0.0% |
| Broadband Home | 11,360 | 80.1% |
| Cellular Data Only | 1,172 | 8.3% |
| Satellite Internet | 958 | 6.8% |
| No Internet | 1,360 | 9.6% |
| Total | 14,177 | 100.0% |
Greer Summary
Greer, South Carolina is a city located in Greenville County, South Carolina. It is situated along the banks of the Reedy River and is part of the Greenville-Spartanburg-Anderson Combined Statistical Area. The city has a population of 25,515 as of the 2010 census, making it the third-largest city in Greenville County.
History
The area that is now Greer was first settled in the late 1700s by European settlers. The city was originally known as “Greers” after the family of James Greer, who settled in the area in 1798. The city was officially incorporated in 1876 and was named Greer in honor of the Greer family.
In the late 1800s, Greer became a major hub for the textile industry. The city was home to several cotton mills, which provided jobs for many of the city’s residents. The city also became a major railroad hub, with several lines running through the city.
In the early 1900s, Greer experienced a period of growth and development. The city was home to several schools, churches, and businesses. The city also became a popular tourist destination, with many visitors coming to enjoy the city’s natural beauty.
Geography
Greer is located in the foothills of the Blue Ridge Mountains in northwestern South Carolina. The city is situated along the banks of the Reedy River and is part of the Greenville-Spartanburg-Anderson Combined Statistical Area. The city has a total area of 16.2 square miles, of which 16.1 square miles is land and 0.1 square miles is water.
Economy
The economy of Greer is largely based on the manufacturing and service industries. The city is home to several major employers, including BMW Manufacturing, Michelin North America, and Fluor Corporation. The city is also home to several smaller businesses, including restaurants, retail stores, and professional services.
Demographics
As of the 2010 census, Greer had a population of 25,515. The racial makeup of the city was 79.2% White, 14.3% African American, 0.3% Native American, 2.2% Asian, 0.1% Pacific Islander, 1.7% from other races, and 2.4% from two or more races. Hispanic or Latino of any race were 4.2% of the population.
The median income for a household in Greer was $45,945, and the median income for a family was $54,945. The per capita income for the city was $25,945. About 11.2% of families and 14.2% of the population were below the poverty line, including 19.2% of those under age 18 and 8.2% of those age 65 or over.
Common Questions
What is Per Capita Income in Greer?
Per Capita income in Greer is $37,238.
What is the Median Family Income in Greer?
Median Family Income in Greer is $86,944.
What is the Median Household income in Greer?
Median Household Income in Greer is $73,534.
What is Income or Wage Gap in Greer?
Income or Wage Gap in Greer is 27.7%.
Women in Greer earn 72.3 cents for every dollar earned by a man.
What is Family Income Deficit in Greer?
Family Income Deficit in Greer is $11,132.
Families that are below poverty line in Greer earn $11,132 less on average than the poverty threshold level.
What is Inequality or Gini Index in Greer?
Inequality or Gini Index in Greer is 0.44.
What is the Total Population of Greer?
Total Population of Greer is 37,010.
What is the Total Male Population of Greer?
Total Male Population of Greer is 18,340.
What is the Total Female Population of Greer?
Total Female Population of Greer is 18,670.
What is the Ratio of Males per 100 Females in Greer?
There are 98.23 Males per 100 Females in Greer.
What is the Ratio of Females per 100 Males in Greer?
There are 101.80 Females per 100 Males in Greer.
What is the Median Population Age in Greer?
Median Population Age in Greer is 34.6 Years.
What is the Average Family Size in Greer
Average Family Size in Greer is 3.2 People.
What is the Average Household Size in Greer
Average Household Size in Greer is 2.6 People.
How Large is the Labor Force in Greer?
There are 19,226 People in the Labor Forcein in Greer.
What is the Percentage of People in the Labor Force in Greer?
68.4% of People are in the Labor Force in Greer.
What is the Unemployment Rate in Greer?
Unemployment Rate in Greer is 3.5%.