Williamsburg County, SC Map & Demographics
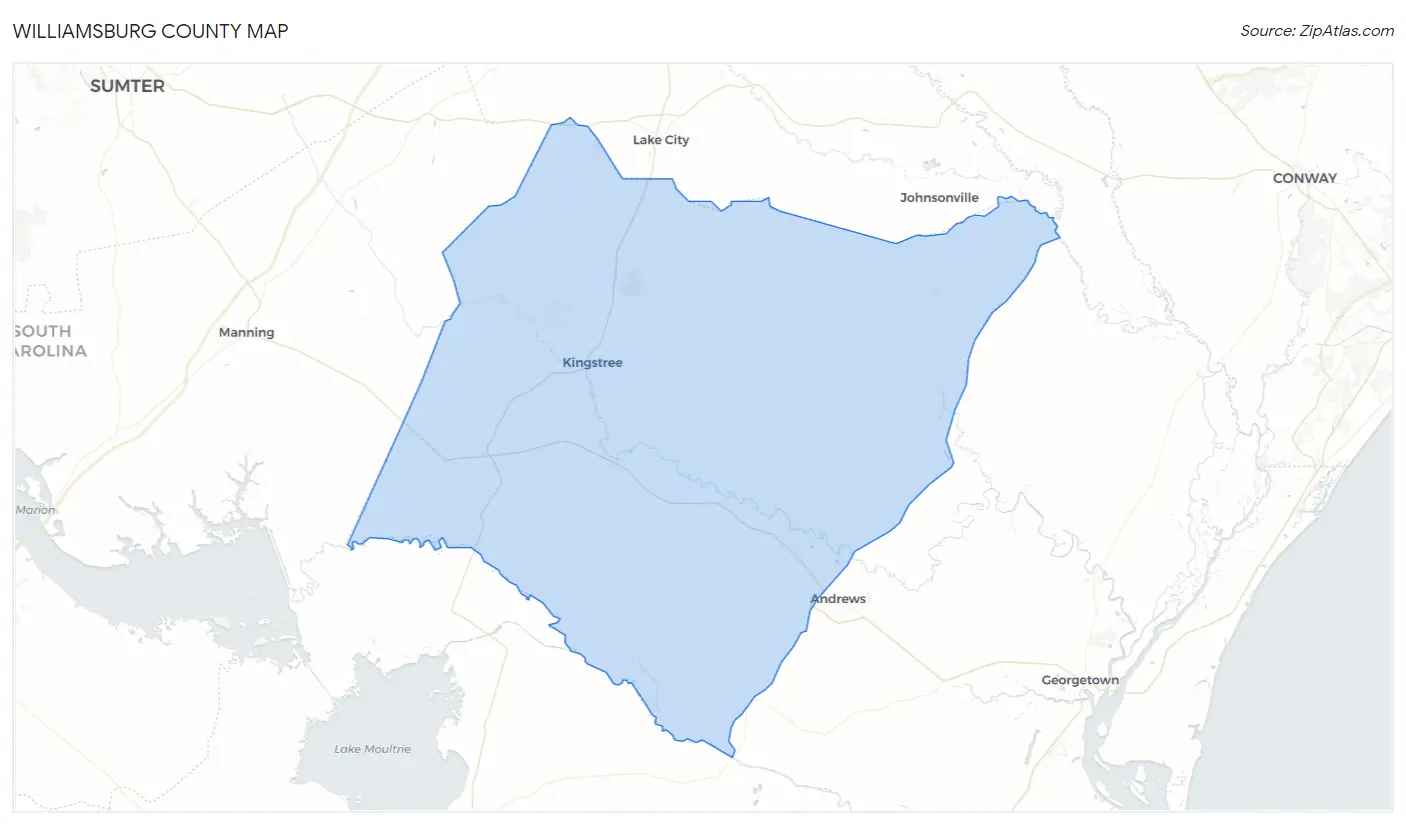
Williamsburg County Map
Williamsburg County Overview
$22,946
PER CAPITA INCOME
$55,781
AVG FAMILY INCOME
$40,848
AVG HOUSEHOLD INCOME
15.9%
WAGE / INCOME GAP [ % ]
84.1¢/ $1
WAGE / INCOME GAP [ $ ]
$10,790
FAMILY INCOME DEFICIT
0.49
INEQUALITY / GINI INDEX
30,879
TOTAL POPULATION
15,038
MALE POPULATION
15,841
FEMALE POPULATION
94.93
MALES / 100 FEMALES
105.34
FEMALES / 100 MALES
43.2
MEDIAN AGE
3.3
AVG FAMILY SIZE
2.4
AVG HOUSEHOLD SIZE
12,618
LABOR FORCE [ PEOPLE ]
49.3%
PERCENT IN LABOR FORCE
4.5%
UNEMPLOYMENT RATE
Williamsburg County Area Codes
Income in Williamsburg County
Income Overview in Williamsburg County
Per Capita Income in Williamsburg County is $22,946, while median incomes of families and households are $55,781 and $40,848 respectively.
| Characteristic | Number | Measure |
| Per Capita Income | 30,879 | $22,946 |
| Median Family Income | 7,273 | $55,781 |
| Mean Family Income | 7,273 | $70,489 |
| Median Household Income | 11,999 | $40,848 |
| Mean Household Income | 11,999 | $54,311 |
| Income Deficit | 7,273 | $10,790 |
| Wage / Income Gap (%) | 30,879 | 15.92% |
| Wage / Income Gap ($) | 30,879 | 84.08¢ per $1 |
| Gini / Inequality Index | 30,879 | 0.49 |
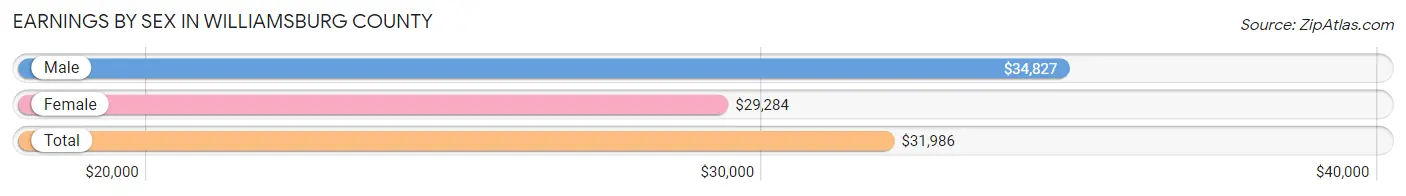
Earnings by Sex in Williamsburg County
Average Earnings in Williamsburg County are $31,986, $34,827 for men and $29,284 for women, a difference of 15.9%.
| Sex | Number | Average Earnings |
| Male | 6,460 (49.4%) | $34,827 |
| Female | 6,616 (50.6%) | $29,284 |
| Total | 13,076 (100.0%) | $31,986 |
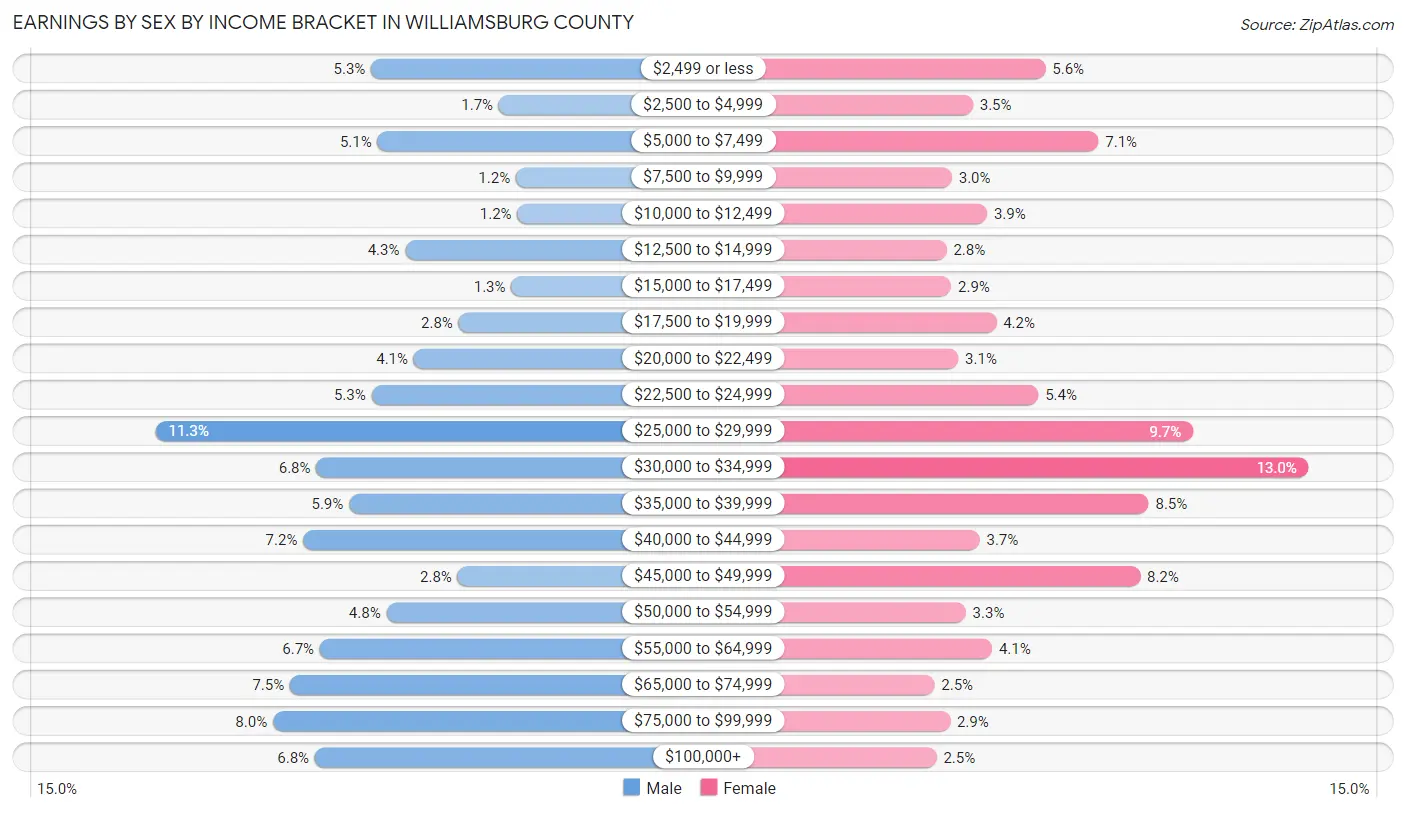
Earnings by Sex by Income Bracket in Williamsburg County
The most common earnings brackets in Williamsburg County are $25,000 to $29,999 for men (731 | 11.3%) and $30,000 to $34,999 for women (859 | 13.0%).
| Income | Male | Female |
| $2,499 or less | 340 (5.3%) | 369 (5.6%) |
| $2,500 to $4,999 | 108 (1.7%) | 234 (3.5%) |
| $5,000 to $7,499 | 328 (5.1%) | 468 (7.1%) |
| $7,500 to $9,999 | 77 (1.2%) | 195 (2.9%) |
| $10,000 to $12,499 | 74 (1.1%) | 261 (3.9%) |
| $12,500 to $14,999 | 278 (4.3%) | 185 (2.8%) |
| $15,000 to $17,499 | 85 (1.3%) | 194 (2.9%) |
| $17,500 to $19,999 | 181 (2.8%) | 278 (4.2%) |
| $20,000 to $22,499 | 262 (4.1%) | 207 (3.1%) |
| $22,500 to $24,999 | 339 (5.2%) | 356 (5.4%) |
| $25,000 to $29,999 | 731 (11.3%) | 644 (9.7%) |
| $30,000 to $34,999 | 439 (6.8%) | 859 (13.0%) |
| $35,000 to $39,999 | 380 (5.9%) | 561 (8.5%) |
| $40,000 to $44,999 | 463 (7.2%) | 247 (3.7%) |
| $45,000 to $49,999 | 183 (2.8%) | 545 (8.2%) |
| $50,000 to $54,999 | 312 (4.8%) | 221 (3.3%) |
| $55,000 to $64,999 | 433 (6.7%) | 270 (4.1%) |
| $65,000 to $74,999 | 487 (7.5%) | 163 (2.5%) |
| $75,000 to $99,999 | 518 (8.0%) | 192 (2.9%) |
| $100,000+ | 442 (6.8%) | 167 (2.5%) |
| Total | 6,460 (100.0%) | 6,616 (100.0%) |
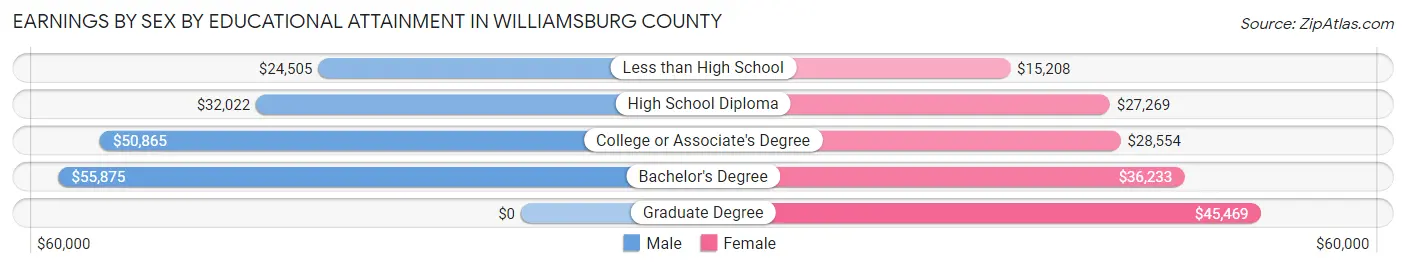
Earnings by Sex by Educational Attainment in Williamsburg County
Average earnings in Williamsburg County are $38,388 for men and $31,048 for women, a difference of 19.1%. Men with an educational attainment of bachelor's degree enjoy the highest average annual earnings of $55,875, while those with less than high school education earn the least with $24,505. Women with an educational attainment of graduate degree earn the most with the average annual earnings of $45,469, while those with less than high school education have the smallest earnings of $15,208.
| Educational Attainment | Male Income | Female Income |
| Less than High School | $24,505 | $15,208 |
| High School Diploma | $32,022 | $27,269 |
| College or Associate's Degree | $50,865 | $28,554 |
| Bachelor's Degree | $55,875 | $36,233 |
| Graduate Degree | - | - |
| Total | $38,388 | $31,048 |
Family Income in Williamsburg County
Family Income Brackets in Williamsburg County
According to the Williamsburg County family income data, there are 1,840 families falling into the $50,000 to $74,999 income range, which is the most common income bracket and makes up 25.3% of all families. Conversely, the $200,000+ income bracket is the least frequent group with only 145 families (2.0%) belonging to this category.
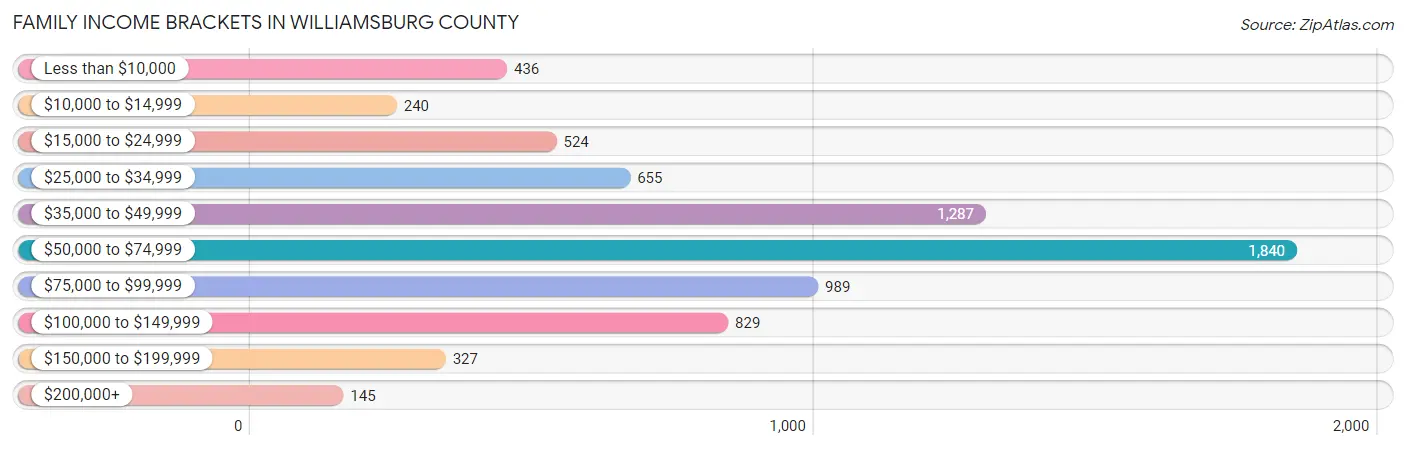
| Income Bracket | # Families | % Families |
| Less than $10,000 | 436 | 6.0% |
| $10,000 to $14,999 | 240 | 3.3% |
| $15,000 to $24,999 | 524 | 7.2% |
| $25,000 to $34,999 | 655 | 9.0% |
| $35,000 to $49,999 | 1,287 | 17.7% |
| $50,000 to $74,999 | 1,840 | 25.3% |
| $75,000 to $99,999 | 989 | 13.6% |
| $100,000 to $149,999 | 829 | 11.4% |
| $150,000 to $199,999 | 327 | 4.5% |
| $200,000+ | 145 | 2.0% |
Family Income by Famaliy Size in Williamsburg County
6-person families (207 | 2.9%) account for the highest median family income in Williamsburg County with $85,605 per family, while 2-person families (3,467 | 47.7%) have the highest median income of $23,764 per family member.
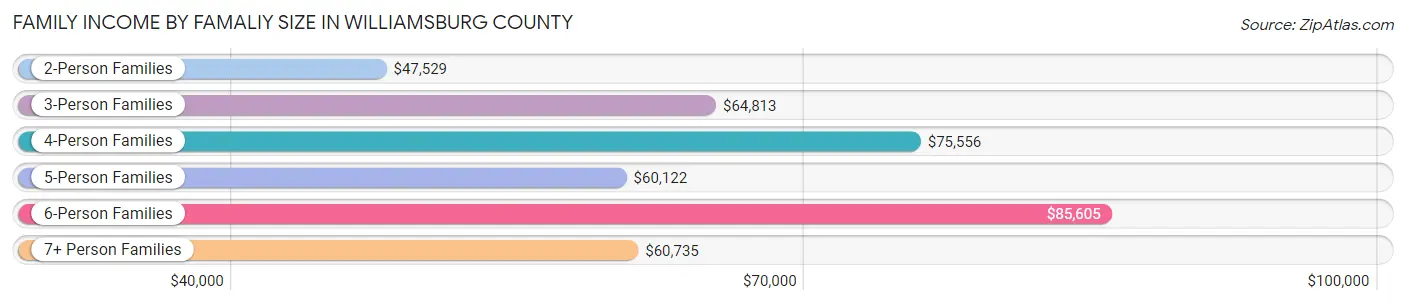
| Income Bracket | # Families | Median Income |
| 2-Person Families | 3,467 (47.7%) | $47,529 |
| 3-Person Families | 1,837 (25.3%) | $64,813 |
| 4-Person Families | 998 (13.7%) | $75,556 |
| 5-Person Families | 648 (8.9%) | $60,122 |
| 6-Person Families | 207 (2.9%) | $85,605 |
| 7+ Person Families | 116 (1.6%) | $60,735 |
| Total | 7,273 (100.0%) | $55,781 |
Family Income by Number of Earners in Williamsburg County
The median family income in Williamsburg County is $55,781, with families comprising 3+ earners (570) having the highest median family income of $95,151, while families with no earners (1,577) have the lowest median family income of $29,678, accounting for 7.8% and 21.7% of families, respectively.
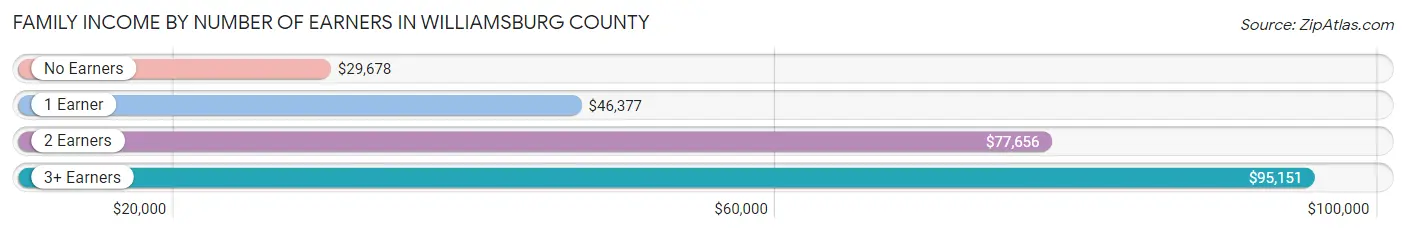
| Number of Earners | # Families | Median Income |
| No Earners | 1,577 (21.7%) | $29,678 |
| 1 Earner | 2,428 (33.4%) | $46,377 |
| 2 Earners | 2,698 (37.1%) | $77,656 |
| 3+ Earners | 570 (7.8%) | $95,151 |
| Total | 7,273 (100.0%) | $55,781 |
Household Income in Williamsburg County
Household Income Brackets in Williamsburg County
With 2,268 households falling in the category, the $50,000 to $74,999 income range is the most frequent in Williamsburg County, accounting for 18.9% of all households. In contrast, only 180 households (1.5%) fall into the $200,000+ income bracket, making it the least populous group.
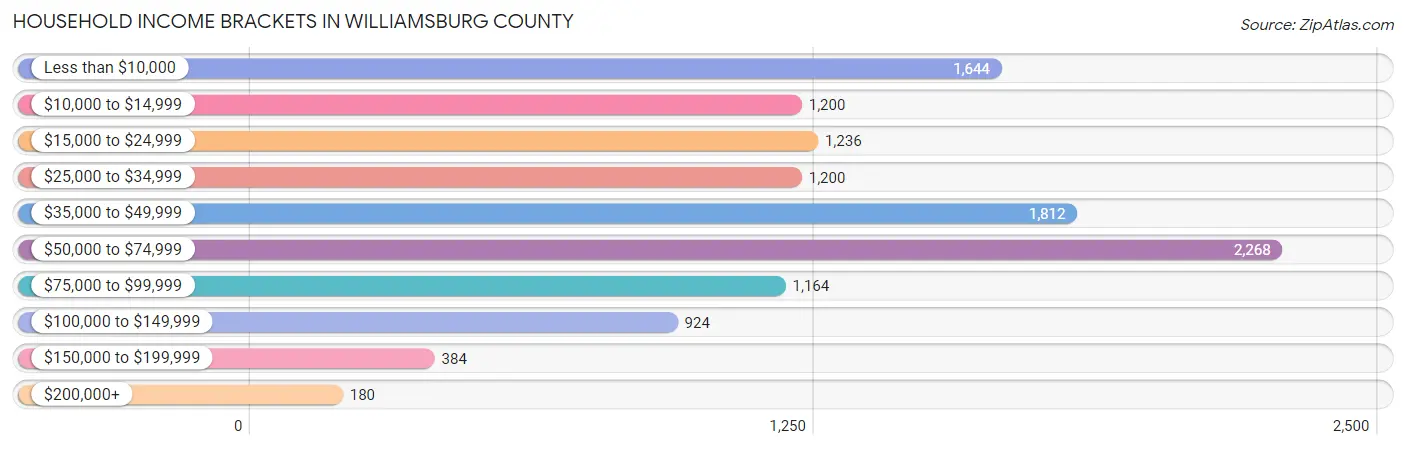
| Income Bracket | # Households | % Households |
| Less than $10,000 | 1,644 | 13.7% |
| $10,000 to $14,999 | 1,200 | 10.0% |
| $15,000 to $24,999 | 1,236 | 10.3% |
| $25,000 to $34,999 | 1,200 | 10.0% |
| $35,000 to $49,999 | 1,812 | 15.1% |
| $50,000 to $74,999 | 2,268 | 18.9% |
| $75,000 to $99,999 | 1,164 | 9.7% |
| $100,000 to $149,999 | 924 | 7.7% |
| $150,000 to $199,999 | 384 | 3.2% |
| $200,000+ | 180 | 1.5% |
Household Income by Householder Age in Williamsburg County
The median household income in Williamsburg County is $40,848, with the highest median household income of $51,867 found in the 45 to 64 years age bracket for the primary householder. A total of 4,608 households (38.4%) fall into this category. Meanwhile, the 15 to 24 years age bracket for the primary householder has the lowest median household income of $0, with 103 households (0.9%) in this group.
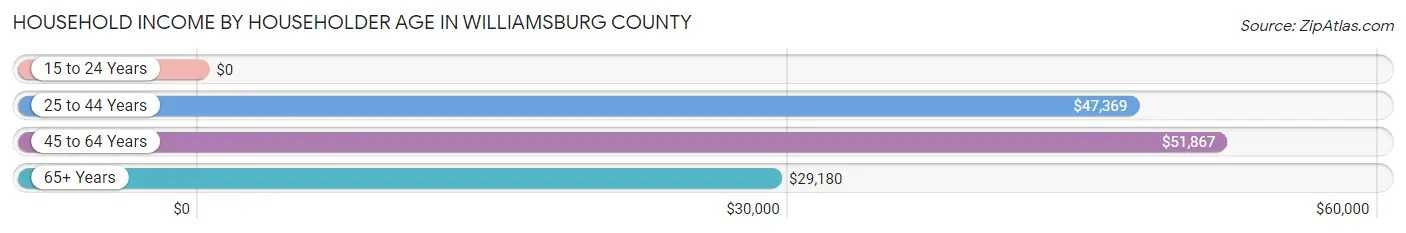
| Income Bracket | # Households | Median Income |
| 15 to 24 Years | 103 (0.9%) | $0 |
| 25 to 44 Years | 2,815 (23.5%) | $47,369 |
| 45 to 64 Years | 4,608 (38.4%) | $51,867 |
| 65+ Years | 4,473 (37.3%) | $29,180 |
| Total | 11,999 (100.0%) | $40,848 |
Poverty in Williamsburg County
Income Below Poverty by Sex and Age in Williamsburg County
With 22.2% poverty level for males and 24.7% for females among the residents of Williamsburg County, 15 year old males and 6 to 11 year old females are the most vulnerable to poverty, with 72 males (39.1%) and 360 females (38.1%) in their respective age groups living below the poverty level.
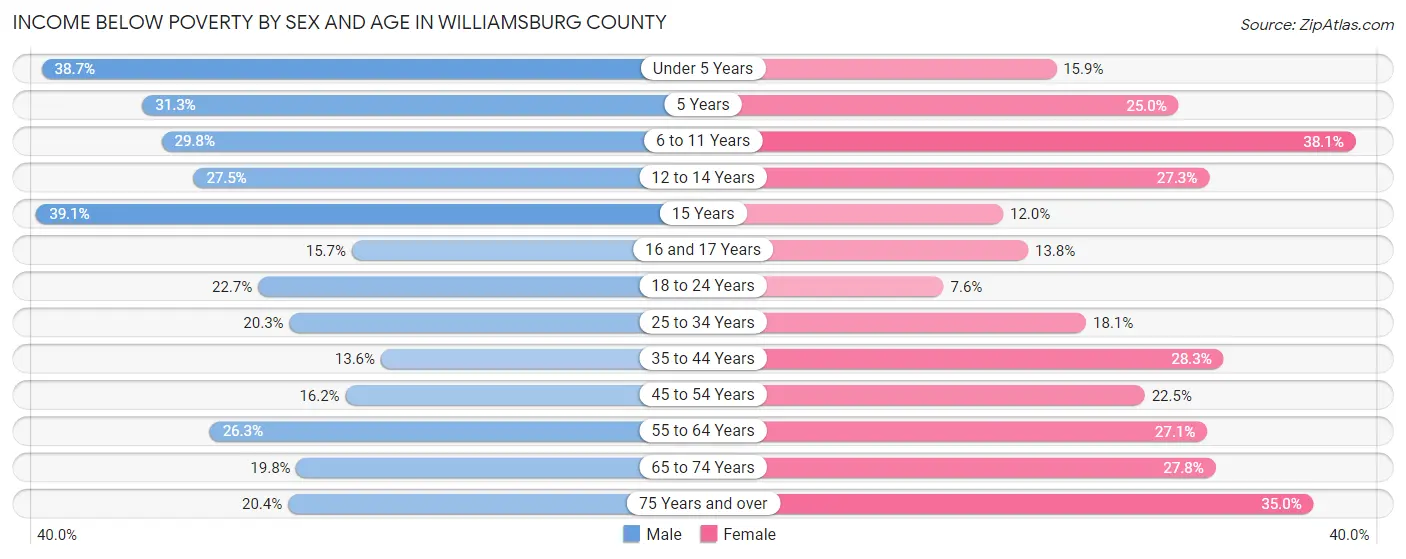
| Age Bracket | Male | Female |
| Under 5 Years | 268 (38.7%) | 114 (15.9%) |
| 5 Years | 40 (31.2%) | 53 (25.0%) |
| 6 to 11 Years | 309 (29.8%) | 360 (38.1%) |
| 12 to 14 Years | 131 (27.5%) | 135 (27.3%) |
| 15 Years | 72 (39.1%) | 37 (12.0%) |
| 16 and 17 Years | 63 (15.7%) | 48 (13.8%) |
| 18 to 24 Years | 275 (22.7%) | 88 (7.6%) |
| 25 to 34 Years | 367 (20.3%) | 299 (18.1%) |
| 35 to 44 Years | 203 (13.6%) | 475 (28.3%) |
| 45 to 54 Years | 257 (16.2%) | 444 (22.5%) |
| 55 to 64 Years | 505 (26.3%) | 666 (27.1%) |
| 65 to 74 Years | 344 (19.8%) | 614 (27.8%) |
| 75 Years and over | 195 (20.4%) | 539 (35.0%) |
| Total | 3,029 (22.2%) | 3,872 (24.7%) |
Income Above Poverty by Sex and Age in Williamsburg County
According to the poverty statistics in Williamsburg County, males aged 35 to 44 years and females aged 18 to 24 years are the age groups that are most secure financially, with 86.5% of males and 92.4% of females in these age groups living above the poverty line.
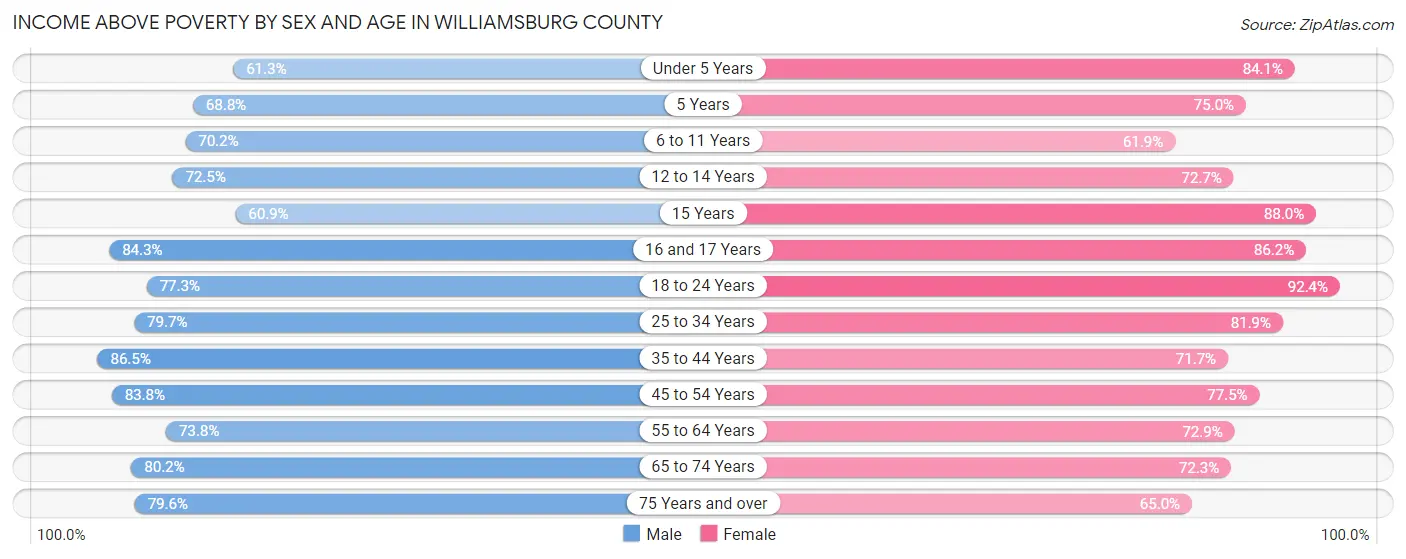
| Age Bracket | Male | Female |
| Under 5 Years | 424 (61.3%) | 602 (84.1%) |
| 5 Years | 88 (68.8%) | 159 (75.0%) |
| 6 to 11 Years | 727 (70.2%) | 584 (61.9%) |
| 12 to 14 Years | 346 (72.5%) | 360 (72.7%) |
| 15 Years | 112 (60.9%) | 272 (88.0%) |
| 16 and 17 Years | 338 (84.3%) | 299 (86.2%) |
| 18 to 24 Years | 938 (77.3%) | 1,076 (92.4%) |
| 25 to 34 Years | 1,437 (79.7%) | 1,349 (81.9%) |
| 35 to 44 Years | 1,295 (86.5%) | 1,201 (71.7%) |
| 45 to 54 Years | 1,331 (83.8%) | 1,530 (77.5%) |
| 55 to 64 Years | 1,419 (73.8%) | 1,790 (72.9%) |
| 65 to 74 Years | 1,392 (80.2%) | 1,599 (72.3%) |
| 75 Years and over | 759 (79.6%) | 1,000 (65.0%) |
| Total | 10,606 (77.8%) | 11,821 (75.3%) |
Income Below Poverty Among Married-Couple Families in Williamsburg County
The poverty statistics for married-couple families in Williamsburg County show that 10.1% or 459 of the total 4,532 families live below the poverty line. Families with no children have the highest poverty rate of 11.7%, comprising of 308 families. On the other hand, families with 5 or more children have the lowest poverty rate of 0.0%, which includes 0 families.
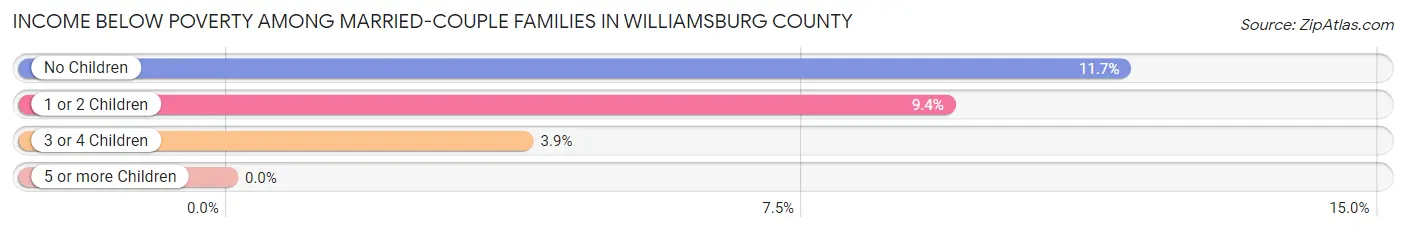
| Children | Above Poverty | Below Poverty |
| No Children | 2,333 (88.3%) | 308 (11.7%) |
| 1 or 2 Children | 1,315 (90.6%) | 136 (9.4%) |
| 3 or 4 Children | 374 (96.1%) | 15 (3.9%) |
| 5 or more Children | 51 (100.0%) | 0 (0.0%) |
| Total | 4,073 (89.9%) | 459 (10.1%) |
Income Below Poverty Among Single-Parent Households in Williamsburg County
According to the poverty data in Williamsburg County, 19.3% or 128 single-father households and 28.7% or 596 single-mother households are living below the poverty line. Among single-father households, those with 3 or 4 children have the highest poverty rate, with 13 households (30.2%) experiencing poverty. Likewise, among single-mother households, those with 3 or 4 children have the highest poverty rate, with 140 households (60.9%) falling below the poverty line.
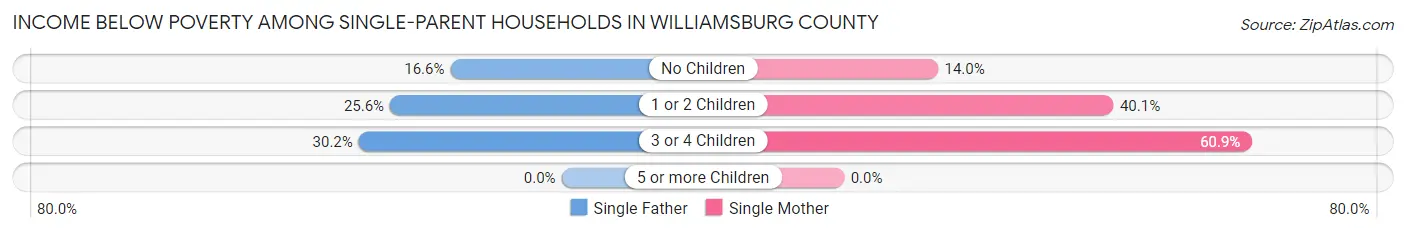
| Children | Single Father | Single Mother |
| No Children | 81 (16.6%) | 151 (14.0%) |
| 1 or 2 Children | 34 (25.6%) | 305 (40.1%) |
| 3 or 4 Children | 13 (30.2%) | 140 (60.9%) |
| 5 or more Children | 0 (0.0%) | 0 (0.0%) |
| Total | 128 (19.3%) | 596 (28.7%) |
Income Below Poverty Among Married-Couple vs Single-Parent Households in Williamsburg County
The poverty data for Williamsburg County shows that 459 of the married-couple family households (10.1%) and 724 of the single-parent households (26.4%) are living below the poverty level. Within the married-couple family households, those with no children have the highest poverty rate, with 308 households (11.7%) falling below the poverty line. Among the single-parent households, those with 3 or 4 children have the highest poverty rate, with 153 household (56.0%) living below poverty.
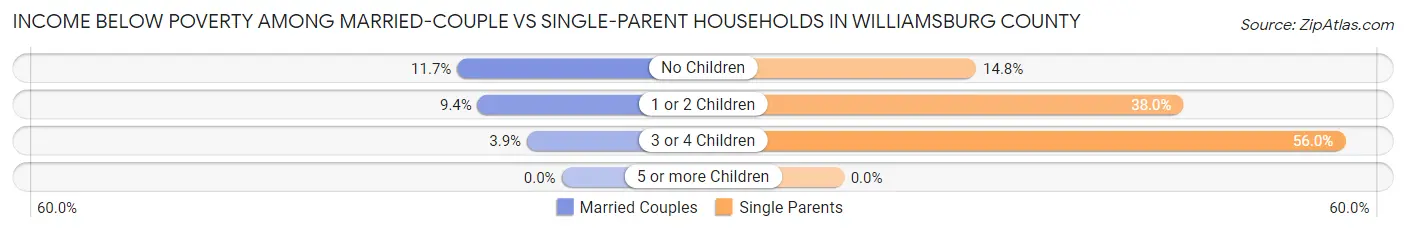
| Children | Married-Couple Families | Single-Parent Households |
| No Children | 308 (11.7%) | 232 (14.8%) |
| 1 or 2 Children | 136 (9.4%) | 339 (38.0%) |
| 3 or 4 Children | 15 (3.9%) | 153 (56.0%) |
| 5 or more Children | 0 (0.0%) | 0 (0.0%) |
| Total | 459 (10.1%) | 724 (26.4%) |
Race in Williamsburg County
The most populous races in Williamsburg County are Black / African American (19,644 | 63.6%), White / Caucasian (9,893 | 32.0%), and Hispanic or Latino (912 | 2.9%).
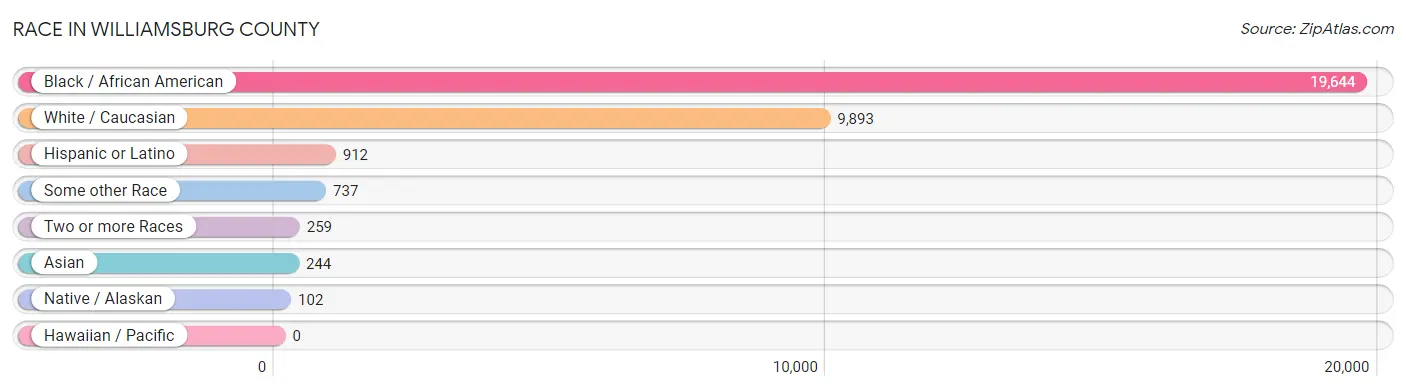
| Race | # Population | % Population |
| Asian | 244 | 0.8% |
| Black / African American | 19,644 | 63.6% |
| Hawaiian / Pacific | 0 | 0.0% |
| Hispanic or Latino | 912 | 2.9% |
| Native / Alaskan | 102 | 0.3% |
| White / Caucasian | 9,893 | 32.0% |
| Two or more Races | 259 | 0.8% |
| Some other Race | 737 | 2.4% |
| Total | 30,879 | 100.0% |
Ancestry in Williamsburg County
The most populous ancestries reported in Williamsburg County are American (2,381 | 7.7%), English (1,154 | 3.7%), Irish (819 | 2.6%), Mexican (660 | 2.1%), and Scotch-Irish (530 | 1.7%), together accounting for 18.0% of all Williamsburg County residents.
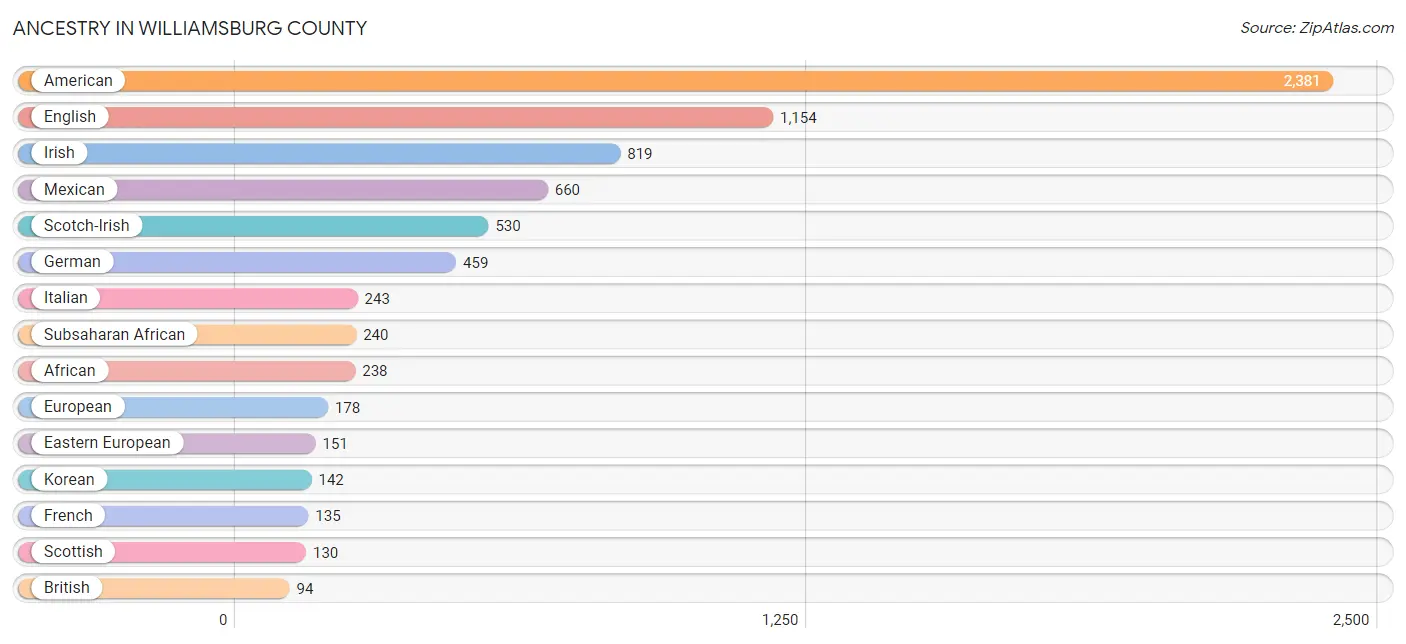
| Ancestry | # Population | % Population |
| African | 238 | 0.8% |
| American | 2,381 | 7.7% |
| Barbadian | 5 | 0.0% |
| Belizean | 21 | 0.1% |
| British | 94 | 0.3% |
| Central American Indian | 23 | 0.1% |
| Cherokee | 51 | 0.2% |
| Colombian | 19 | 0.1% |
| Dutch | 27 | 0.1% |
| Eastern European | 151 | 0.5% |
| English | 1,154 | 3.7% |
| European | 178 | 0.6% |
| French | 135 | 0.4% |
| French Canadian | 56 | 0.2% |
| German | 459 | 1.5% |
| Greek | 7 | 0.0% |
| Irish | 819 | 2.6% |
| Italian | 243 | 0.8% |
| Jamaican | 26 | 0.1% |
| Korean | 142 | 0.5% |
| Mexican | 660 | 2.1% |
| Navajo | 1 | 0.0% |
| Northern European | 12 | 0.0% |
| Norwegian | 37 | 0.1% |
| Polish | 37 | 0.1% |
| Portuguese | 12 | 0.0% |
| Puerto Rican | 42 | 0.1% |
| Scandinavian | 33 | 0.1% |
| Scotch-Irish | 530 | 1.7% |
| Scottish | 130 | 0.4% |
| Seminole | 3 | 0.0% |
| South American | 19 | 0.1% |
| Spaniard | 5 | 0.0% |
| Subsaharan African | 240 | 0.8% |
| Swedish | 51 | 0.2% |
| Thai | 82 | 0.3% |
| Trinidadian and Tobagonian | 5 | 0.0% |
| Welsh | 11 | 0.0% | View All 38 Rows |
Immigrants in Williamsburg County
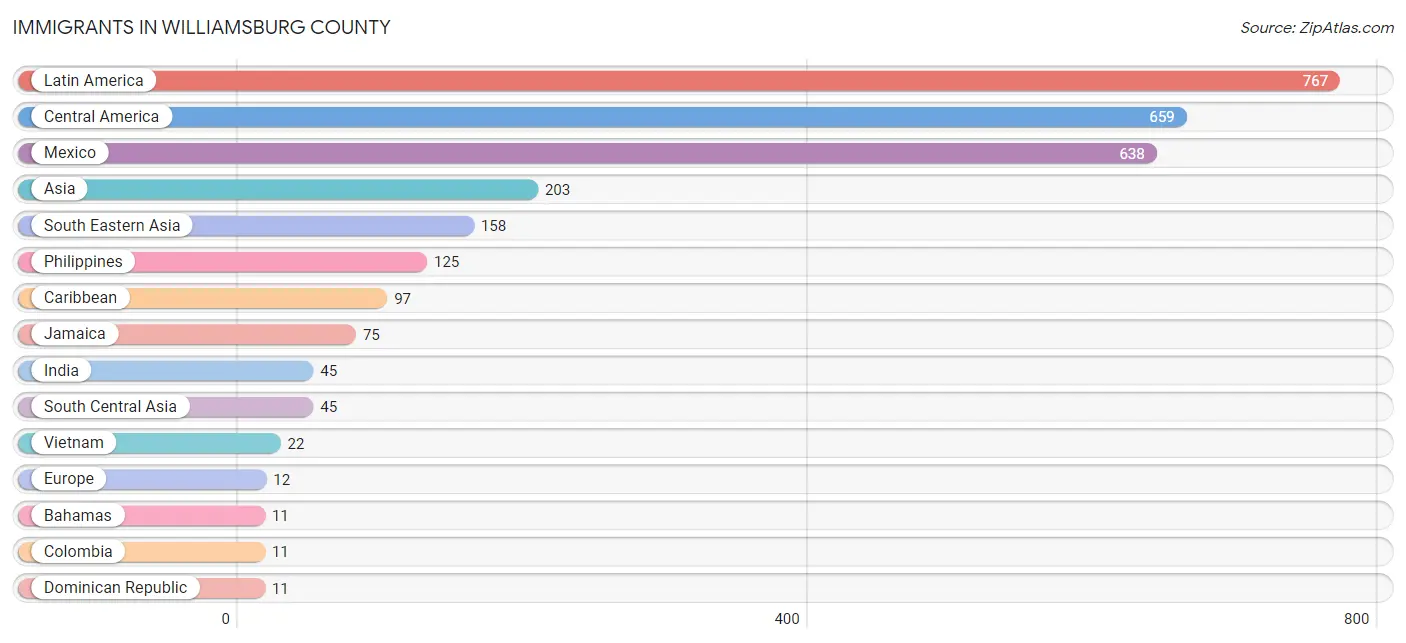
The most numerous immigrant groups reported in Williamsburg County came from Latin America (767 | 2.5%), Central America (659 | 2.1%), Mexico (638 | 2.1%), Asia (203 | 0.7%), and South Eastern Asia (158 | 0.5%), together accounting for 7.8% of all Williamsburg County residents.
| Immigration Origin | # Population | % Population |
| Africa | 2 | 0.0% |
| Asia | 203 | 0.7% |
| Bahamas | 11 | 0.0% |
| Cameroon | 2 | 0.0% |
| Canada | 10 | 0.0% |
| Caribbean | 97 | 0.3% |
| Central America | 659 | 2.1% |
| Colombia | 11 | 0.0% |
| Dominican Republic | 11 | 0.0% |
| El Salvador | 9 | 0.0% |
| England | 7 | 0.0% |
| Europe | 12 | 0.0% |
| Honduras | 9 | 0.0% |
| India | 45 | 0.2% |
| Italy | 5 | 0.0% |
| Jamaica | 75 | 0.2% |
| Latin America | 767 | 2.5% |
| Mexico | 638 | 2.1% |
| Middle Africa | 2 | 0.0% |
| Northern Europe | 7 | 0.0% |
| Philippines | 125 | 0.4% |
| South America | 11 | 0.0% |
| South Central Asia | 45 | 0.2% |
| South Eastern Asia | 158 | 0.5% |
| Southern Europe | 5 | 0.0% |
| Thailand | 11 | 0.0% |
| Vietnam | 22 | 0.1% | View All 27 Rows |
Sex and Age in Williamsburg County
Sex and Age in Williamsburg County
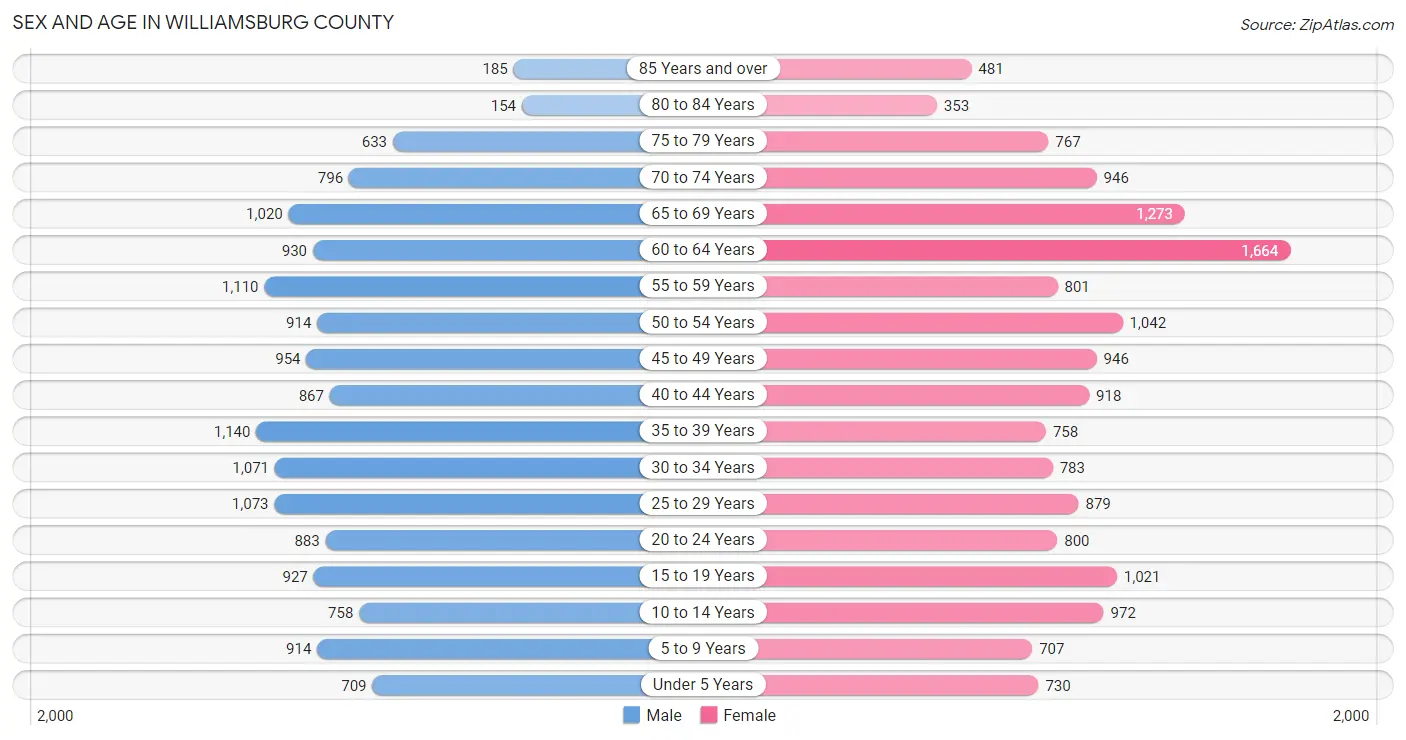
The most populous age groups in Williamsburg County are 35 to 39 Years (1,140 | 7.6%) for men and 60 to 64 Years (1,664 | 10.5%) for women.
| Age Bracket | Male | Female |
| Under 5 Years | 709 (4.7%) | 730 (4.6%) |
| 5 to 9 Years | 914 (6.1%) | 707 (4.5%) |
| 10 to 14 Years | 758 (5.0%) | 972 (6.1%) |
| 15 to 19 Years | 927 (6.2%) | 1,021 (6.5%) |
| 20 to 24 Years | 883 (5.9%) | 800 (5.1%) |
| 25 to 29 Years | 1,073 (7.1%) | 879 (5.6%) |
| 30 to 34 Years | 1,071 (7.1%) | 783 (4.9%) |
| 35 to 39 Years | 1,140 (7.6%) | 758 (4.8%) |
| 40 to 44 Years | 867 (5.8%) | 918 (5.8%) |
| 45 to 49 Years | 954 (6.3%) | 946 (6.0%) |
| 50 to 54 Years | 914 (6.1%) | 1,042 (6.6%) |
| 55 to 59 Years | 1,110 (7.4%) | 801 (5.1%) |
| 60 to 64 Years | 930 (6.2%) | 1,664 (10.5%) |
| 65 to 69 Years | 1,020 (6.8%) | 1,273 (8.0%) |
| 70 to 74 Years | 796 (5.3%) | 946 (6.0%) |
| 75 to 79 Years | 633 (4.2%) | 767 (4.8%) |
| 80 to 84 Years | 154 (1.0%) | 353 (2.2%) |
| 85 Years and over | 185 (1.2%) | 481 (3.0%) |
| Total | 15,038 (100.0%) | 15,841 (100.0%) |
Families and Households in Williamsburg County
Median Family Size in Williamsburg County
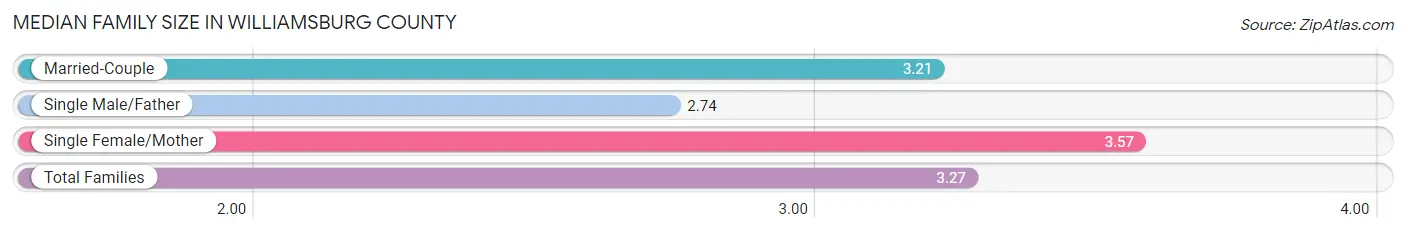
The median family size in Williamsburg County is 3.27 persons per family, with single female/mother families (2,076 | 28.5%) accounting for the largest median family size of 3.57 persons per family. On the other hand, single male/father families (665 | 9.1%) represent the smallest median family size with 2.74 persons per family.
| Family Type | # Families | Family Size |
| Married-Couple | 4,532 (62.3%) | 3.21 |
| Single Male/Father | 665 (9.1%) | 2.74 |
| Single Female/Mother | 2,076 (28.5%) | 3.57 |
| Total Families | 7,273 (100.0%) | 3.27 |
Median Household Size in Williamsburg County
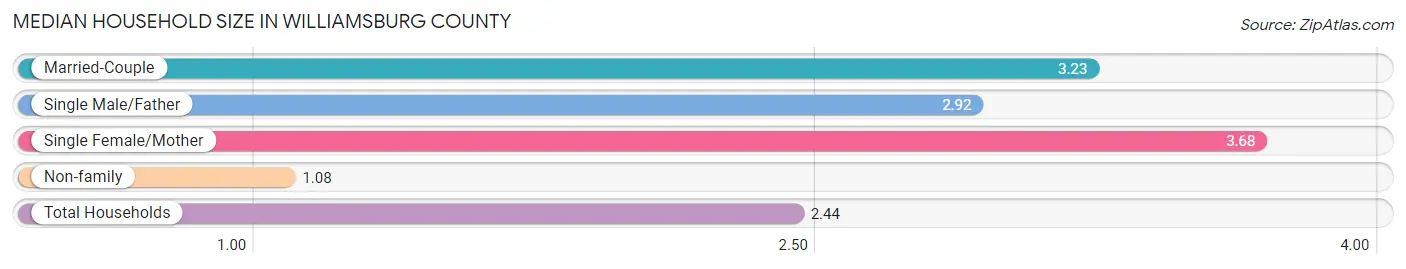
The median household size in Williamsburg County is 2.44 persons per household, with single female/mother households (2,076 | 17.3%) accounting for the largest median household size of 3.68 persons per household. non-family households (4,726 | 39.4%) represent the smallest median household size with 1.08 persons per household.
| Household Type | # Households | Household Size |
| Married-Couple | 4,532 (37.8%) | 3.23 |
| Single Male/Father | 665 (5.5%) | 2.92 |
| Single Female/Mother | 2,076 (17.3%) | 3.68 |
| Non-family | 4,726 (39.4%) | 1.08 |
| Total Households | 11,999 (100.0%) | 2.44 |
Household Size by Marriage Status in Williamsburg County
Out of a total of 11,999 households in Williamsburg County, 7,273 (60.6%) are family households, while 4,726 (39.4%) are nonfamily households. The most numerous type of family households are 2-person households, comprising 3,265, and the most common type of nonfamily households are 1-person households, comprising 4,392.
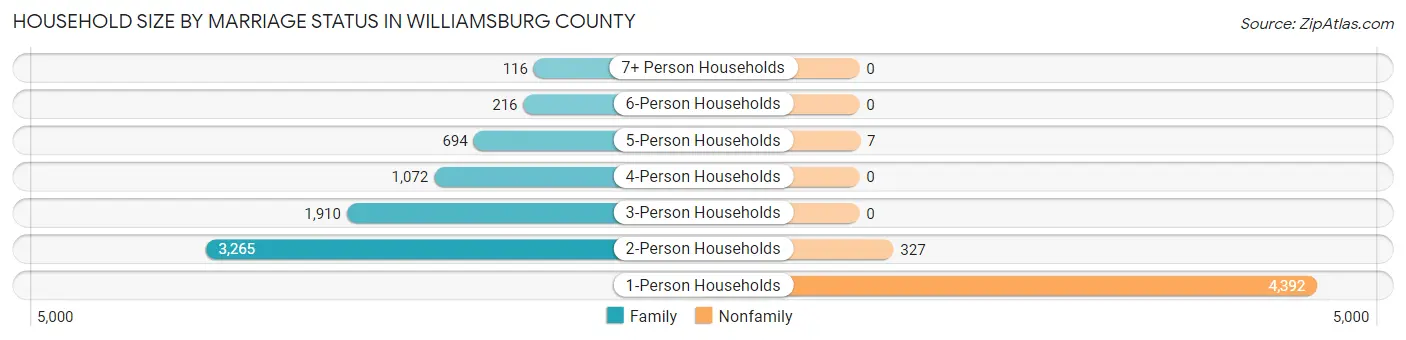
| Household Size | Family Households | Nonfamily Households |
| 1-Person Households | - | 4,392 (36.6%) |
| 2-Person Households | 3,265 (27.2%) | 327 (2.7%) |
| 3-Person Households | 1,910 (15.9%) | 0 (0.0%) |
| 4-Person Households | 1,072 (8.9%) | 0 (0.0%) |
| 5-Person Households | 694 (5.8%) | 7 (0.1%) |
| 6-Person Households | 216 (1.8%) | 0 (0.0%) |
| 7+ Person Households | 116 (1.0%) | 0 (0.0%) |
| Total | 7,273 (60.6%) | 4,726 (39.4%) |
Female Fertility in Williamsburg County
Fertility by Age in Williamsburg County
Average fertility rate in Williamsburg County is 71.0 births per 1,000 women. Women in the age bracket of 20 to 34 years have the highest fertility rate with 124.0 births per 1,000 women. Women in the age bracket of 20 to 34 years acount for 69.1% of all women with births.
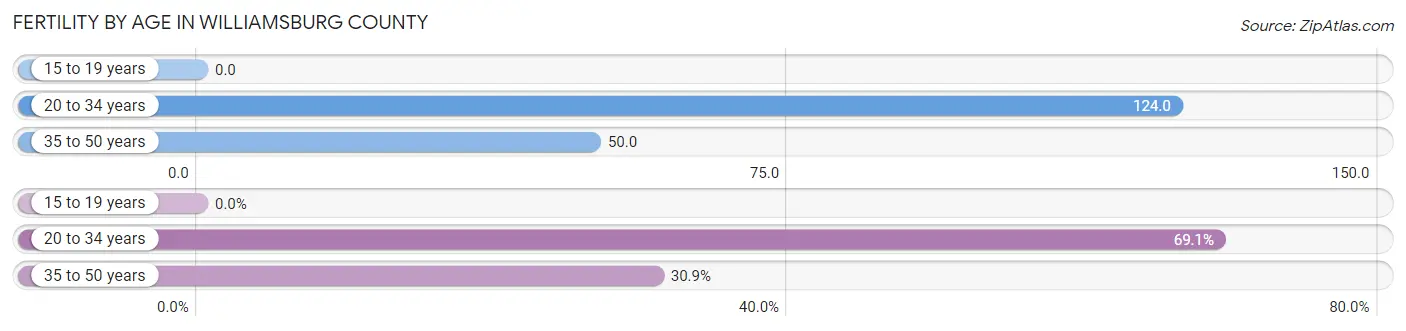
| Age Bracket | Women with Births | Births / 1,000 Women |
| 15 to 19 years | 0 (0.0%) | 0.0 |
| 20 to 34 years | 306 (69.1%) | 124.0 |
| 35 to 50 years | 137 (30.9%) | 50.0 |
| Total | 443 (100.0%) | 71.0 |
Fertility by Age by Marriage Status in Williamsburg County
52.4% of women with births (443) in Williamsburg County are married. The highest percentage of unmarried women with births falls into 20 to 34 years age bracket with 56.5% of them unmarried at the time of birth, while the lowest percentage of unmarried women with births belong to 35 to 50 years age bracket with 27.7% of them unmarried.
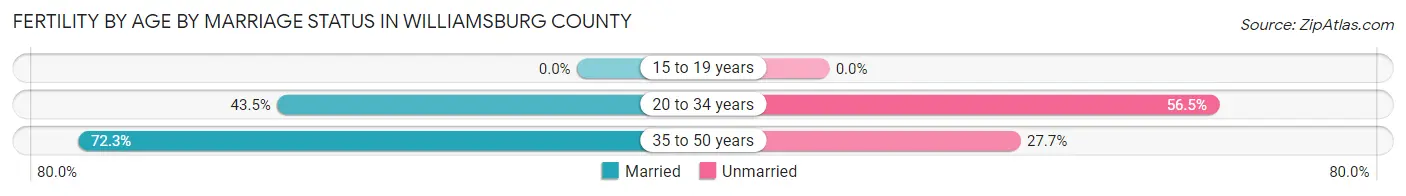
| Age Bracket | Married | Unmarried |
| 15 to 19 years | 0 (0.0%) | 0 (0.0%) |
| 20 to 34 years | 133 (43.5%) | 173 (56.5%) |
| 35 to 50 years | 99 (72.3%) | 38 (27.7%) |
| Total | 232 (52.4%) | 211 (47.6%) |
Fertility by Education in Williamsburg County
Average fertility rate in Williamsburg County is 71.0 births per 1,000 women. Women with the education attainment of bachelor's degree have the highest fertility rate of 128.0 births per 1,000 women, while women with the education attainment of less than high school have the lowest fertility at 14.0 births per 1,000 women. Women with the education attainment of high school diploma represent 42.2% of all women with births.
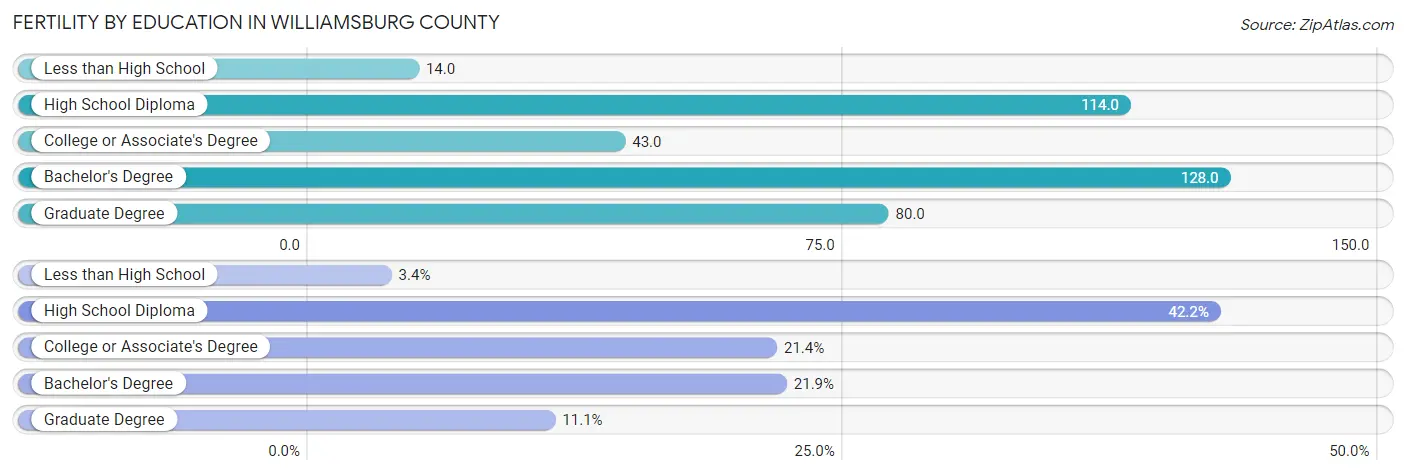
| Educational Attainment | Women with Births | Births / 1,000 Women |
| Less than High School | 15 (3.4%) | 14.0 |
| High School Diploma | 187 (42.2%) | 114.0 |
| College or Associate's Degree | 95 (21.4%) | 43.0 |
| Bachelor's Degree | 97 (21.9%) | 128.0 |
| Graduate Degree | 49 (11.1%) | 80.0 |
| Total | 443 (100.0%) | 71.0 |
Fertility by Education by Marriage Status in Williamsburg County
47.6% of women with births in Williamsburg County are unmarried. Women with the educational attainment of less than high school are most likely to be married with 100.0% of them married at childbirth, while women with the educational attainment of bachelor's degree are least likely to be married with 78.3% of them unmarried at childbirth.
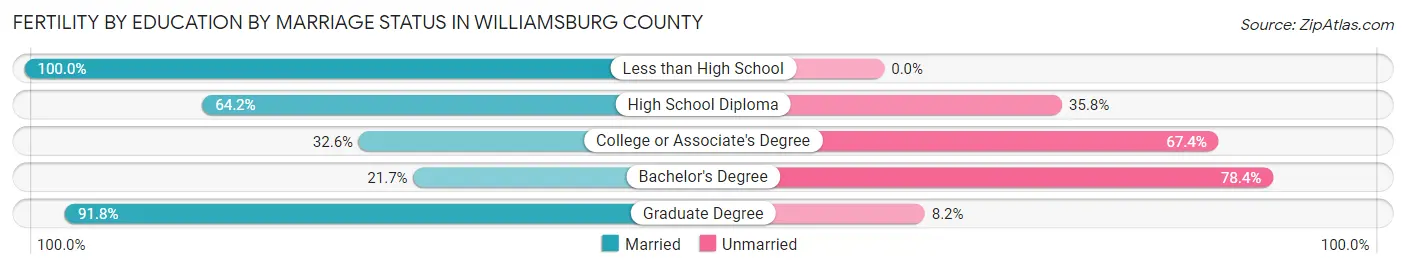
| Educational Attainment | Married | Unmarried |
| Less than High School | 15 (100.0%) | 0 (0.0%) |
| High School Diploma | 120 (64.2%) | 67 (35.8%) |
| College or Associate's Degree | 31 (32.6%) | 64 (67.4%) |
| Bachelor's Degree | 21 (21.6%) | 76 (78.3%) |
| Graduate Degree | 45 (91.8%) | 4 (8.2%) |
| Total | 232 (52.4%) | 211 (47.6%) |
Employment Characteristics in Williamsburg County
Employment by Class of Employer in Williamsburg County
Among the 11,755 employed individuals in Williamsburg County, private company employees (8,394 | 71.4%), local government employees (1,031 | 8.8%), and state government employees (919 | 7.8%) make up the most common classes of employment.
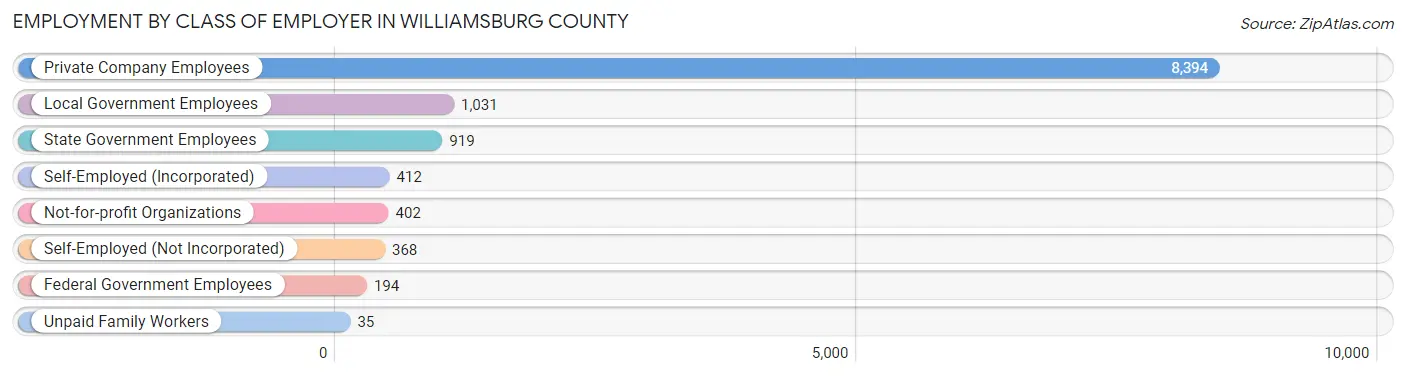
| Employer Class | # Employees | % Employees |
| Private Company Employees | 8,394 | 71.4% |
| Self-Employed (Incorporated) | 412 | 3.5% |
| Self-Employed (Not Incorporated) | 368 | 3.1% |
| Not-for-profit Organizations | 402 | 3.4% |
| Local Government Employees | 1,031 | 8.8% |
| State Government Employees | 919 | 7.8% |
| Federal Government Employees | 194 | 1.7% |
| Unpaid Family Workers | 35 | 0.3% |
| Total | 11,755 | 100.0% |
Employment Status by Age in Williamsburg County
According to the labor force statistics for Williamsburg County, out of the total population over 16 years of age (25,595), 49.3% or 12,618 individuals are in the labor force, with 4.5% or 568 of them unemployed. The age group with the highest labor force participation rate is 20 to 24 years, with 75.3% or 1,267 individuals in the labor force. Within the labor force, the 25 to 29 years age range has the highest percentage of unemployed individuals, with 11.4% or 152 of them being unemployed.
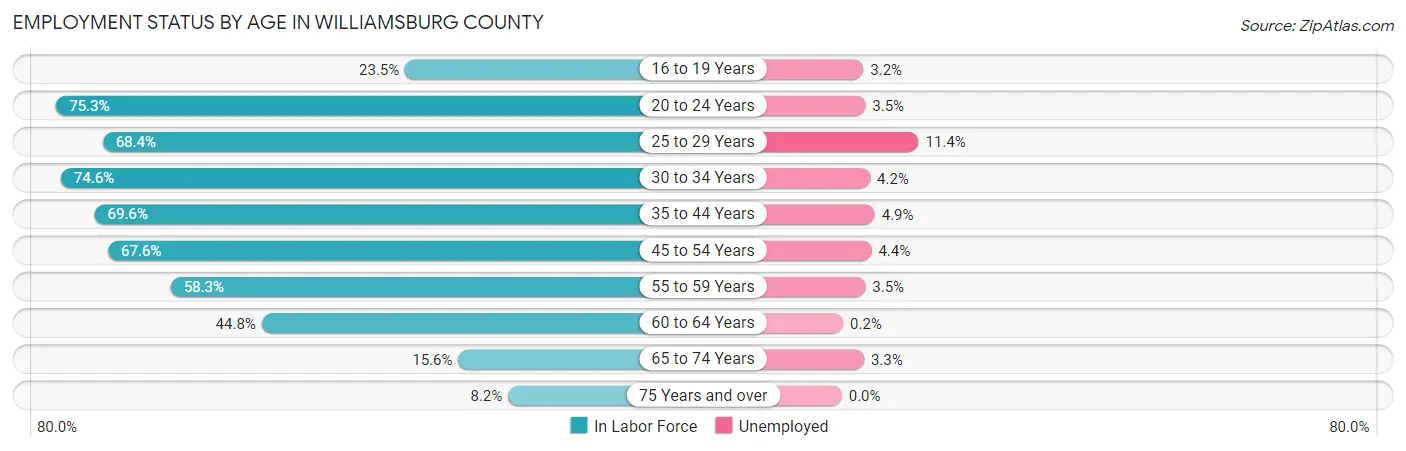
| Age Bracket | In Labor Force | Unemployed |
| 16 to 19 Years | 342 (23.5%) | 11 (3.2%) |
| 20 to 24 Years | 1,267 (75.3%) | 44 (3.5%) |
| 25 to 29 Years | 1,335 (68.4%) | 152 (11.4%) |
| 30 to 34 Years | 1,383 (74.6%) | 58 (4.2%) |
| 35 to 44 Years | 2,563 (69.6%) | 126 (4.9%) |
| 45 to 54 Years | 2,607 (67.6%) | 115 (4.4%) |
| 55 to 59 Years | 1,114 (58.3%) | 39 (3.5%) |
| 60 to 64 Years | 1,162 (44.8%) | 2 (0.2%) |
| 65 to 74 Years | 629 (15.6%) | 21 (3.3%) |
| 75 Years and over | 211 (8.2%) | 0 (0.0%) |
| Total | 12,618 (49.3%) | 568 (4.5%) |
Employment Status by Educational Attainment in Williamsburg County
According to labor force statistics for Williamsburg County, 64.2% of individuals (10,176) out of the total population between 25 and 64 years of age (15,850) are in the labor force, with 4.8% or 488 of them being unemployed. The group with the highest labor force participation rate are those with the educational attainment of bachelor's degree or higher, with 86.5% or 2,095 individuals in the labor force. Within the labor force, individuals with less than high school education have the highest percentage of unemployment, with 8.4% or 70 of them being unemployed.
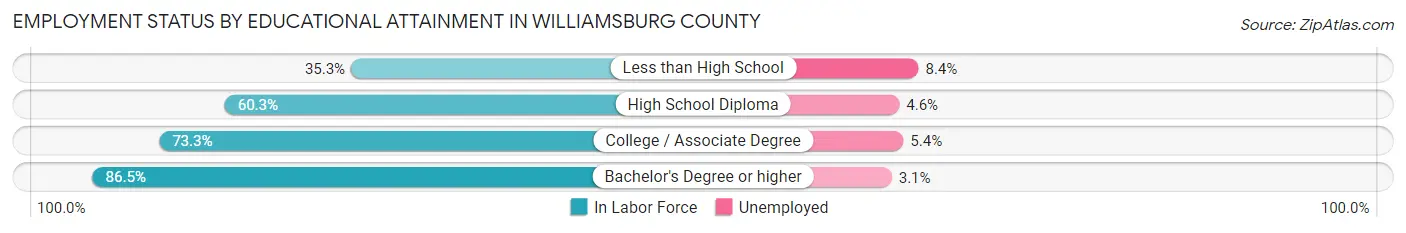
| Educational Attainment | In Labor Force | Unemployed |
| Less than High School | 829 (35.3%) | 197 (8.4%) |
| High School Diploma | 4,087 (60.3%) | 312 (4.6%) |
| College / Associate Degree | 3,154 (73.3%) | 232 (5.4%) |
| Bachelor's Degree or higher | 2,095 (86.5%) | 75 (3.1%) |
| Total | 10,176 (64.2%) | 761 (4.8%) |
Employment Occupations by Sex in Williamsburg County
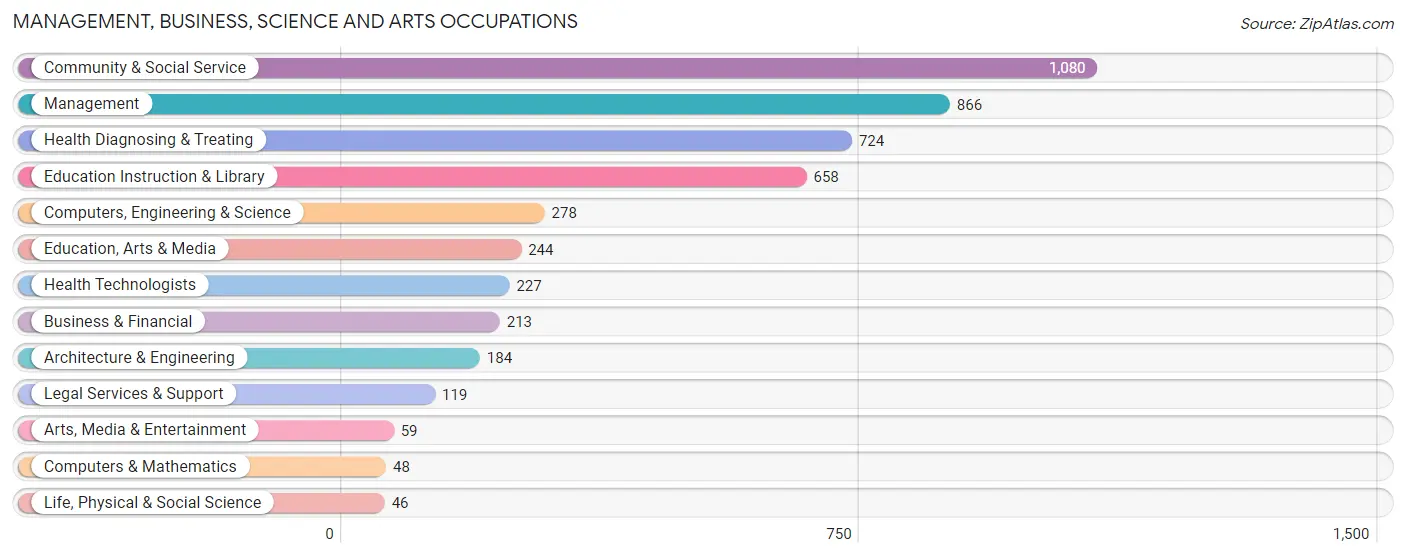
Management, Business, Science and Arts Occupations
The most common Management, Business, Science and Arts occupations in Williamsburg County are Community & Social Service (1,080 | 9.0%), Management (866 | 7.2%), Health Diagnosing & Treating (724 | 6.0%), Education Instruction & Library (658 | 5.5%), and Computers, Engineering & Science (278 | 2.3%).
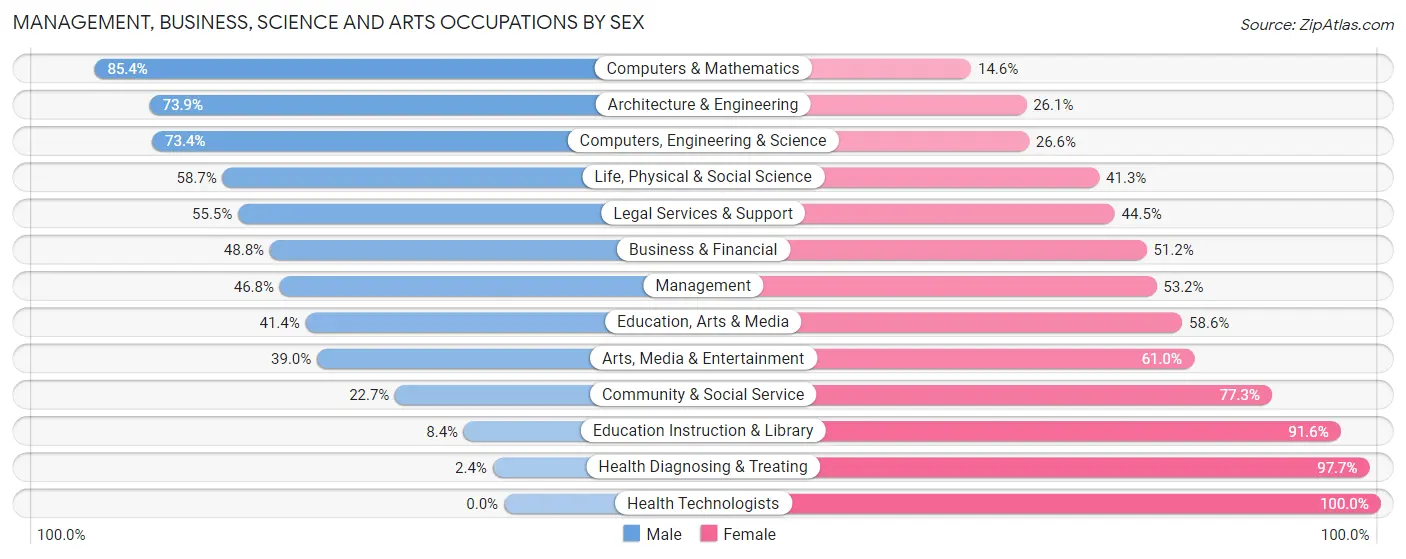
Management, Business, Science and Arts Occupations by Sex
Within the Management, Business, Science and Arts occupations in Williamsburg County, the most male-oriented occupations are Computers & Mathematics (85.4%), Architecture & Engineering (73.9%), and Computers, Engineering & Science (73.4%), while the most female-oriented occupations are Health Technologists (100.0%), Health Diagnosing & Treating (97.7%), and Education Instruction & Library (91.6%).
| Occupation | Male | Female |
| Management | 405 (46.8%) | 461 (53.2%) |
| Business & Financial | 104 (48.8%) | 109 (51.2%) |
| Computers, Engineering & Science | 204 (73.4%) | 74 (26.6%) |
| Computers & Mathematics | 41 (85.4%) | 7 (14.6%) |
| Architecture & Engineering | 136 (73.9%) | 48 (26.1%) |
| Life, Physical & Social Science | 27 (58.7%) | 19 (41.3%) |
| Community & Social Service | 245 (22.7%) | 835 (77.3%) |
| Education, Arts & Media | 101 (41.4%) | 143 (58.6%) |
| Legal Services & Support | 66 (55.5%) | 53 (44.5%) |
| Education Instruction & Library | 55 (8.4%) | 603 (91.6%) |
| Arts, Media & Entertainment | 23 (39.0%) | 36 (61.0%) |
| Health Diagnosing & Treating | 17 (2.4%) | 707 (97.7%) |
| Health Technologists | 0 (0.0%) | 227 (100.0%) |
| Total (Category) | 975 (30.8%) | 2,186 (69.2%) |
| Total (Overall) | 5,886 (48.9%) | 6,148 (51.1%) |
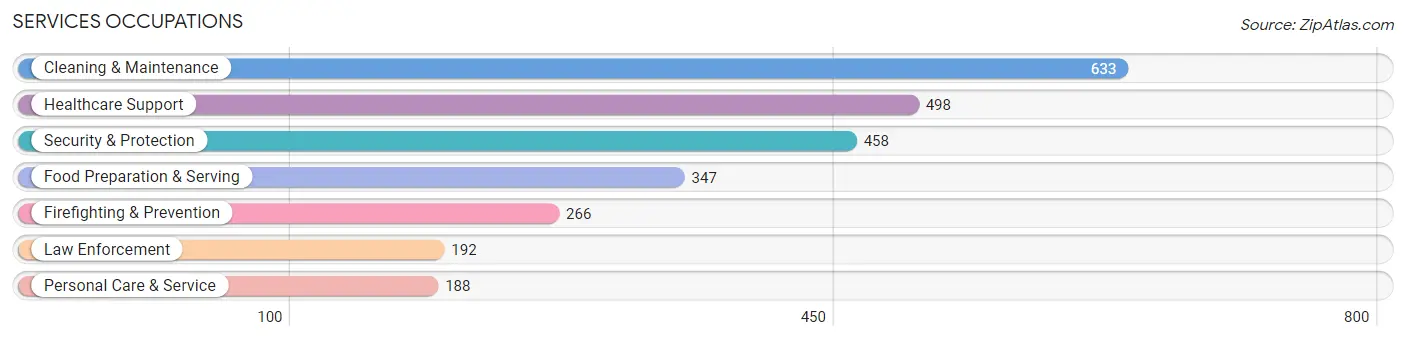
Services Occupations
The most common Services occupations in Williamsburg County are Cleaning & Maintenance (633 | 5.3%), Healthcare Support (498 | 4.1%), Security & Protection (458 | 3.8%), Food Preparation & Serving (347 | 2.9%), and Firefighting & Prevention (266 | 2.2%).
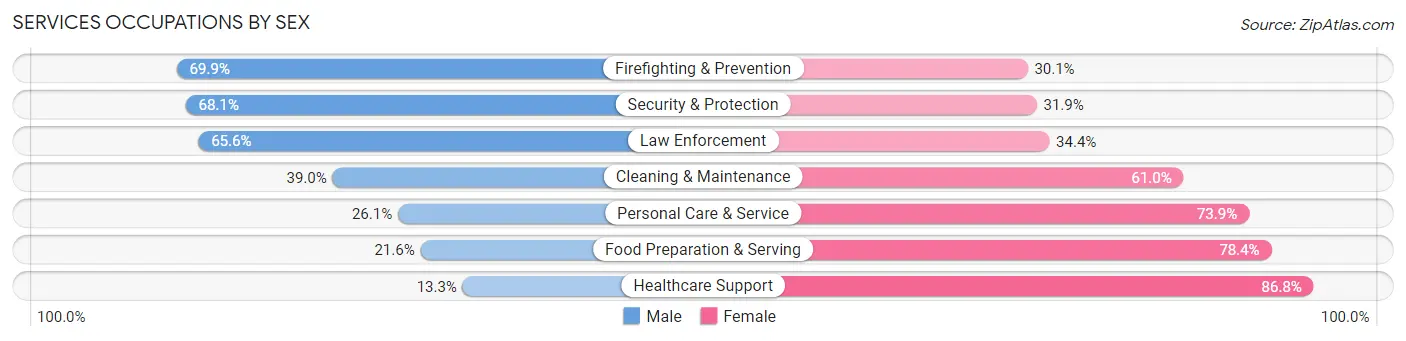
Services Occupations by Sex
Within the Services occupations in Williamsburg County, the most male-oriented occupations are Firefighting & Prevention (69.9%), Security & Protection (68.1%), and Law Enforcement (65.6%), while the most female-oriented occupations are Healthcare Support (86.8%), Food Preparation & Serving (78.4%), and Personal Care & Service (73.9%).
| Occupation | Male | Female |
| Healthcare Support | 66 (13.3%) | 432 (86.8%) |
| Security & Protection | 312 (68.1%) | 146 (31.9%) |
| Firefighting & Prevention | 186 (69.9%) | 80 (30.1%) |
| Law Enforcement | 126 (65.6%) | 66 (34.4%) |
| Food Preparation & Serving | 75 (21.6%) | 272 (78.4%) |
| Cleaning & Maintenance | 247 (39.0%) | 386 (61.0%) |
| Personal Care & Service | 49 (26.1%) | 139 (73.9%) |
| Total (Category) | 749 (35.3%) | 1,375 (64.7%) |
| Total (Overall) | 5,886 (48.9%) | 6,148 (51.1%) |
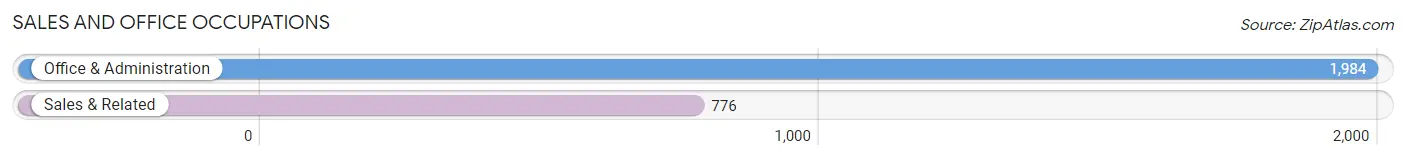
Sales and Office Occupations
The most common Sales and Office occupations in Williamsburg County are Office & Administration (1,984 | 16.5%), and Sales & Related (776 | 6.5%).
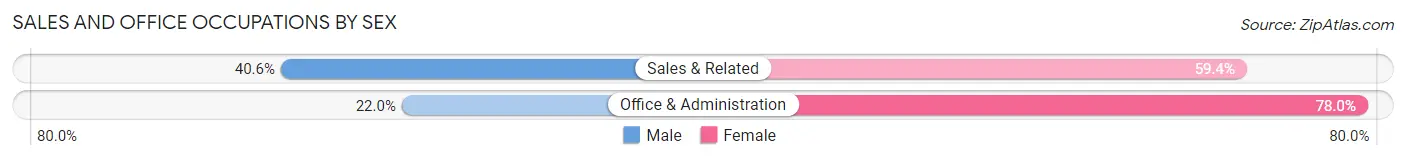
Sales and Office Occupations by Sex
| Occupation | Male | Female |
| Sales & Related | 315 (40.6%) | 461 (59.4%) |
| Office & Administration | 436 (22.0%) | 1,548 (78.0%) |
| Total (Category) | 751 (27.2%) | 2,009 (72.8%) |
| Total (Overall) | 5,886 (48.9%) | 6,148 (51.1%) |
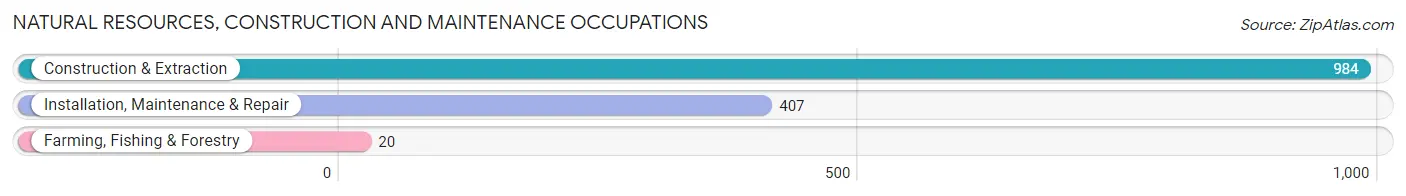
Natural Resources, Construction and Maintenance Occupations
The most common Natural Resources, Construction and Maintenance occupations in Williamsburg County are Construction & Extraction (984 | 8.2%), Installation, Maintenance & Repair (407 | 3.4%), and Farming, Fishing & Forestry (20 | 0.2%).
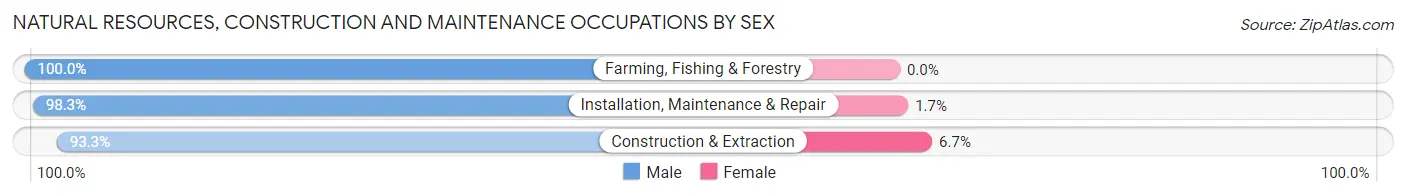
Natural Resources, Construction and Maintenance Occupations by Sex
| Occupation | Male | Female |
| Farming, Fishing & Forestry | 20 (100.0%) | 0 (0.0%) |
| Construction & Extraction | 918 (93.3%) | 66 (6.7%) |
| Installation, Maintenance & Repair | 400 (98.3%) | 7 (1.7%) |
| Total (Category) | 1,338 (94.8%) | 73 (5.2%) |
| Total (Overall) | 5,886 (48.9%) | 6,148 (51.1%) |
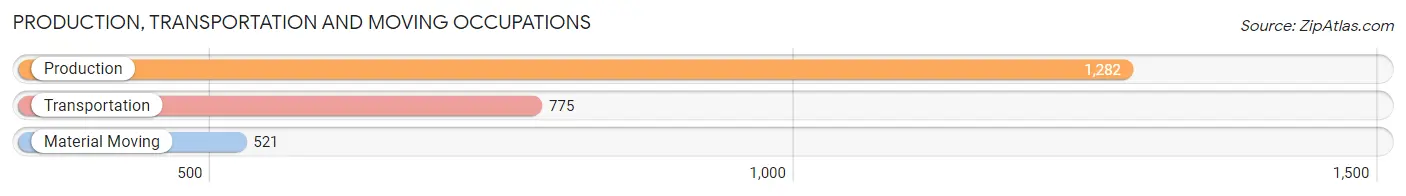
Production, Transportation and Moving Occupations
The most common Production, Transportation and Moving occupations in Williamsburg County are Production (1,282 | 10.6%), Transportation (775 | 6.4%), and Material Moving (521 | 4.3%).
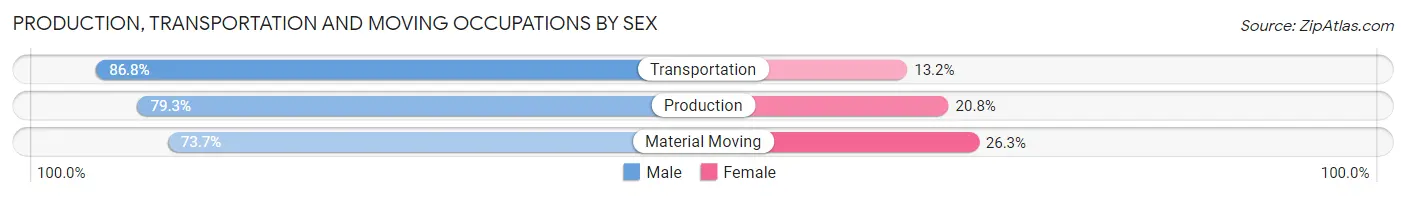
Production, Transportation and Moving Occupations by Sex
| Occupation | Male | Female |
| Production | 1,016 (79.2%) | 266 (20.7%) |
| Transportation | 673 (86.8%) | 102 (13.2%) |
| Material Moving | 384 (73.7%) | 137 (26.3%) |
| Total (Category) | 2,073 (80.4%) | 505 (19.6%) |
| Total (Overall) | 5,886 (48.9%) | 6,148 (51.1%) |
Employment Industries by Sex in Williamsburg County
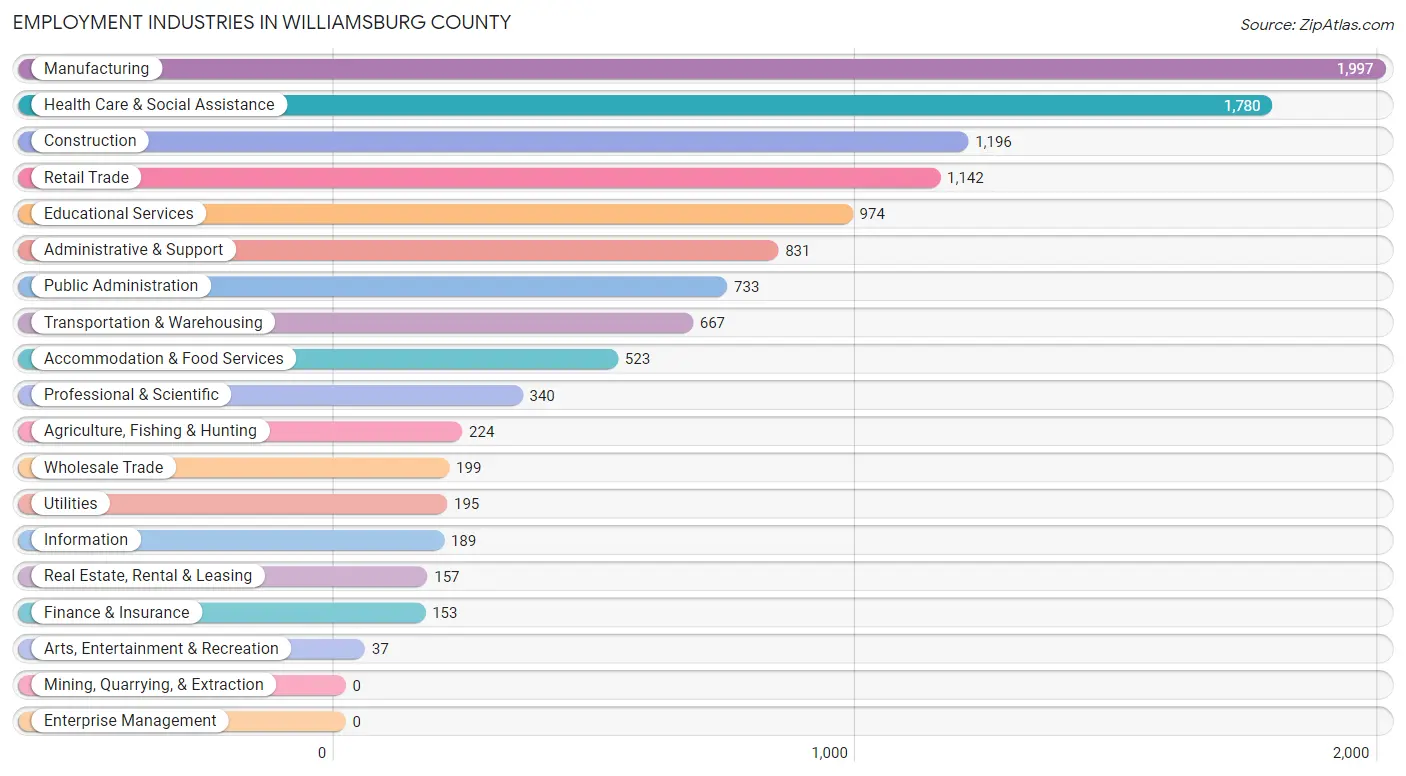
Employment Industries in Williamsburg County
The major employment industries in Williamsburg County include Manufacturing (1,997 | 16.6%), Health Care & Social Assistance (1,780 | 14.8%), Construction (1,196 | 9.9%), Retail Trade (1,142 | 9.5%), and Educational Services (974 | 8.1%).
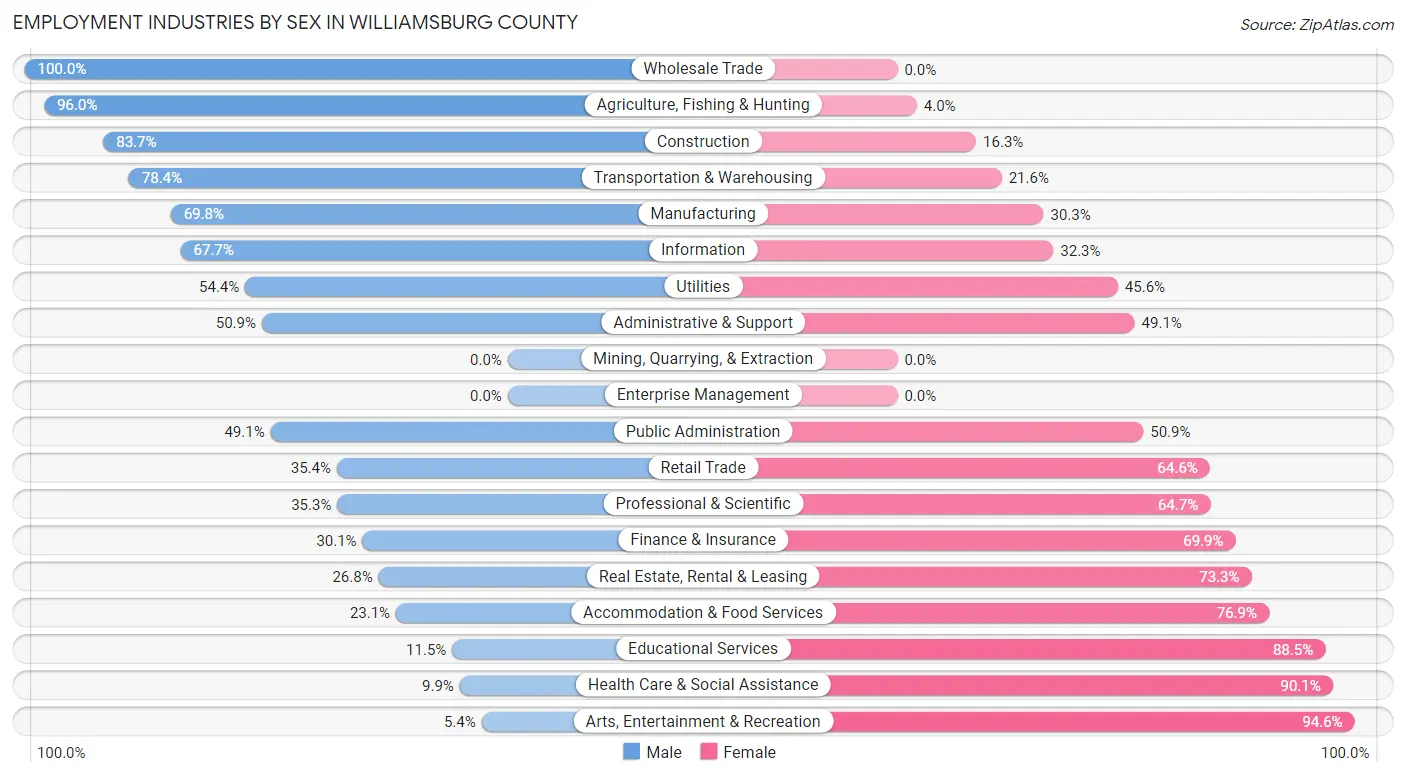
Employment Industries by Sex in Williamsburg County
The Williamsburg County industries that see more men than women are Wholesale Trade (100.0%), Agriculture, Fishing & Hunting (96.0%), and Construction (83.7%), whereas the industries that tend to have a higher number of women are Arts, Entertainment & Recreation (94.6%), Health Care & Social Assistance (90.1%), and Educational Services (88.5%).
| Industry | Male | Female |
| Agriculture, Fishing & Hunting | 215 (96.0%) | 9 (4.0%) |
| Mining, Quarrying, & Extraction | 0 (0.0%) | 0 (0.0%) |
| Construction | 1,001 (83.7%) | 195 (16.3%) |
| Manufacturing | 1,393 (69.8%) | 604 (30.2%) |
| Wholesale Trade | 199 (100.0%) | 0 (0.0%) |
| Retail Trade | 404 (35.4%) | 738 (64.6%) |
| Transportation & Warehousing | 523 (78.4%) | 144 (21.6%) |
| Utilities | 106 (54.4%) | 89 (45.6%) |
| Information | 128 (67.7%) | 61 (32.3%) |
| Finance & Insurance | 46 (30.1%) | 107 (69.9%) |
| Real Estate, Rental & Leasing | 42 (26.8%) | 115 (73.3%) |
| Professional & Scientific | 120 (35.3%) | 220 (64.7%) |
| Enterprise Management | 0 (0.0%) | 0 (0.0%) |
| Administrative & Support | 423 (50.9%) | 408 (49.1%) |
| Educational Services | 112 (11.5%) | 862 (88.5%) |
| Health Care & Social Assistance | 177 (9.9%) | 1,603 (90.1%) |
| Arts, Entertainment & Recreation | 2 (5.4%) | 35 (94.6%) |
| Accommodation & Food Services | 121 (23.1%) | 402 (76.9%) |
| Public Administration | 360 (49.1%) | 373 (50.9%) |
| Total | 5,886 (48.9%) | 6,148 (51.1%) |
Education in Williamsburg County
School Enrollment in Williamsburg County
The most common levels of schooling among the 6,141 students in Williamsburg County are high school (1,689 | 27.5%), middle school (1,534 | 25.0%), and elementary school (1,249 | 20.3%).
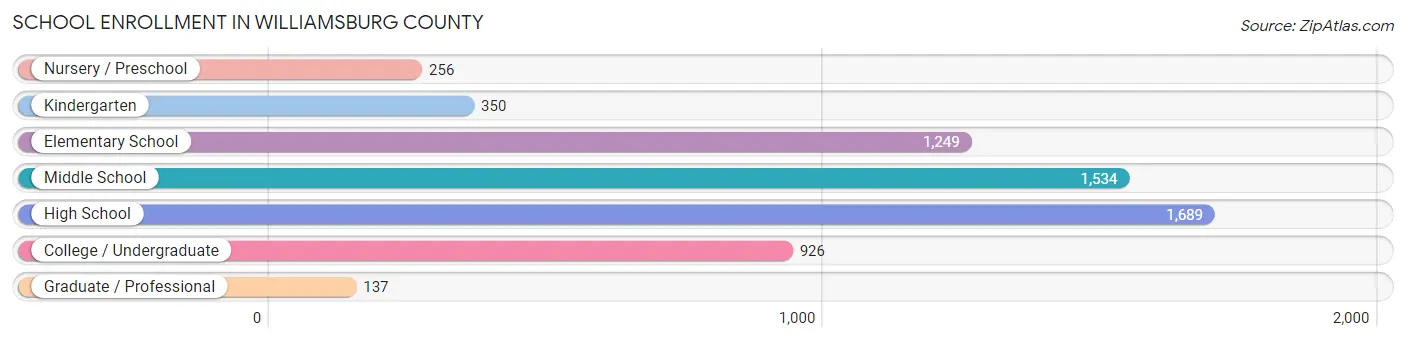
| School Level | # Students | % Students |
| Nursery / Preschool | 256 | 4.2% |
| Kindergarten | 350 | 5.7% |
| Elementary School | 1,249 | 20.3% |
| Middle School | 1,534 | 25.0% |
| High School | 1,689 | 27.5% |
| College / Undergraduate | 926 | 15.1% |
| Graduate / Professional | 137 | 2.2% |
| Total | 6,141 | 100.0% |
School Enrollment by Age by Funding Source in Williamsburg County
Out of a total of 6,141 students who are enrolled in schools in Williamsburg County, 608 (9.9%) attend a private institution, while the remaining 5,533 (90.1%) are enrolled in public schools. The age group of 25 to 34 year olds has the highest likelihood of being enrolled in private schools, with 80 (37.9% in the age bracket) enrolled. Conversely, the age group of 5 to 9 year old has the lowest likelihood of being enrolled in a private school, with 1,358 (95.4% in the age bracket) attending a public institution.
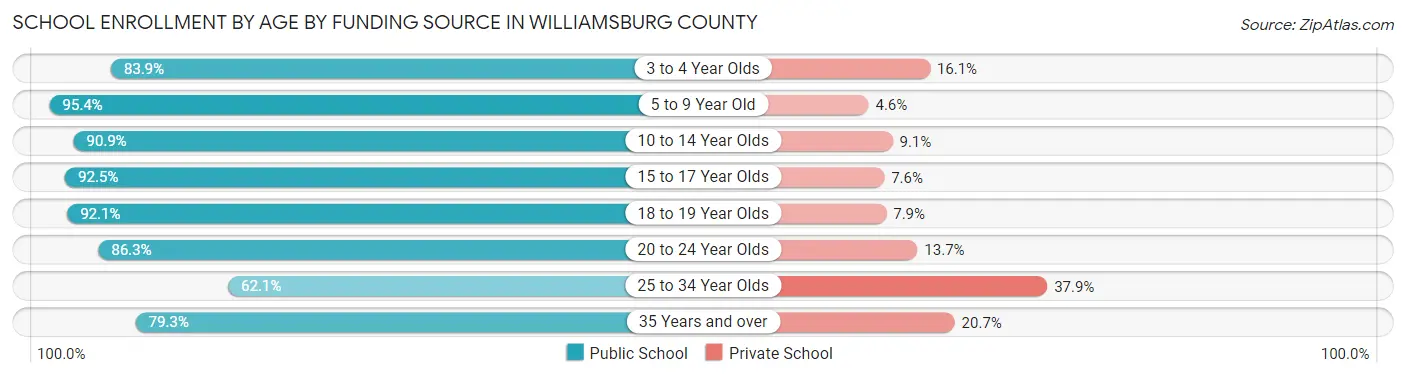
| Age Bracket | Public School | Private School |
| 3 to 4 Year Olds | 256 (83.9%) | 49 (16.1%) |
| 5 to 9 Year Old | 1,358 (95.4%) | 66 (4.6%) |
| 10 to 14 Year Olds | 1,559 (90.9%) | 156 (9.1%) |
| 15 to 17 Year Olds | 1,151 (92.4%) | 94 (7.5%) |
| 18 to 19 Year Olds | 464 (92.1%) | 40 (7.9%) |
| 20 to 24 Year Olds | 377 (86.3%) | 60 (13.7%) |
| 25 to 34 Year Olds | 131 (62.1%) | 80 (37.9%) |
| 35 Years and over | 238 (79.3%) | 62 (20.7%) |
| Total | 5,533 (90.1%) | 608 (9.9%) |
Educational Attainment by Field of Study in Williamsburg County
Education (864 | 24.7%), business (577 | 16.5%), arts & humanities (412 | 11.8%), bio, nature & agricultural (325 | 9.3%), and physical & health sciences (290 | 8.3%) are the most common fields of study among 3,502 individuals in Williamsburg County who have obtained a bachelor's degree or higher.
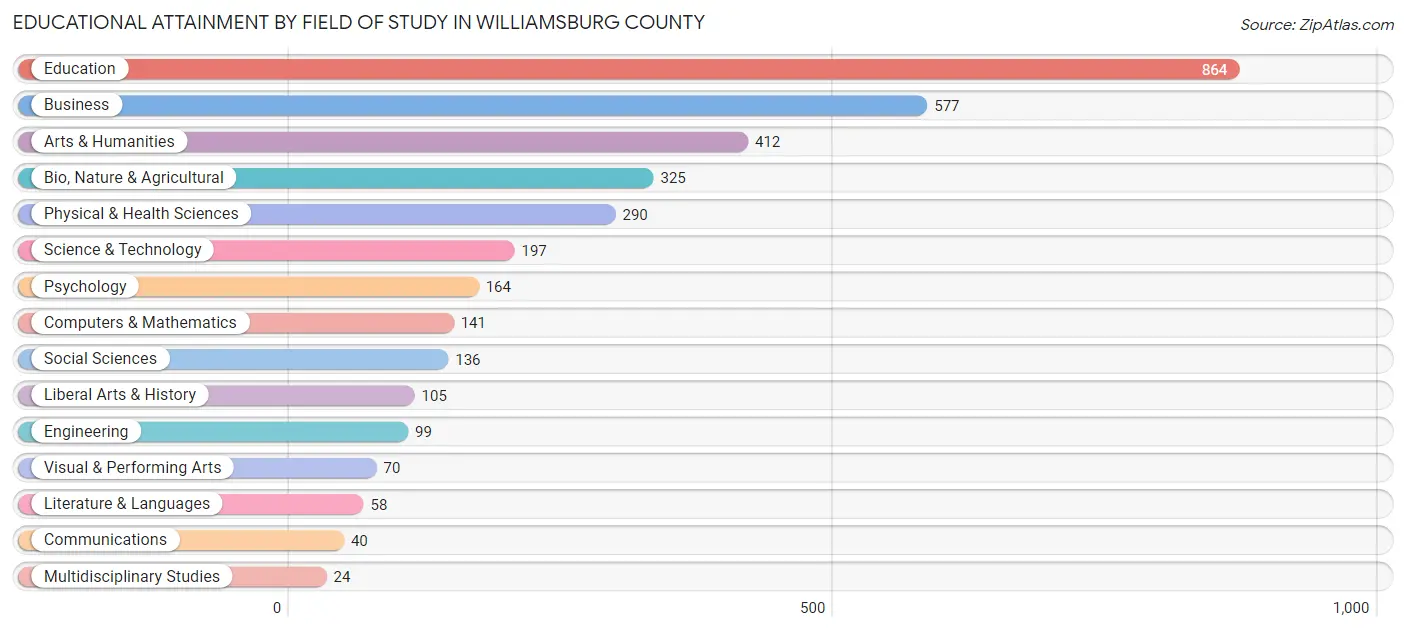
| Field of Study | # Graduates | % Graduates |
| Computers & Mathematics | 141 | 4.0% |
| Bio, Nature & Agricultural | 325 | 9.3% |
| Physical & Health Sciences | 290 | 8.3% |
| Psychology | 164 | 4.7% |
| Social Sciences | 136 | 3.9% |
| Engineering | 99 | 2.8% |
| Multidisciplinary Studies | 24 | 0.7% |
| Science & Technology | 197 | 5.6% |
| Business | 577 | 16.5% |
| Education | 864 | 24.7% |
| Literature & Languages | 58 | 1.7% |
| Liberal Arts & History | 105 | 3.0% |
| Visual & Performing Arts | 70 | 2.0% |
| Communications | 40 | 1.1% |
| Arts & Humanities | 412 | 11.8% |
| Total | 3,502 | 100.0% |
Transportation & Commute in Williamsburg County
Vehicle Availability by Sex in Williamsburg County
The most prevalent vehicle ownership categories in Williamsburg County are males with 2 vehicles (2,215, accounting for 38.2%) and females with 2 vehicles (1,869, making up 37.2%).
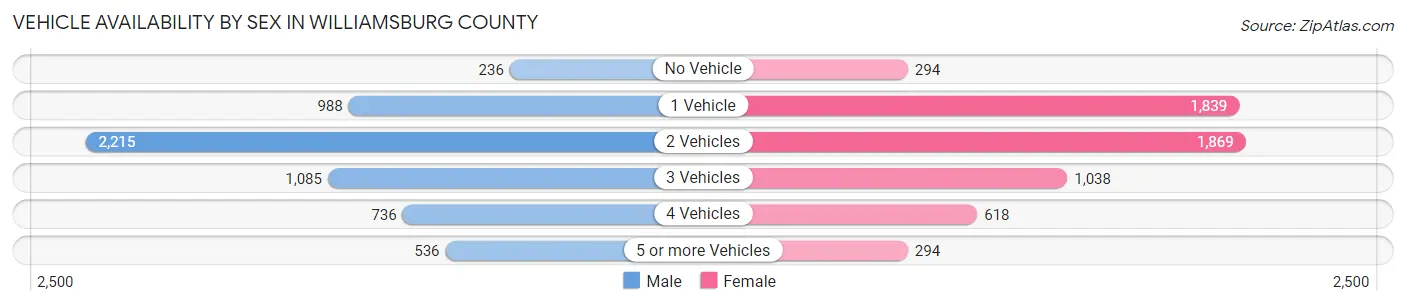
| Vehicles Available | Male | Female |
| No Vehicle | 236 (4.1%) | 294 (4.9%) |
| 1 Vehicle | 988 (17.1%) | 1,839 (30.9%) |
| 2 Vehicles | 2,215 (38.2%) | 1,869 (31.4%) |
| 3 Vehicles | 1,085 (18.7%) | 1,038 (17.4%) |
| 4 Vehicles | 736 (12.7%) | 618 (10.4%) |
| 5 or more Vehicles | 536 (9.2%) | 294 (4.9%) |
| Total | 5,796 (100.0%) | 5,952 (100.0%) |
Commute Time in Williamsburg County
The most frequently occuring commute durations in Williamsburg County are 15 to 19 minutes (2,210 commuters, 19.9%), 30 to 34 minutes (2,102 commuters, 18.9%), and 60 to 89 minutes (1,658 commuters, 14.9%).
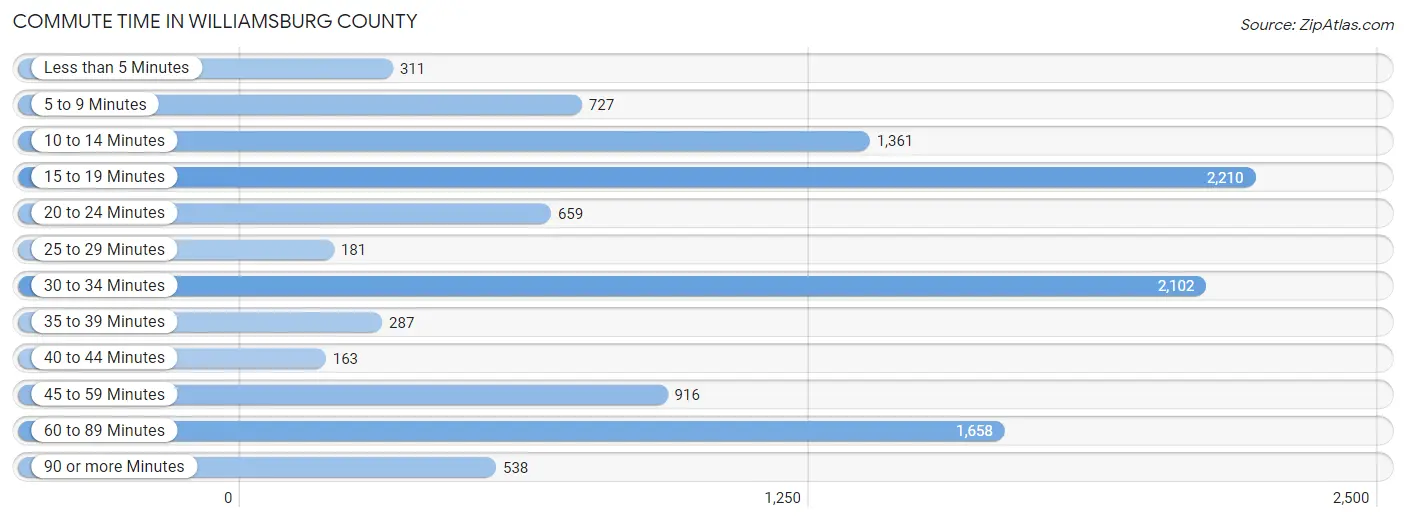
| Commute Time | # Commuters | % Commuters |
| Less than 5 Minutes | 311 | 2.8% |
| 5 to 9 Minutes | 727 | 6.5% |
| 10 to 14 Minutes | 1,361 | 12.2% |
| 15 to 19 Minutes | 2,210 | 19.9% |
| 20 to 24 Minutes | 659 | 5.9% |
| 25 to 29 Minutes | 181 | 1.6% |
| 30 to 34 Minutes | 2,102 | 18.9% |
| 35 to 39 Minutes | 287 | 2.6% |
| 40 to 44 Minutes | 163 | 1.5% |
| 45 to 59 Minutes | 916 | 8.2% |
| 60 to 89 Minutes | 1,658 | 14.9% |
| 90 or more Minutes | 538 | 4.8% |
Commute Time by Sex in Williamsburg County
The most common commute times in Williamsburg County are 15 to 19 minutes (1,185 commuters, 21.2%) for males and 30 to 34 minutes (1,140 commuters, 20.6%) for females.
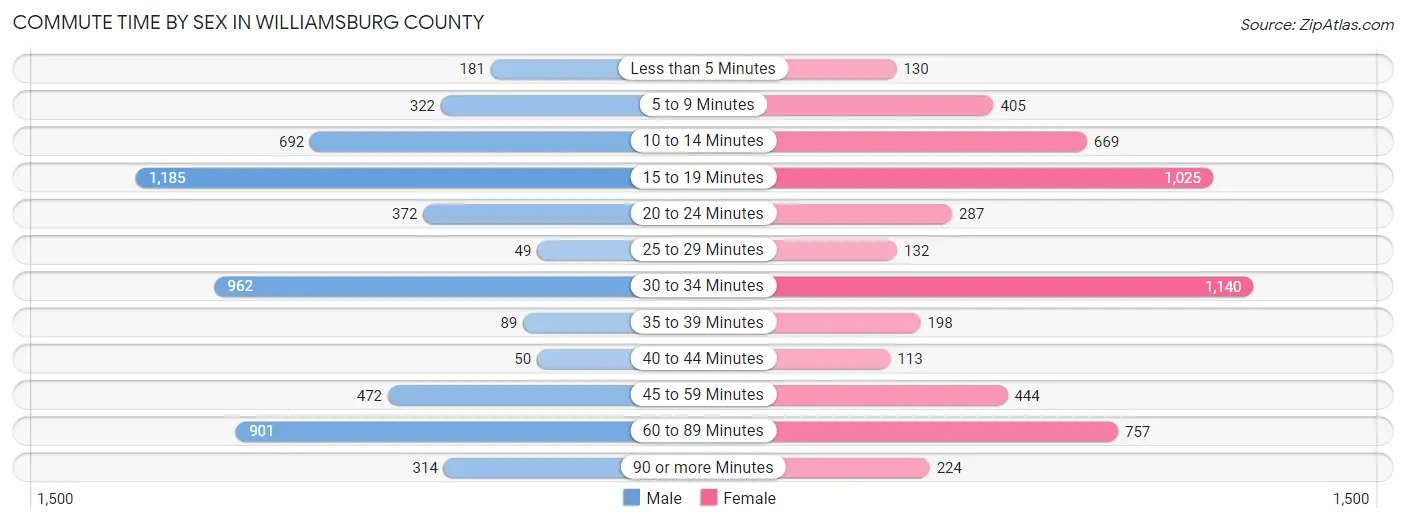
| Commute Time | Male | Female |
| Less than 5 Minutes | 181 (3.2%) | 130 (2.4%) |
| 5 to 9 Minutes | 322 (5.8%) | 405 (7.3%) |
| 10 to 14 Minutes | 692 (12.4%) | 669 (12.1%) |
| 15 to 19 Minutes | 1,185 (21.2%) | 1,025 (18.6%) |
| 20 to 24 Minutes | 372 (6.7%) | 287 (5.2%) |
| 25 to 29 Minutes | 49 (0.9%) | 132 (2.4%) |
| 30 to 34 Minutes | 962 (17.2%) | 1,140 (20.6%) |
| 35 to 39 Minutes | 89 (1.6%) | 198 (3.6%) |
| 40 to 44 Minutes | 50 (0.9%) | 113 (2.1%) |
| 45 to 59 Minutes | 472 (8.5%) | 444 (8.0%) |
| 60 to 89 Minutes | 901 (16.1%) | 757 (13.7%) |
| 90 or more Minutes | 314 (5.6%) | 224 (4.1%) |
Time of Departure to Work by Sex in Williamsburg County
The most frequent times of departure to work in Williamsburg County are 7:00 AM to 7:29 AM (983, 17.6%) for males and 7:00 AM to 7:29 AM (1,259, 22.8%) for females.
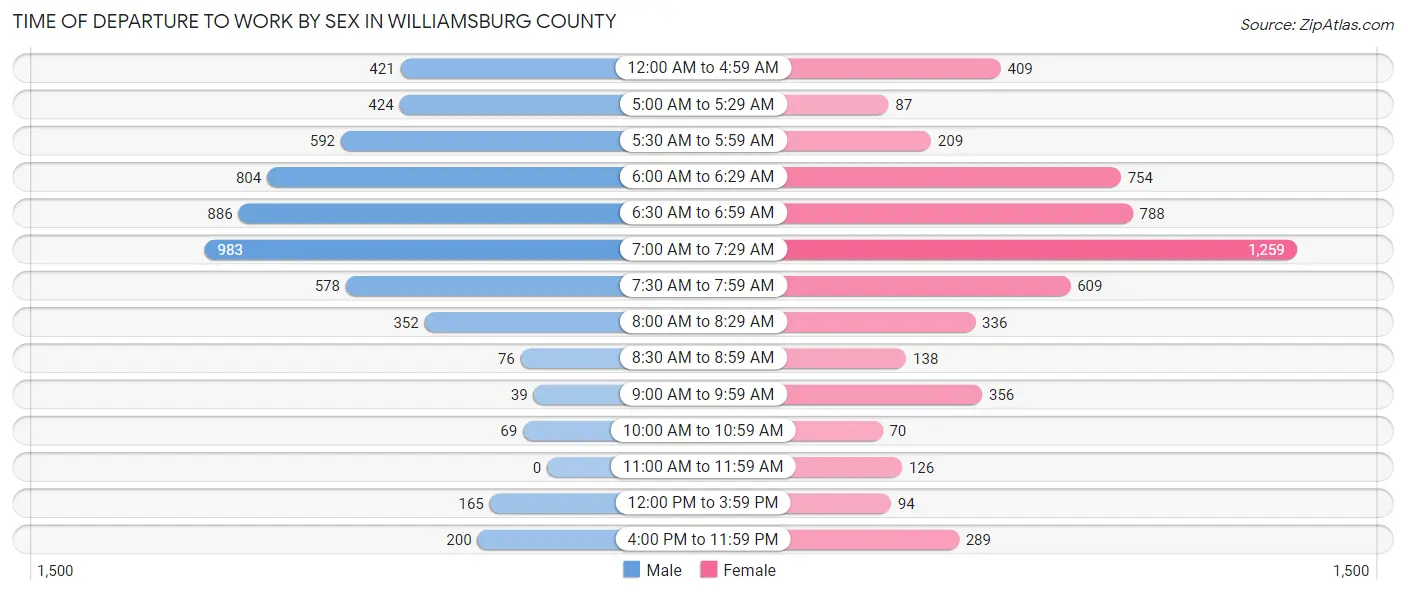
| Time of Departure | Male | Female |
| 12:00 AM to 4:59 AM | 421 (7.5%) | 409 (7.4%) |
| 5:00 AM to 5:29 AM | 424 (7.6%) | 87 (1.6%) |
| 5:30 AM to 5:59 AM | 592 (10.6%) | 209 (3.8%) |
| 6:00 AM to 6:29 AM | 804 (14.4%) | 754 (13.7%) |
| 6:30 AM to 6:59 AM | 886 (15.9%) | 788 (14.3%) |
| 7:00 AM to 7:29 AM | 983 (17.6%) | 1,259 (22.8%) |
| 7:30 AM to 7:59 AM | 578 (10.3%) | 609 (11.0%) |
| 8:00 AM to 8:29 AM | 352 (6.3%) | 336 (6.1%) |
| 8:30 AM to 8:59 AM | 76 (1.4%) | 138 (2.5%) |
| 9:00 AM to 9:59 AM | 39 (0.7%) | 356 (6.4%) |
| 10:00 AM to 10:59 AM | 69 (1.2%) | 70 (1.3%) |
| 11:00 AM to 11:59 AM | 0 (0.0%) | 126 (2.3%) |
| 12:00 PM to 3:59 PM | 165 (2.9%) | 94 (1.7%) |
| 4:00 PM to 11:59 PM | 200 (3.6%) | 289 (5.2%) |
| Total | 5,589 (100.0%) | 5,524 (100.0%) |
Housing Occupancy in Williamsburg County
Occupancy by Ownership in Williamsburg County
Of the total 11,999 dwellings in Williamsburg County, owner-occupied units account for 8,874 (74.0%), while renter-occupied units make up 3,125 (26.0%).
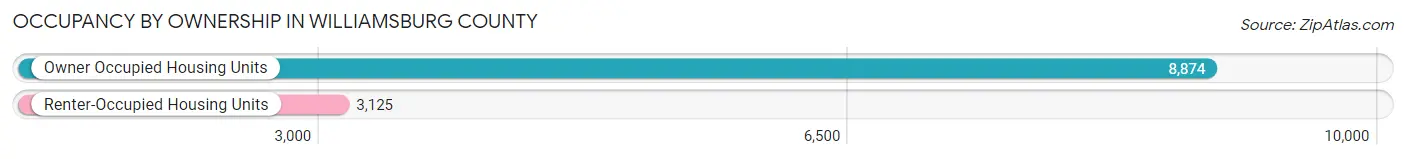
| Occupancy | # Housing Units | % Housing Units |
| Owner Occupied Housing Units | 8,874 | 74.0% |
| Renter-Occupied Housing Units | 3,125 | 26.0% |
| Total Occupied Housing Units | 11,999 | 100.0% |
Occupancy by Household Size in Williamsburg County
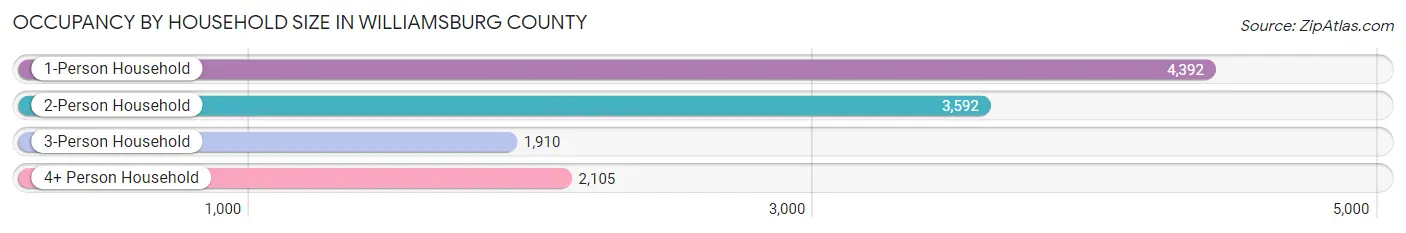
| Household Size | # Housing Units | % Housing Units |
| 1-Person Household | 4,392 | 36.6% |
| 2-Person Household | 3,592 | 29.9% |
| 3-Person Household | 1,910 | 15.9% |
| 4+ Person Household | 2,105 | 17.5% |
| Total Housing Units | 11,999 | 100.0% |
Occupancy by Ownership by Household Size in Williamsburg County
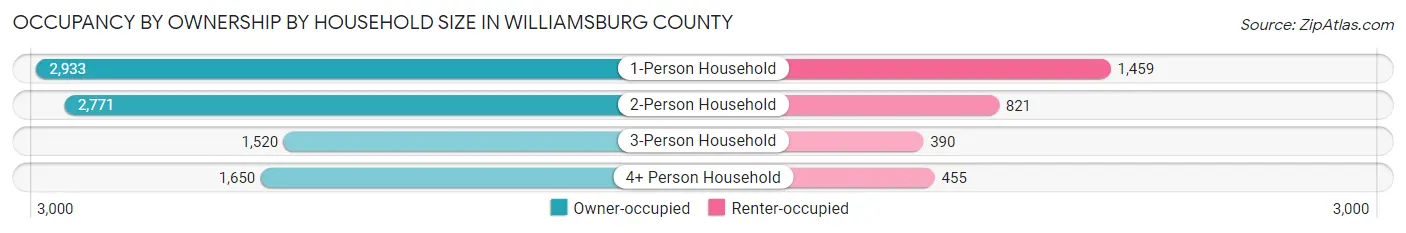
| Household Size | Owner-occupied | Renter-occupied |
| 1-Person Household | 2,933 (66.8%) | 1,459 (33.2%) |
| 2-Person Household | 2,771 (77.1%) | 821 (22.9%) |
| 3-Person Household | 1,520 (79.6%) | 390 (20.4%) |
| 4+ Person Household | 1,650 (78.4%) | 455 (21.6%) |
| Total Housing Units | 8,874 (74.0%) | 3,125 (26.0%) |
Occupancy by Educational Attainment in Williamsburg County
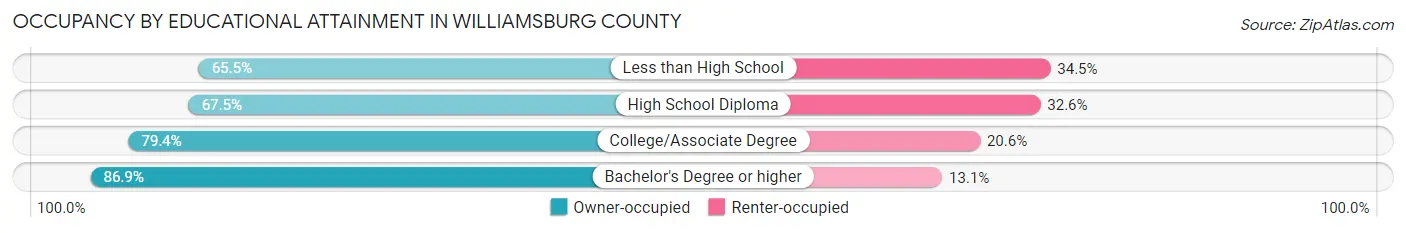
| Household Size | Owner-occupied | Renter-occupied |
| Less than High School | 1,126 (65.5%) | 594 (34.5%) |
| High School Diploma | 3,228 (67.4%) | 1,558 (32.6%) |
| College/Associate Degree | 2,693 (79.4%) | 698 (20.6%) |
| Bachelor's Degree or higher | 1,827 (86.9%) | 275 (13.1%) |
Occupancy by Age of Householder in Williamsburg County
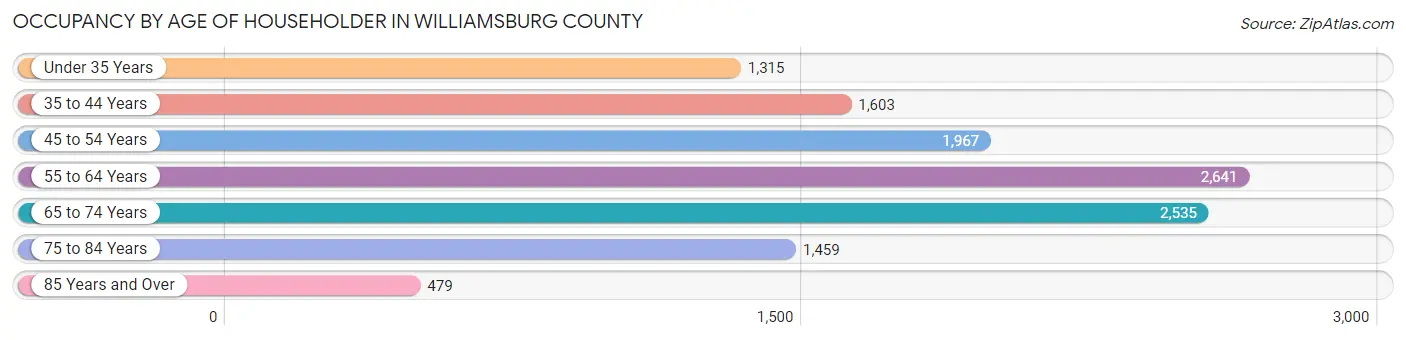
| Age Bracket | # Households | % Households |
| Under 35 Years | 1,315 | 11.0% |
| 35 to 44 Years | 1,603 | 13.4% |
| 45 to 54 Years | 1,967 | 16.4% |
| 55 to 64 Years | 2,641 | 22.0% |
| 65 to 74 Years | 2,535 | 21.1% |
| 75 to 84 Years | 1,459 | 12.2% |
| 85 Years and Over | 479 | 4.0% |
| Total | 11,999 | 100.0% |
Housing Finances in Williamsburg County
Median Income by Occupancy in Williamsburg County
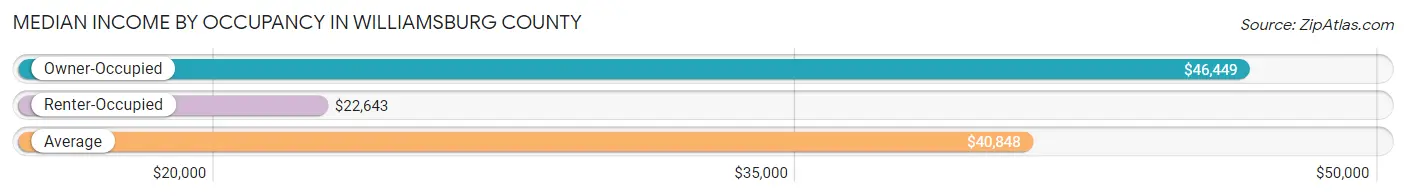
| Occupancy Type | # Households | Median Income |
| Owner-Occupied | 8,874 (74.0%) | $46,449 |
| Renter-Occupied | 3,125 (26.0%) | $22,643 |
| Average | 11,999 (100.0%) | $40,848 |
Occupancy by Householder Income Bracket in Williamsburg County
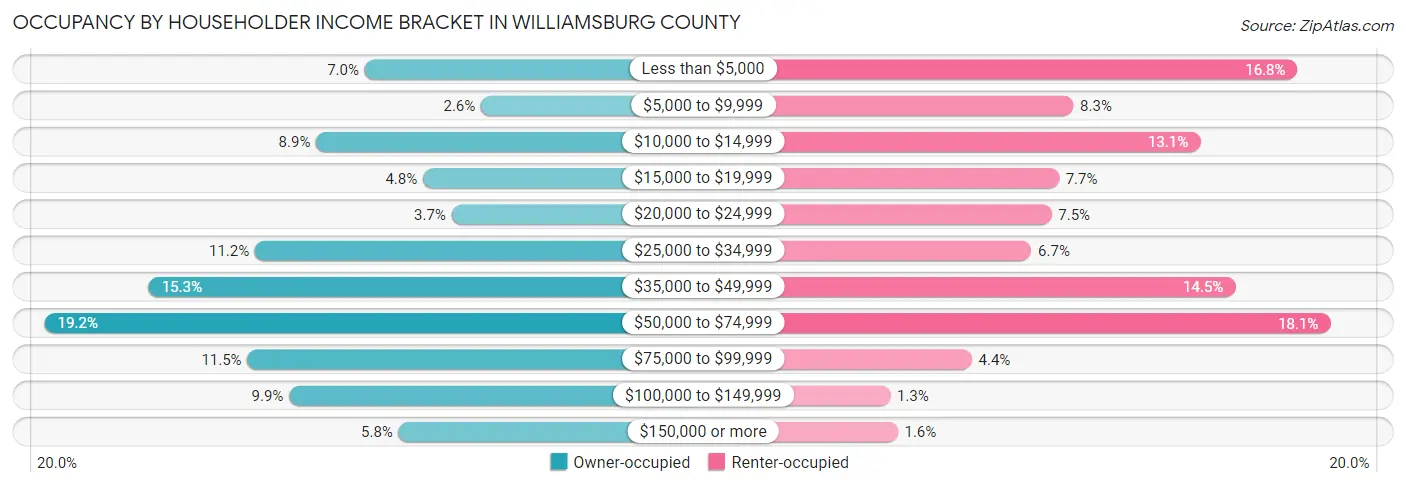
| Income Bracket | Owner-occupied | Renter-occupied |
| Less than $5,000 | 625 (7.0%) | 526 (16.8%) |
| $5,000 to $9,999 | 232 (2.6%) | 259 (8.3%) |
| $10,000 to $14,999 | 789 (8.9%) | 410 (13.1%) |
| $15,000 to $19,999 | 428 (4.8%) | 242 (7.7%) |
| $20,000 to $24,999 | 331 (3.7%) | 233 (7.5%) |
| $25,000 to $34,999 | 996 (11.2%) | 209 (6.7%) |
| $35,000 to $49,999 | 1,355 (15.3%) | 452 (14.5%) |
| $50,000 to $74,999 | 1,707 (19.2%) | 565 (18.1%) |
| $75,000 to $99,999 | 1,021 (11.5%) | 138 (4.4%) |
| $100,000 to $149,999 | 880 (9.9%) | 41 (1.3%) |
| $150,000 or more | 510 (5.8%) | 50 (1.6%) |
| Total | 8,874 (100.0%) | 3,125 (100.0%) |
Monthly Housing Cost Tiers in Williamsburg County
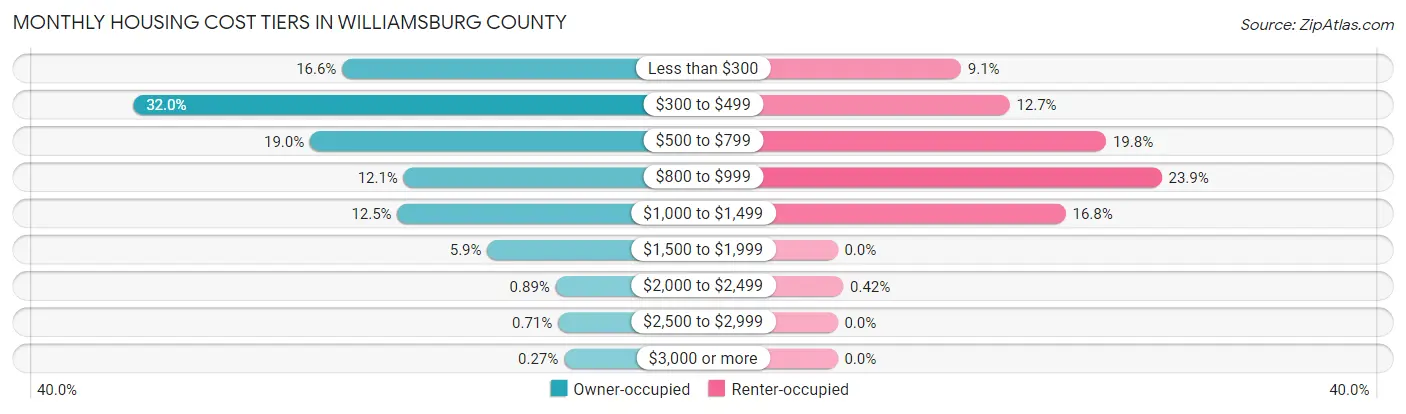
| Monthly Cost | Owner-occupied | Renter-occupied |
| Less than $300 | 1,474 (16.6%) | 284 (9.1%) |
| $300 to $499 | 2,840 (32.0%) | 396 (12.7%) |
| $500 to $799 | 1,684 (19.0%) | 618 (19.8%) |
| $800 to $999 | 1,072 (12.1%) | 746 (23.9%) |
| $1,000 to $1,499 | 1,113 (12.5%) | 525 (16.8%) |
| $1,500 to $1,999 | 525 (5.9%) | 0 (0.0%) |
| $2,000 to $2,499 | 79 (0.9%) | 13 (0.4%) |
| $2,500 to $2,999 | 63 (0.7%) | 0 (0.0%) |
| $3,000 or more | 24 (0.3%) | 0 (0.0%) |
| Total | 8,874 (100.0%) | 3,125 (100.0%) |
Physical Housing Characteristics in Williamsburg County
Housing Structures in Williamsburg County
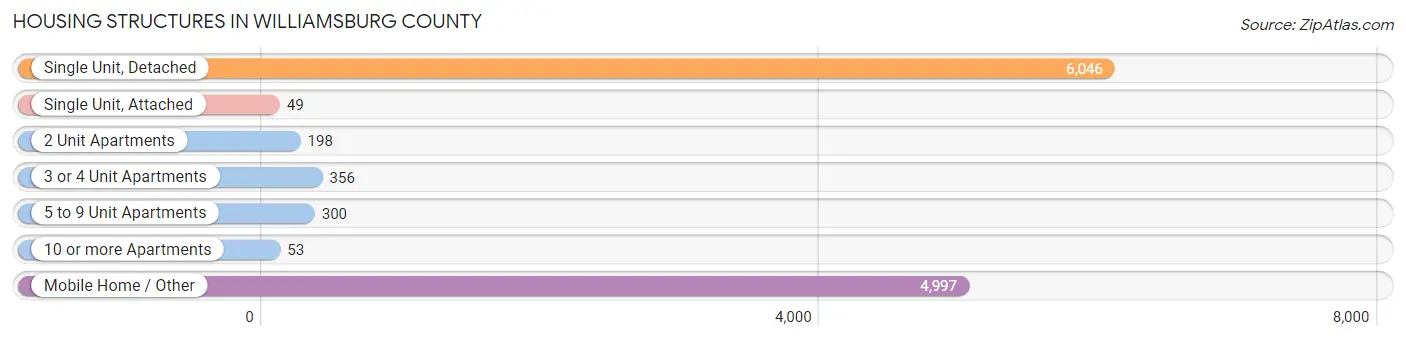
| Structure Type | # Housing Units | % Housing Units |
| Single Unit, Detached | 6,046 | 50.4% |
| Single Unit, Attached | 49 | 0.4% |
| 2 Unit Apartments | 198 | 1.7% |
| 3 or 4 Unit Apartments | 356 | 3.0% |
| 5 to 9 Unit Apartments | 300 | 2.5% |
| 10 or more Apartments | 53 | 0.4% |
| Mobile Home / Other | 4,997 | 41.6% |
| Total | 11,999 | 100.0% |
Housing Structures by Occupancy in Williamsburg County
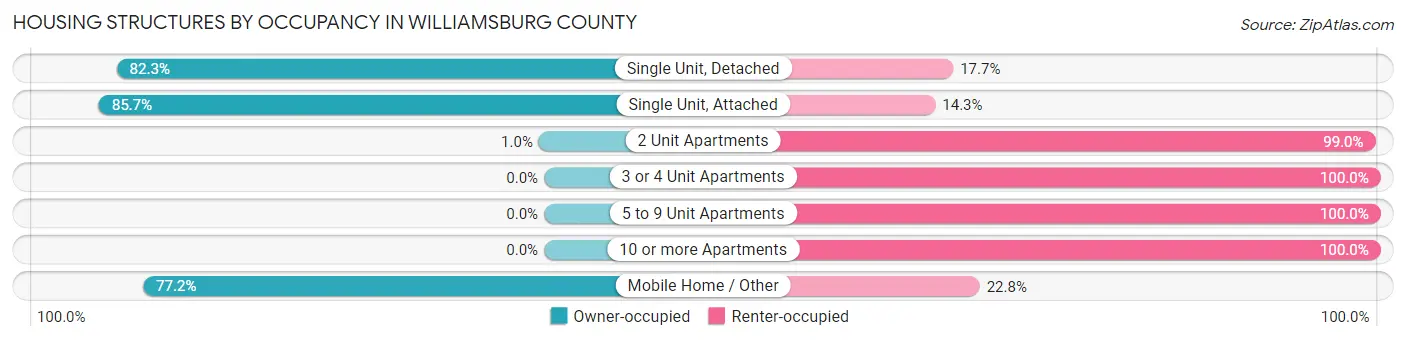
| Structure Type | Owner-occupied | Renter-occupied |
| Single Unit, Detached | 4,974 (82.3%) | 1,072 (17.7%) |
| Single Unit, Attached | 42 (85.7%) | 7 (14.3%) |
| 2 Unit Apartments | 2 (1.0%) | 196 (99.0%) |
| 3 or 4 Unit Apartments | 0 (0.0%) | 356 (100.0%) |
| 5 to 9 Unit Apartments | 0 (0.0%) | 300 (100.0%) |
| 10 or more Apartments | 0 (0.0%) | 53 (100.0%) |
| Mobile Home / Other | 3,856 (77.2%) | 1,141 (22.8%) |
| Total | 8,874 (74.0%) | 3,125 (26.0%) |
Housing Structures by Number of Rooms in Williamsburg County
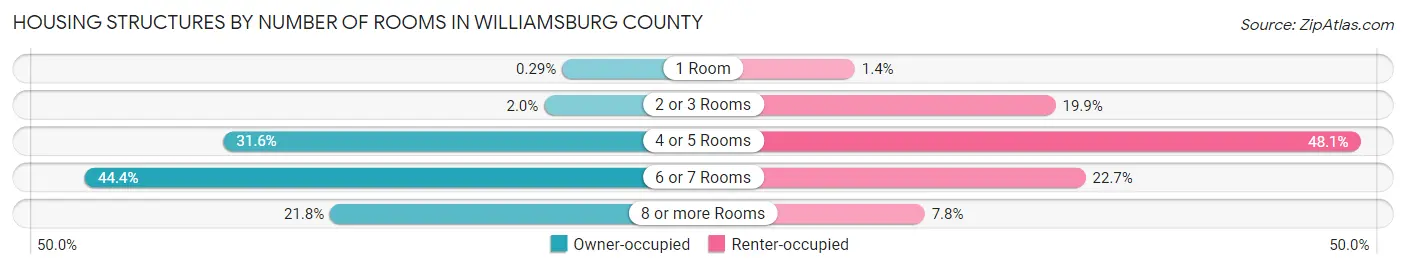
| Number of Rooms | Owner-occupied | Renter-occupied |
| 1 Room | 26 (0.3%) | 43 (1.4%) |
| 2 or 3 Rooms | 173 (1.9%) | 623 (19.9%) |
| 4 or 5 Rooms | 2,805 (31.6%) | 1,504 (48.1%) |
| 6 or 7 Rooms | 3,940 (44.4%) | 710 (22.7%) |
| 8 or more Rooms | 1,930 (21.7%) | 245 (7.8%) |
| Total | 8,874 (100.0%) | 3,125 (100.0%) |
Housing Structure by Heating Type in Williamsburg County
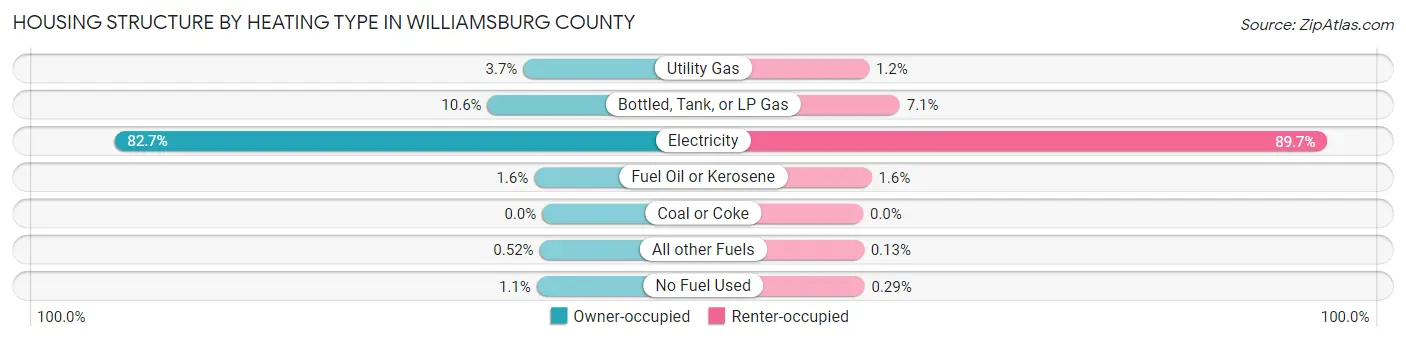
| Heating Type | Owner-occupied | Renter-occupied |
| Utility Gas | 324 (3.6%) | 36 (1.1%) |
| Bottled, Tank, or LP Gas | 938 (10.6%) | 222 (7.1%) |
| Electricity | 7,334 (82.7%) | 2,803 (89.7%) |
| Fuel Oil or Kerosene | 138 (1.6%) | 51 (1.6%) |
| Coal or Coke | 0 (0.0%) | 0 (0.0%) |
| All other Fuels | 46 (0.5%) | 4 (0.1%) |
| No Fuel Used | 94 (1.1%) | 9 (0.3%) |
| Total | 8,874 (100.0%) | 3,125 (100.0%) |
Household Vehicle Usage in Williamsburg County
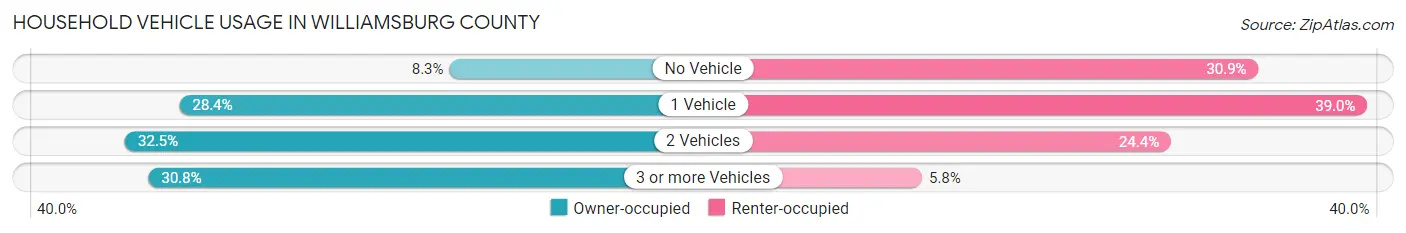
| Vehicles per Household | Owner-occupied | Renter-occupied |
| No Vehicle | 735 (8.3%) | 965 (30.9%) |
| 1 Vehicle | 2,524 (28.4%) | 1,219 (39.0%) |
| 2 Vehicles | 2,885 (32.5%) | 761 (24.3%) |
| 3 or more Vehicles | 2,730 (30.8%) | 180 (5.8%) |
| Total | 8,874 (100.0%) | 3,125 (100.0%) |
Real Estate & Mortgages in Williamsburg County
Real Estate and Mortgage Overview in Williamsburg County
| Characteristic | Without Mortgage | With Mortgage |
| Housing Units | 5,901 | 2,973 |
| Median Property Value | $70,800 | $113,100 |
| Median Household Income | $39,834 | $286 |
| Monthly Housing Costs | $412 | $24 |
| Real Estate Taxes | $513 | $142 |
Property Value by Mortgage Status in Williamsburg County
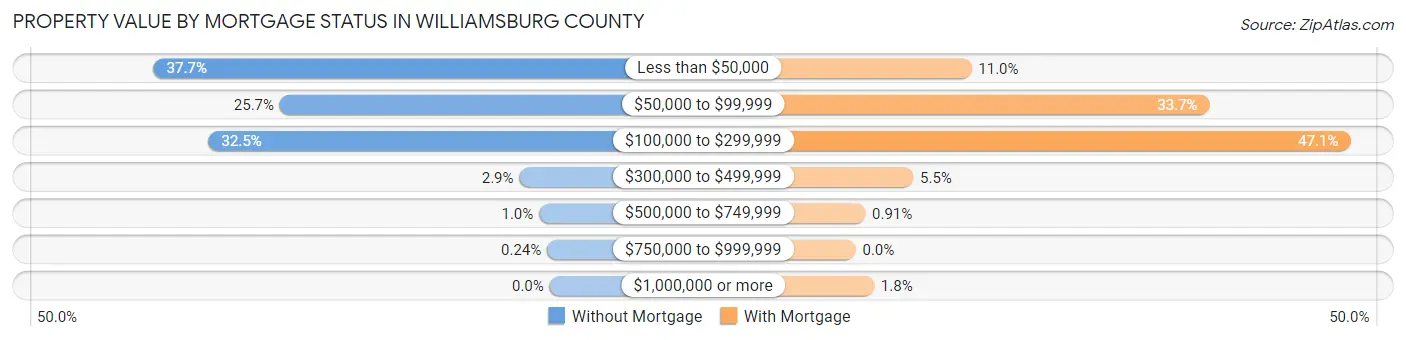
| Property Value | Without Mortgage | With Mortgage |
| Less than $50,000 | 2,225 (37.7%) | 328 (11.0%) |
| $50,000 to $99,999 | 1,516 (25.7%) | 1,002 (33.7%) |
| $100,000 to $299,999 | 1,917 (32.5%) | 1,401 (47.1%) |
| $300,000 to $499,999 | 170 (2.9%) | 163 (5.5%) |
| $500,000 to $749,999 | 59 (1.0%) | 27 (0.9%) |
| $750,000 to $999,999 | 14 (0.2%) | 0 (0.0%) |
| $1,000,000 or more | 0 (0.0%) | 52 (1.8%) |
| Total | 5,901 (100.0%) | 2,973 (100.0%) |
Household Income by Mortgage Status in Williamsburg County
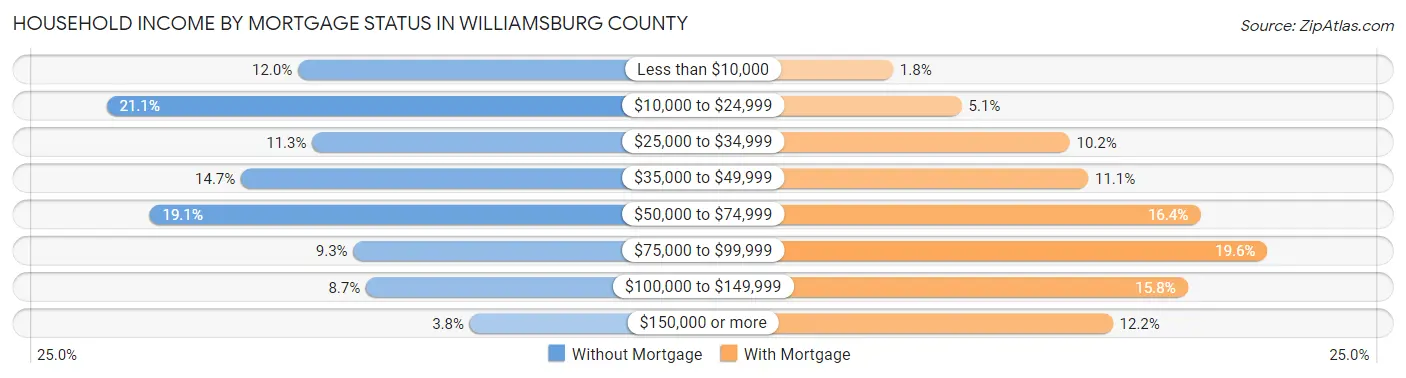
| Household Income | Without Mortgage | With Mortgage |
| Less than $10,000 | 707 (12.0%) | 53 (1.8%) |
| $10,000 to $24,999 | 1,245 (21.1%) | 150 (5.1%) |
| $25,000 to $34,999 | 667 (11.3%) | 303 (10.2%) |
| $35,000 to $49,999 | 867 (14.7%) | 329 (11.1%) |
| $50,000 to $74,999 | 1,124 (19.1%) | 488 (16.4%) |
| $75,000 to $99,999 | 551 (9.3%) | 583 (19.6%) |
| $100,000 to $149,999 | 516 (8.7%) | 470 (15.8%) |
| $150,000 or more | 224 (3.8%) | 364 (12.2%) |
| Total | 5,901 (100.0%) | 2,973 (100.0%) |
Property Value to Household Income Ratio in Williamsburg County
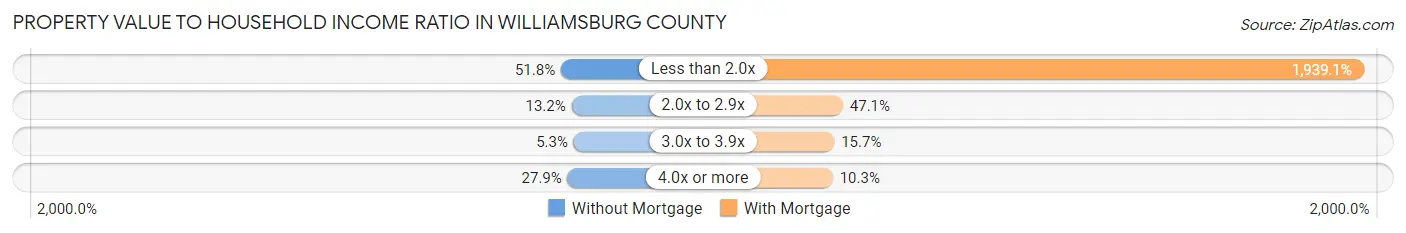
| Value-to-Income Ratio | Without Mortgage | With Mortgage |
| Less than 2.0x | 3,054 (51.7%) | 57,649 (1,939.1%) |
| 2.0x to 2.9x | 781 (13.2%) | 1,399 (47.1%) |
| 3.0x to 3.9x | 311 (5.3%) | 466 (15.7%) |
| 4.0x or more | 1,644 (27.9%) | 305 (10.3%) |
| Total | 5,901 (100.0%) | 2,973 (100.0%) |
Real Estate Taxes by Mortgage Status in Williamsburg County
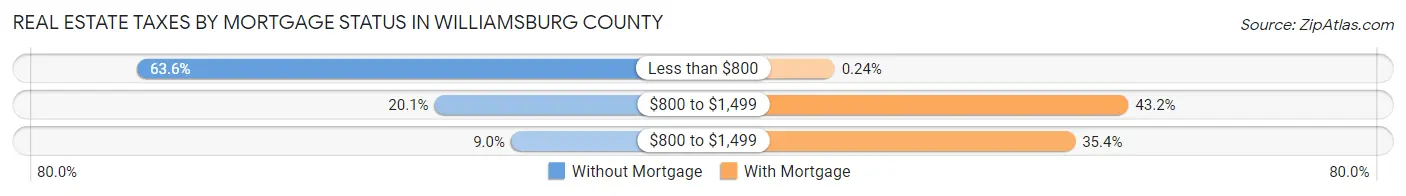
| Property Taxes | Without Mortgage | With Mortgage |
| Less than $800 | 3,750 (63.5%) | 7 (0.2%) |
| $800 to $1,499 | 1,187 (20.1%) | 1,283 (43.2%) |
| $800 to $1,499 | 529 (9.0%) | 1,052 (35.4%) |
| Total | 5,901 (100.0%) | 2,973 (100.0%) |
Health & Disability in Williamsburg County
Health Insurance Coverage by Age in Williamsburg County
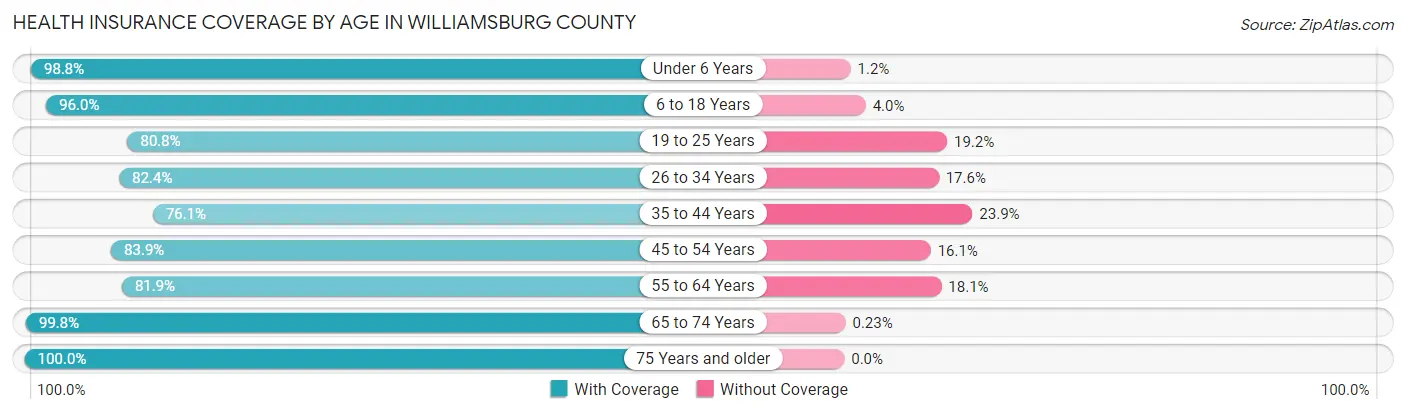
| Age Bracket | With Coverage | Without Coverage |
| Under 6 Years | 1,758 (98.8%) | 21 (1.2%) |
| 6 to 18 Years | 4,417 (96.0%) | 184 (4.0%) |
| 19 to 25 Years | 1,878 (80.8%) | 445 (19.2%) |
| 26 to 34 Years | 2,601 (82.4%) | 556 (17.6%) |
| 35 to 44 Years | 2,412 (76.1%) | 757 (23.9%) |
| 45 to 54 Years | 2,984 (83.9%) | 573 (16.1%) |
| 55 to 64 Years | 3,582 (81.9%) | 792 (18.1%) |
| 65 to 74 Years | 3,940 (99.8%) | 9 (0.2%) |
| 75 Years and older | 2,493 (100.0%) | 0 (0.0%) |
| Total | 26,065 (88.6%) | 3,337 (11.4%) |
Health Insurance Coverage by Citizenship Status in Williamsburg County
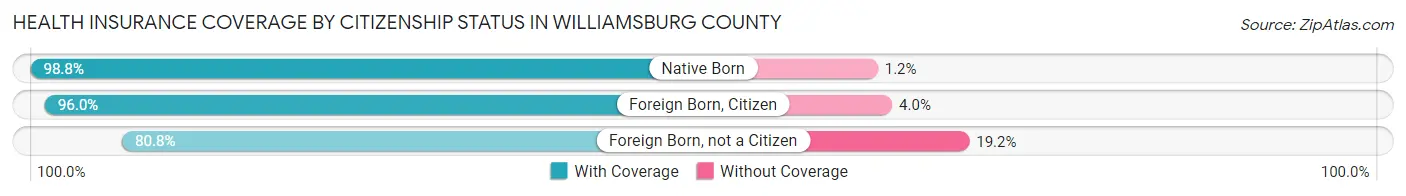
| Citizenship Status | With Coverage | Without Coverage |
| Native Born | 1,758 (98.8%) | 21 (1.2%) |
| Foreign Born, Citizen | 4,417 (96.0%) | 184 (4.0%) |
| Foreign Born, not a Citizen | 1,878 (80.8%) | 445 (19.2%) |
Health Insurance Coverage by Household Income in Williamsburg County
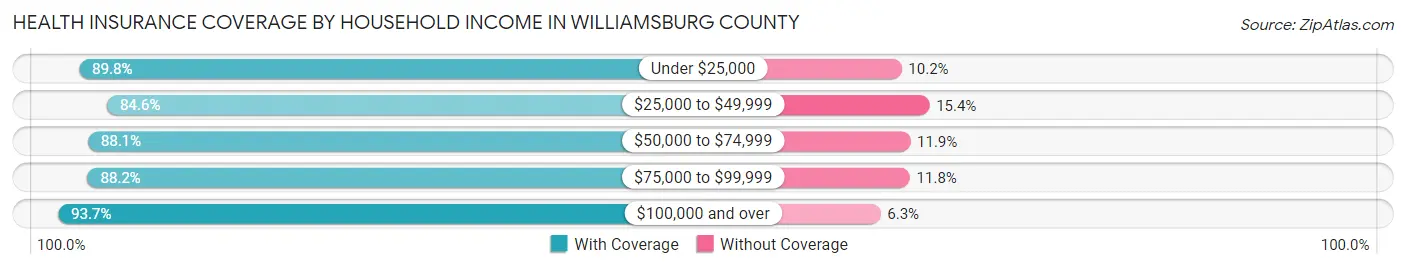
| Household Income | With Coverage | Without Coverage |
| Under $25,000 | 6,282 (89.8%) | 716 (10.2%) |
| $25,000 to $49,999 | 5,826 (84.6%) | 1,064 (15.4%) |
| $50,000 to $74,999 | 5,969 (88.1%) | 803 (11.9%) |
| $75,000 to $99,999 | 3,355 (88.2%) | 448 (11.8%) |
| $100,000 and over | 4,537 (93.7%) | 304 (6.3%) |
Public vs Private Health Insurance Coverage by Age in Williamsburg County
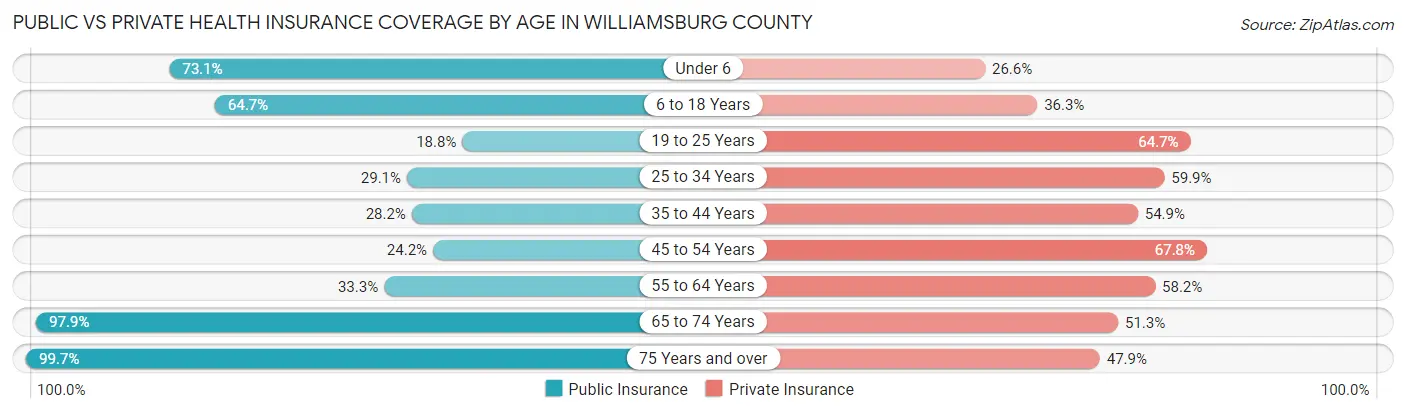
| Age Bracket | Public Insurance | Private Insurance |
| Under 6 | 1,301 (73.1%) | 473 (26.6%) |
| 6 to 18 Years | 2,976 (64.7%) | 1,669 (36.3%) |
| 19 to 25 Years | 436 (18.8%) | 1,503 (64.7%) |
| 25 to 34 Years | 917 (29.0%) | 1,890 (59.9%) |
| 35 to 44 Years | 892 (28.1%) | 1,741 (54.9%) |
| 45 to 54 Years | 861 (24.2%) | 2,410 (67.7%) |
| 55 to 64 Years | 1,456 (33.3%) | 2,544 (58.2%) |
| 65 to 74 Years | 3,865 (97.9%) | 2,025 (51.3%) |
| 75 Years and over | 2,486 (99.7%) | 1,194 (47.9%) |
| Total | 15,190 (51.7%) | 15,449 (52.5%) |
Disability Status by Sex by Age in Williamsburg County
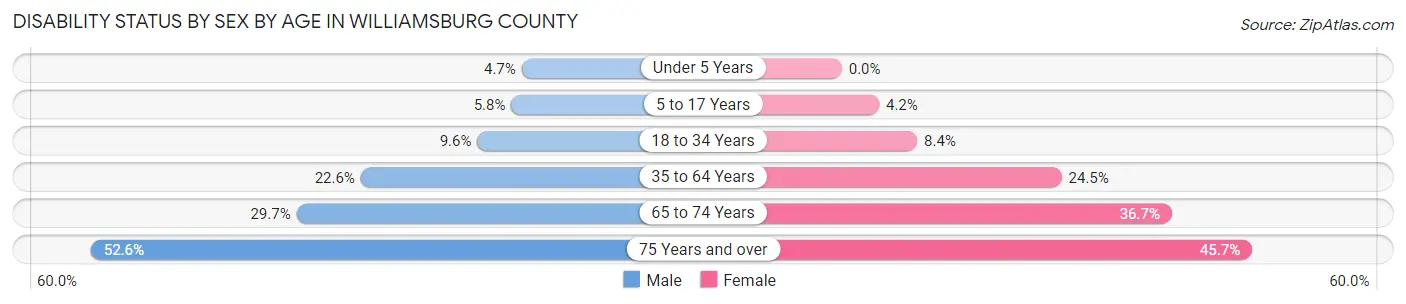
| Age Bracket | Male | Female |
| Under 5 Years | 33 (4.6%) | 0 (0.0%) |
| 5 to 17 Years | 131 (5.8%) | 97 (4.2%) |
| 18 to 34 Years | 289 (9.6%) | 236 (8.4%) |
| 35 to 64 Years | 1,127 (22.6%) | 1,495 (24.5%) |
| 65 to 74 Years | 516 (29.7%) | 813 (36.7%) |
| 75 Years and over | 502 (52.6%) | 703 (45.7%) |
Disability Class by Sex by Age in Williamsburg County
Disability Class: Hearing Difficulty
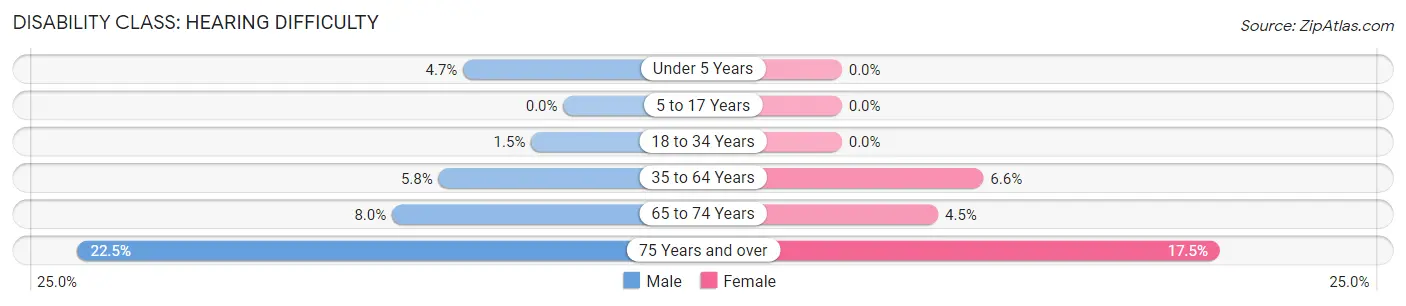
| Age Bracket | Male | Female |
| Under 5 Years | 33 (4.6%) | 0 (0.0%) |
| 5 to 17 Years | 0 (0.0%) | 0 (0.0%) |
| 18 to 34 Years | 45 (1.5%) | 0 (0.0%) |
| 35 to 64 Years | 289 (5.8%) | 401 (6.6%) |
| 65 to 74 Years | 138 (8.0%) | 99 (4.5%) |
| 75 Years and over | 215 (22.5%) | 270 (17.5%) |
Disability Class: Vision Difficulty
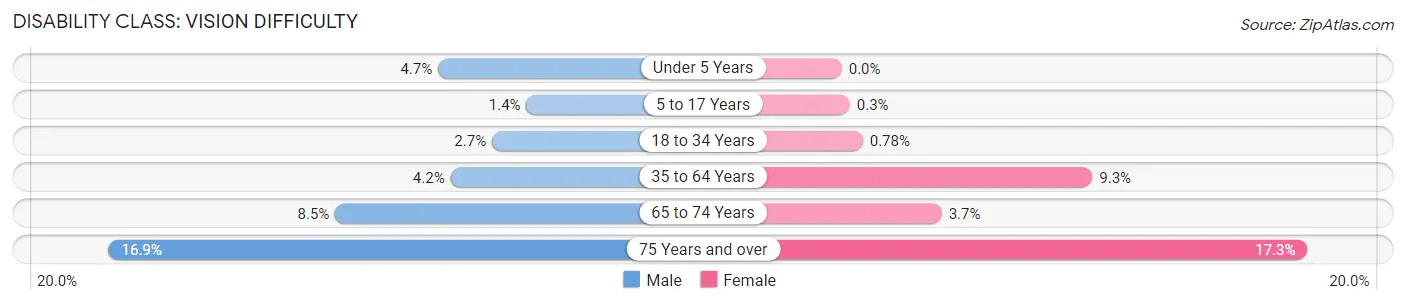
| Age Bracket | Male | Female |
| Under 5 Years | 33 (4.6%) | 0 (0.0%) |
| 5 to 17 Years | 31 (1.4%) | 7 (0.3%) |
| 18 to 34 Years | 80 (2.6%) | 22 (0.8%) |
| 35 to 64 Years | 209 (4.2%) | 568 (9.3%) |
| 65 to 74 Years | 147 (8.5%) | 82 (3.7%) |
| 75 Years and over | 161 (16.9%) | 266 (17.3%) |
Disability Class: Cognitive Difficulty
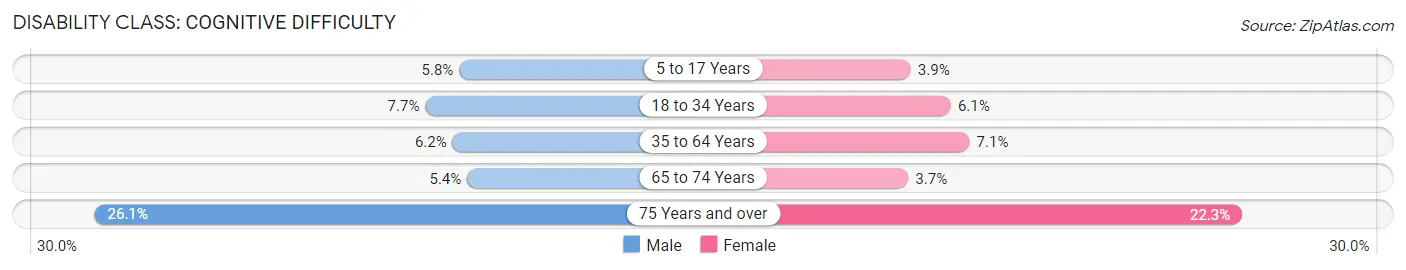
| Age Bracket | Male | Female |
| 5 to 17 Years | 131 (5.8%) | 90 (3.8%) |
| 18 to 34 Years | 232 (7.7%) | 171 (6.1%) |
| 35 to 64 Years | 308 (6.2%) | 435 (7.1%) |
| 65 to 74 Years | 93 (5.4%) | 82 (3.7%) |
| 75 Years and over | 249 (26.1%) | 343 (22.3%) |
Disability Class: Ambulatory Difficulty
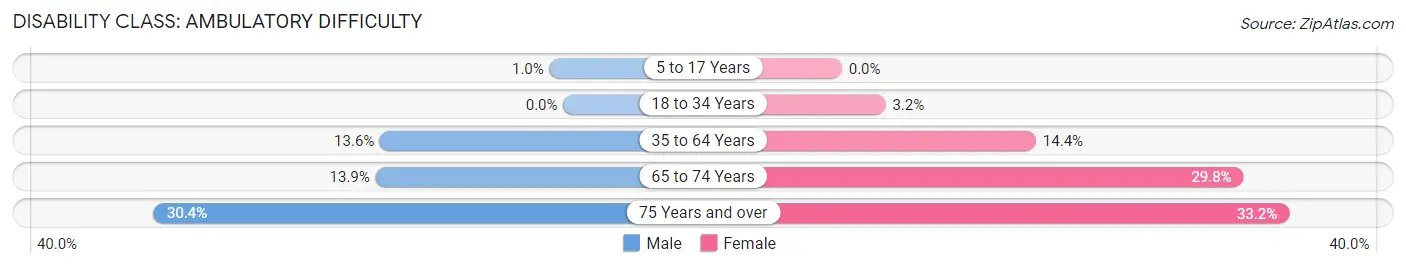
| Age Bracket | Male | Female |
| 5 to 17 Years | 23 (1.0%) | 0 (0.0%) |
| 18 to 34 Years | 0 (0.0%) | 91 (3.2%) |
| 35 to 64 Years | 679 (13.6%) | 880 (14.4%) |
| 65 to 74 Years | 242 (13.9%) | 660 (29.8%) |
| 75 Years and over | 290 (30.4%) | 511 (33.2%) |
Disability Class: Self-Care Difficulty
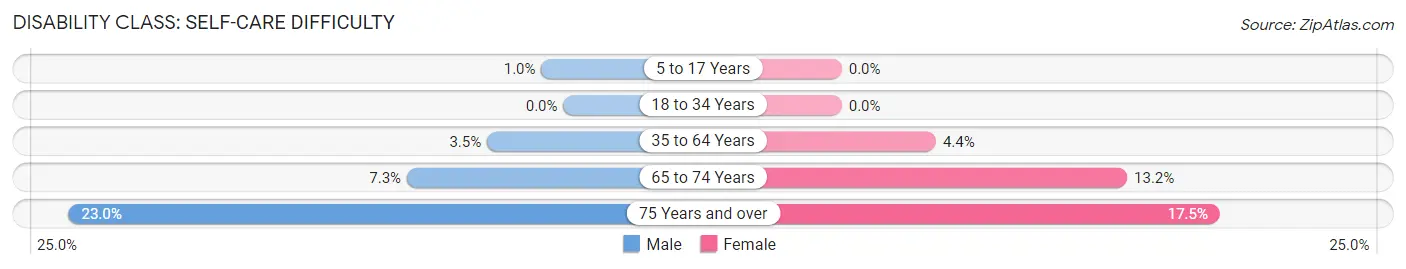
| Age Bracket | Male | Female |
| 5 to 17 Years | 23 (1.0%) | 0 (0.0%) |
| 18 to 34 Years | 0 (0.0%) | 0 (0.0%) |
| 35 to 64 Years | 177 (3.5%) | 267 (4.4%) |
| 65 to 74 Years | 126 (7.3%) | 293 (13.2%) |
| 75 Years and over | 219 (23.0%) | 270 (17.5%) |
Technology Access in Williamsburg County
Computing Device Access in Williamsburg County
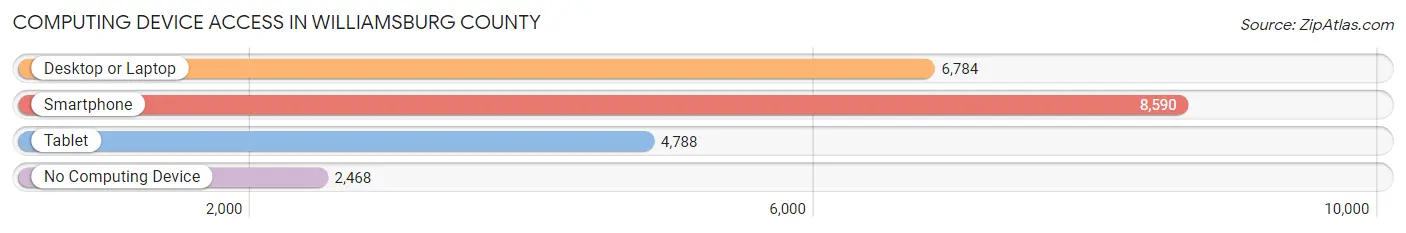
| Device Type | # Households | % Households |
| Desktop or Laptop | 6,784 | 56.5% |
| Smartphone | 8,590 | 71.6% |
| Tablet | 4,788 | 39.9% |
| No Computing Device | 2,468 | 20.6% |
| Total | 11,999 | 100.0% |
Internet Access in Williamsburg County
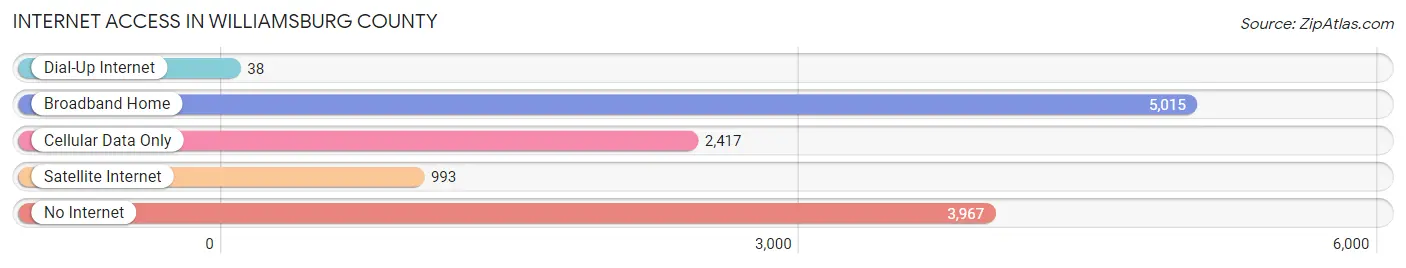
| Internet Type | # Households | % Households |
| Dial-Up Internet | 38 | 0.3% |
| Broadband Home | 5,015 | 41.8% |
| Cellular Data Only | 2,417 | 20.1% |
| Satellite Internet | 993 | 8.3% |
| No Internet | 3,967 | 33.1% |
| Total | 11,999 | 100.0% |
Williamsburg County Summary
Williamsburg County is located in the eastern part of South Carolina, in the United States. It is bordered by Florence County to the north, Clarendon County to the east, Georgetown County to the south, and Marion County to the west. The county seat is Kingstree, and the largest city is Hemingway. The county was created in 1785 and named for William III of England.
Geography
Williamsburg County covers an area of 845 square miles, making it the fourth-largest county in South Carolina. The terrain is mostly flat, with some rolling hills in the northern part of the county. The Black River forms the western border of the county, and the Great Pee Dee River forms the eastern border. The county is mostly rural, with small towns and villages scattered throughout. The climate is humid subtropical, with hot, humid summers and mild winters.
Demographics
As of the 2010 census, Williamsburg County had a population of 34,423. The racial makeup of the county was 57.3% African American, 38.7% White, 0.4% Native American, 0.3% Asian, 0.1% Pacific Islander, 2.2% from other races, and 1.1% from two or more races. Hispanic or Latino of any race were 3.7% of the population.
The median income for a household in the county was $30,945, and the median income for a family was $37,945. The per capita income for the county was $15,845. About 22.2% of families and 26.2% of the population were below the poverty line, including 36.2% of those under age 18 and 22.2% of those age 65 or over.
Economy
Williamsburg County's economy is largely based on agriculture. The county is home to several large farms, which produce cotton, soybeans, corn, and other crops. The county also has a thriving timber industry, with several sawmills and wood-processing plants. Manufacturing is also an important part of the economy, with several factories producing furniture, textiles, and other products.
The county is also home to several tourist attractions, including the Williamsburg County Museum, the Williamsburg County Historical Society, and the Williamsburg County Courthouse. The county is also home to several golf courses, parks, and other recreational areas.
History
Williamsburg County was created in 1785 and named for William III of England. The county was originally part of the colonial Province of South Carolina, and was later part of the state of South Carolina. The county was largely rural until the late 19th century, when the lumber and timber industries began to develop. The county was also home to several large plantations, which produced cotton, rice, and other crops.
During the Civil War, Williamsburg County was the site of several battles, including the Battle of King's Tree in 1865. After the war, the county's economy shifted to agriculture, and the timber and lumber industries continued to grow. The county also became a popular tourist destination, with several resorts and recreational areas.
Today, Williamsburg County is a largely rural county, with a population of 34,423. The county is home to several large farms, timber and lumber companies, and manufacturing plants. The county is also home to several tourist attractions, including the Williamsburg County Museum, the Williamsburg County Historical Society, and the Williamsburg County Courthouse.
Common Questions
What is Per Capita Income in Williamsburg County?
Per Capita income in Williamsburg County is $22,946.
What is the Median Family Income in Williamsburg County?
Median Family Income in Williamsburg County is $55,781.
What is the Median Household income in Williamsburg County?
Median Household Income in Williamsburg County is $40,848.
What is Income or Wage Gap in Williamsburg County?
Income or Wage Gap in Williamsburg County is 15.9%.
Women in Williamsburg County earn 84.1 cents for every dollar earned by a man.
What is Family Income Deficit in Williamsburg County?
Family Income Deficit in Williamsburg County is $10,790.
Families that are below poverty line in Williamsburg County earn $10,790 less on average than the poverty threshold level.
What is Inequality or Gini Index in Williamsburg County?
Inequality or Gini Index in Williamsburg County is 0.49.
What is the Total Population of Williamsburg County?
Total Population of Williamsburg County is 30,879.
What is the Total Male Population of Williamsburg County?
Total Male Population of Williamsburg County is 15,038.
What is the Total Female Population of Williamsburg County?
Total Female Population of Williamsburg County is 15,841.
What is the Ratio of Males per 100 Females in Williamsburg County?
There are 94.93 Males per 100 Females in Williamsburg County.
What is the Ratio of Females per 100 Males in Williamsburg County?
There are 105.34 Females per 100 Males in Williamsburg County.
What is the Median Population Age in Williamsburg County?
Median Population Age in Williamsburg County is 43.2 Years.
What is the Average Family Size in Williamsburg County
Average Family Size in Williamsburg County is 3.3 People.
What is the Average Household Size in Williamsburg County
Average Household Size in Williamsburg County is 2.4 People.
How Large is the Labor Force in Williamsburg County?
There are 12,618 People in the Labor Forcein in Williamsburg County.
What is the Percentage of People in the Labor Force in Williamsburg County?
49.3% of People are in the Labor Force in Williamsburg County.
What is the Unemployment Rate in Williamsburg County?
Unemployment Rate in Williamsburg County is 4.5%.