Newberry County, SC Map & Demographics
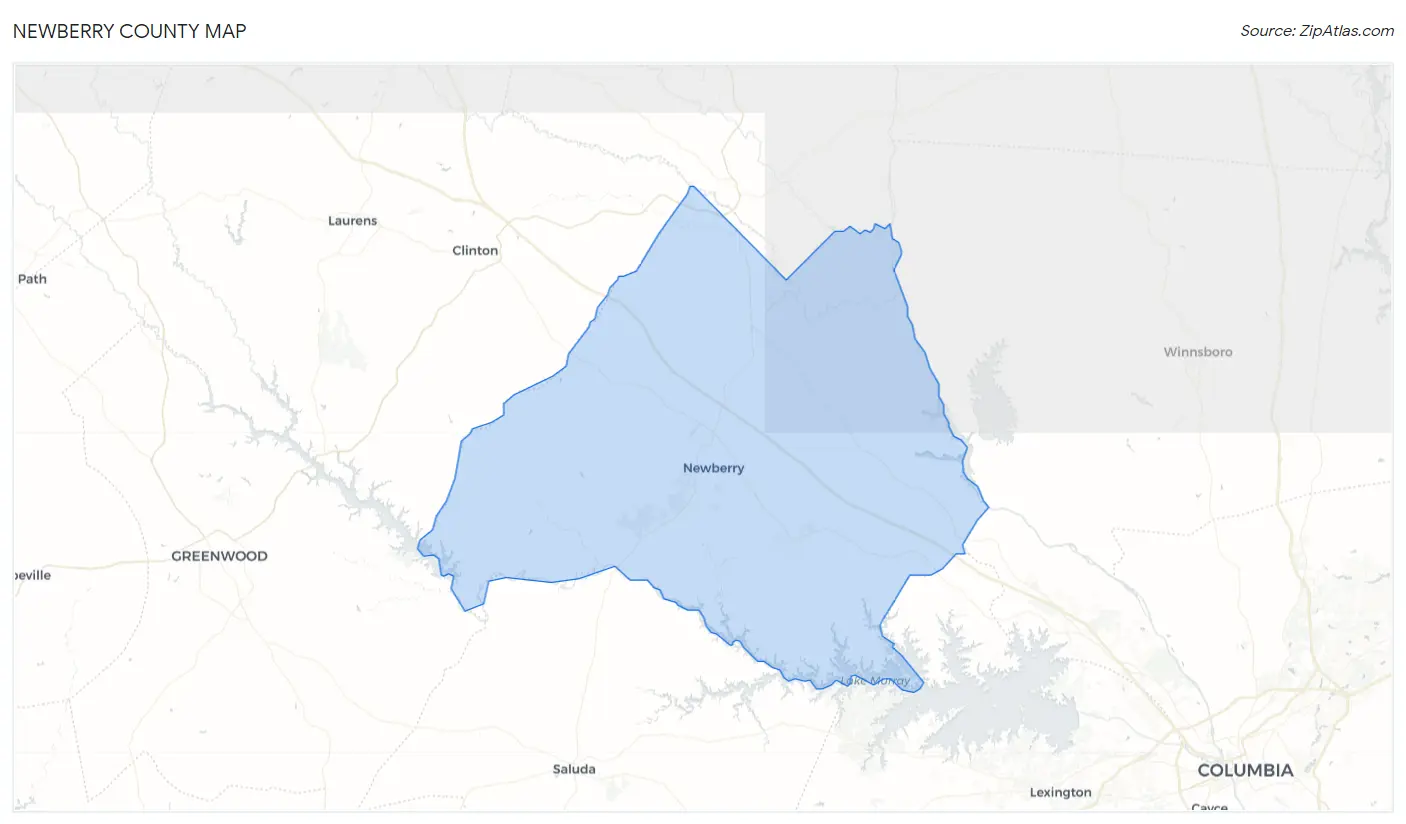
Newberry County Map
Newberry County Overview
$32,251
PER CAPITA INCOME
$69,906
AVG FAMILY INCOME
$56,706
AVG HOUSEHOLD INCOME
9.6%
WAGE / INCOME GAP [ % ]
90.4¢/ $1
WAGE / INCOME GAP [ $ ]
$10,371
FAMILY INCOME DEFICIT
0.46
INEQUALITY / GINI INDEX
37,918
TOTAL POPULATION
18,569
MALE POPULATION
19,349
FEMALE POPULATION
95.97
MALES / 100 FEMALES
104.20
FEMALES / 100 MALES
42.6
MEDIAN AGE
3.0
AVG FAMILY SIZE
2.4
AVG HOUSEHOLD SIZE
17,695
LABOR FORCE [ PEOPLE ]
57.6%
PERCENT IN LABOR FORCE
3.9%
UNEMPLOYMENT RATE
Income in Newberry County
Income Overview in Newberry County
Per Capita Income in Newberry County is $32,251, while median incomes of families and households are $69,906 and $56,706 respectively.
| Characteristic | Number | Measure |
| Per Capita Income | 37,918 | $32,251 |
| Median Family Income | 10,273 | $69,906 |
| Mean Family Income | 10,273 | $90,725 |
| Median Household Income | 15,027 | $56,706 |
| Mean Household Income | 15,027 | $76,846 |
| Income Deficit | 10,273 | $10,371 |
| Wage / Income Gap (%) | 37,918 | 9.55% |
| Wage / Income Gap ($) | 37,918 | 90.45¢ per $1 |
| Gini / Inequality Index | 37,918 | 0.46 |
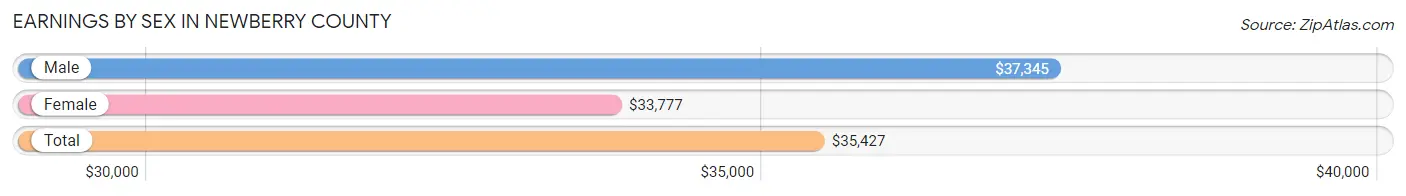
Earnings by Sex in Newberry County
Average Earnings in Newberry County are $35,427, $37,345 for men and $33,777 for women, a difference of 9.6%.
| Sex | Number | Average Earnings |
| Male | 10,278 (54.0%) | $37,345 |
| Female | 8,751 (46.0%) | $33,777 |
| Total | 19,029 (100.0%) | $35,427 |
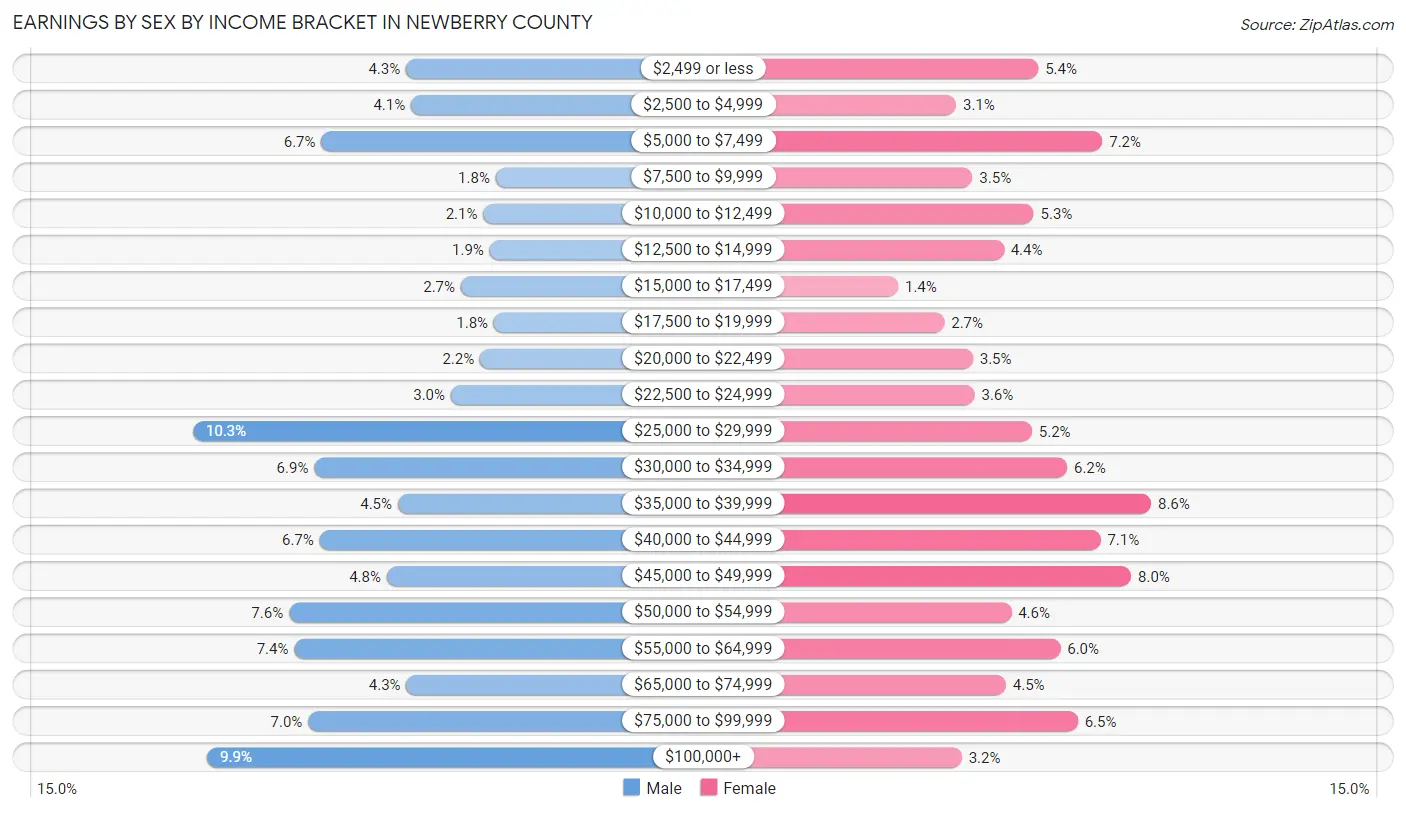
Earnings by Sex by Income Bracket in Newberry County
The most common earnings brackets in Newberry County are $25,000 to $29,999 for men (1,056 | 10.3%) and $35,000 to $39,999 for women (748 | 8.6%).
| Income | Male | Female |
| $2,499 or less | 440 (4.3%) | 471 (5.4%) |
| $2,500 to $4,999 | 426 (4.1%) | 269 (3.1%) |
| $5,000 to $7,499 | 685 (6.7%) | 628 (7.2%) |
| $7,500 to $9,999 | 181 (1.8%) | 309 (3.5%) |
| $10,000 to $12,499 | 217 (2.1%) | 459 (5.2%) |
| $12,500 to $14,999 | 198 (1.9%) | 386 (4.4%) |
| $15,000 to $17,499 | 282 (2.7%) | 126 (1.4%) |
| $17,500 to $19,999 | 186 (1.8%) | 240 (2.7%) |
| $20,000 to $22,499 | 226 (2.2%) | 310 (3.5%) |
| $22,500 to $24,999 | 310 (3.0%) | 314 (3.6%) |
| $25,000 to $29,999 | 1,056 (10.3%) | 455 (5.2%) |
| $30,000 to $34,999 | 705 (6.9%) | 542 (6.2%) |
| $35,000 to $39,999 | 464 (4.5%) | 748 (8.6%) |
| $40,000 to $44,999 | 690 (6.7%) | 624 (7.1%) |
| $45,000 to $49,999 | 495 (4.8%) | 699 (8.0%) |
| $50,000 to $54,999 | 778 (7.6%) | 404 (4.6%) |
| $55,000 to $64,999 | 763 (7.4%) | 525 (6.0%) |
| $65,000 to $74,999 | 439 (4.3%) | 391 (4.5%) |
| $75,000 to $99,999 | 723 (7.0%) | 568 (6.5%) |
| $100,000+ | 1,014 (9.9%) | 283 (3.2%) |
| Total | 10,278 (100.0%) | 8,751 (100.0%) |
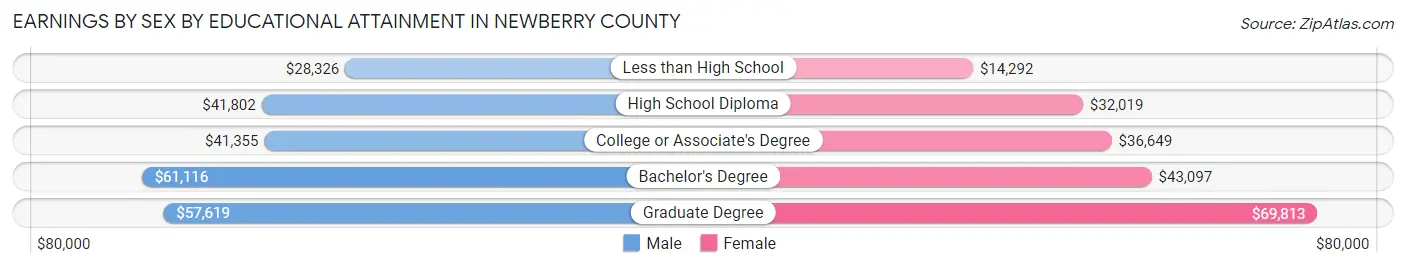
Earnings by Sex by Educational Attainment in Newberry County
Average earnings in Newberry County are $43,954 for men and $37,467 for women, a difference of 14.8%. Men with an educational attainment of bachelor's degree enjoy the highest average annual earnings of $61,116, while those with less than high school education earn the least with $28,326. Women with an educational attainment of graduate degree earn the most with the average annual earnings of $69,813, while those with less than high school education have the smallest earnings of $14,292.
| Educational Attainment | Male Income | Female Income |
| Less than High School | $28,326 | $14,292 |
| High School Diploma | $41,802 | $32,019 |
| College or Associate's Degree | $41,355 | $36,649 |
| Bachelor's Degree | $61,116 | $43,097 |
| Graduate Degree | $57,619 | $69,813 |
| Total | $43,954 | $37,467 |
Family Income in Newberry County
Family Income Brackets in Newberry County
According to the Newberry County family income data, there are 2,250 families falling into the $50,000 to $74,999 income range, which is the most common income bracket and makes up 21.9% of all families. Conversely, the less than $10,000 income bracket is the least frequent group with only 318 families (3.1%) belonging to this category.
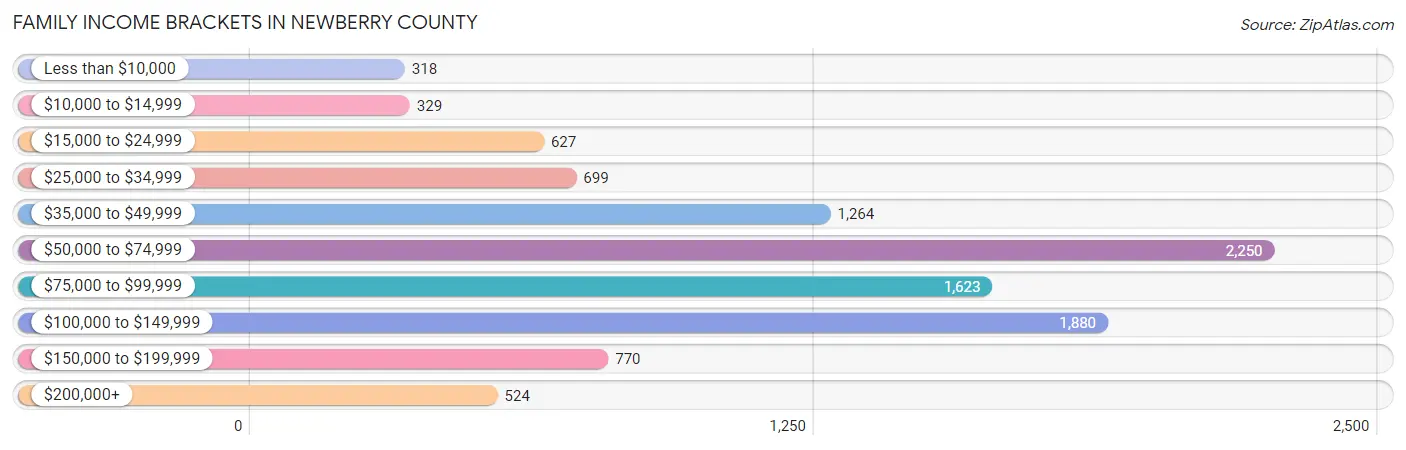
| Income Bracket | # Families | % Families |
| Less than $10,000 | 318 | 3.1% |
| $10,000 to $14,999 | 329 | 3.2% |
| $15,000 to $24,999 | 627 | 6.1% |
| $25,000 to $34,999 | 699 | 6.8% |
| $35,000 to $49,999 | 1,264 | 12.3% |
| $50,000 to $74,999 | 2,250 | 21.9% |
| $75,000 to $99,999 | 1,623 | 15.8% |
| $100,000 to $149,999 | 1,880 | 18.3% |
| $150,000 to $199,999 | 770 | 7.5% |
| $200,000+ | 524 | 5.1% |
Family Income by Famaliy Size in Newberry County
7+ person families (77 | 0.7%) account for the highest median family income in Newberry County with $120,625 per family, while 2-person families (5,252 | 51.1%) have the highest median income of $33,827 per family member.
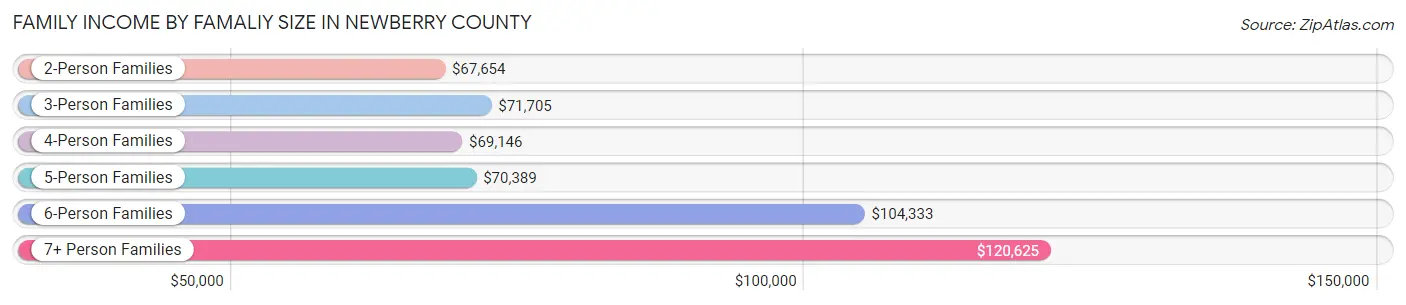
| Income Bracket | # Families | Median Income |
| 2-Person Families | 5,252 (51.1%) | $67,654 |
| 3-Person Families | 2,303 (22.4%) | $71,705 |
| 4-Person Families | 1,587 (15.4%) | $69,146 |
| 5-Person Families | 918 (8.9%) | $70,389 |
| 6-Person Families | 136 (1.3%) | $104,333 |
| 7+ Person Families | 77 (0.7%) | $120,625 |
| Total | 10,273 (100.0%) | $69,906 |
Family Income by Number of Earners in Newberry County
The median family income in Newberry County is $69,906, with families comprising 3+ earners (980) having the highest median family income of $119,688, while families with no earners (1,806) have the lowest median family income of $42,583, accounting for 9.5% and 17.6% of families, respectively.
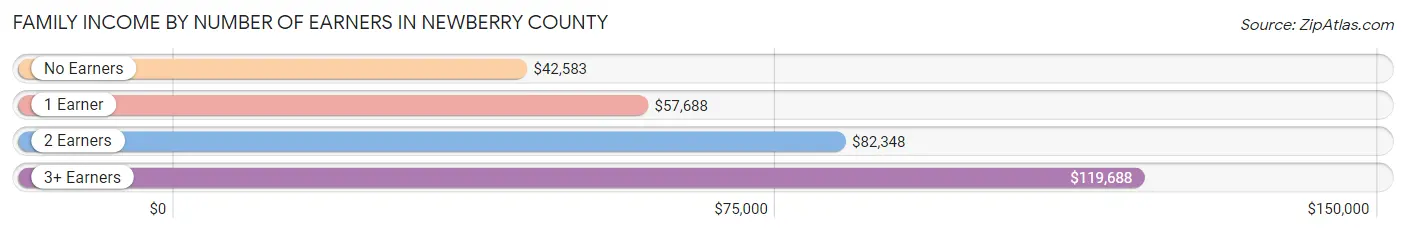
| Number of Earners | # Families | Median Income |
| No Earners | 1,806 (17.6%) | $42,583 |
| 1 Earner | 3,223 (31.4%) | $57,688 |
| 2 Earners | 4,264 (41.5%) | $82,348 |
| 3+ Earners | 980 (9.5%) | $119,688 |
| Total | 10,273 (100.0%) | $69,906 |
Household Income in Newberry County
Household Income Brackets in Newberry County
With 2,975 households falling in the category, the $50,000 to $74,999 income range is the most frequent in Newberry County, accounting for 19.8% of all households. In contrast, only 631 households (4.2%) fall into the $200,000+ income bracket, making it the least populous group.
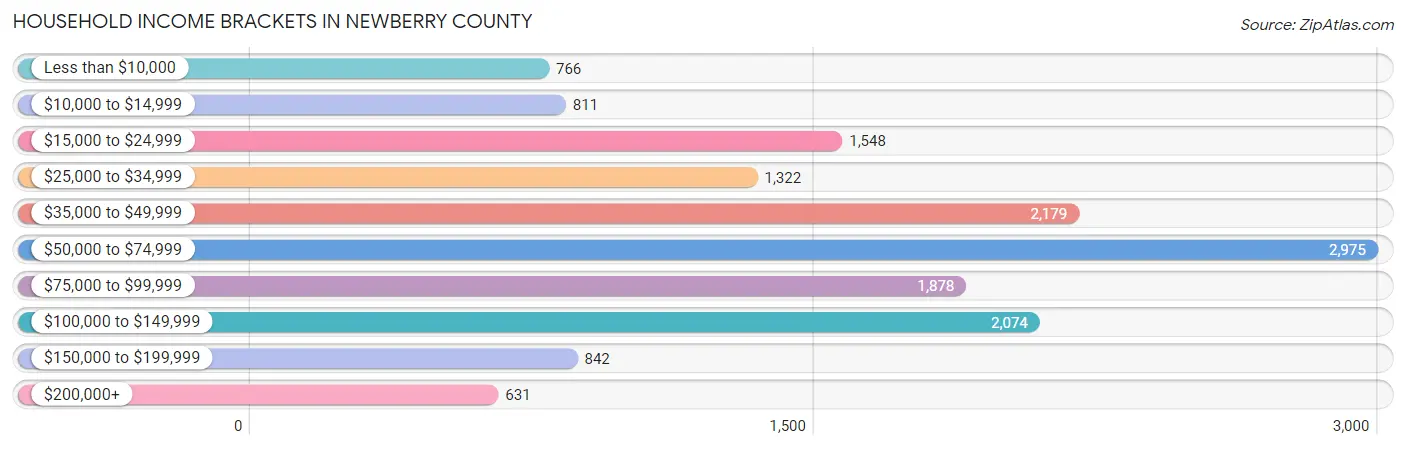
| Income Bracket | # Households | % Households |
| Less than $10,000 | 766 | 5.1% |
| $10,000 to $14,999 | 811 | 5.4% |
| $15,000 to $24,999 | 1,548 | 10.3% |
| $25,000 to $34,999 | 1,322 | 8.8% |
| $35,000 to $49,999 | 2,179 | 14.5% |
| $50,000 to $74,999 | 2,975 | 19.8% |
| $75,000 to $99,999 | 1,878 | 12.5% |
| $100,000 to $149,999 | 2,074 | 13.8% |
| $150,000 to $199,999 | 842 | 5.6% |
| $200,000+ | 631 | 4.2% |
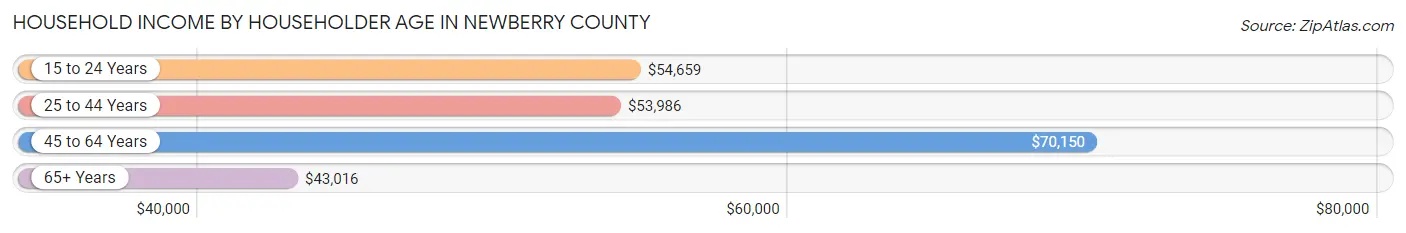
Household Income by Householder Age in Newberry County
The median household income in Newberry County is $56,706, with the highest median household income of $70,150 found in the 45 to 64 years age bracket for the primary householder. A total of 5,454 households (36.3%) fall into this category. Meanwhile, the 65+ years age bracket for the primary householder has the lowest median household income of $43,016, with 4,812 households (32.0%) in this group.
| Income Bracket | # Households | Median Income |
| 15 to 24 Years | 493 (3.3%) | $54,659 |
| 25 to 44 Years | 4,268 (28.4%) | $53,986 |
| 45 to 64 Years | 5,454 (36.3%) | $70,150 |
| 65+ Years | 4,812 (32.0%) | $43,016 |
| Total | 15,027 (100.0%) | $56,706 |
Poverty in Newberry County
Income Below Poverty by Sex and Age in Newberry County
With 14.0% poverty level for males and 17.0% for females among the residents of Newberry County, 5 year old males and 6 to 11 year old females are the most vulnerable to poverty, with 20 males (31.2%) and 544 females (39.0%) in their respective age groups living below the poverty level.
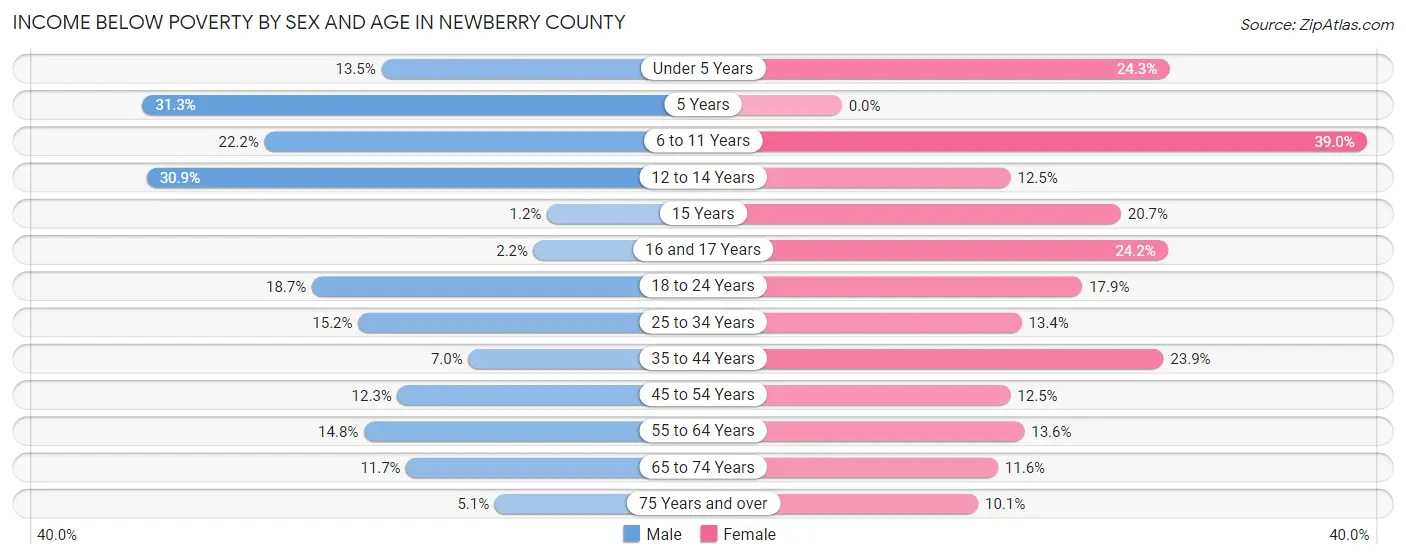
| Age Bracket | Male | Female |
| Under 5 Years | 128 (13.5%) | 269 (24.3%) |
| 5 Years | 20 (31.2%) | 0 (0.0%) |
| 6 to 11 Years | 285 (22.2%) | 544 (39.0%) |
| 12 to 14 Years | 309 (30.9%) | 91 (12.5%) |
| 15 Years | 2 (1.2%) | 63 (20.7%) |
| 16 and 17 Years | 10 (2.2%) | 103 (24.2%) |
| 18 to 24 Years | 298 (18.7%) | 262 (17.8%) |
| 25 to 34 Years | 325 (15.2%) | 270 (13.4%) |
| 35 to 44 Years | 134 (7.0%) | 481 (23.9%) |
| 45 to 54 Years | 290 (12.3%) | 296 (12.5%) |
| 55 to 64 Years | 389 (14.8%) | 378 (13.6%) |
| 65 to 74 Years | 251 (11.7%) | 271 (11.6%) |
| 75 Years and over | 60 (5.1%) | 170 (10.1%) |
| Total | 2,501 (14.0%) | 3,198 (17.0%) |
Income Above Poverty by Sex and Age in Newberry County
According to the poverty statistics in Newberry County, males aged 15 years and females aged 5 years are the age groups that are most secure financially, with 98.8% of males and 100.0% of females in these age groups living above the poverty line.
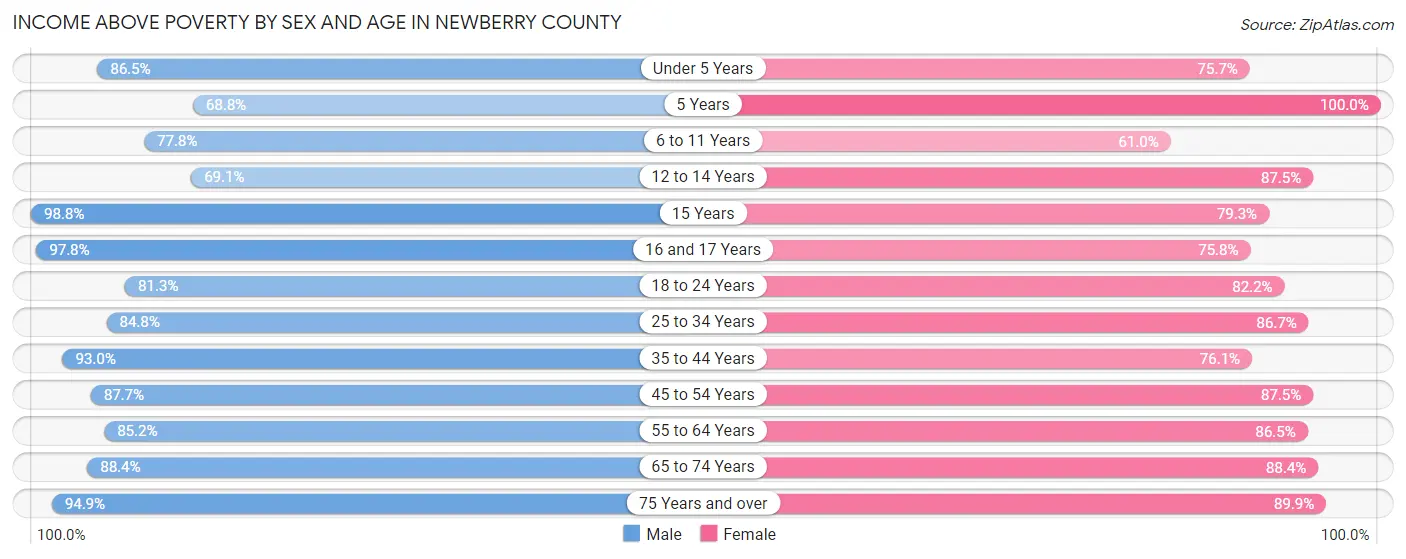
| Age Bracket | Male | Female |
| Under 5 Years | 820 (86.5%) | 838 (75.7%) |
| 5 Years | 44 (68.8%) | 145 (100.0%) |
| 6 to 11 Years | 1,000 (77.8%) | 852 (61.0%) |
| 12 to 14 Years | 690 (69.1%) | 635 (87.5%) |
| 15 Years | 164 (98.8%) | 241 (79.3%) |
| 16 and 17 Years | 447 (97.8%) | 323 (75.8%) |
| 18 to 24 Years | 1,299 (81.3%) | 1,206 (82.2%) |
| 25 to 34 Years | 1,811 (84.8%) | 1,753 (86.7%) |
| 35 to 44 Years | 1,770 (93.0%) | 1,533 (76.1%) |
| 45 to 54 Years | 2,068 (87.7%) | 2,069 (87.5%) |
| 55 to 64 Years | 2,242 (85.2%) | 2,412 (86.5%) |
| 65 to 74 Years | 1,903 (88.3%) | 2,068 (88.4%) |
| 75 Years and over | 1,124 (94.9%) | 1,510 (89.9%) |
| Total | 15,382 (86.0%) | 15,585 (83.0%) |
Income Below Poverty Among Married-Couple Families in Newberry County
The poverty statistics for married-couple families in Newberry County show that 3.3% or 235 of the total 7,226 families live below the poverty line. Families with 5 or more children have the highest poverty rate of 46.2%, comprising of 18 families. On the other hand, families with 3 or 4 children have the lowest poverty rate of 0.2%, which includes 1 families.
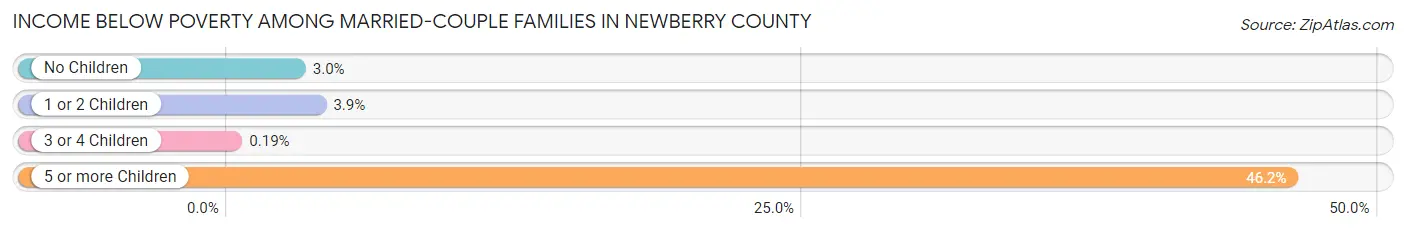
| Children | Above Poverty | Below Poverty |
| No Children | 4,401 (97.1%) | 134 (2.9%) |
| 1 or 2 Children | 2,049 (96.2%) | 82 (3.8%) |
| 3 or 4 Children | 520 (99.8%) | 1 (0.2%) |
| 5 or more Children | 21 (53.8%) | 18 (46.2%) |
| Total | 6,991 (96.8%) | 235 (3.3%) |
Income Below Poverty Among Single-Parent Households in Newberry County
According to the poverty data in Newberry County, 15.9% or 132 single-father households and 32.5% or 719 single-mother households are living below the poverty line. Among single-father households, those with no children have the highest poverty rate, with 82 households (19.5%) experiencing poverty. Likewise, among single-mother households, those with 3 or 4 children have the highest poverty rate, with 156 households (71.6%) falling below the poverty line.
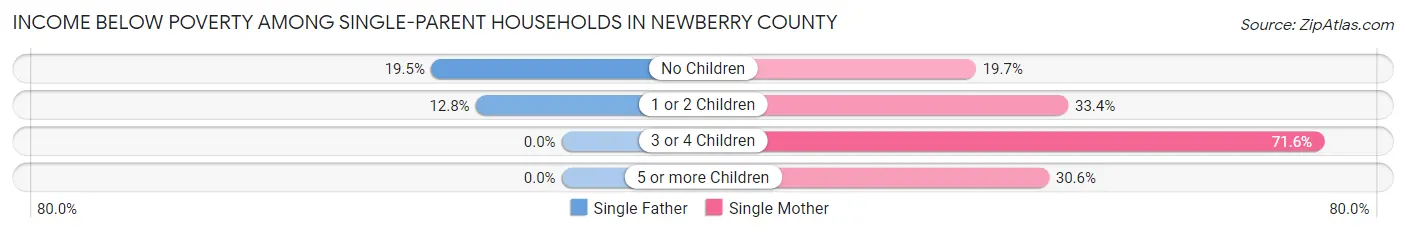
| Children | Single Father | Single Mother |
| No Children | 82 (19.5%) | 148 (19.7%) |
| 1 or 2 Children | 50 (12.8%) | 404 (33.4%) |
| 3 or 4 Children | 0 (0.0%) | 156 (71.6%) |
| 5 or more Children | 0 (0.0%) | 11 (30.6%) |
| Total | 132 (15.9%) | 719 (32.5%) |
Income Below Poverty Among Married-Couple vs Single-Parent Households in Newberry County
The poverty data for Newberry County shows that 235 of the married-couple family households (3.3%) and 851 of the single-parent households (27.9%) are living below the poverty level. Within the married-couple family households, those with 5 or more children have the highest poverty rate, with 18 households (46.2%) falling below the poverty line. Among the single-parent households, those with 3 or 4 children have the highest poverty rate, with 156 household (65.0%) living below poverty.
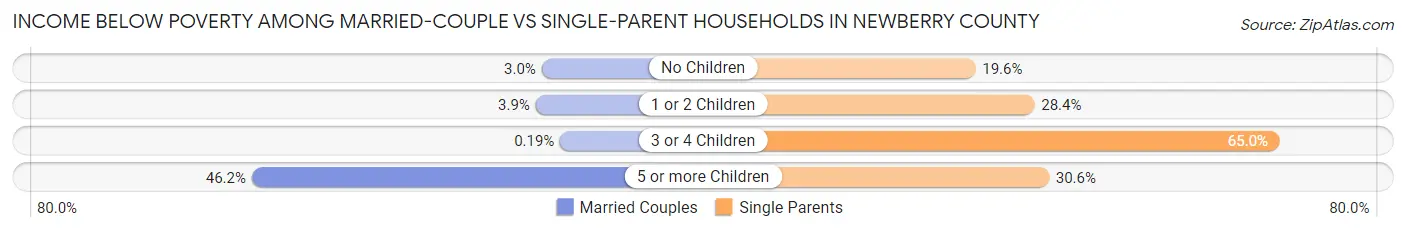
| Children | Married-Couple Families | Single-Parent Households |
| No Children | 134 (2.9%) | 230 (19.6%) |
| 1 or 2 Children | 82 (3.8%) | 454 (28.4%) |
| 3 or 4 Children | 1 (0.2%) | 156 (65.0%) |
| 5 or more Children | 18 (46.2%) | 11 (30.6%) |
| Total | 235 (3.3%) | 851 (27.9%) |
Race in Newberry County
The most populous races in Newberry County are White / Caucasian (23,411 | 61.7%), Black / African American (11,420 | 30.1%), and Hispanic or Latino (3,083 | 8.1%).
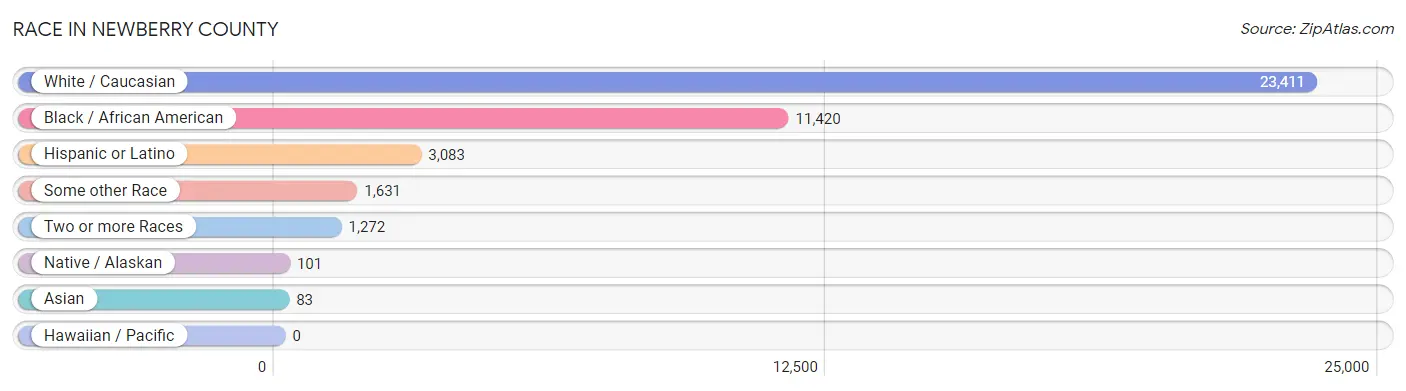
| Race | # Population | % Population |
| Asian | 83 | 0.2% |
| Black / African American | 11,420 | 30.1% |
| Hawaiian / Pacific | 0 | 0.0% |
| Hispanic or Latino | 3,083 | 8.1% |
| Native / Alaskan | 101 | 0.3% |
| White / Caucasian | 23,411 | 61.7% |
| Two or more Races | 1,272 | 3.4% |
| Some other Race | 1,631 | 4.3% |
| Total | 37,918 | 100.0% |
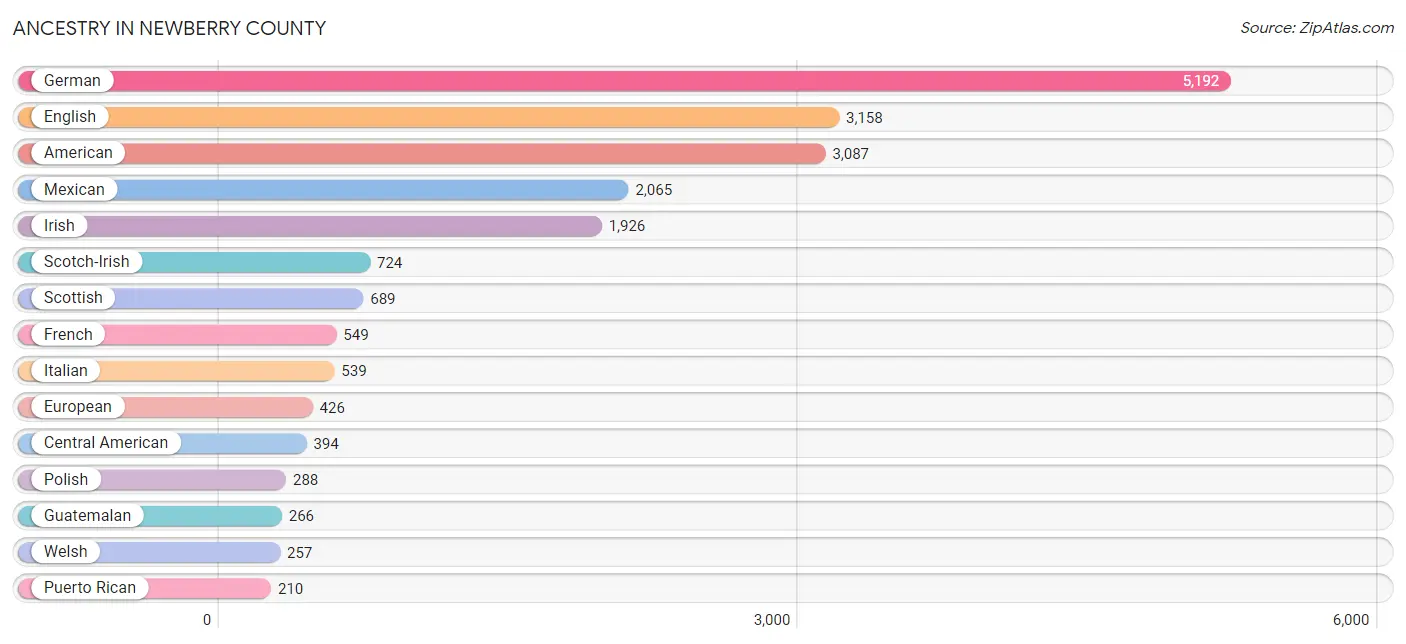
Ancestry in Newberry County
The most populous ancestries reported in Newberry County are German (5,192 | 13.7%), English (3,158 | 8.3%), American (3,087 | 8.1%), Mexican (2,065 | 5.4%), and Irish (1,926 | 5.1%), together accounting for 40.7% of all Newberry County residents.
| Ancestry | # Population | % Population |
| African | 90 | 0.2% |
| American | 3,087 | 8.1% |
| Arab | 149 | 0.4% |
| Australian | 25 | 0.1% |
| Austrian | 6 | 0.0% |
| Bangladeshi | 16 | 0.0% |
| Bhutanese | 4 | 0.0% |
| Brazilian | 77 | 0.2% |
| British | 209 | 0.5% |
| Canadian | 92 | 0.2% |
| Cape Verdean | 18 | 0.1% |
| Central American | 394 | 1.0% |
| Cherokee | 60 | 0.2% |
| Chilean | 38 | 0.1% |
| Chippewa | 20 | 0.1% |
| Costa Rican | 20 | 0.1% |
| Creek | 2 | 0.0% |
| Cuban | 1 | 0.0% |
| Czech | 89 | 0.2% |
| Czechoslovakian | 2 | 0.0% |
| Danish | 1 | 0.0% |
| Dutch | 139 | 0.4% |
| Eastern European | 31 | 0.1% |
| Egyptian | 133 | 0.4% |
| English | 3,158 | 8.3% |
| European | 426 | 1.1% |
| French | 549 | 1.5% |
| French Canadian | 74 | 0.2% |
| German | 5,192 | 13.7% |
| Greek | 20 | 0.1% |
| Guatemalan | 266 | 0.7% |
| Honduran | 75 | 0.2% |
| Hungarian | 14 | 0.0% |
| Icelander | 3 | 0.0% |
| Indian (Asian) | 8 | 0.0% |
| Irish | 1,926 | 5.1% |
| Italian | 539 | 1.4% |
| Jamaican | 7 | 0.0% |
| Korean | 80 | 0.2% |
| Lebanese | 8 | 0.0% |
| Malaysian | 9 | 0.0% |
| Mexican | 2,065 | 5.4% |
| Mexican American Indian | 20 | 0.1% |
| Native Hawaiian | 3 | 0.0% |
| Navajo | 3 | 0.0% |
| New Zealander | 1 | 0.0% |
| Nigerian | 116 | 0.3% |
| Northern European | 7 | 0.0% |
| Norwegian | 52 | 0.1% |
| Polish | 288 | 0.8% |
| Portuguese | 83 | 0.2% |
| Puerto Rican | 210 | 0.5% |
| Russian | 20 | 0.1% |
| Salvadoran | 33 | 0.1% |
| Samoan | 15 | 0.0% |
| Scandinavian | 49 | 0.1% |
| Scotch-Irish | 724 | 1.9% |
| Scottish | 689 | 1.8% |
| Serbian | 16 | 0.0% |
| Slavic | 6 | 0.0% |
| Slovak | 6 | 0.0% |
| Slovene | 4 | 0.0% |
| South American | 98 | 0.3% |
| Spaniard | 58 | 0.2% |
| Spanish | 9 | 0.0% |
| Sri Lankan | 3 | 0.0% |
| Subsaharan African | 206 | 0.5% |
| Swedish | 66 | 0.2% |
| Swiss | 38 | 0.1% |
| Syrian | 8 | 0.0% |
| Ukrainian | 20 | 0.1% |
| Venezuelan | 60 | 0.2% |
| Welsh | 257 | 0.7% |
| Yugoslavian | 6 | 0.0% | View All 74 Rows |
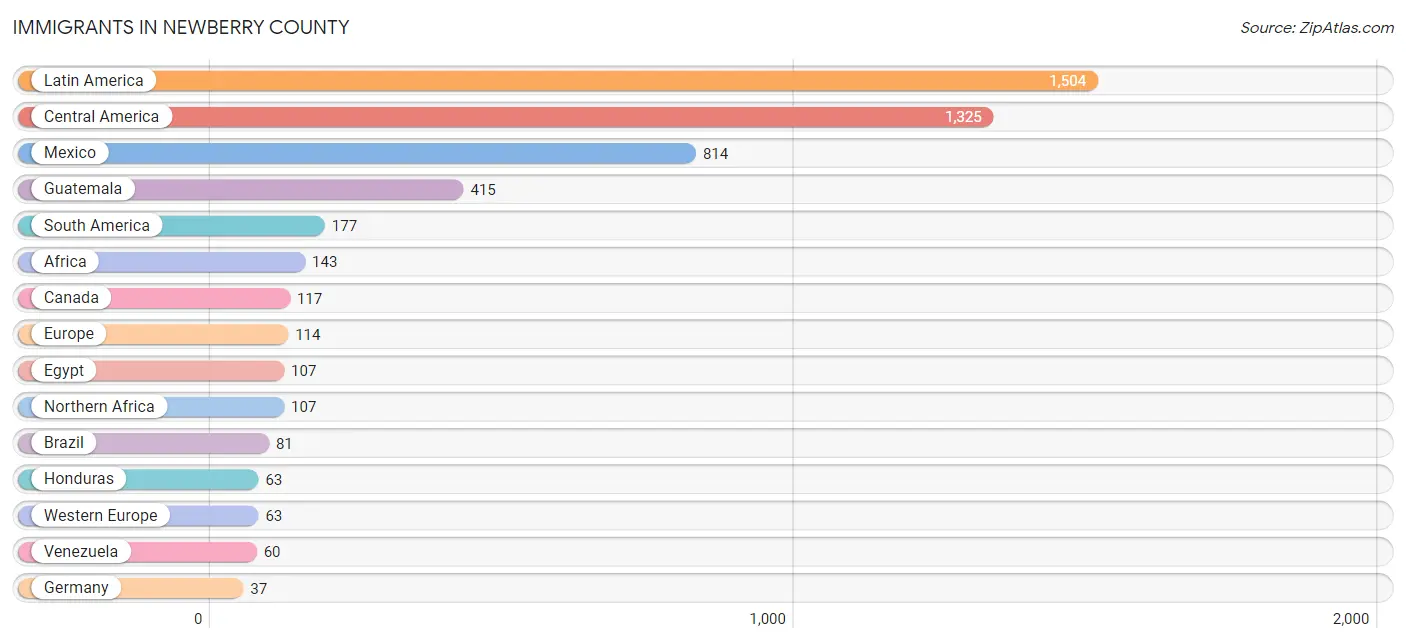
Immigrants in Newberry County
The most numerous immigrant groups reported in Newberry County came from Latin America (1,504 | 4.0%), Central America (1,325 | 3.5%), Mexico (814 | 2.1%), Guatemala (415 | 1.1%), and South America (177 | 0.5%), together accounting for 11.2% of all Newberry County residents.
| Immigration Origin | # Population | % Population |
| Africa | 143 | 0.4% |
| Argentina | 20 | 0.1% |
| Asia | 12 | 0.0% |
| Australia | 25 | 0.1% |
| Brazil | 81 | 0.2% |
| Canada | 117 | 0.3% |
| Caribbean | 2 | 0.0% |
| Central America | 1,325 | 3.5% |
| Chile | 16 | 0.0% |
| China | 8 | 0.0% |
| Costa Rica | 20 | 0.1% |
| Cuba | 1 | 0.0% |
| Eastern Asia | 12 | 0.0% |
| Egypt | 107 | 0.3% |
| El Salvador | 13 | 0.0% |
| England | 17 | 0.0% |
| Europe | 114 | 0.3% |
| France | 11 | 0.0% |
| Germany | 37 | 0.1% |
| Greece | 6 | 0.0% |
| Guatemala | 415 | 1.1% |
| Honduras | 63 | 0.2% |
| Jamaica | 1 | 0.0% |
| Japan | 4 | 0.0% |
| Latin America | 1,504 | 4.0% |
| Mexico | 814 | 2.1% |
| Netherlands | 15 | 0.0% |
| Nigeria | 17 | 0.0% |
| Northern Africa | 107 | 0.3% |
| Northern Europe | 17 | 0.0% |
| Oceania | 25 | 0.1% |
| South America | 177 | 0.5% |
| Southern Europe | 34 | 0.1% |
| Spain | 28 | 0.1% |
| Venezuela | 60 | 0.2% |
| Western Africa | 17 | 0.0% |
| Western Europe | 63 | 0.2% | View All 37 Rows |
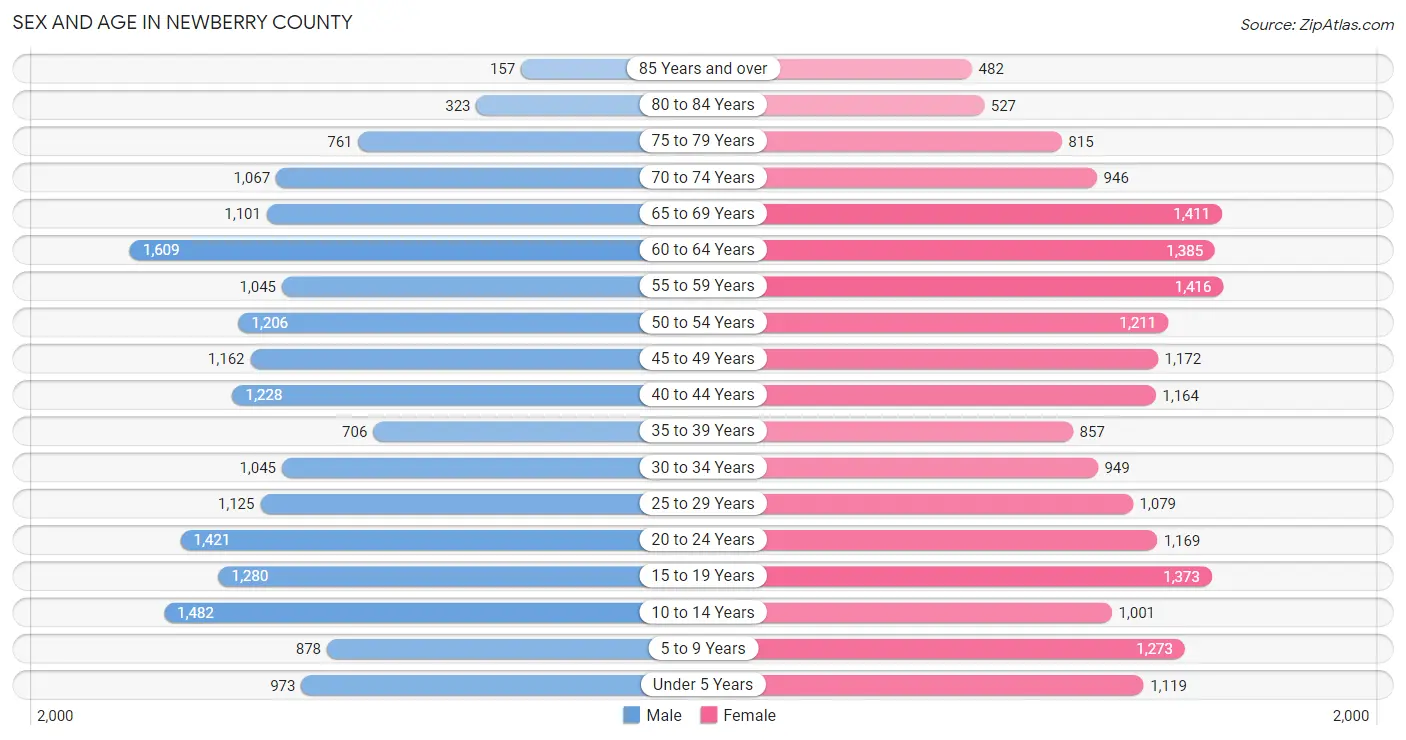
Sex and Age in Newberry County
Sex and Age in Newberry County
The most populous age groups in Newberry County are 60 to 64 Years (1,609 | 8.7%) for men and 55 to 59 Years (1,416 | 7.3%) for women.
| Age Bracket | Male | Female |
| Under 5 Years | 973 (5.2%) | 1,119 (5.8%) |
| 5 to 9 Years | 878 (4.7%) | 1,273 (6.6%) |
| 10 to 14 Years | 1,482 (8.0%) | 1,001 (5.2%) |
| 15 to 19 Years | 1,280 (6.9%) | 1,373 (7.1%) |
| 20 to 24 Years | 1,421 (7.6%) | 1,169 (6.0%) |
| 25 to 29 Years | 1,125 (6.1%) | 1,079 (5.6%) |
| 30 to 34 Years | 1,045 (5.6%) | 949 (4.9%) |
| 35 to 39 Years | 706 (3.8%) | 857 (4.4%) |
| 40 to 44 Years | 1,228 (6.6%) | 1,164 (6.0%) |
| 45 to 49 Years | 1,162 (6.3%) | 1,172 (6.1%) |
| 50 to 54 Years | 1,206 (6.5%) | 1,211 (6.3%) |
| 55 to 59 Years | 1,045 (5.6%) | 1,416 (7.3%) |
| 60 to 64 Years | 1,609 (8.7%) | 1,385 (7.2%) |
| 65 to 69 Years | 1,101 (5.9%) | 1,411 (7.3%) |
| 70 to 74 Years | 1,067 (5.8%) | 946 (4.9%) |
| 75 to 79 Years | 761 (4.1%) | 815 (4.2%) |
| 80 to 84 Years | 323 (1.7%) | 527 (2.7%) |
| 85 Years and over | 157 (0.9%) | 482 (2.5%) |
| Total | 18,569 (100.0%) | 19,349 (100.0%) |
Families and Households in Newberry County
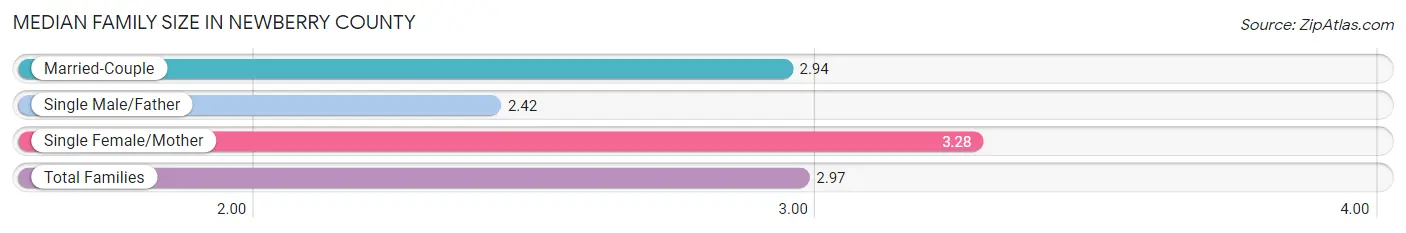
Median Family Size in Newberry County
The median family size in Newberry County is 2.97 persons per family, with single female/mother families (2,214 | 21.5%) accounting for the largest median family size of 3.28 persons per family. On the other hand, single male/father families (833 | 8.1%) represent the smallest median family size with 2.42 persons per family.
| Family Type | # Families | Family Size |
| Married-Couple | 7,226 (70.3%) | 2.94 |
| Single Male/Father | 833 (8.1%) | 2.42 |
| Single Female/Mother | 2,214 (21.5%) | 3.28 |
| Total Families | 10,273 (100.0%) | 2.97 |
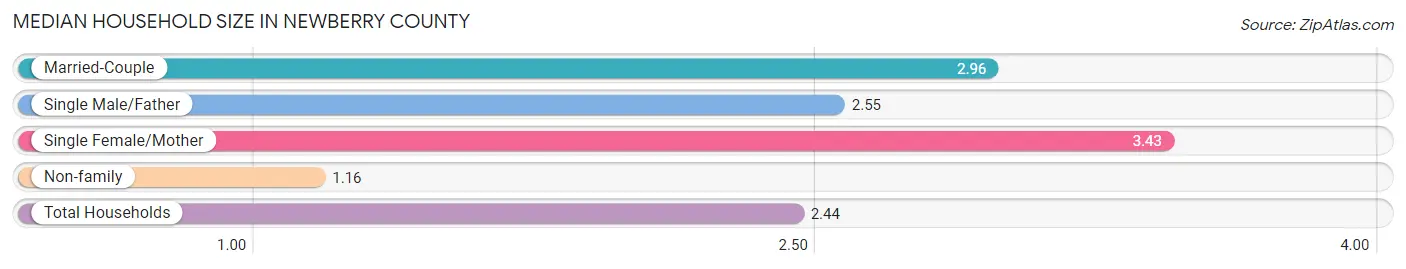
Median Household Size in Newberry County
The median household size in Newberry County is 2.44 persons per household, with single female/mother households (2,214 | 14.7%) accounting for the largest median household size of 3.43 persons per household. non-family households (4,754 | 31.6%) represent the smallest median household size with 1.16 persons per household.
| Household Type | # Households | Household Size |
| Married-Couple | 7,226 (48.1%) | 2.96 |
| Single Male/Father | 833 (5.5%) | 2.55 |
| Single Female/Mother | 2,214 (14.7%) | 3.43 |
| Non-family | 4,754 (31.6%) | 1.16 |
| Total Households | 15,027 (100.0%) | 2.44 |
Household Size by Marriage Status in Newberry County
Out of a total of 15,027 households in Newberry County, 10,273 (68.4%) are family households, while 4,754 (31.6%) are nonfamily households. The most numerous type of family households are 2-person households, comprising 4,909, and the most common type of nonfamily households are 1-person households, comprising 4,064.
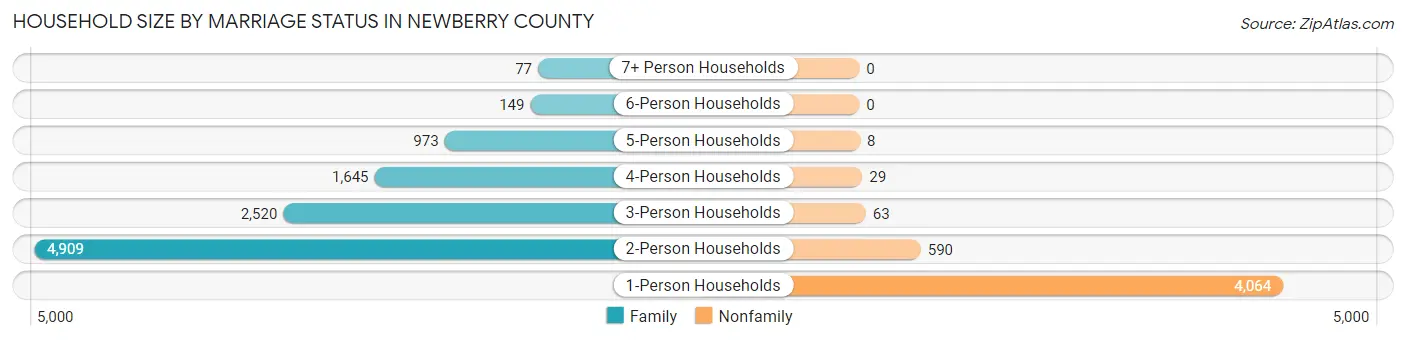
| Household Size | Family Households | Nonfamily Households |
| 1-Person Households | - | 4,064 (27.0%) |
| 2-Person Households | 4,909 (32.7%) | 590 (3.9%) |
| 3-Person Households | 2,520 (16.8%) | 63 (0.4%) |
| 4-Person Households | 1,645 (11.0%) | 29 (0.2%) |
| 5-Person Households | 973 (6.5%) | 8 (0.1%) |
| 6-Person Households | 149 (1.0%) | 0 (0.0%) |
| 7+ Person Households | 77 (0.5%) | 0 (0.0%) |
| Total | 10,273 (68.4%) | 4,754 (31.6%) |
Female Fertility in Newberry County
Fertility by Age in Newberry County
Average fertility rate in Newberry County is 69.0 births per 1,000 women. Women in the age bracket of 20 to 34 years have the highest fertility rate with 117.0 births per 1,000 women. Women in the age bracket of 20 to 34 years acount for 66.4% of all women with births.
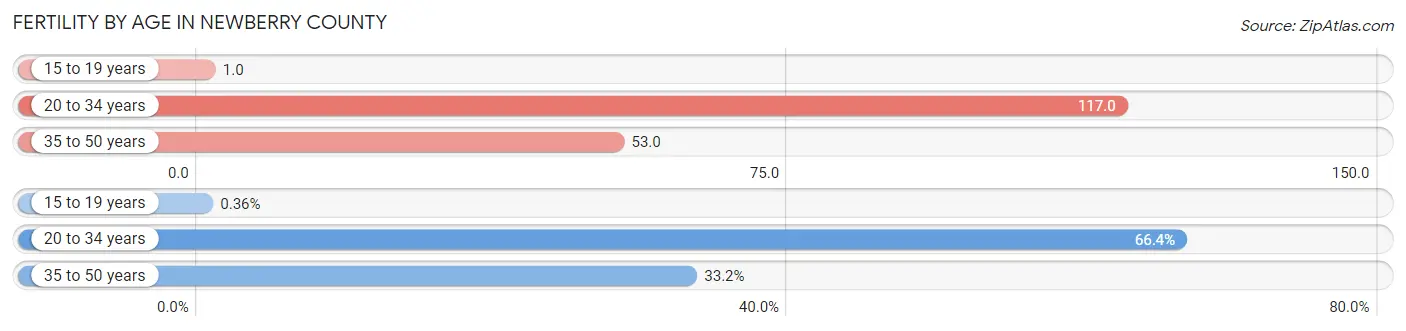
| Age Bracket | Women with Births | Births / 1,000 Women |
| 15 to 19 years | 2 (0.4%) | 1.0 |
| 20 to 34 years | 374 (66.4%) | 117.0 |
| 35 to 50 years | 187 (33.2%) | 53.0 |
| Total | 563 (100.0%) | 69.0 |
Fertility by Age by Marriage Status in Newberry County
69.4% of women with births (563) in Newberry County are married. The highest percentage of unmarried women with births falls into 15 to 19 years age bracket with 100.0% of them unmarried at the time of birth, while the lowest percentage of unmarried women with births belong to 35 to 50 years age bracket with 16.6% of them unmarried.
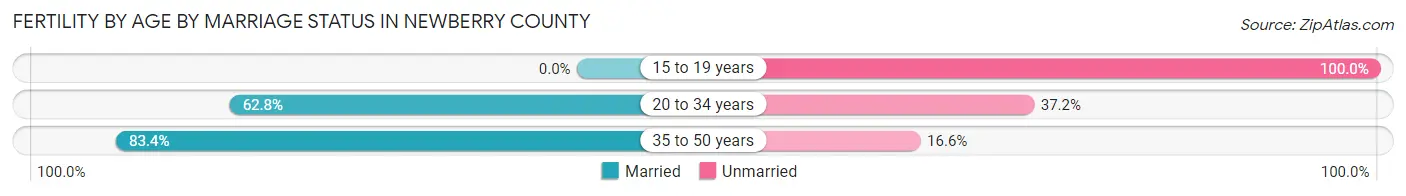
| Age Bracket | Married | Unmarried |
| 15 to 19 years | 0 (0.0%) | 2 (100.0%) |
| 20 to 34 years | 235 (62.8%) | 139 (37.2%) |
| 35 to 50 years | 156 (83.4%) | 31 (16.6%) |
| Total | 391 (69.5%) | 172 (30.5%) |
Fertility by Education in Newberry County
Average fertility rate in Newberry County is 69.0 births per 1,000 women. Women with the education attainment of college or associate's degree have the highest fertility rate of 115.0 births per 1,000 women, while women with the education attainment of bachelor's degree have the lowest fertility at 15.0 births per 1,000 women. Women with the education attainment of college or associate's degree represent 56.5% of all women with births.
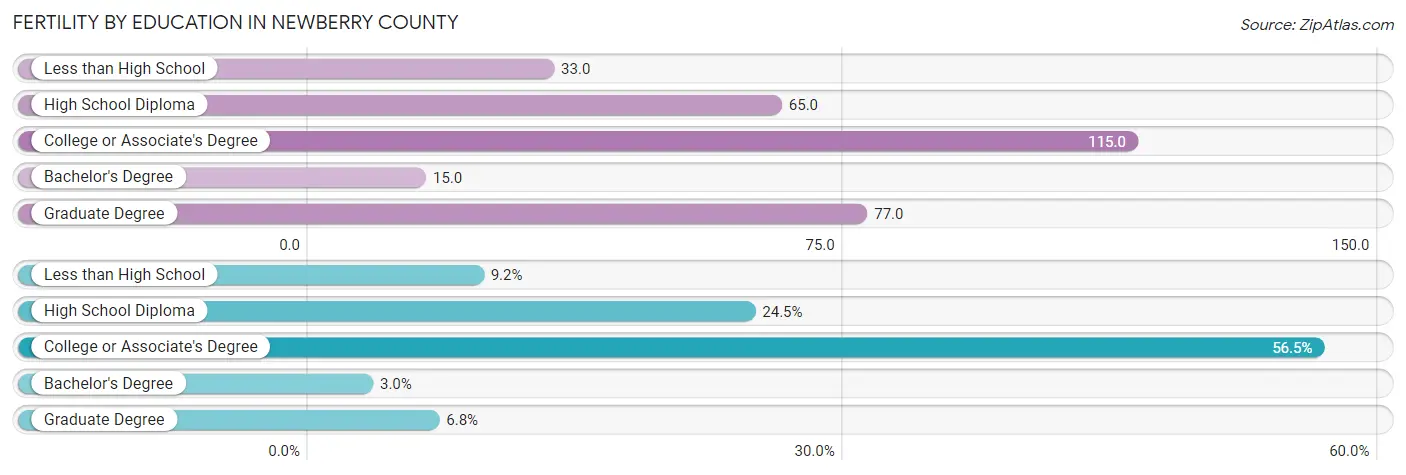
| Educational Attainment | Women with Births | Births / 1,000 Women |
| Less than High School | 52 (9.2%) | 33.0 |
| High School Diploma | 138 (24.5%) | 65.0 |
| College or Associate's Degree | 318 (56.5%) | 115.0 |
| Bachelor's Degree | 17 (3.0%) | 15.0 |
| Graduate Degree | 38 (6.8%) | 77.0 |
| Total | 563 (100.0%) | 69.0 |
Fertility by Education by Marriage Status in Newberry County
30.5% of women with births in Newberry County are unmarried. Women with the educational attainment of less than high school are most likely to be married with 100.0% of them married at childbirth, while women with the educational attainment of college or associate's degree are least likely to be married with 46.9% of them unmarried at childbirth.
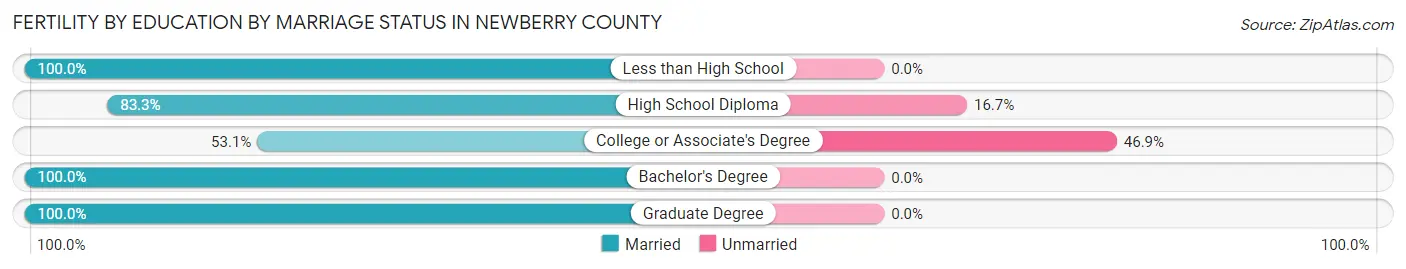
| Educational Attainment | Married | Unmarried |
| Less than High School | 52 (100.0%) | 0 (0.0%) |
| High School Diploma | 115 (83.3%) | 23 (16.7%) |
| College or Associate's Degree | 169 (53.1%) | 149 (46.9%) |
| Bachelor's Degree | 17 (100.0%) | 0 (0.0%) |
| Graduate Degree | 38 (100.0%) | 0 (0.0%) |
| Total | 391 (69.5%) | 172 (30.5%) |
Employment Characteristics in Newberry County
Employment by Class of Employer in Newberry County
Among the 16,467 employed individuals in Newberry County, private company employees (10,592 | 64.3%), not-for-profit organizations (1,609 | 9.8%), and local government employees (1,429 | 8.7%) make up the most common classes of employment.
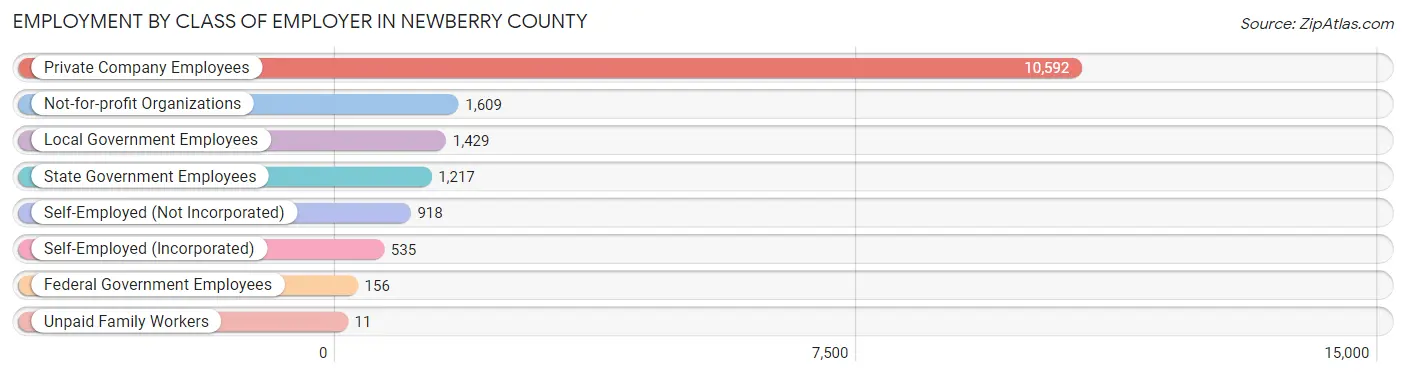
| Employer Class | # Employees | % Employees |
| Private Company Employees | 10,592 | 64.3% |
| Self-Employed (Incorporated) | 535 | 3.3% |
| Self-Employed (Not Incorporated) | 918 | 5.6% |
| Not-for-profit Organizations | 1,609 | 9.8% |
| Local Government Employees | 1,429 | 8.7% |
| State Government Employees | 1,217 | 7.4% |
| Federal Government Employees | 156 | 0.9% |
| Unpaid Family Workers | 11 | 0.1% |
| Total | 16,467 | 100.0% |
Employment Status by Age in Newberry County
According to the labor force statistics for Newberry County, out of the total population over 16 years of age (30,720), 57.6% or 17,695 individuals are in the labor force, with 3.9% or 690 of them unemployed. The age group with the highest labor force participation rate is 25 to 29 years, with 87.6% or 1,931 individuals in the labor force. Within the labor force, the 16 to 19 years age range has the highest percentage of unemployed individuals, with 12.5% or 78 of them being unemployed.
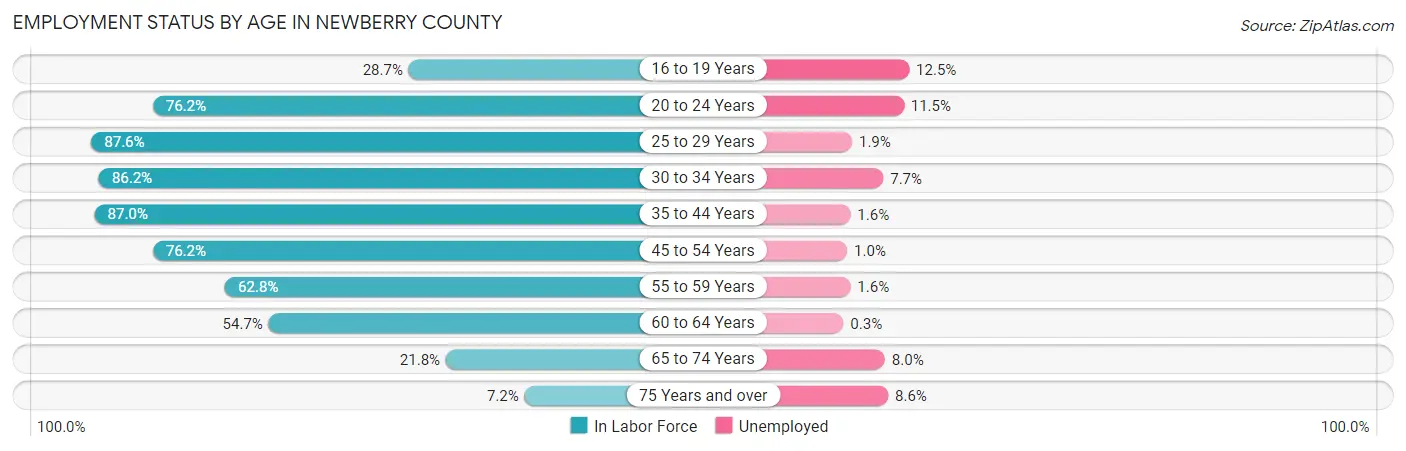
| Age Bracket | In Labor Force | Unemployed |
| 16 to 19 Years | 626 (28.7%) | 78 (12.5%) |
| 20 to 24 Years | 1,974 (76.2%) | 227 (11.5%) |
| 25 to 29 Years | 1,931 (87.6%) | 37 (1.9%) |
| 30 to 34 Years | 1,719 (86.2%) | 132 (7.7%) |
| 35 to 44 Years | 3,441 (87.0%) | 55 (1.6%) |
| 45 to 54 Years | 3,620 (76.2%) | 36 (1.0%) |
| 55 to 59 Years | 1,546 (62.8%) | 25 (1.6%) |
| 60 to 64 Years | 1,638 (54.7%) | 5 (0.3%) |
| 65 to 74 Years | 986 (21.8%) | 79 (8.0%) |
| 75 Years and over | 221 (7.2%) | 19 (8.6%) |
| Total | 17,695 (57.6%) | 690 (3.9%) |
Employment Status by Educational Attainment in Newberry County
According to labor force statistics for Newberry County, 75.7% of individuals (13,898) out of the total population between 25 and 64 years of age (18,359) are in the labor force, with 2.1% or 292 of them being unemployed. The group with the highest labor force participation rate are those with the educational attainment of college / associate degree, with 81.8% or 4,922 individuals in the labor force. Within the labor force, individuals with high school diploma education have the highest percentage of unemployment, with 3.0% or 122 of them being unemployed.
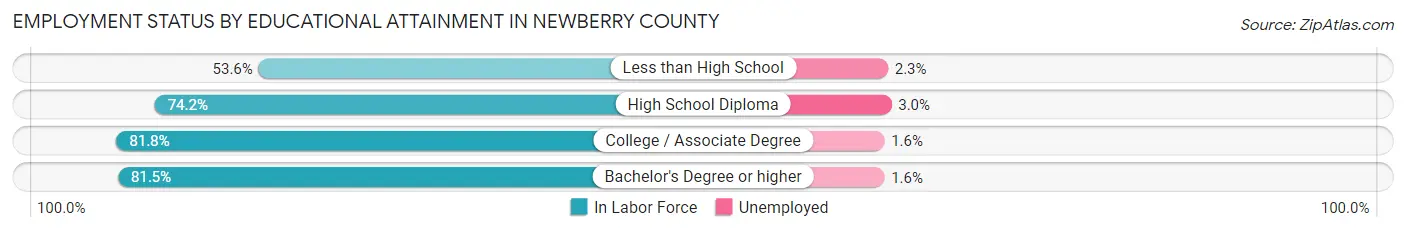
| Educational Attainment | In Labor Force | Unemployed |
| Less than High School | 1,315 (53.6%) | 56 (2.3%) |
| High School Diploma | 4,059 (74.2%) | 164 (3.0%) |
| College / Associate Degree | 4,922 (81.8%) | 96 (1.6%) |
| Bachelor's Degree or higher | 3,601 (81.5%) | 71 (1.6%) |
| Total | 13,898 (75.7%) | 386 (2.1%) |
Employment Occupations by Sex in Newberry County
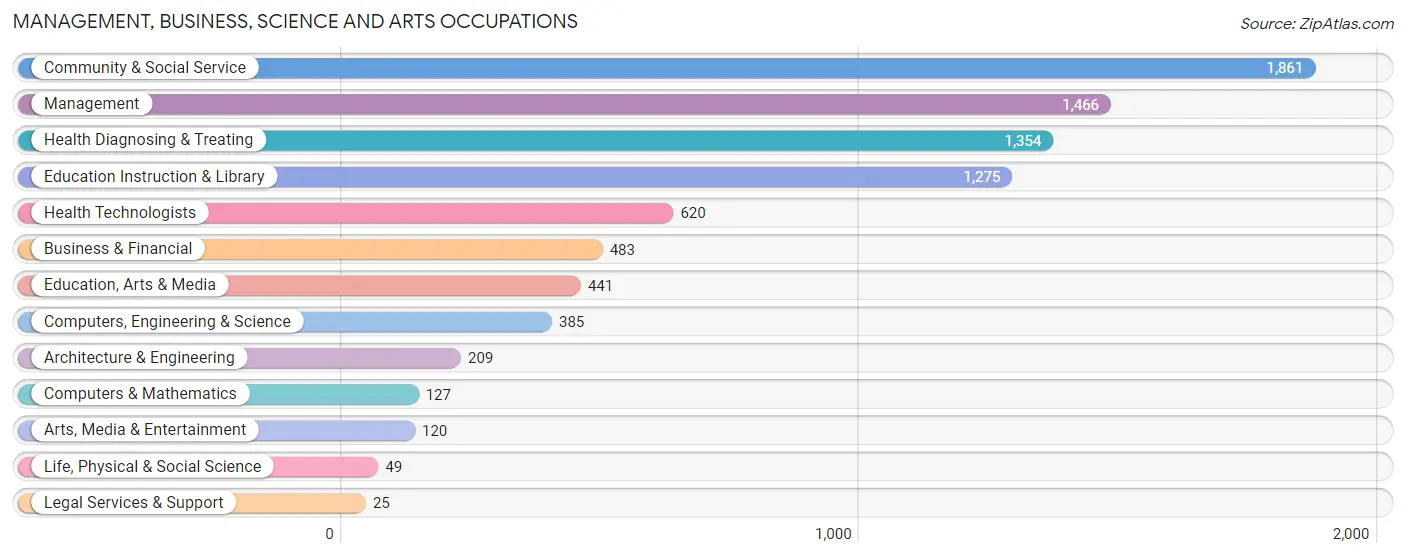
Management, Business, Science and Arts Occupations
The most common Management, Business, Science and Arts occupations in Newberry County are Community & Social Service (1,861 | 11.0%), Management (1,466 | 8.6%), Health Diagnosing & Treating (1,354 | 8.0%), Education Instruction & Library (1,275 | 7.5%), and Health Technologists (620 | 3.6%).
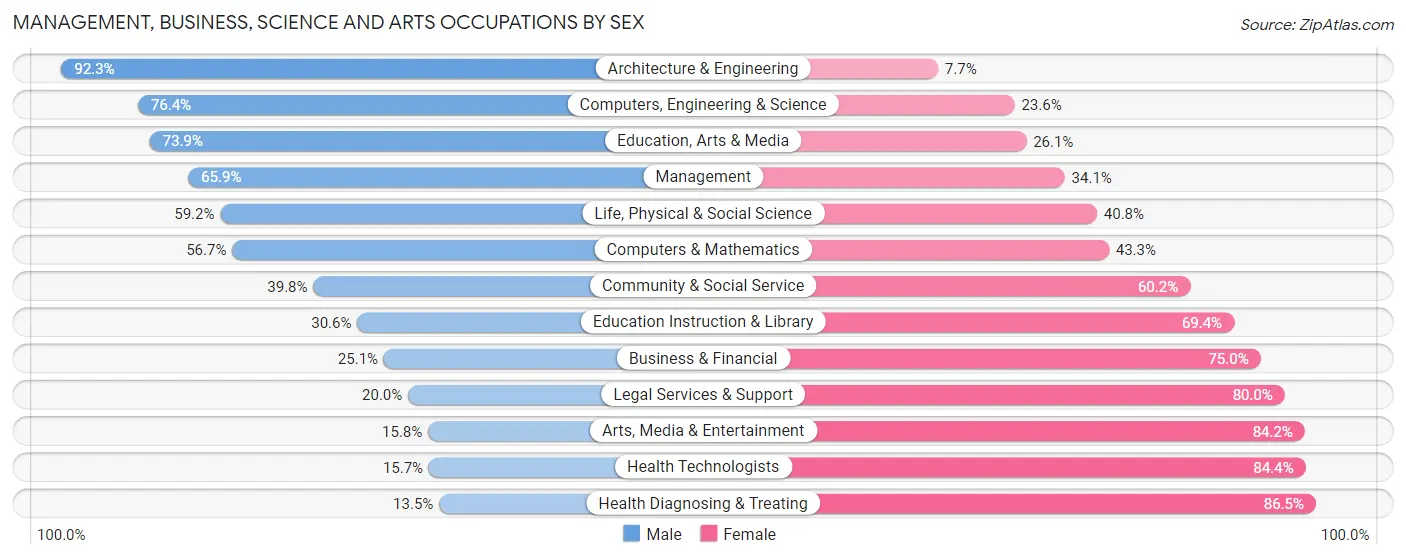
Management, Business, Science and Arts Occupations by Sex
Within the Management, Business, Science and Arts occupations in Newberry County, the most male-oriented occupations are Architecture & Engineering (92.3%), Computers, Engineering & Science (76.4%), and Education, Arts & Media (73.9%), while the most female-oriented occupations are Health Diagnosing & Treating (86.5%), Health Technologists (84.4%), and Arts, Media & Entertainment (84.2%).
| Occupation | Male | Female |
| Management | 966 (65.9%) | 500 (34.1%) |
| Business & Financial | 121 (25.1%) | 362 (75.0%) |
| Computers, Engineering & Science | 294 (76.4%) | 91 (23.6%) |
| Computers & Mathematics | 72 (56.7%) | 55 (43.3%) |
| Architecture & Engineering | 193 (92.3%) | 16 (7.7%) |
| Life, Physical & Social Science | 29 (59.2%) | 20 (40.8%) |
| Community & Social Service | 740 (39.8%) | 1,121 (60.2%) |
| Education, Arts & Media | 326 (73.9%) | 115 (26.1%) |
| Legal Services & Support | 5 (20.0%) | 20 (80.0%) |
| Education Instruction & Library | 390 (30.6%) | 885 (69.4%) |
| Arts, Media & Entertainment | 19 (15.8%) | 101 (84.2%) |
| Health Diagnosing & Treating | 183 (13.5%) | 1,171 (86.5%) |
| Health Technologists | 97 (15.7%) | 523 (84.4%) |
| Total (Category) | 2,304 (41.5%) | 3,245 (58.5%) |
| Total (Overall) | 9,151 (53.9%) | 7,815 (46.1%) |
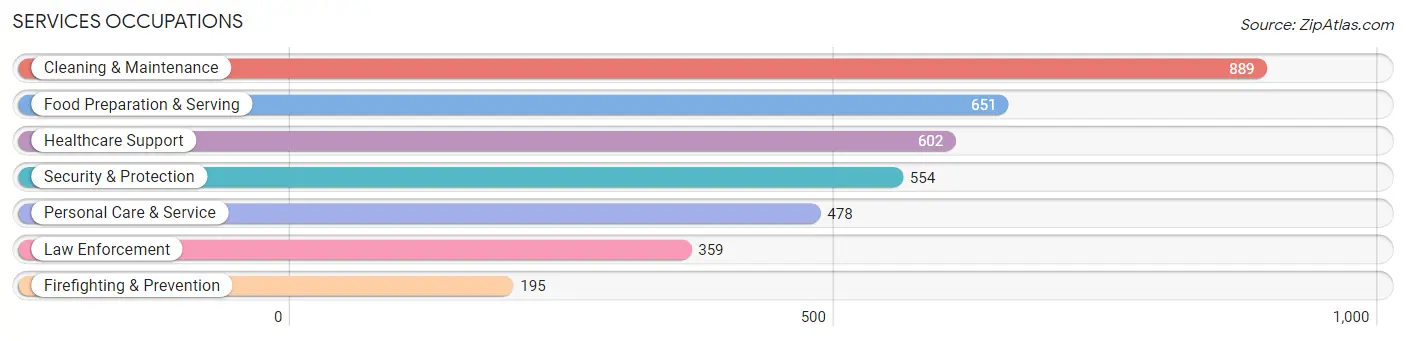
Services Occupations
The most common Services occupations in Newberry County are Cleaning & Maintenance (889 | 5.2%), Food Preparation & Serving (651 | 3.8%), Healthcare Support (602 | 3.5%), Security & Protection (554 | 3.3%), and Personal Care & Service (478 | 2.8%).
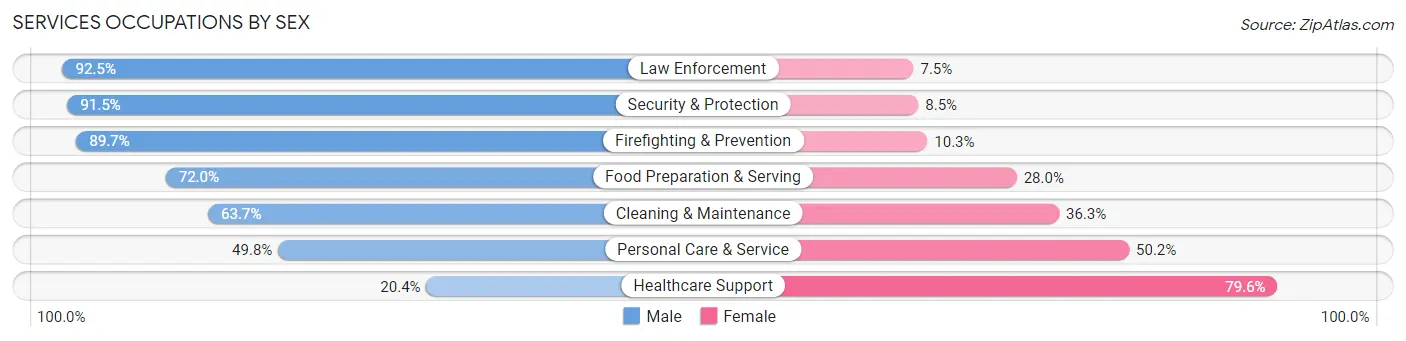
Services Occupations by Sex
Within the Services occupations in Newberry County, the most male-oriented occupations are Law Enforcement (92.5%), Security & Protection (91.5%), and Firefighting & Prevention (89.7%), while the most female-oriented occupations are Healthcare Support (79.6%), Personal Care & Service (50.2%), and Cleaning & Maintenance (36.3%).
| Occupation | Male | Female |
| Healthcare Support | 123 (20.4%) | 479 (79.6%) |
| Security & Protection | 507 (91.5%) | 47 (8.5%) |
| Firefighting & Prevention | 175 (89.7%) | 20 (10.3%) |
| Law Enforcement | 332 (92.5%) | 27 (7.5%) |
| Food Preparation & Serving | 469 (72.0%) | 182 (28.0%) |
| Cleaning & Maintenance | 566 (63.7%) | 323 (36.3%) |
| Personal Care & Service | 238 (49.8%) | 240 (50.2%) |
| Total (Category) | 1,903 (60.0%) | 1,271 (40.0%) |
| Total (Overall) | 9,151 (53.9%) | 7,815 (46.1%) |
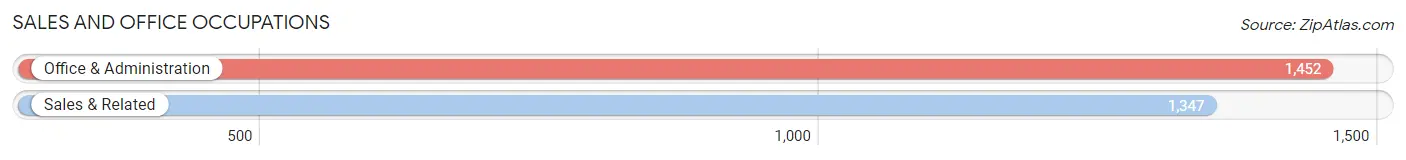
Sales and Office Occupations
The most common Sales and Office occupations in Newberry County are Office & Administration (1,452 | 8.6%), and Sales & Related (1,347 | 7.9%).
Sales and Office Occupations by Sex
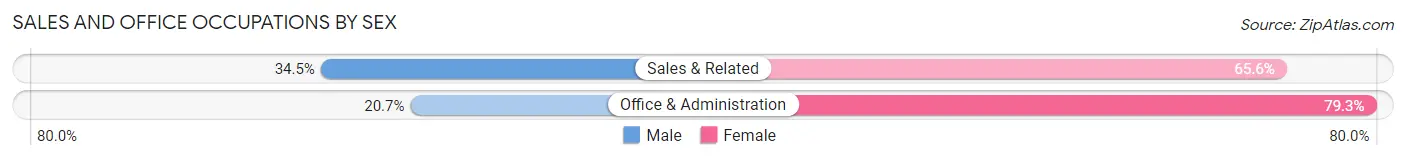
| Occupation | Male | Female |
| Sales & Related | 464 (34.4%) | 883 (65.5%) |
| Office & Administration | 300 (20.7%) | 1,152 (79.3%) |
| Total (Category) | 764 (27.3%) | 2,035 (72.7%) |
| Total (Overall) | 9,151 (53.9%) | 7,815 (46.1%) |
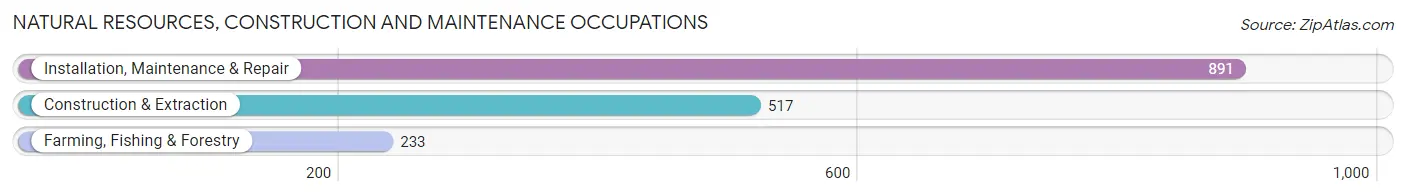
Natural Resources, Construction and Maintenance Occupations
The most common Natural Resources, Construction and Maintenance occupations in Newberry County are Installation, Maintenance & Repair (891 | 5.2%), Construction & Extraction (517 | 3.0%), and Farming, Fishing & Forestry (233 | 1.4%).
Natural Resources, Construction and Maintenance Occupations by Sex
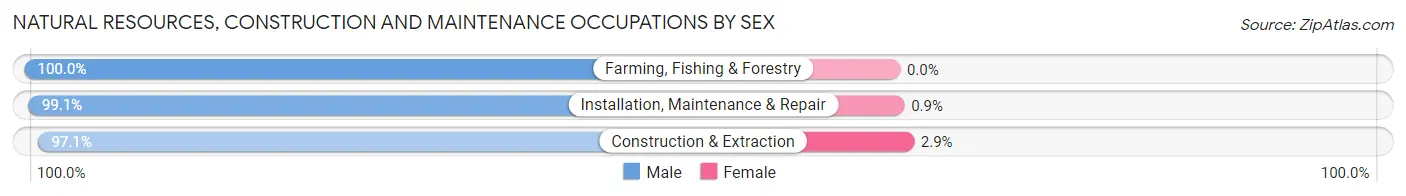
| Occupation | Male | Female |
| Farming, Fishing & Forestry | 233 (100.0%) | 0 (0.0%) |
| Construction & Extraction | 502 (97.1%) | 15 (2.9%) |
| Installation, Maintenance & Repair | 883 (99.1%) | 8 (0.9%) |
| Total (Category) | 1,618 (98.6%) | 23 (1.4%) |
| Total (Overall) | 9,151 (53.9%) | 7,815 (46.1%) |
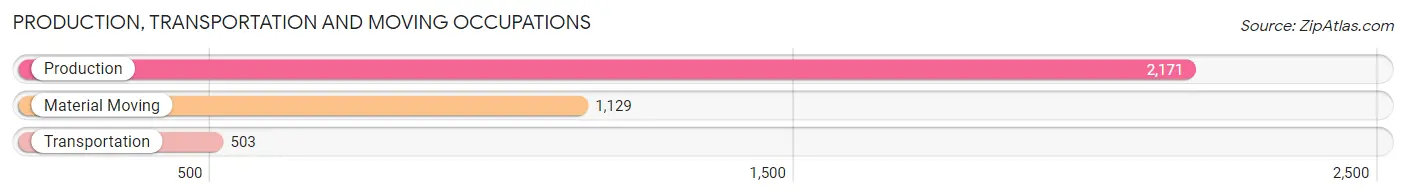
Production, Transportation and Moving Occupations
The most common Production, Transportation and Moving occupations in Newberry County are Production (2,171 | 12.8%), Material Moving (1,129 | 6.7%), and Transportation (503 | 3.0%).
Production, Transportation and Moving Occupations by Sex
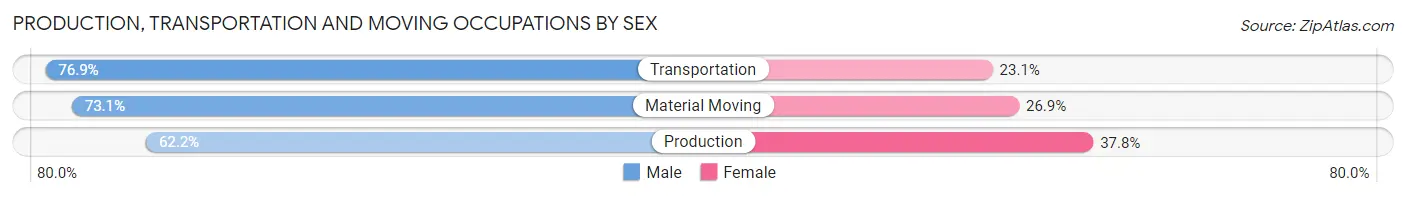
| Occupation | Male | Female |
| Production | 1,350 (62.2%) | 821 (37.8%) |
| Transportation | 387 (76.9%) | 116 (23.1%) |
| Material Moving | 825 (73.1%) | 304 (26.9%) |
| Total (Category) | 2,562 (67.4%) | 1,241 (32.6%) |
| Total (Overall) | 9,151 (53.9%) | 7,815 (46.1%) |
Employment Industries by Sex in Newberry County
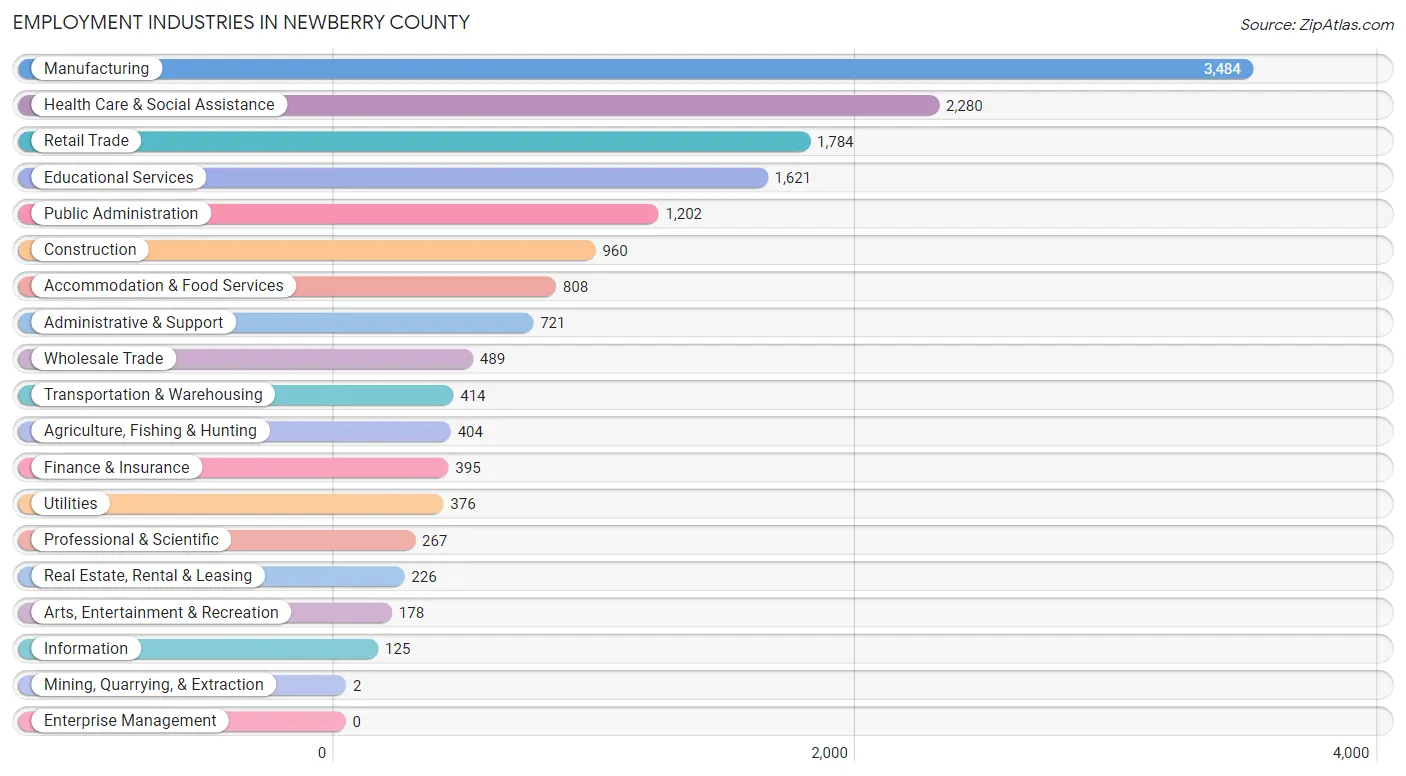
Employment Industries in Newberry County
The major employment industries in Newberry County include Manufacturing (3,484 | 20.5%), Health Care & Social Assistance (2,280 | 13.4%), Retail Trade (1,784 | 10.5%), Educational Services (1,621 | 9.6%), and Public Administration (1,202 | 7.1%).
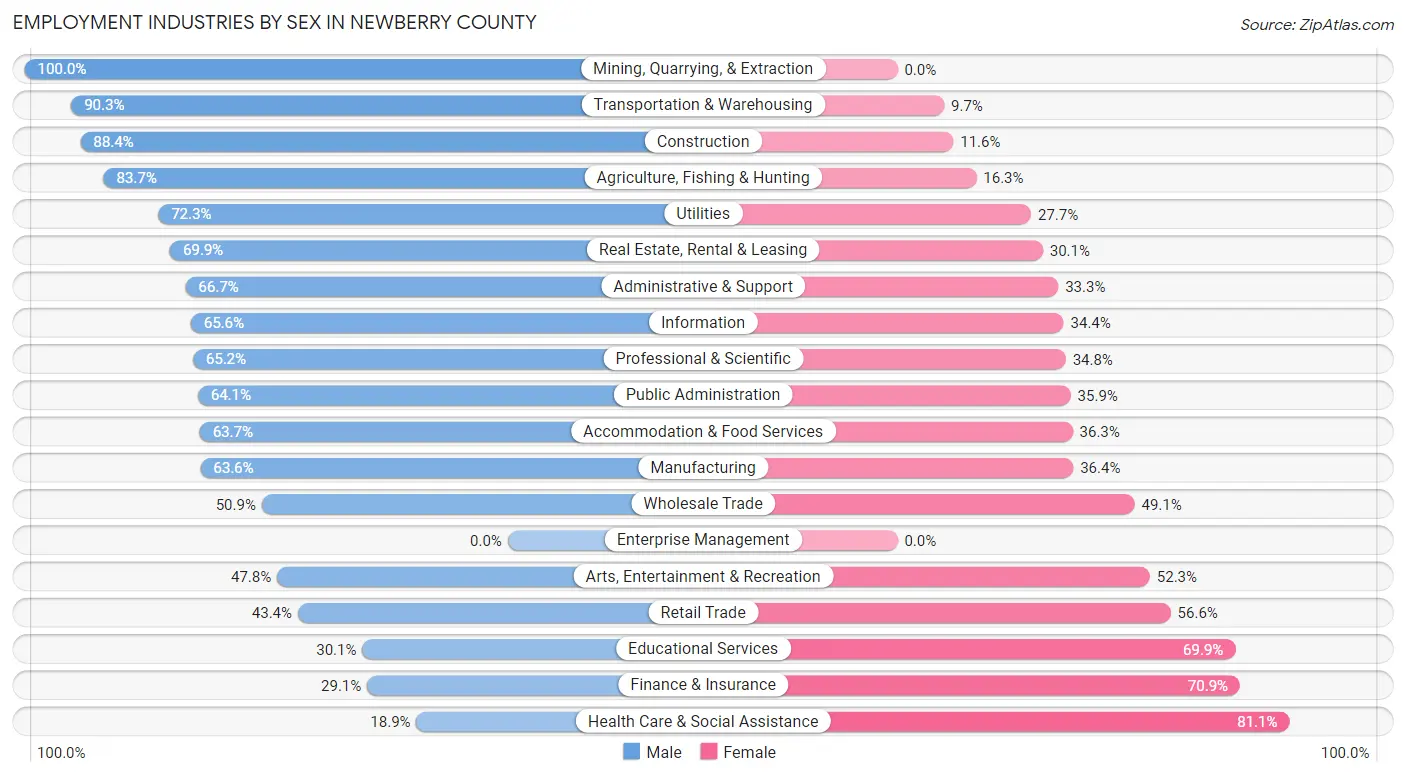
Employment Industries by Sex in Newberry County
The Newberry County industries that see more men than women are Mining, Quarrying, & Extraction (100.0%), Transportation & Warehousing (90.3%), and Construction (88.4%), whereas the industries that tend to have a higher number of women are Health Care & Social Assistance (81.1%), Finance & Insurance (70.9%), and Educational Services (69.9%).
| Industry | Male | Female |
| Agriculture, Fishing & Hunting | 338 (83.7%) | 66 (16.3%) |
| Mining, Quarrying, & Extraction | 2 (100.0%) | 0 (0.0%) |
| Construction | 849 (88.4%) | 111 (11.6%) |
| Manufacturing | 2,216 (63.6%) | 1,268 (36.4%) |
| Wholesale Trade | 249 (50.9%) | 240 (49.1%) |
| Retail Trade | 775 (43.4%) | 1,009 (56.6%) |
| Transportation & Warehousing | 374 (90.3%) | 40 (9.7%) |
| Utilities | 272 (72.3%) | 104 (27.7%) |
| Information | 82 (65.6%) | 43 (34.4%) |
| Finance & Insurance | 115 (29.1%) | 280 (70.9%) |
| Real Estate, Rental & Leasing | 158 (69.9%) | 68 (30.1%) |
| Professional & Scientific | 174 (65.2%) | 93 (34.8%) |
| Enterprise Management | 0 (0.0%) | 0 (0.0%) |
| Administrative & Support | 481 (66.7%) | 240 (33.3%) |
| Educational Services | 488 (30.1%) | 1,133 (69.9%) |
| Health Care & Social Assistance | 431 (18.9%) | 1,849 (81.1%) |
| Arts, Entertainment & Recreation | 85 (47.7%) | 93 (52.2%) |
| Accommodation & Food Services | 515 (63.7%) | 293 (36.3%) |
| Public Administration | 771 (64.1%) | 431 (35.9%) |
| Total | 9,151 (53.9%) | 7,815 (46.1%) |
Education in Newberry County
School Enrollment in Newberry County
The most common levels of schooling among the 8,820 students in Newberry County are middle school (2,102 | 23.8%), college / undergraduate (2,059 | 23.3%), and high school (1,826 | 20.7%).
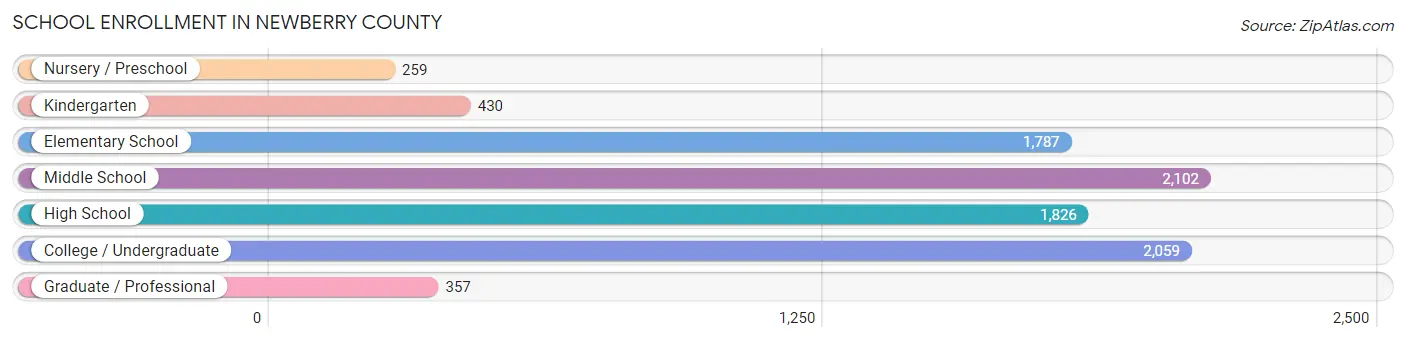
| School Level | # Students | % Students |
| Nursery / Preschool | 259 | 2.9% |
| Kindergarten | 430 | 4.9% |
| Elementary School | 1,787 | 20.3% |
| Middle School | 2,102 | 23.8% |
| High School | 1,826 | 20.7% |
| College / Undergraduate | 2,059 | 23.3% |
| Graduate / Professional | 357 | 4.1% |
| Total | 8,820 | 100.0% |
School Enrollment by Age by Funding Source in Newberry County
Out of a total of 8,820 students who are enrolled in schools in Newberry County, 1,835 (20.8%) attend a private institution, while the remaining 6,985 (79.2%) are enrolled in public schools. The age group of 18 to 19 year olds has the highest likelihood of being enrolled in private schools, with 565 (52.7% in the age bracket) enrolled. Conversely, the age group of 5 to 9 year old has the lowest likelihood of being enrolled in a private school, with 2,042 (97.8% in the age bracket) attending a public institution.
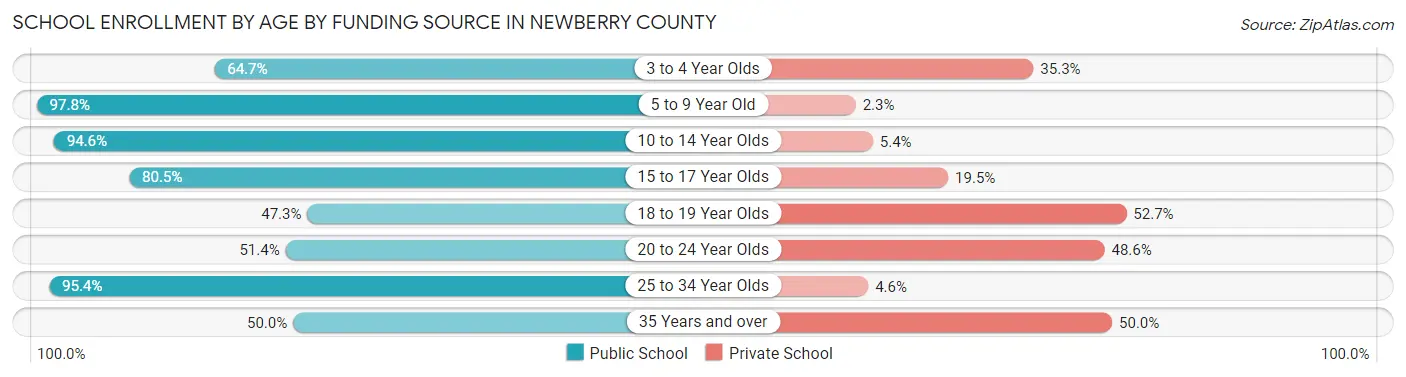
| Age Bracket | Public School | Private School |
| 3 to 4 Year Olds | 161 (64.7%) | 88 (35.3%) |
| 5 to 9 Year Old | 2,042 (97.8%) | 47 (2.2%) |
| 10 to 14 Year Olds | 2,278 (94.6%) | 131 (5.4%) |
| 15 to 17 Year Olds | 1,051 (80.5%) | 254 (19.5%) |
| 18 to 19 Year Olds | 508 (47.3%) | 565 (52.7%) |
| 20 to 24 Year Olds | 437 (51.4%) | 413 (48.6%) |
| 25 to 34 Year Olds | 188 (95.4%) | 9 (4.6%) |
| 35 Years and over | 324 (50.0%) | 324 (50.0%) |
| Total | 6,985 (79.2%) | 1,835 (20.8%) |
Educational Attainment by Field of Study in Newberry County
Business (1,299 | 20.2%), education (1,117 | 17.4%), science & technology (818 | 12.7%), arts & humanities (527 | 8.2%), and social sciences (502 | 7.8%) are the most common fields of study among 6,421 individuals in Newberry County who have obtained a bachelor's degree or higher.
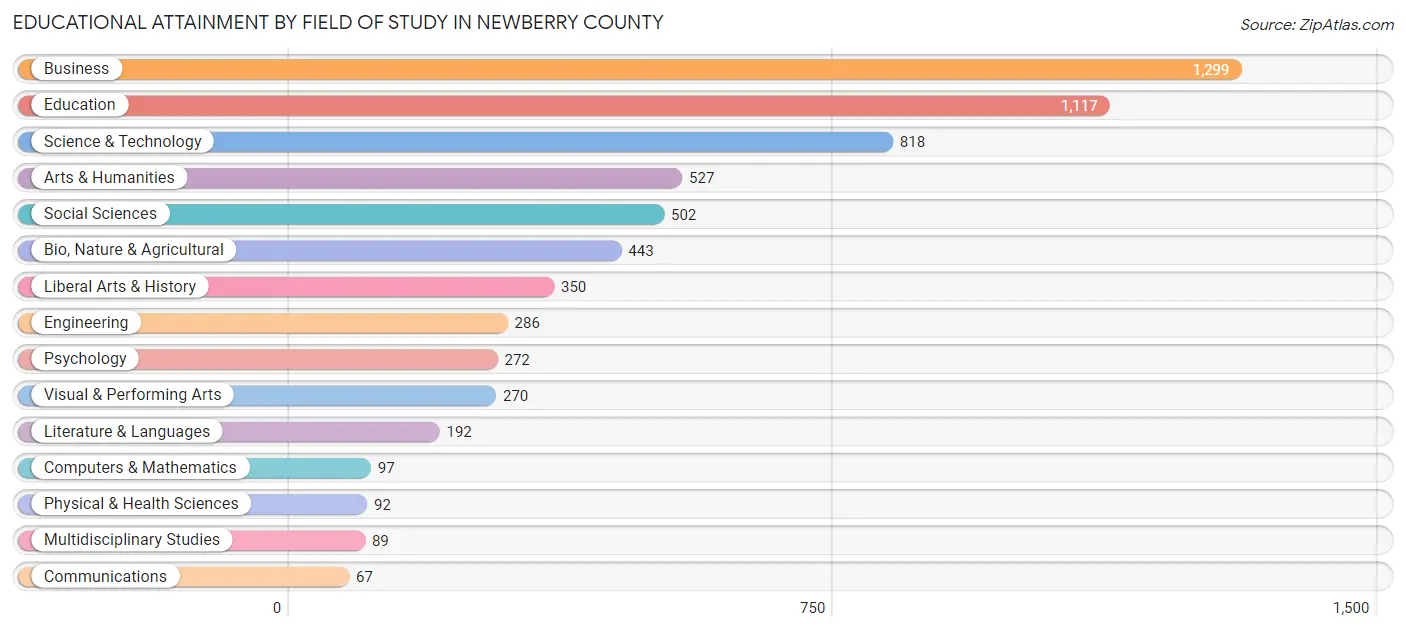
| Field of Study | # Graduates | % Graduates |
| Computers & Mathematics | 97 | 1.5% |
| Bio, Nature & Agricultural | 443 | 6.9% |
| Physical & Health Sciences | 92 | 1.4% |
| Psychology | 272 | 4.2% |
| Social Sciences | 502 | 7.8% |
| Engineering | 286 | 4.4% |
| Multidisciplinary Studies | 89 | 1.4% |
| Science & Technology | 818 | 12.7% |
| Business | 1,299 | 20.2% |
| Education | 1,117 | 17.4% |
| Literature & Languages | 192 | 3.0% |
| Liberal Arts & History | 350 | 5.4% |
| Visual & Performing Arts | 270 | 4.2% |
| Communications | 67 | 1.0% |
| Arts & Humanities | 527 | 8.2% |
| Total | 6,421 | 100.0% |
Transportation & Commute in Newberry County
Vehicle Availability by Sex in Newberry County
The most prevalent vehicle ownership categories in Newberry County are males with 2 vehicles (3,442, accounting for 38.6%) and females with 2 vehicles (2,481, making up 46.9%).
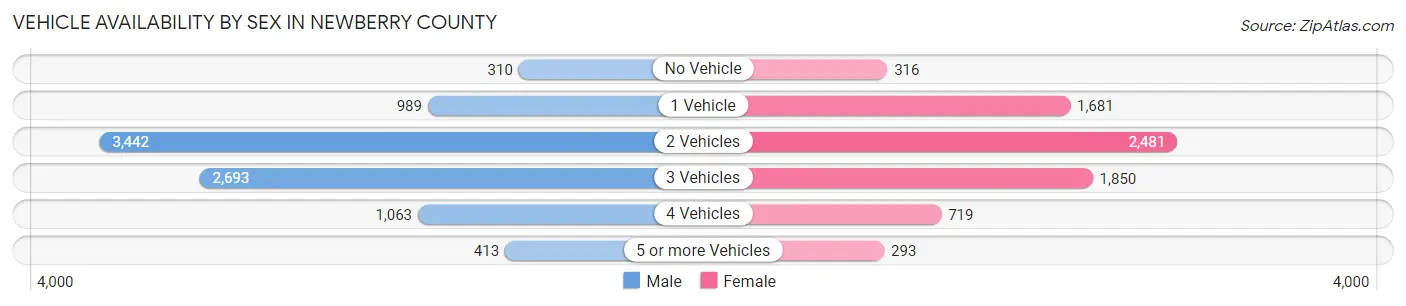
| Vehicles Available | Male | Female |
| No Vehicle | 310 (3.5%) | 316 (4.3%) |
| 1 Vehicle | 989 (11.1%) | 1,681 (22.9%) |
| 2 Vehicles | 3,442 (38.6%) | 2,481 (33.8%) |
| 3 Vehicles | 2,693 (30.2%) | 1,850 (25.2%) |
| 4 Vehicles | 1,063 (11.9%) | 719 (9.8%) |
| 5 or more Vehicles | 413 (4.6%) | 293 (4.0%) |
| Total | 8,910 (100.0%) | 7,340 (100.0%) |
Commute Time in Newberry County
The most frequently occuring commute durations in Newberry County are 20 to 24 minutes (2,609 commuters, 16.4%), 10 to 14 minutes (2,478 commuters, 15.6%), and 15 to 19 minutes (2,213 commuters, 13.9%).
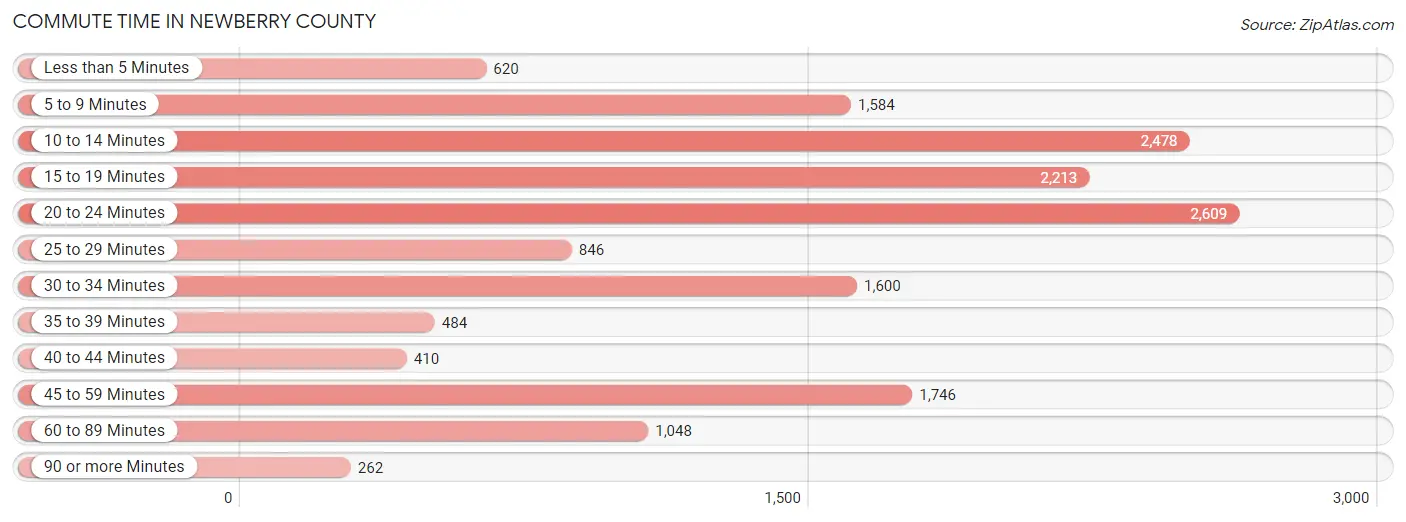
| Commute Time | # Commuters | % Commuters |
| Less than 5 Minutes | 620 | 3.9% |
| 5 to 9 Minutes | 1,584 | 10.0% |
| 10 to 14 Minutes | 2,478 | 15.6% |
| 15 to 19 Minutes | 2,213 | 13.9% |
| 20 to 24 Minutes | 2,609 | 16.4% |
| 25 to 29 Minutes | 846 | 5.3% |
| 30 to 34 Minutes | 1,600 | 10.1% |
| 35 to 39 Minutes | 484 | 3.0% |
| 40 to 44 Minutes | 410 | 2.6% |
| 45 to 59 Minutes | 1,746 | 11.0% |
| 60 to 89 Minutes | 1,048 | 6.6% |
| 90 or more Minutes | 262 | 1.7% |
Commute Time by Sex in Newberry County
The most common commute times in Newberry County are 20 to 24 minutes (1,533 commuters, 17.5%) for males and 10 to 14 minutes (1,135 commuters, 15.9%) for females.
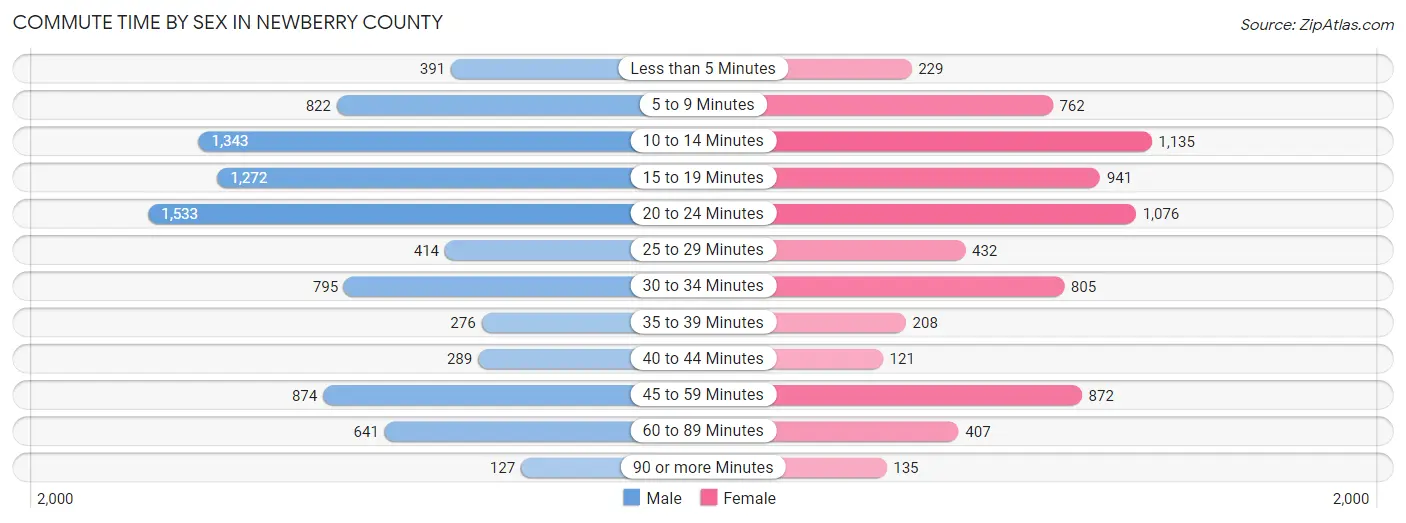
| Commute Time | Male | Female |
| Less than 5 Minutes | 391 (4.4%) | 229 (3.2%) |
| 5 to 9 Minutes | 822 (9.4%) | 762 (10.7%) |
| 10 to 14 Minutes | 1,343 (15.3%) | 1,135 (15.9%) |
| 15 to 19 Minutes | 1,272 (14.5%) | 941 (13.2%) |
| 20 to 24 Minutes | 1,533 (17.5%) | 1,076 (15.1%) |
| 25 to 29 Minutes | 414 (4.7%) | 432 (6.1%) |
| 30 to 34 Minutes | 795 (9.1%) | 805 (11.3%) |
| 35 to 39 Minutes | 276 (3.1%) | 208 (2.9%) |
| 40 to 44 Minutes | 289 (3.3%) | 121 (1.7%) |
| 45 to 59 Minutes | 874 (10.0%) | 872 (12.2%) |
| 60 to 89 Minutes | 641 (7.3%) | 407 (5.7%) |
| 90 or more Minutes | 127 (1.5%) | 135 (1.9%) |
Time of Departure to Work by Sex in Newberry County
The most frequent times of departure to work in Newberry County are 6:30 AM to 6:59 AM (1,493, 17.0%) for males and 7:00 AM to 7:29 AM (1,206, 16.9%) for females.
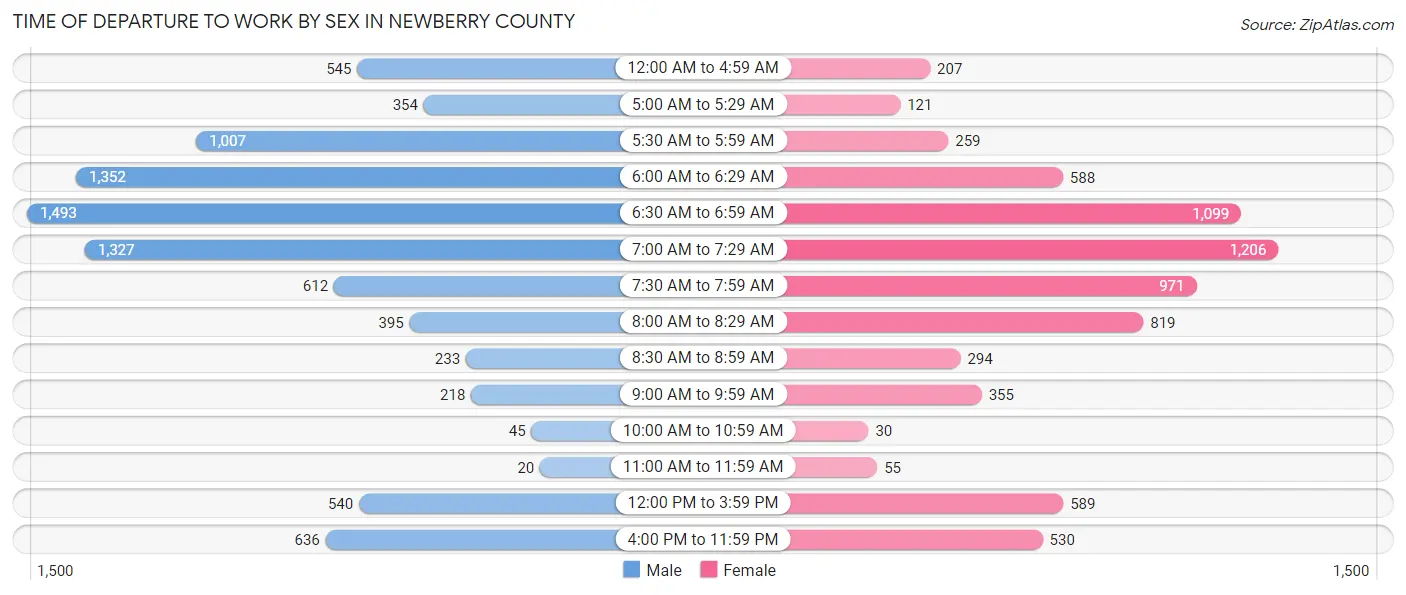
| Time of Departure | Male | Female |
| 12:00 AM to 4:59 AM | 545 (6.2%) | 207 (2.9%) |
| 5:00 AM to 5:29 AM | 354 (4.0%) | 121 (1.7%) |
| 5:30 AM to 5:59 AM | 1,007 (11.5%) | 259 (3.6%) |
| 6:00 AM to 6:29 AM | 1,352 (15.4%) | 588 (8.3%) |
| 6:30 AM to 6:59 AM | 1,493 (17.0%) | 1,099 (15.4%) |
| 7:00 AM to 7:29 AM | 1,327 (15.1%) | 1,206 (16.9%) |
| 7:30 AM to 7:59 AM | 612 (7.0%) | 971 (13.6%) |
| 8:00 AM to 8:29 AM | 395 (4.5%) | 819 (11.5%) |
| 8:30 AM to 8:59 AM | 233 (2.6%) | 294 (4.1%) |
| 9:00 AM to 9:59 AM | 218 (2.5%) | 355 (5.0%) |
| 10:00 AM to 10:59 AM | 45 (0.5%) | 30 (0.4%) |
| 11:00 AM to 11:59 AM | 20 (0.2%) | 55 (0.8%) |
| 12:00 PM to 3:59 PM | 540 (6.1%) | 589 (8.3%) |
| 4:00 PM to 11:59 PM | 636 (7.2%) | 530 (7.4%) |
| Total | 8,777 (100.0%) | 7,123 (100.0%) |
Housing Occupancy in Newberry County
Occupancy by Ownership in Newberry County
Of the total 15,027 dwellings in Newberry County, owner-occupied units account for 11,167 (74.3%), while renter-occupied units make up 3,860 (25.7%).
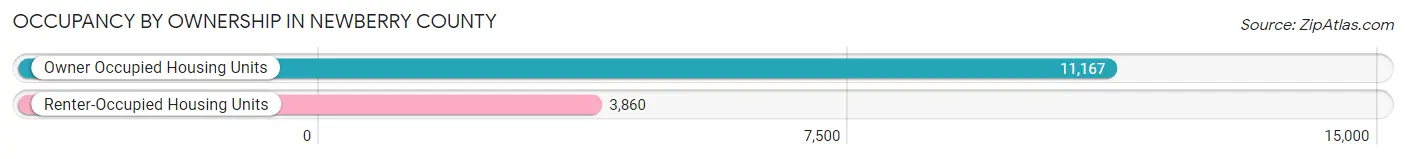
| Occupancy | # Housing Units | % Housing Units |
| Owner Occupied Housing Units | 11,167 | 74.3% |
| Renter-Occupied Housing Units | 3,860 | 25.7% |
| Total Occupied Housing Units | 15,027 | 100.0% |
Occupancy by Household Size in Newberry County
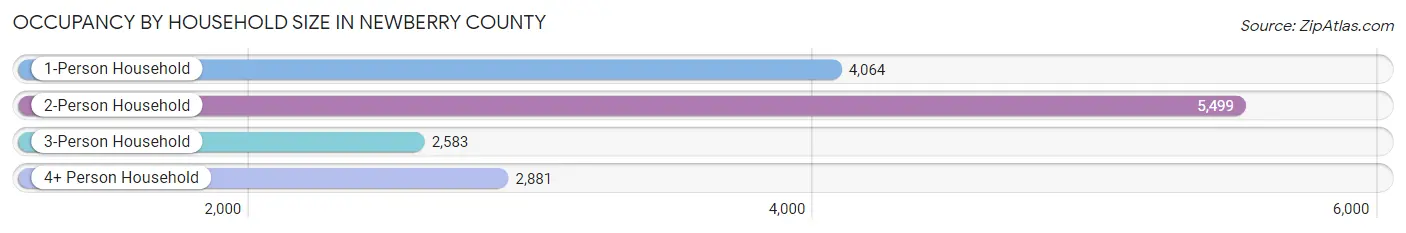
| Household Size | # Housing Units | % Housing Units |
| 1-Person Household | 4,064 | 27.0% |
| 2-Person Household | 5,499 | 36.6% |
| 3-Person Household | 2,583 | 17.2% |
| 4+ Person Household | 2,881 | 19.2% |
| Total Housing Units | 15,027 | 100.0% |
Occupancy by Ownership by Household Size in Newberry County
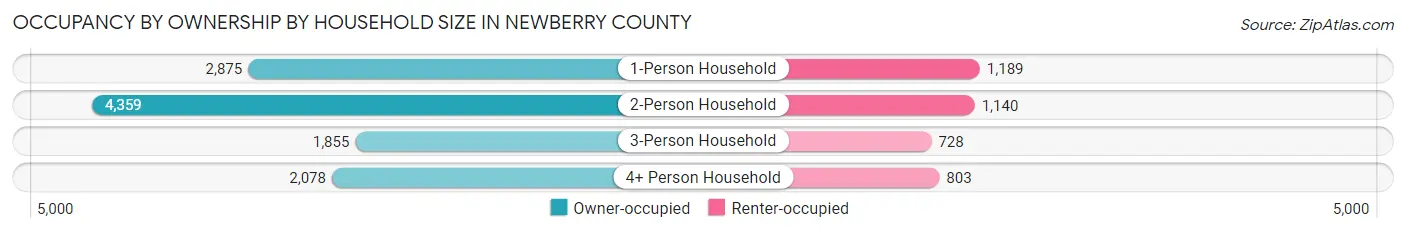
| Household Size | Owner-occupied | Renter-occupied |
| 1-Person Household | 2,875 (70.7%) | 1,189 (29.3%) |
| 2-Person Household | 4,359 (79.3%) | 1,140 (20.7%) |
| 3-Person Household | 1,855 (71.8%) | 728 (28.2%) |
| 4+ Person Household | 2,078 (72.1%) | 803 (27.9%) |
| Total Housing Units | 11,167 (74.3%) | 3,860 (25.7%) |
Occupancy by Educational Attainment in Newberry County
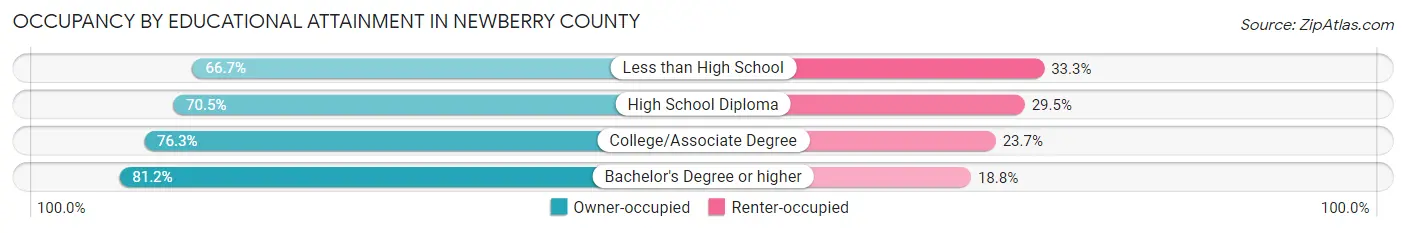
| Household Size | Owner-occupied | Renter-occupied |
| Less than High School | 1,303 (66.7%) | 651 (33.3%) |
| High School Diploma | 3,354 (70.5%) | 1,401 (29.5%) |
| College/Associate Degree | 3,797 (76.3%) | 1,180 (23.7%) |
| Bachelor's Degree or higher | 2,713 (81.2%) | 628 (18.8%) |
Occupancy by Age of Householder in Newberry County
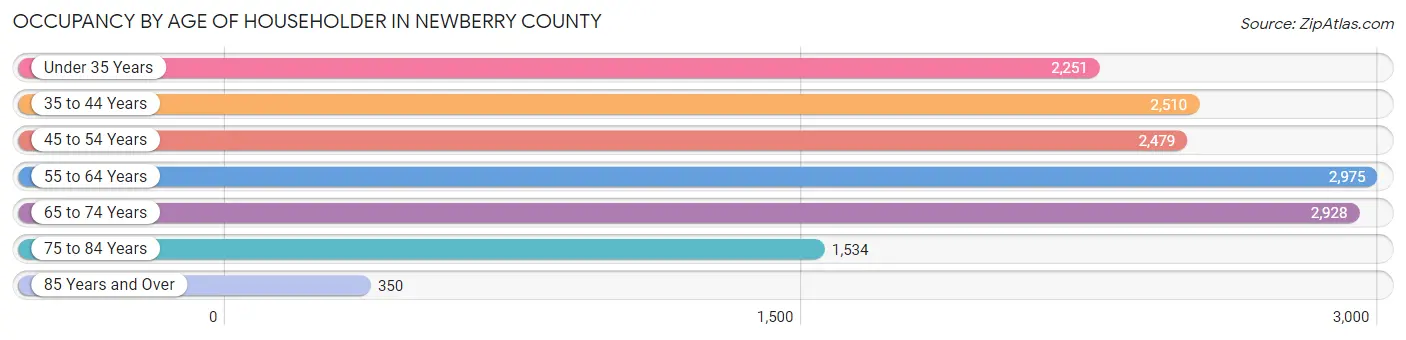
| Age Bracket | # Households | % Households |
| Under 35 Years | 2,251 | 15.0% |
| 35 to 44 Years | 2,510 | 16.7% |
| 45 to 54 Years | 2,479 | 16.5% |
| 55 to 64 Years | 2,975 | 19.8% |
| 65 to 74 Years | 2,928 | 19.5% |
| 75 to 84 Years | 1,534 | 10.2% |
| 85 Years and Over | 350 | 2.3% |
| Total | 15,027 | 100.0% |
Housing Finances in Newberry County
Median Income by Occupancy in Newberry County
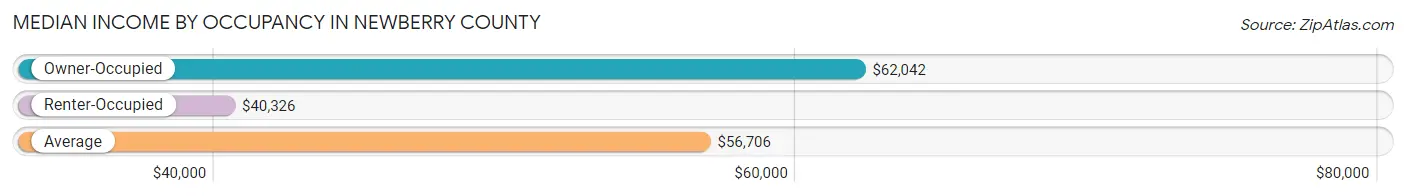
| Occupancy Type | # Households | Median Income |
| Owner-Occupied | 11,167 (74.3%) | $62,042 |
| Renter-Occupied | 3,860 (25.7%) | $40,326 |
| Average | 15,027 (100.0%) | $56,706 |
Occupancy by Householder Income Bracket in Newberry County
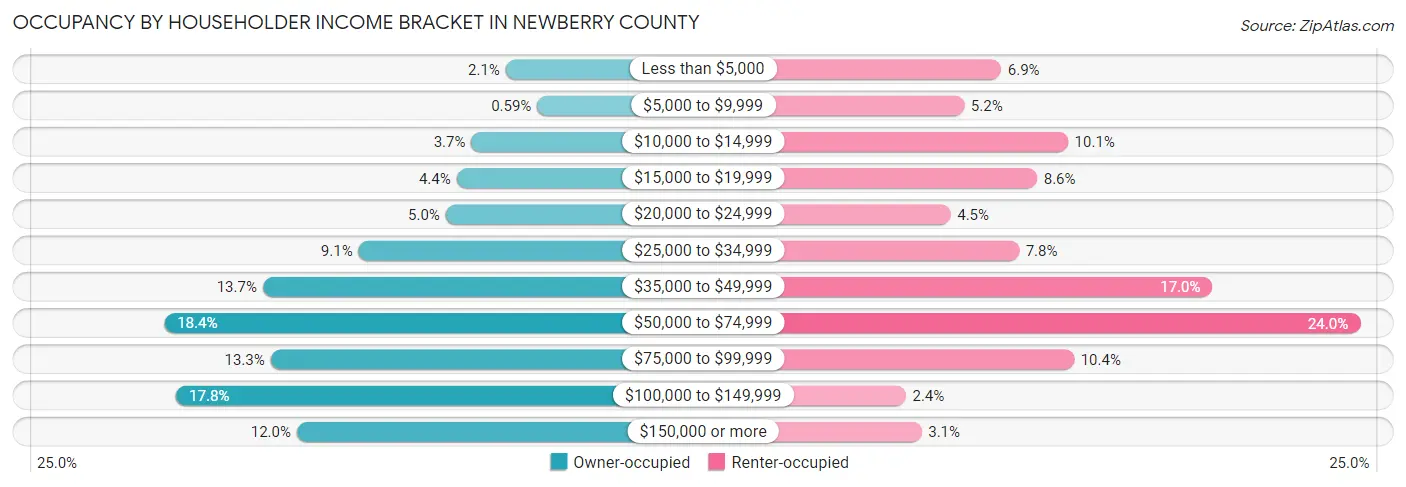
| Income Bracket | Owner-occupied | Renter-occupied |
| Less than $5,000 | 233 (2.1%) | 267 (6.9%) |
| $5,000 to $9,999 | 66 (0.6%) | 199 (5.2%) |
| $10,000 to $14,999 | 416 (3.7%) | 390 (10.1%) |
| $15,000 to $19,999 | 495 (4.4%) | 333 (8.6%) |
| $20,000 to $24,999 | 553 (5.0%) | 174 (4.5%) |
| $25,000 to $34,999 | 1,016 (9.1%) | 300 (7.8%) |
| $35,000 to $49,999 | 1,525 (13.7%) | 656 (17.0%) |
| $50,000 to $74,999 | 2,049 (18.3%) | 927 (24.0%) |
| $75,000 to $99,999 | 1,484 (13.3%) | 401 (10.4%) |
| $100,000 to $149,999 | 1,985 (17.8%) | 92 (2.4%) |
| $150,000 or more | 1,345 (12.0%) | 121 (3.1%) |
| Total | 11,167 (100.0%) | 3,860 (100.0%) |
Monthly Housing Cost Tiers in Newberry County
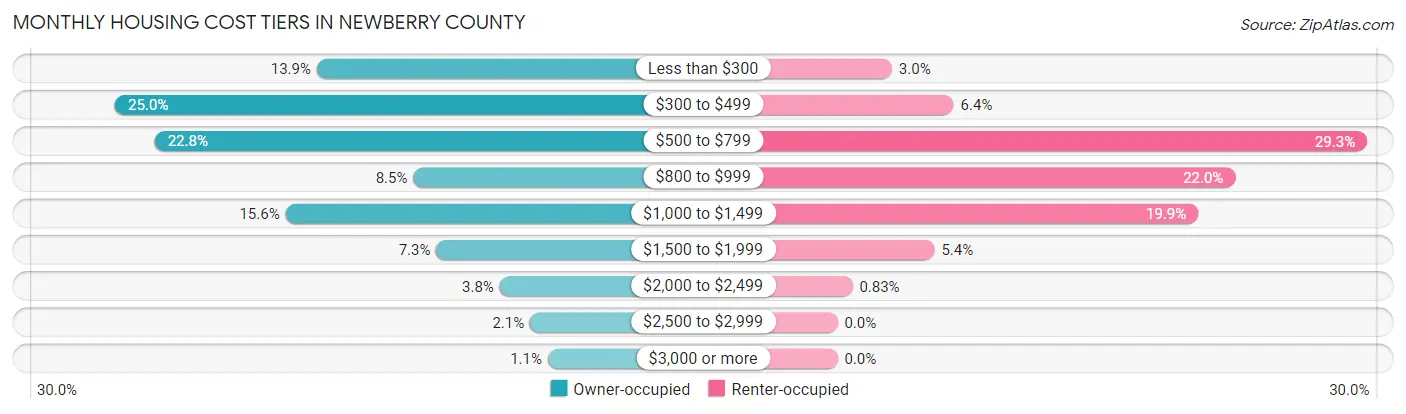
| Monthly Cost | Owner-occupied | Renter-occupied |
| Less than $300 | 1,548 (13.9%) | 116 (3.0%) |
| $300 to $499 | 2,792 (25.0%) | 248 (6.4%) |
| $500 to $799 | 2,547 (22.8%) | 1,129 (29.2%) |
| $800 to $999 | 953 (8.5%) | 848 (22.0%) |
| $1,000 to $1,499 | 1,741 (15.6%) | 769 (19.9%) |
| $1,500 to $1,999 | 811 (7.3%) | 207 (5.4%) |
| $2,000 to $2,499 | 420 (3.8%) | 32 (0.8%) |
| $2,500 to $2,999 | 232 (2.1%) | 0 (0.0%) |
| $3,000 or more | 123 (1.1%) | 0 (0.0%) |
| Total | 11,167 (100.0%) | 3,860 (100.0%) |
Physical Housing Characteristics in Newberry County
Housing Structures in Newberry County
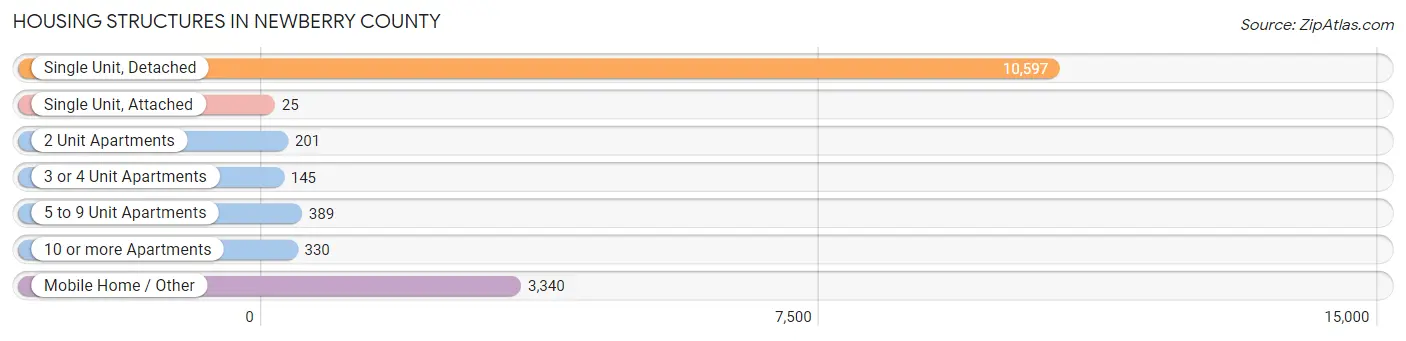
| Structure Type | # Housing Units | % Housing Units |
| Single Unit, Detached | 10,597 | 70.5% |
| Single Unit, Attached | 25 | 0.2% |
| 2 Unit Apartments | 201 | 1.3% |
| 3 or 4 Unit Apartments | 145 | 1.0% |
| 5 to 9 Unit Apartments | 389 | 2.6% |
| 10 or more Apartments | 330 | 2.2% |
| Mobile Home / Other | 3,340 | 22.2% |
| Total | 15,027 | 100.0% |
Housing Structures by Occupancy in Newberry County
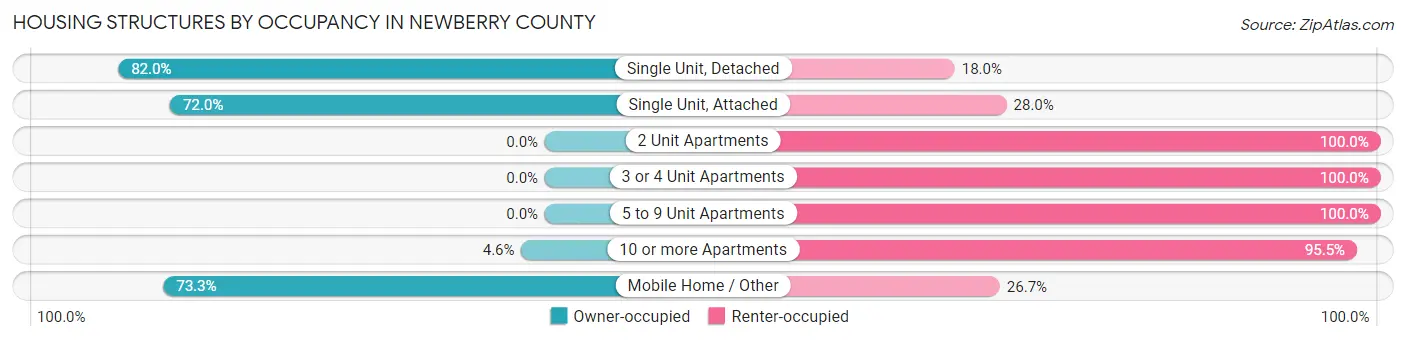
| Structure Type | Owner-occupied | Renter-occupied |
| Single Unit, Detached | 8,686 (82.0%) | 1,911 (18.0%) |
| Single Unit, Attached | 18 (72.0%) | 7 (28.0%) |
| 2 Unit Apartments | 0 (0.0%) | 201 (100.0%) |
| 3 or 4 Unit Apartments | 0 (0.0%) | 145 (100.0%) |
| 5 to 9 Unit Apartments | 0 (0.0%) | 389 (100.0%) |
| 10 or more Apartments | 15 (4.5%) | 315 (95.5%) |
| Mobile Home / Other | 2,448 (73.3%) | 892 (26.7%) |
| Total | 11,167 (74.3%) | 3,860 (25.7%) |
Housing Structures by Number of Rooms in Newberry County
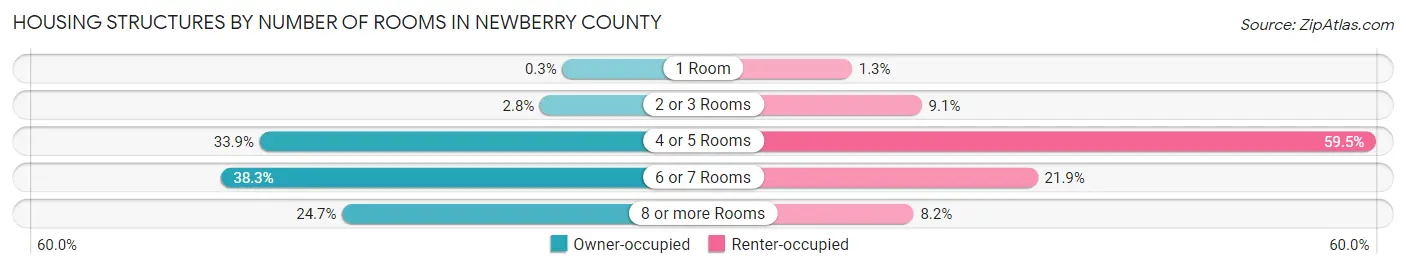
| Number of Rooms | Owner-occupied | Renter-occupied |
| 1 Room | 33 (0.3%) | 51 (1.3%) |
| 2 or 3 Rooms | 311 (2.8%) | 350 (9.1%) |
| 4 or 5 Rooms | 3,786 (33.9%) | 2,297 (59.5%) |
| 6 or 7 Rooms | 4,274 (38.3%) | 847 (21.9%) |
| 8 or more Rooms | 2,763 (24.7%) | 315 (8.2%) |
| Total | 11,167 (100.0%) | 3,860 (100.0%) |
Housing Structure by Heating Type in Newberry County
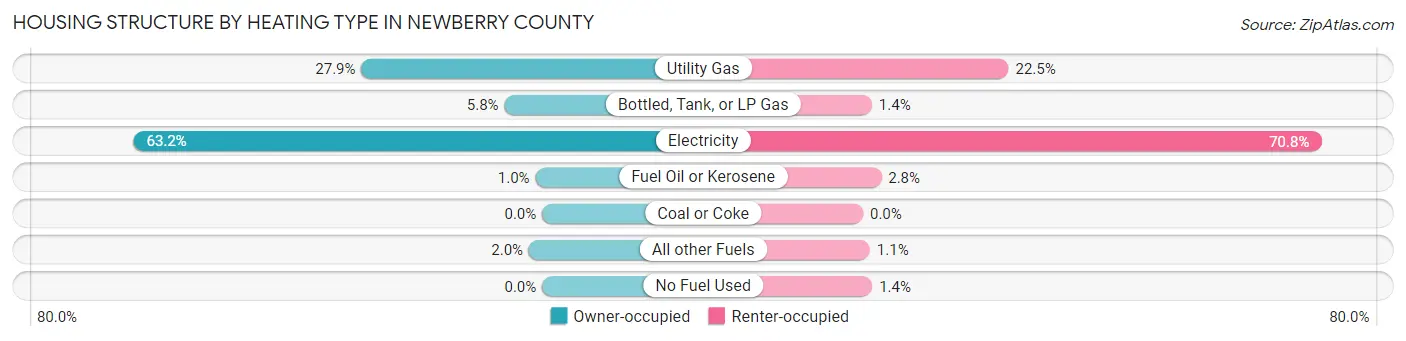
| Heating Type | Owner-occupied | Renter-occupied |
| Utility Gas | 3,120 (27.9%) | 868 (22.5%) |
| Bottled, Tank, or LP Gas | 650 (5.8%) | 53 (1.4%) |
| Electricity | 7,054 (63.2%) | 2,734 (70.8%) |
| Fuel Oil or Kerosene | 115 (1.0%) | 109 (2.8%) |
| Coal or Coke | 0 (0.0%) | 0 (0.0%) |
| All other Fuels | 228 (2.0%) | 41 (1.1%) |
| No Fuel Used | 0 (0.0%) | 55 (1.4%) |
| Total | 11,167 (100.0%) | 3,860 (100.0%) |
Household Vehicle Usage in Newberry County
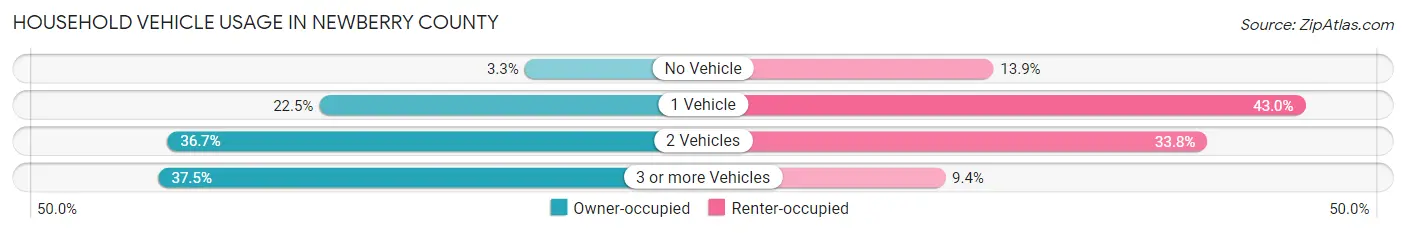
| Vehicles per Household | Owner-occupied | Renter-occupied |
| No Vehicle | 372 (3.3%) | 535 (13.9%) |
| 1 Vehicle | 2,513 (22.5%) | 1,659 (43.0%) |
| 2 Vehicles | 4,095 (36.7%) | 1,305 (33.8%) |
| 3 or more Vehicles | 4,187 (37.5%) | 361 (9.3%) |
| Total | 11,167 (100.0%) | 3,860 (100.0%) |
Real Estate & Mortgages in Newberry County
Real Estate and Mortgage Overview in Newberry County
| Characteristic | Without Mortgage | With Mortgage |
| Housing Units | 6,148 | 5,019 |
| Median Property Value | $114,800 | $178,700 |
| Median Household Income | $49,830 | $899 |
| Monthly Housing Costs | $405 | $123 |
| Real Estate Taxes | $917 | $304 |
Property Value by Mortgage Status in Newberry County
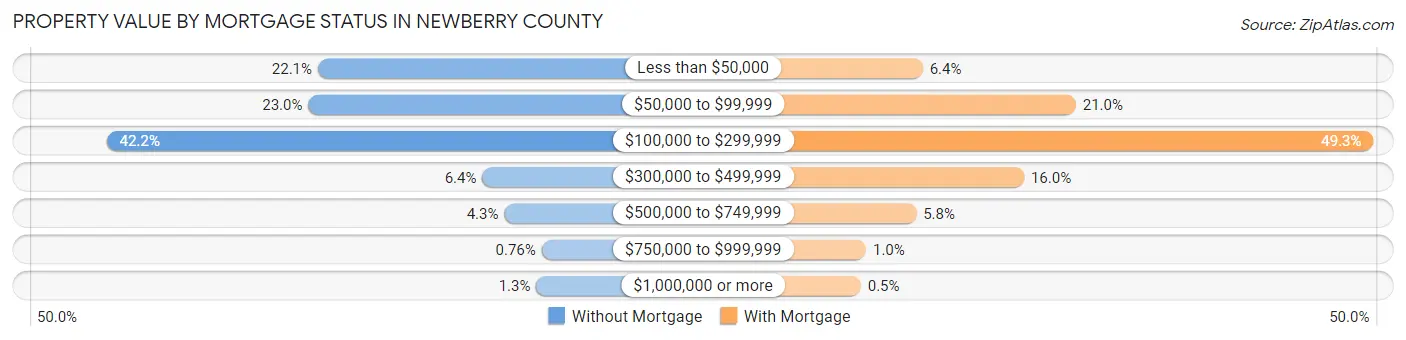
| Property Value | Without Mortgage | With Mortgage |
| Less than $50,000 | 1,357 (22.1%) | 321 (6.4%) |
| $50,000 to $99,999 | 1,413 (23.0%) | 1,053 (21.0%) |
| $100,000 to $299,999 | 2,594 (42.2%) | 2,475 (49.3%) |
| $300,000 to $499,999 | 394 (6.4%) | 805 (16.0%) |
| $500,000 to $749,999 | 265 (4.3%) | 290 (5.8%) |
| $750,000 to $999,999 | 47 (0.8%) | 50 (1.0%) |
| $1,000,000 or more | 78 (1.3%) | 25 (0.5%) |
| Total | 6,148 (100.0%) | 5,019 (100.0%) |
Household Income by Mortgage Status in Newberry County
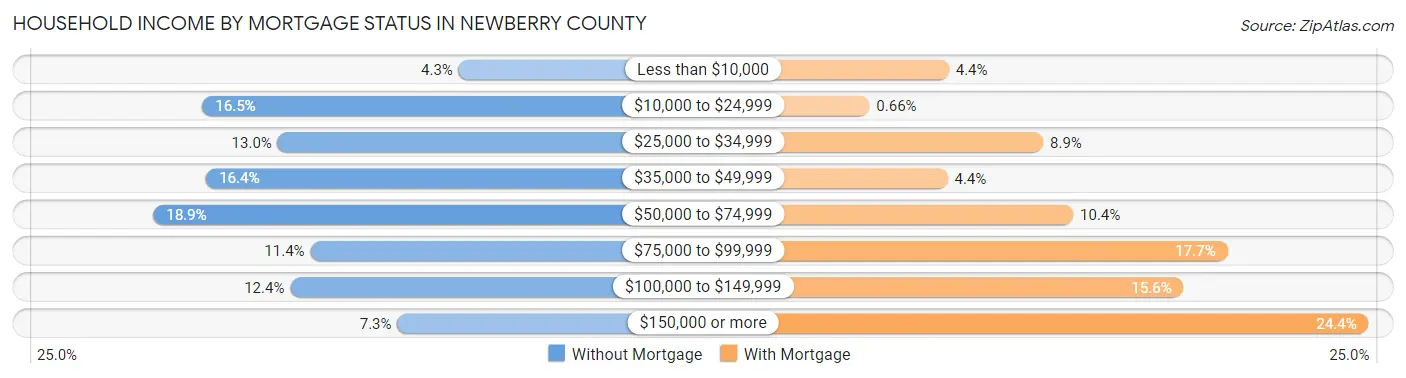
| Household Income | Without Mortgage | With Mortgage |
| Less than $10,000 | 266 (4.3%) | 223 (4.4%) |
| $10,000 to $24,999 | 1,016 (16.5%) | 33 (0.7%) |
| $25,000 to $34,999 | 796 (13.0%) | 448 (8.9%) |
| $35,000 to $49,999 | 1,005 (16.4%) | 220 (4.4%) |
| $50,000 to $74,999 | 1,160 (18.9%) | 520 (10.4%) |
| $75,000 to $99,999 | 700 (11.4%) | 889 (17.7%) |
| $100,000 to $149,999 | 759 (12.3%) | 784 (15.6%) |
| $150,000 or more | 446 (7.2%) | 1,226 (24.4%) |
| Total | 6,148 (100.0%) | 5,019 (100.0%) |
Property Value to Household Income Ratio in Newberry County
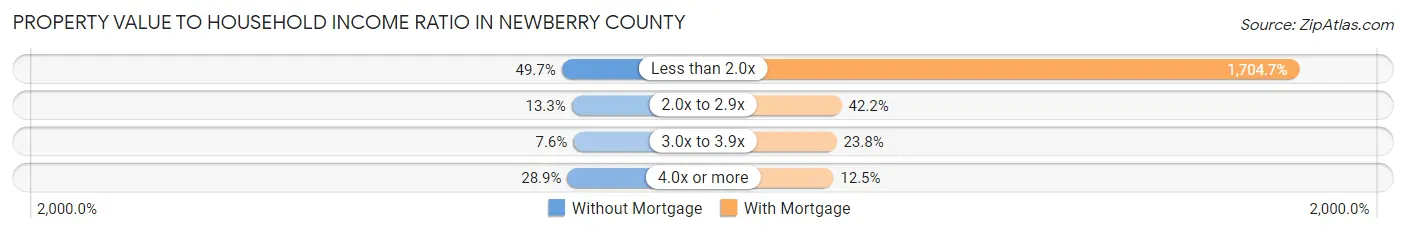
| Value-to-Income Ratio | Without Mortgage | With Mortgage |
| Less than 2.0x | 3,058 (49.7%) | 85,558 (1,704.7%) |
| 2.0x to 2.9x | 816 (13.3%) | 2,117 (42.2%) |
| 3.0x to 3.9x | 470 (7.6%) | 1,193 (23.8%) |
| 4.0x or more | 1,779 (28.9%) | 626 (12.5%) |
| Total | 6,148 (100.0%) | 5,019 (100.0%) |
Real Estate Taxes by Mortgage Status in Newberry County
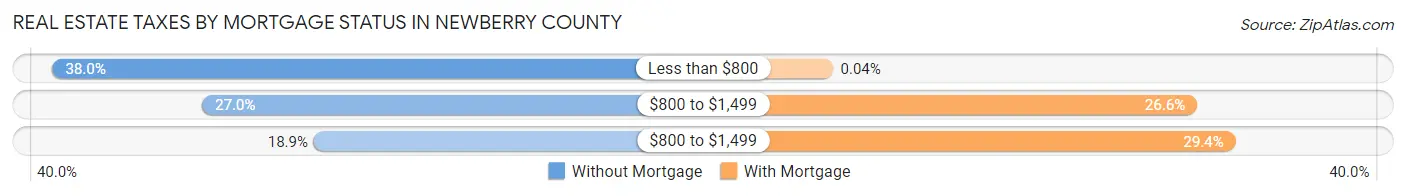
| Property Taxes | Without Mortgage | With Mortgage |
| Less than $800 | 2,334 (38.0%) | 2 (0.0%) |
| $800 to $1,499 | 1,662 (27.0%) | 1,335 (26.6%) |
| $800 to $1,499 | 1,160 (18.9%) | 1,476 (29.4%) |
| Total | 6,148 (100.0%) | 5,019 (100.0%) |
Health & Disability in Newberry County
Health Insurance Coverage by Age in Newberry County
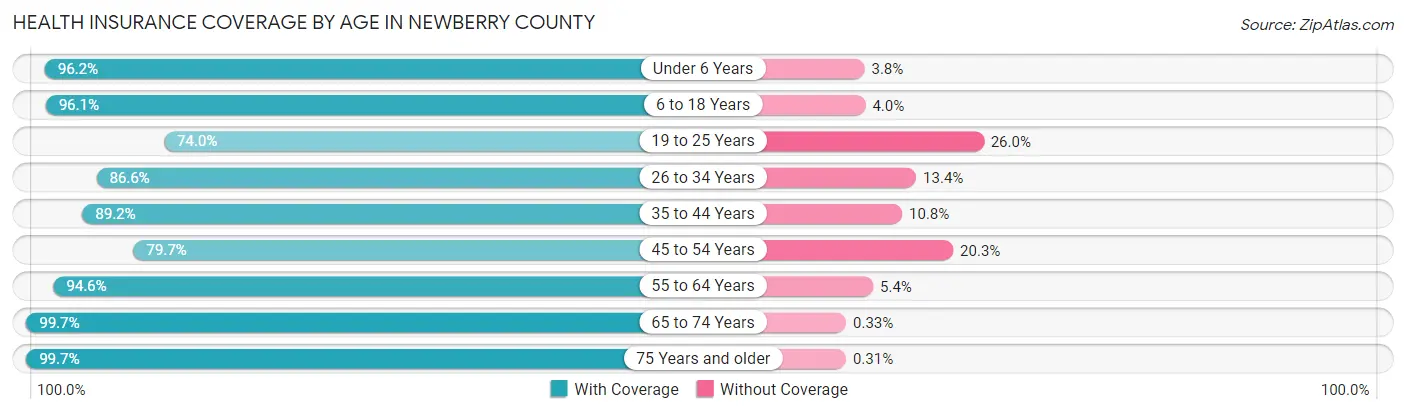
| Age Bracket | With Coverage | Without Coverage |
| Under 6 Years | 2,214 (96.2%) | 87 (3.8%) |
| 6 to 18 Years | 6,180 (96.1%) | 254 (4.0%) |
| 19 to 25 Years | 2,784 (74.0%) | 978 (26.0%) |
| 26 to 34 Years | 3,090 (86.6%) | 478 (13.4%) |
| 35 to 44 Years | 3,485 (89.2%) | 421 (10.8%) |
| 45 to 54 Years | 3,764 (79.7%) | 959 (20.3%) |
| 55 to 64 Years | 5,130 (94.6%) | 291 (5.4%) |
| 65 to 74 Years | 4,478 (99.7%) | 15 (0.3%) |
| 75 Years and older | 2,855 (99.7%) | 9 (0.3%) |
| Total | 33,980 (90.7%) | 3,492 (9.3%) |
Health Insurance Coverage by Citizenship Status in Newberry County
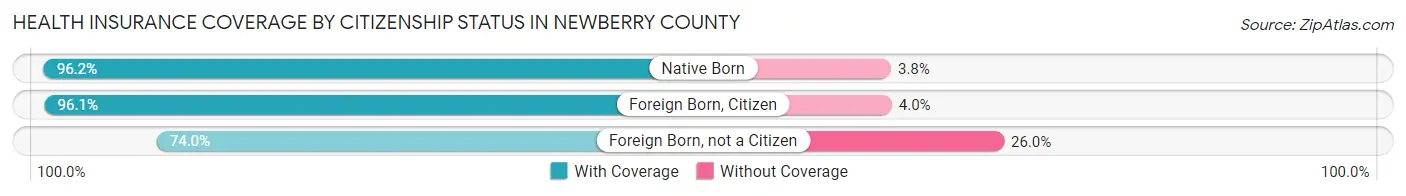
| Citizenship Status | With Coverage | Without Coverage |
| Native Born | 2,214 (96.2%) | 87 (3.8%) |
| Foreign Born, Citizen | 6,180 (96.1%) | 254 (4.0%) |
| Foreign Born, not a Citizen | 2,784 (74.0%) | 978 (26.0%) |
Health Insurance Coverage by Household Income in Newberry County
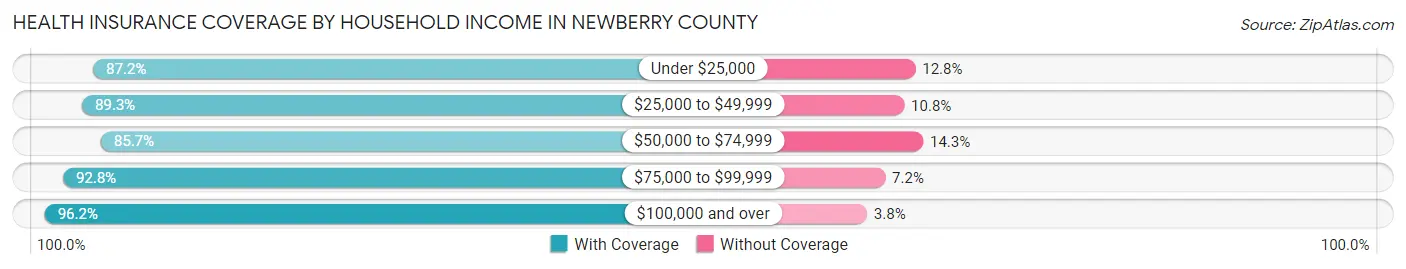
| Household Income | With Coverage | Without Coverage |
| Under $25,000 | 4,982 (87.2%) | 733 (12.8%) |
| $25,000 to $49,999 | 6,640 (89.2%) | 800 (10.7%) |
| $50,000 to $74,999 | 6,618 (85.7%) | 1,103 (14.3%) |
| $75,000 to $99,999 | 4,581 (92.8%) | 355 (7.2%) |
| $100,000 and over | 10,346 (96.2%) | 405 (3.8%) |
Public vs Private Health Insurance Coverage by Age in Newberry County
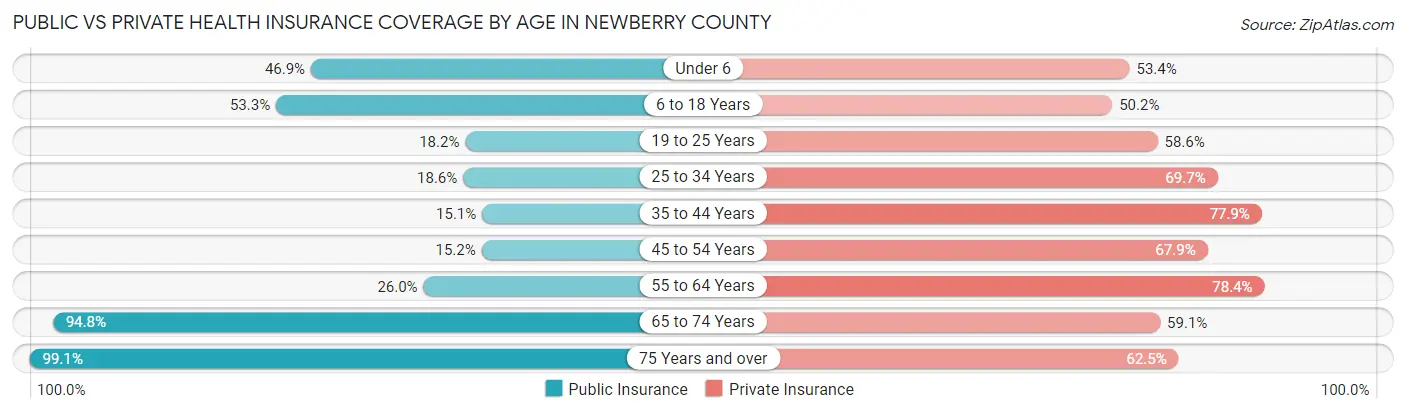
| Age Bracket | Public Insurance | Private Insurance |
| Under 6 | 1,078 (46.9%) | 1,229 (53.4%) |
| 6 to 18 Years | 3,432 (53.3%) | 3,230 (50.2%) |
| 19 to 25 Years | 685 (18.2%) | 2,205 (58.6%) |
| 25 to 34 Years | 664 (18.6%) | 2,488 (69.7%) |
| 35 to 44 Years | 589 (15.1%) | 3,044 (77.9%) |
| 45 to 54 Years | 717 (15.2%) | 3,206 (67.9%) |
| 55 to 64 Years | 1,408 (26.0%) | 4,252 (78.4%) |
| 65 to 74 Years | 4,258 (94.8%) | 2,655 (59.1%) |
| 75 Years and over | 2,838 (99.1%) | 1,790 (62.5%) |
| Total | 15,669 (41.8%) | 24,099 (64.3%) |
Disability Status by Sex by Age in Newberry County
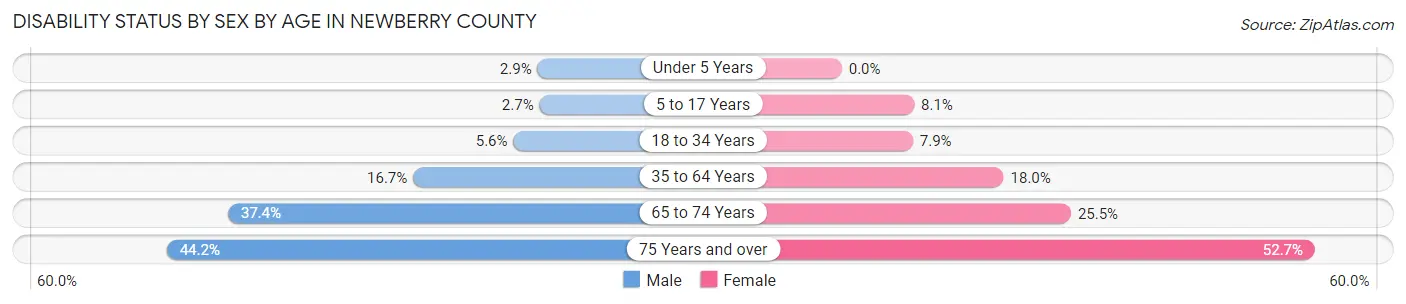
| Age Bracket | Male | Female |
| Under 5 Years | 28 (2.9%) | 0 (0.0%) |
| 5 to 17 Years | 79 (2.7%) | 244 (8.1%) |
| 18 to 34 Years | 232 (5.6%) | 301 (7.9%) |
| 35 to 64 Years | 1,151 (16.7%) | 1,292 (18.0%) |
| 65 to 74 Years | 805 (37.4%) | 597 (25.5%) |
| 75 Years and over | 523 (44.2%) | 885 (52.7%) |
Disability Class by Sex by Age in Newberry County
Disability Class: Hearing Difficulty
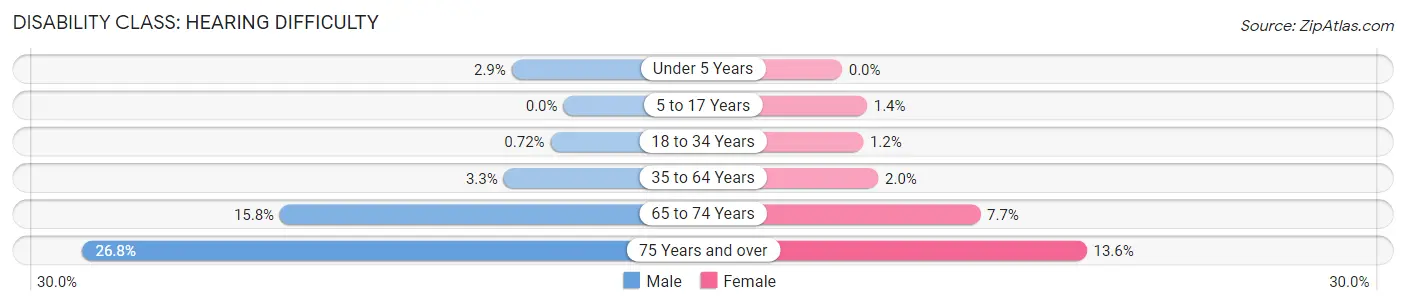
| Age Bracket | Male | Female |
| Under 5 Years | 28 (2.9%) | 0 (0.0%) |
| 5 to 17 Years | 0 (0.0%) | 42 (1.4%) |
| 18 to 34 Years | 30 (0.7%) | 45 (1.2%) |
| 35 to 64 Years | 229 (3.3%) | 145 (2.0%) |
| 65 to 74 Years | 340 (15.8%) | 180 (7.7%) |
| 75 Years and over | 317 (26.8%) | 229 (13.6%) |
Disability Class: Vision Difficulty
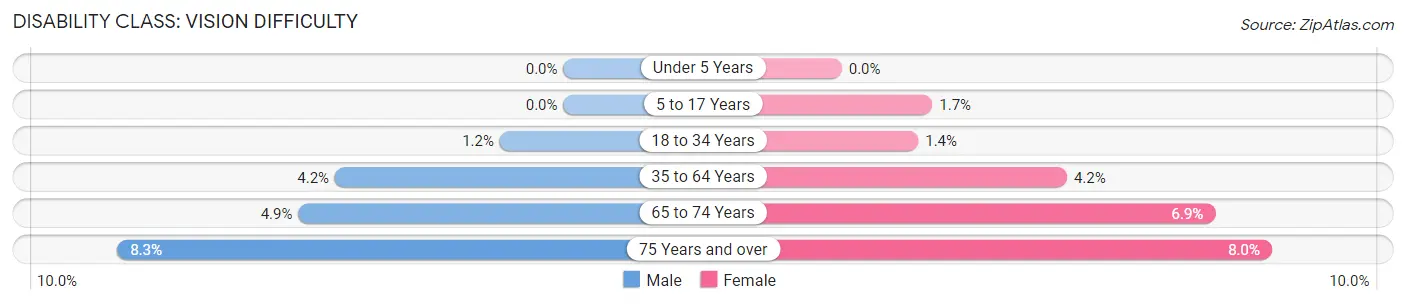
| Age Bracket | Male | Female |
| Under 5 Years | 0 (0.0%) | 0 (0.0%) |
| 5 to 17 Years | 0 (0.0%) | 51 (1.7%) |
| 18 to 34 Years | 49 (1.2%) | 54 (1.4%) |
| 35 to 64 Years | 292 (4.2%) | 300 (4.2%) |
| 65 to 74 Years | 106 (4.9%) | 162 (6.9%) |
| 75 Years and over | 98 (8.3%) | 134 (8.0%) |
Disability Class: Cognitive Difficulty
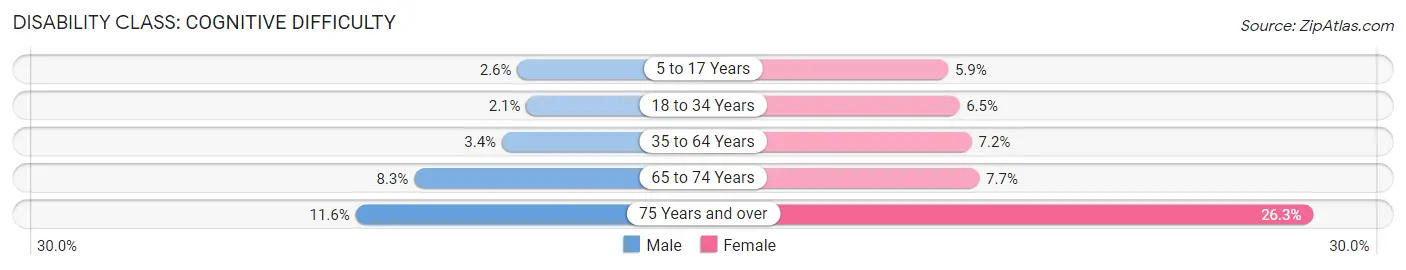
| Age Bracket | Male | Female |
| 5 to 17 Years | 76 (2.6%) | 179 (5.9%) |
| 18 to 34 Years | 86 (2.1%) | 249 (6.5%) |
| 35 to 64 Years | 235 (3.4%) | 518 (7.2%) |
| 65 to 74 Years | 179 (8.3%) | 179 (7.6%) |
| 75 Years and over | 137 (11.6%) | 441 (26.3%) |
Disability Class: Ambulatory Difficulty
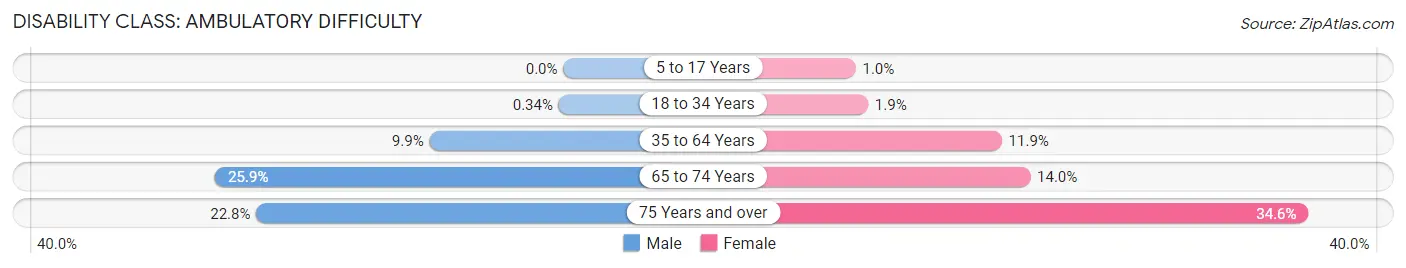
| Age Bracket | Male | Female |
| 5 to 17 Years | 0 (0.0%) | 31 (1.0%) |
| 18 to 34 Years | 14 (0.3%) | 74 (1.9%) |
| 35 to 64 Years | 684 (9.9%) | 851 (11.9%) |
| 65 to 74 Years | 557 (25.9%) | 327 (14.0%) |
| 75 Years and over | 270 (22.8%) | 582 (34.6%) |
Disability Class: Self-Care Difficulty
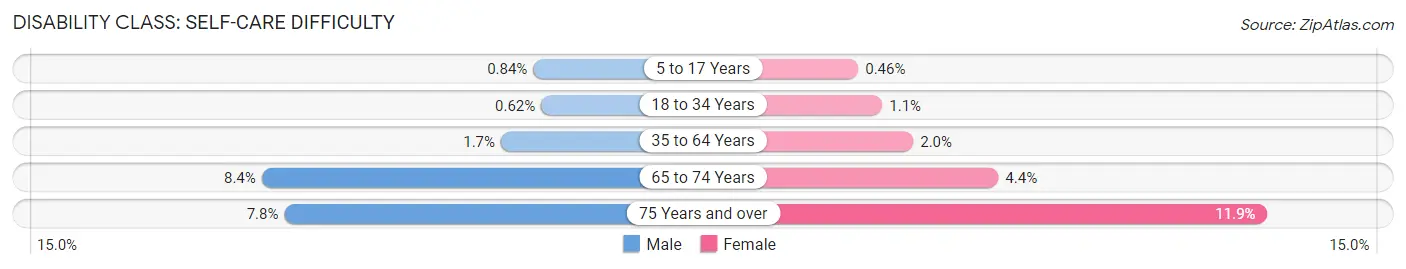
| Age Bracket | Male | Female |
| 5 to 17 Years | 25 (0.8%) | 14 (0.5%) |
| 18 to 34 Years | 26 (0.6%) | 43 (1.1%) |
| 35 to 64 Years | 120 (1.7%) | 143 (2.0%) |
| 65 to 74 Years | 181 (8.4%) | 102 (4.4%) |
| 75 Years and over | 92 (7.8%) | 199 (11.8%) |
Technology Access in Newberry County
Computing Device Access in Newberry County
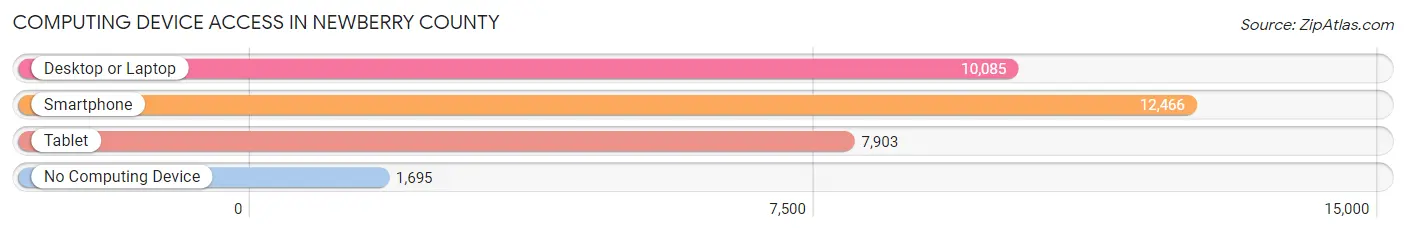
| Device Type | # Households | % Households |
| Desktop or Laptop | 10,085 | 67.1% |
| Smartphone | 12,466 | 83.0% |
| Tablet | 7,903 | 52.6% |
| No Computing Device | 1,695 | 11.3% |
| Total | 15,027 | 100.0% |
Internet Access in Newberry County
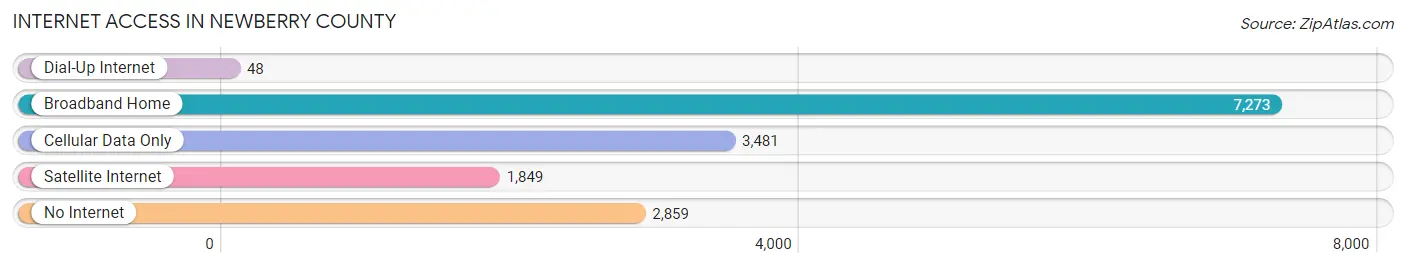
| Internet Type | # Households | % Households |
| Dial-Up Internet | 48 | 0.3% |
| Broadband Home | 7,273 | 48.4% |
| Cellular Data Only | 3,481 | 23.2% |
| Satellite Internet | 1,849 | 12.3% |
| No Internet | 2,859 | 19.0% |
| Total | 15,027 | 100.0% |
Newberry County Summary
Newberry County is located in the midlands of South Carolina, and is part of the Columbia Metropolitan Statistical Area. It is bordered by Laurens, Greenwood, Saluda, and Lexington Counties. The county seat is Newberry, and the county is home to approximately 37,000 people.
History
Newberry County was established in 1785, and was named after the prominent Newberry family of South Carolina. The county was formed from parts of Ninety-Six District and Camden District. The county was originally part of the Cherokee Nation, and the first European settlers arrived in the area in the late 1700s.
The county was an important center of the cotton industry in the 19th century, and the town of Newberry was established in 1821. The town was named after the Newberry family, and was the county seat. The town was an important center of commerce and industry, and was home to several cotton mills.
The county was also an important center of the Civil War. The Battle of Newberry was fought in the county in 1865, and the town of Newberry was burned by Union forces. After the war, the county was rebuilt and the cotton industry flourished.
Geography
Newberry County is located in the midlands of South Carolina, and is part of the Columbia Metropolitan Statistical Area. It is bordered by Laurens, Greenwood, Saluda, and Lexington Counties. The county is located in the Piedmont region of the state, and is characterized by rolling hills and forests. The county is home to several rivers, including the Broad, Saluda, and Enoree Rivers.
The county is home to several state parks, including the Newberry State Park, which is located on the banks of the Broad River. The park is home to several hiking trails, camping sites, and fishing spots.
Economy
The economy of Newberry County is largely based on agriculture and manufacturing. The county is home to several large farms, and is a major producer of cotton, soybeans, and corn. The county is also home to several manufacturing companies, including a large textile mill in the town of Newberry.
The county is also home to several large retail stores, including Walmart, Lowe’s, and Target. The county is also home to several restaurants, hotels, and other businesses.
Demographics
As of the 2010 census, the population of Newberry County was 37,508. The population is largely white (77.3%), with African Americans making up 19.2% of the population. The median household income is $37,845, and the median home value is $117,400.
The county is home to several colleges and universities, including Newberry College, which is a private liberal arts college. The county is also home to several public schools, including Newberry High School.
Conclusion
Newberry County is a rural county located in the midlands of South Carolina. The county is home to approximately 37,000 people, and is largely based on agriculture and manufacturing. The county is home to several state parks, and is an important center of commerce and industry. The county is also home to several colleges and universities, and is an important center of education.
Common Questions
What is Per Capita Income in Newberry County?
Per Capita income in Newberry County is $32,251.
What is the Median Family Income in Newberry County?
Median Family Income in Newberry County is $69,906.
What is the Median Household income in Newberry County?
Median Household Income in Newberry County is $56,706.
What is Income or Wage Gap in Newberry County?
Income or Wage Gap in Newberry County is 9.6%.
Women in Newberry County earn 90.4 cents for every dollar earned by a man.
What is Family Income Deficit in Newberry County?
Family Income Deficit in Newberry County is $10,371.
Families that are below poverty line in Newberry County earn $10,371 less on average than the poverty threshold level.
What is Inequality or Gini Index in Newberry County?
Inequality or Gini Index in Newberry County is 0.46.
What is the Total Population of Newberry County?
Total Population of Newberry County is 37,918.
What is the Total Male Population of Newberry County?
Total Male Population of Newberry County is 18,569.
What is the Total Female Population of Newberry County?
Total Female Population of Newberry County is 19,349.
What is the Ratio of Males per 100 Females in Newberry County?
There are 95.97 Males per 100 Females in Newberry County.
What is the Ratio of Females per 100 Males in Newberry County?
There are 104.20 Females per 100 Males in Newberry County.
What is the Median Population Age in Newberry County?
Median Population Age in Newberry County is 42.6 Years.
What is the Average Family Size in Newberry County
Average Family Size in Newberry County is 3.0 People.
What is the Average Household Size in Newberry County
Average Household Size in Newberry County is 2.4 People.
How Large is the Labor Force in Newberry County?
There are 17,695 People in the Labor Forcein in Newberry County.
What is the Percentage of People in the Labor Force in Newberry County?
57.6% of People are in the Labor Force in Newberry County.
What is the Unemployment Rate in Newberry County?
Unemployment Rate in Newberry County is 3.9%.