Cities with the Highest Percentage of Immigrants from Sweden in the United States
RELATED REPORTS & OPTIONS
Sweden
United States
Compare Cities
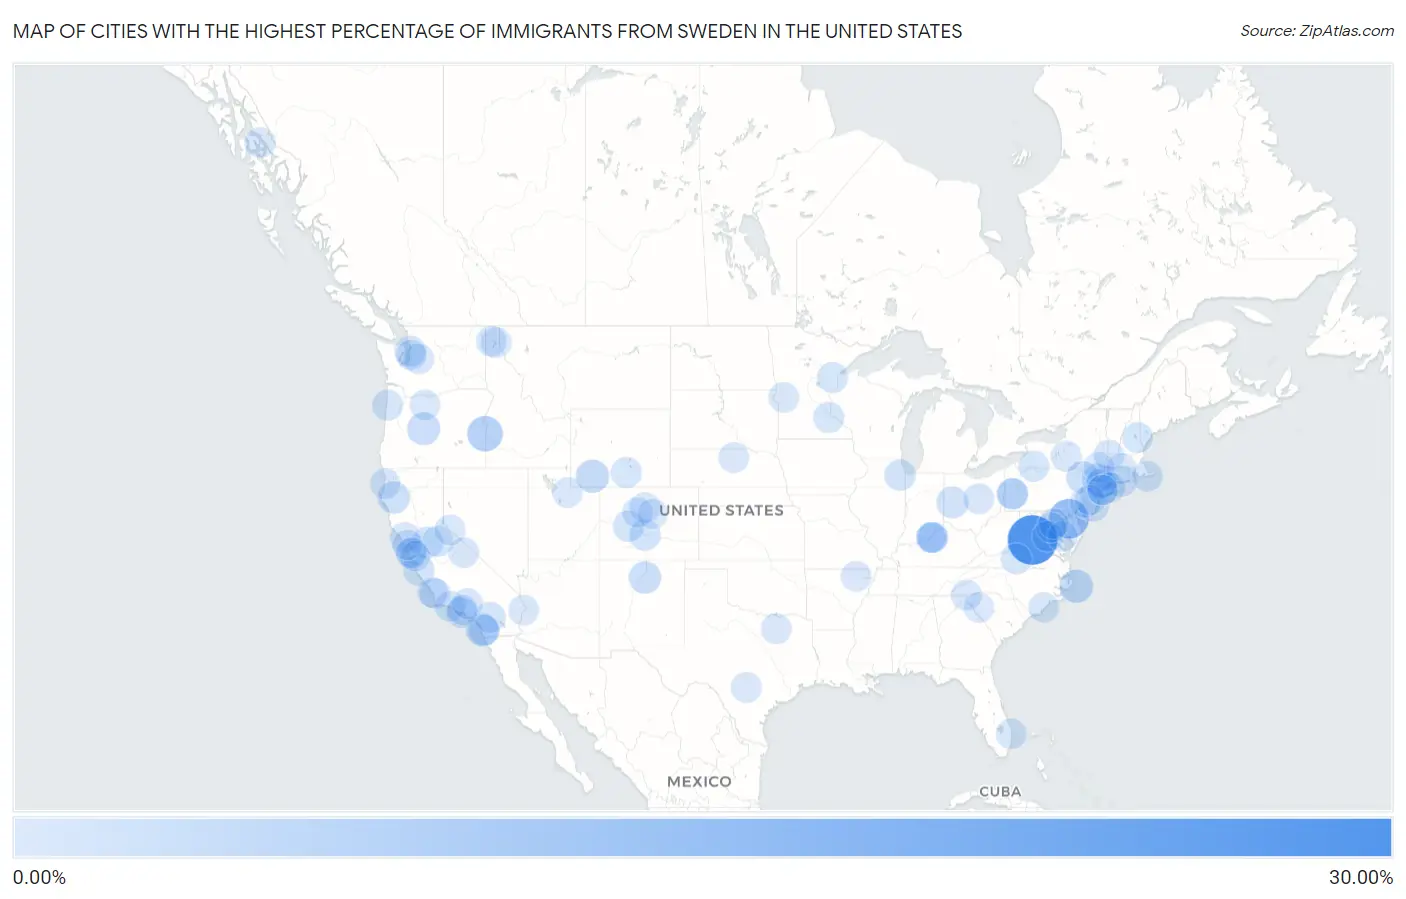
Map of Cities with the Highest Percentage of Immigrants from Sweden in the United States
0.00%
30.00%
Cities with the Highest Percentage of Immigrants from Sweden in the United States
| City | Sweden | vs State | vs National | |
| 1. | Free Union | 25.95% | 0.016%(+25.9)#1 | 0.014%(+25.9)#1 |
| 2. | Kennedyville | 12.72% | 0.013%(+12.7)#1 | 0.014%(+12.7)#2 |
| 3. | West Dummerston | 10.53% | 0.020%(+10.5)#1 | 0.014%(+10.5)#3 |
| 4. | Topstone | 7.30% | 0.026%(+7.28)#1 | 0.014%(+7.29)#4 |
| 5. | Adrian | 7.07% | 0.017%(+7.05)#1 | 0.014%(+7.06)#5 |
| 6. | Salvo | 4.48% | 0.015%(+4.46)#1 | 0.014%(+4.46)#6 |
| 7. | Brandy Station | 4.44% | 0.016%(+4.43)#2 | 0.014%(+4.43)#7 |
| 8. | James Town | 4.13% | 0.011%(+4.12)#1 | 0.014%(+4.12)#8 |
| 9. | Del Mar | 3.97% | 0.031%(+3.94)#1 | 0.014%(+3.95)#9 |
| 10. | Tetherow | 3.49% | 0.017%(+3.47)#2 | 0.014%(+3.48)#10 |
| 11. | Truchas | 3.12% | 0.0070%(+3.12)#1 | 0.014%(+3.11)#11 |
| 12. | Fawn Lake Forest | 2.85% | 0.0086%(+2.84)#1 | 0.014%(+2.83)#12 |
| 13. | Mad River | 2.80% | 0.031%(+2.76)#2 | 0.014%(+2.78)#13 |
| 14. | River Point | 2.56% | 0.017%(+2.55)#3 | 0.014%(+2.55)#14 |
| 15. | Fenwick Borough | 2.50% | 0.026%(+2.47)#2 | 0.014%(+2.49)#15 |
| 16. | Lockington | 2.31% | 0.0042%(+2.31)#1 | 0.014%(+2.30)#16 |
| 17. | Golden S Bridge | 2.06% | 0.019%(+2.04)#1 | 0.014%(+2.04)#17 |
| 18. | Saugatuck | 2.00% | 0.026%(+1.97)#3 | 0.014%(+1.99)#18 |
| 19. | Linden | 1.79% | 0.031%(+1.76)#3 | 0.014%(+1.77)#19 |
| 20. | Rock Ridge | 1.67% | 0.026%(+1.65)#4 | 0.014%(+1.66)#20 |
| 21. | Howard | 1.64% | 0.019%(+1.62)#1 | 0.014%(+1.63)#21 |
| 22. | Carmel Valley Village | 1.62% | 0.031%(+1.58)#4 | 0.014%(+1.60)#22 |
| 23. | Palos Park | 1.61% | 0.0093%(+1.60)#1 | 0.014%(+1.60)#23 |
| 24. | Mount Crested Butte | 1.61% | 0.019%(+1.59)#2 | 0.014%(+1.60)#24 |
| 25. | Briarwood | 1.56% | 0.0050%(+1.55)#1 | 0.014%(+1.54)#25 |
| 26. | Gibsonia | 1.53% | 0.0086%(+1.52)#2 | 0.014%(+1.52)#26 |
| 27. | Hartland | 1.52% | 0.0075%(+1.51)#1 | 0.014%(+1.50)#27 |
| 28. | Westlake Corner | 1.49% | 0.016%(+1.47)#3 | 0.014%(+1.47)#28 |
| 29. | Old Saybrook Center | 1.49% | 0.026%(+1.46)#5 | 0.014%(+1.47)#29 |
| 30. | Woodway | 1.43% | 0.029%(+1.40)#1 | 0.014%(+1.42)#30 |
| 31. | New Trier | 1.39% | 0.0092%(+1.38)#1 | 0.014%(+1.37)#31 |
| 32. | Idyllwild Pine Cove | 1.37% | 0.031%(+1.34)#5 | 0.014%(+1.36)#32 |
| 33. | Pacific City | 1.36% | 0.017%(+1.34)#4 | 0.014%(+1.34)#33 |
| 34. | Columbia | 1.35% | 0.031%(+1.32)#6 | 0.014%(+1.34)#34 |
| 35. | Atlantic Highlands Borough | 1.34% | 0.011%(+1.33)#1 | 0.014%(+1.32)#35 |
| 36. | Cologne | 1.33% | 0.011%(+1.32)#2 | 0.014%(+1.31)#36 |
| 37. | Sinclair | 1.32% | 0.011%(+1.31)#2 | 0.014%(+1.31)#37 |
| 38. | Malibu | 1.26% | 0.031%(+1.23)#7 | 0.014%(+1.25)#38 |
| 39. | Pleasantdale | 1.26% | 0.011%(+1.25)#3 | 0.014%(+1.24)#39 |
| 40. | Fairbanks Ranch | 1.23% | 0.031%(+1.20)#8 | 0.014%(+1.21)#40 |
| 41. | Cornwall On Hudson | 1.18% | 0.019%(+1.16)#2 | 0.014%(+1.17)#41 |
| 42. | Allegany | 1.18% | 0.019%(+1.16)#3 | 0.014%(+1.16)#42 |
| 43. | Southern Gateway | 1.18% | 0.016%(+1.16)#4 | 0.014%(+1.16)#43 |
| 44. | Wolfeboro | 1.14% | 0.018%(+1.12)#1 | 0.014%(+1.12)#44 |
| 45. | Mahtowa | 1.09% | 0.0092%(+1.08)#2 | 0.014%(+1.08)#45 |
| 46. | New Seabury | 1.08% | 0.022%(+1.06)#1 | 0.014%(+1.07)#46 |
| 47. | Silver Ridge | 1.03% | 0.011%(+1.02)#4 | 0.014%(+1.02)#47 |
| 48. | Woodbourne | 1.02% | 0.0086%(+1.01)#3 | 0.014%(+1.00)#48 |
| 49. | Helotes | 1.01% | 0.0097%(+0.997)#1 | 0.014%(+0.992)#49 |
| 50. | Willsboro Point | 1.00% | 0.019%(+0.976)#4 | 0.014%(+0.981)#50 |
| 51. | Topaz Lake | 1.00% | 0.016%(+0.979)#1 | 0.014%(+0.981)#51 |
| 52. | Alberta | 0.99% | 0.0092%(+0.981)#3 | 0.014%(+0.976)#52 |
| 53. | Bakerstown | 0.98% | 0.0086%(+0.971)#4 | 0.014%(+0.965)#53 |
| 54. | Lusby | 0.98% | 0.013%(+0.966)#2 | 0.014%(+0.965)#54 |
| 55. | Palm Beach | 0.98% | 0.022%(+0.956)#1 | 0.014%(+0.964)#55 |
| 56. | Big Lagoon | 0.96% | 0.031%(+0.930)#9 | 0.014%(+0.947)#56 |
| 57. | Oceano | 0.96% | 0.031%(+0.930)#10 | 0.014%(+0.946)#57 |
| 58. | Cortland West | 0.94% | 0.019%(+0.923)#5 | 0.014%(+0.928)#58 |
| 59. | East Hope | 0.90% | 0.0034%(+0.898)#1 | 0.014%(+0.887)#59 |
| 60. | Baxter Estates | 0.87% | 0.019%(+0.852)#6 | 0.014%(+0.857)#60 |
| 61. | Walnut Ridge | 0.87% | 0.0051%(+0.864)#1 | 0.014%(+0.854)#61 |
| 62. | Glasco | 0.84% | 0.019%(+0.824)#7 | 0.014%(+0.829)#62 |
| 63. | La Grange | 0.84% | 0.011%(+0.832)#3 | 0.014%(+0.829)#63 |
| 64. | Wildwood | 0.84% | 0.0050%(+0.835)#2 | 0.014%(+0.826)#64 |
| 65. | Pine Hollow | 0.83% | 0.017%(+0.815)#5 | 0.014%(+0.817)#65 |
| 66. | Bassett | 0.83% | 0.0047%(+0.826)#1 | 0.014%(+0.816)#66 |
| 67. | Fraser | 0.82% | 0.019%(+0.801)#3 | 0.014%(+0.806)#67 |
| 68. | Carpinteria | 0.82% | 0.031%(+0.788)#11 | 0.014%(+0.805)#68 |
| 69. | Mesa | 0.80% | 0.031%(+0.771)#12 | 0.014%(+0.788)#69 |
| 70. | Agua Dulce | 0.79% | 0.031%(+0.760)#13 | 0.014%(+0.777)#70 |
| 71. | Highlands | 0.79% | 0.015%(+0.775)#2 | 0.014%(+0.775)#71 |
| 72. | Hidden Hills | 0.76% | 0.031%(+0.728)#14 | 0.014%(+0.745)#72 |
| 73. | Gambier | 0.75% | 0.0042%(+0.746)#2 | 0.014%(+0.736)#73 |
| 74. | Newtown Borough | 0.74% | 0.0086%(+0.729)#5 | 0.014%(+0.724)#74 |
| 75. | Garrett Park | 0.74% | 0.013%(+0.722)#3 | 0.014%(+0.721)#75 |
| 76. | Williamstown | 0.73% | 0.022%(+0.712)#2 | 0.014%(+0.720)#76 |
| 77. | Penngrove | 0.73% | 0.031%(+0.702)#15 | 0.014%(+0.718)#77 |
| 78. | Petersburg | 0.72% | 0.026%(+0.697)#1 | 0.014%(+0.709)#78 |
| 79. | Crystal Lake | 0.72% | 0.026%(+0.695)#6 | 0.014%(+0.707)#79 |
| 80. | Chappaqua | 0.71% | 0.019%(+0.692)#8 | 0.014%(+0.697)#80 |
| 81. | Portola Valley | 0.71% | 0.031%(+0.674)#16 | 0.014%(+0.691)#81 |
| 82. | Dover | 0.69% | 0.0034%(+0.691)#2 | 0.014%(+0.680)#82 |
| 83. | Old Field | 0.69% | 0.019%(+0.667)#9 | 0.014%(+0.672)#83 |
| 84. | Riverbend | 0.69% | 0.029%(+0.657)#2 | 0.014%(+0.672)#84 |
| 85. | Bayshore | 0.68% | 0.015%(+0.670)#3 | 0.014%(+0.671)#85 |
| 86. | Big River | 0.68% | 0.031%(+0.650)#17 | 0.014%(+0.667)#86 |
| 87. | Emerald Lake Hills | 0.68% | 0.031%(+0.647)#18 | 0.014%(+0.664)#87 |
| 88. | Los Gatos | 0.67% | 0.031%(+0.637)#19 | 0.014%(+0.654)#88 |
| 89. | Cranbury | 0.66% | 0.011%(+0.647)#5 | 0.014%(+0.644)#89 |
| 90. | Lucas | 0.66% | 0.0097%(+0.649)#2 | 0.014%(+0.644)#90 |
| 91. | Mantua | 0.65% | 0.016%(+0.635)#5 | 0.014%(+0.636)#91 |
| 92. | Vail | 0.64% | 0.019%(+0.623)#4 | 0.014%(+0.627)#92 |
| 93. | Druid Hills | 0.63% | 0.0050%(+0.626)#3 | 0.014%(+0.617)#93 |
| 94. | Oakley | 0.63% | 0.015%(+0.616)#1 | 0.014%(+0.617)#94 |
| 95. | Avila Beach | 0.63% | 0.031%(+0.594)#20 | 0.014%(+0.611)#95 |
| 96. | Hunts Point | 0.62% | 0.029%(+0.591)#3 | 0.014%(+0.605)#96 |
| 97. | Due West | 0.61% | 0.014%(+0.596)#1 | 0.014%(+0.596)#97 |
| 98. | Roslyn Harbor | 0.61% | 0.019%(+0.591)#10 | 0.014%(+0.596)#98 |
| 99. | Sausalito | 0.61% | 0.031%(+0.577)#21 | 0.014%(+0.594)#99 |
| 100. | Aspen Park | 0.60% | 0.019%(+0.578)#5 | 0.014%(+0.582)#100 |
Common Questions
What are the Top 10 Cities with the Highest Percentage of Immigrants from Sweden in the United States?
Top 10 Cities with the Highest Percentage of Immigrants from Sweden in the United States are:
#1
25.95%
#2
12.72%
#3
7.07%
#4
4.48%
#5
4.13%
#6
3.97%
#7
3.49%
#8
3.12%
#9
2.85%
#10
2.80%
What city has the Highest Percentage of Immigrants from Sweden in the United States?
Free Union has the Highest Percentage of Immigrants from Sweden in the United States with 25.95%.
What is the Percentage of Immigrants from Sweden in the United States?
Percentage of Immigrants from Sweden in the United States is 0.014%.