Cities with the Fewest Births per 1,000 Women Receiving Public Assitance in the United States
RELATED REPORTS & OPTIONS
Lowest Birth Rate | Public Income
United States
Compare Cities
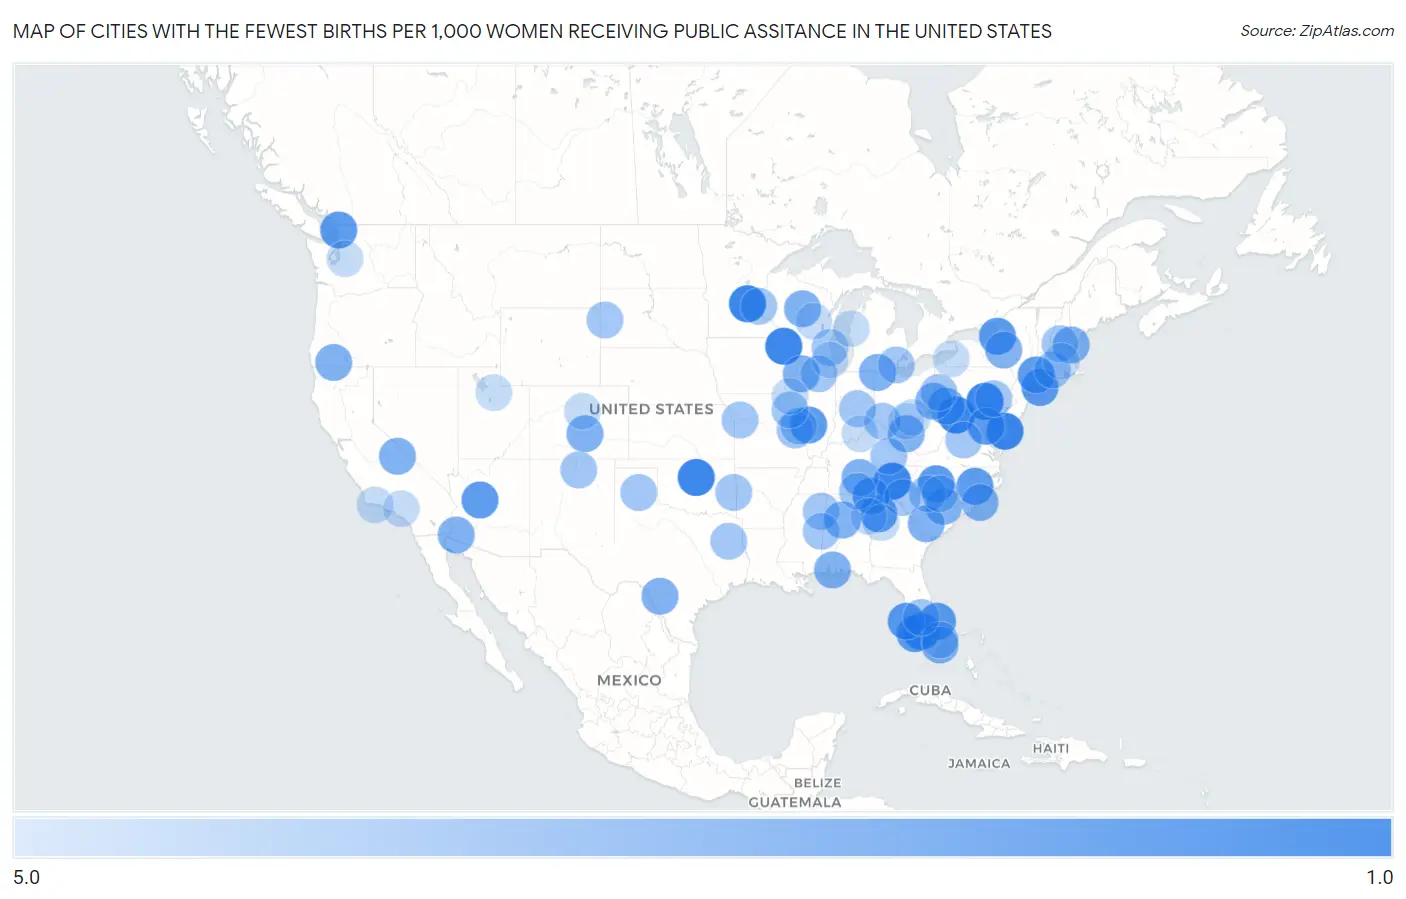
Map of Cities with the Fewest Births per 1,000 Women Receiving Public Assitance in the United States
5.0
0.0
Cities with the Fewest Births per 1,000 Women Receiving Public Assitance in the United States
| City | Births / 1,000 Women | vs State | vs National | |
| 1. | Albertville | 1.0 | 57.0(-56.0)#1 | 52.0(-51.0)#1 |
| 2. | Prairie Du Chien | 1.0 | 51.0(-50.0)#1 | 52.0(-51.0)#2 |
| 3. | Labelle | 1.0 | 48.0(-47.0)#1 | 52.0(-51.0)#3 |
| 4. | Keyser | 1.0 | 49.0(-48.0)#1 | 52.0(-51.0)#4 |
| 5. | Laurel | 1.0 | 47.0(-46.0)#1 | 52.0(-51.0)#5 |
| 6. | Gatlinburg | 1.0 | 52.0(-51.0)#1 | 52.0(-51.0)#6 |
| 7. | Messiah College | 1.0 | 51.0(-50.0)#1 | 52.0(-51.0)#7 |
| 8. | Langston | 1.0 | 57.0(-56.0)#1 | 52.0(-51.0)#8 |
| 9. | Camp Springs | 2.0 | 51.0(-49.0)#1 | 52.0(-50.0)#9 |
| 10. | Vinings | 2.0 | 51.0(-49.0)#1 | 52.0(-50.0)#10 |
| 11. | Stony Brook University | 2.0 | 48.0(-46.0)#1 | 52.0(-50.0)#11 |
| 12. | Mcgregor | 2.0 | 48.0(-46.0)#2 | 52.0(-50.0)#12 |
| 13. | Greenville | 2.0 | 51.0(-49.0)#1 | 52.0(-50.0)#13 |
| 14. | New Milford | 2.0 | 43.0(-41.0)#1 | 52.0(-50.0)#14 |
| 15. | Indian River Estates | 2.0 | 48.0(-46.0)#3 | 52.0(-50.0)#15 |
| 16. | Williamson | 2.0 | 55.0(-53.0)#1 | 52.0(-50.0)#16 |
| 17. | Kensington Park | 2.0 | 48.0(-46.0)#4 | 52.0(-50.0)#17 |
| 18. | Granite Quarry | 2.0 | 50.0(-48.0)#1 | 52.0(-50.0)#18 |
| 19. | Varnell | 2.0 | 51.0(-49.0)#2 | 52.0(-50.0)#19 |
| 20. | Geneva | 2.0 | 53.0(-51.0)#1 | 52.0(-50.0)#20 |
| 21. | Snow Hill | 2.0 | 50.0(-48.0)#2 | 52.0(-50.0)#21 |
| 22. | Pulaski | 2.0 | 48.0(-46.0)#2 | 52.0(-50.0)#22 |
| 23. | Loretto Borough | 2.0 | 51.0(-49.0)#2 | 52.0(-50.0)#23 |
| 24. | Durham | 3.0 | 46.0(-43.0)#1 | 52.0(-49.0)#24 |
| 25. | Pleasant Grove | 3.0 | 51.0(-48.0)#1 | 52.0(-49.0)#25 |
| 26. | Elkins Park | 3.0 | 51.0(-48.0)#3 | 52.0(-49.0)#26 |
| 27. | Robertsdale | 3.0 | 51.0(-48.0)#2 | 52.0(-49.0)#27 |
| 28. | Talent | 3.0 | 46.0(-43.0)#1 | 52.0(-49.0)#28 |
| 29. | Darlington | 3.0 | 53.0(-50.0)#1 | 52.0(-49.0)#29 |
| 30. | Smithville | 3.0 | 52.0(-49.0)#2 | 52.0(-49.0)#30 |
| 31. | Florence | 3.0 | 49.0(-46.0)#1 | 52.0(-49.0)#31 |
| 32. | Denmark | 3.0 | 53.0(-50.0)#2 | 52.0(-49.0)#32 |
| 33. | Bal Harbour | 3.0 | 48.0(-45.0)#5 | 52.0(-49.0)#33 |
| 34. | Reynoldsville Borough | 3.0 | 51.0(-48.0)#4 | 52.0(-49.0)#34 |
| 35. | Wellton | 3.0 | 55.0(-52.0)#2 | 52.0(-49.0)#35 |
| 36. | Bentleyville Borough | 3.0 | 51.0(-48.0)#5 | 52.0(-49.0)#36 |
| 37. | Leith Hatfield | 3.0 | 51.0(-48.0)#6 | 52.0(-49.0)#37 |
| 38. | Sneads Ferry | 3.0 | 50.0(-47.0)#3 | 52.0(-49.0)#38 |
| 39. | Prophetstown | 3.0 | 51.0(-48.0)#2 | 52.0(-49.0)#39 |
| 40. | Big Pine | 3.0 | 48.0(-45.0)#1 | 52.0(-49.0)#40 |
| 41. | Morrisville | 3.0 | 48.0(-45.0)#3 | 52.0(-49.0)#41 |
| 42. | Marathon City | 3.0 | 51.0(-48.0)#2 | 52.0(-49.0)#42 |
| 43. | Pioneer | 3.0 | 55.0(-52.0)#1 | 52.0(-49.0)#43 |
| 44. | Ceredo | 3.0 | 49.0(-46.0)#2 | 52.0(-49.0)#44 |
| 45. | Bethany | 3.0 | 49.0(-46.0)#3 | 52.0(-49.0)#45 |
| 46. | La Pryor | 3.0 | 56.0(-53.0)#1 | 52.0(-49.0)#46 |
| 47. | Storrs | 4.0 | 43.0(-39.0)#2 | 52.0(-48.0)#47 |
| 48. | Wilton Manors | 4.0 | 48.0(-44.0)#6 | 52.0(-48.0)#48 |
| 49. | Wakefield-Peace Dale | 4.0 | 46.0(-42.0)#1 | 52.0(-48.0)#49 |
| 50. | Avon Park | 4.0 | 48.0(-44.0)#7 | 52.0(-48.0)#50 |
| 51. | University Of Virginia | 4.0 | 49.0(-45.0)#1 | 52.0(-48.0)#51 |
| 52. | St Francis | 4.0 | 51.0(-47.0)#3 | 52.0(-48.0)#52 |
| 53. | Aliquippa | 4.0 | 51.0(-47.0)#7 | 52.0(-48.0)#53 |
| 54. | Maplewood | 4.0 | 55.0(-51.0)#1 | 52.0(-48.0)#54 |
| 55. | Washington Borough | 4.0 | 51.0(-47.0)#1 | 52.0(-48.0)#55 |
| 56. | Amory | 4.0 | 55.0(-51.0)#1 | 52.0(-48.0)#56 |
| 57. | Taos | 4.0 | 55.0(-51.0)#1 | 52.0(-48.0)#57 |
| 58. | Cumberland | 4.0 | 54.0(-50.0)#1 | 52.0(-48.0)#58 |
| 59. | Lewisburg Borough | 4.0 | 51.0(-47.0)#8 | 52.0(-48.0)#59 |
| 60. | Gibraltar | 4.0 | 52.0(-48.0)#1 | 52.0(-48.0)#60 |
| 61. | India Hook | 4.0 | 53.0(-49.0)#3 | 52.0(-48.0)#61 |
| 62. | Grant | 4.0 | 57.0(-53.0)#2 | 52.0(-48.0)#62 |
| 63. | Buckner | 4.0 | 55.0(-51.0)#2 | 52.0(-48.0)#63 |
| 64. | Polkton | 4.0 | 50.0(-46.0)#4 | 52.0(-48.0)#64 |
| 65. | Sewanee | 4.0 | 52.0(-48.0)#3 | 52.0(-48.0)#65 |
| 66. | Batavia | 4.0 | 55.0(-51.0)#2 | 52.0(-48.0)#66 |
| 67. | Siena College | 4.0 | 48.0(-44.0)#4 | 52.0(-48.0)#67 |
| 68. | Manchester | 4.0 | 53.0(-49.0)#1 | 52.0(-48.0)#68 |
| 69. | South Roxana | 4.0 | 51.0(-47.0)#3 | 52.0(-48.0)#69 |
| 70. | Somonauk | 4.0 | 51.0(-47.0)#4 | 52.0(-48.0)#70 |
| 71. | Deadwood | 4.0 | 64.0(-60.0)#1 | 52.0(-48.0)#71 |
| 72. | Avon | 4.0 | 51.0(-47.0)#9 | 52.0(-48.0)#72 |
| 73. | Arp | 4.0 | 56.0(-52.0)#2 | 52.0(-48.0)#73 |
| 74. | Contoocook | 4.0 | 46.0(-42.0)#2 | 52.0(-48.0)#74 |
| 75. | Griggsville | 4.0 | 51.0(-47.0)#5 | 52.0(-48.0)#75 |
| 76. | Claude | 4.0 | 56.0(-52.0)#3 | 52.0(-48.0)#76 |
| 77. | Williamstown Borough | 4.0 | 51.0(-47.0)#10 | 52.0(-48.0)#77 |
| 78. | Six Mile | 4.0 | 53.0(-49.0)#4 | 52.0(-48.0)#78 |
| 79. | Shady Point | 4.0 | 57.0(-53.0)#2 | 52.0(-48.0)#79 |
| 80. | Scooba | 4.0 | 55.0(-51.0)#2 | 52.0(-48.0)#80 |
| 81. | Athens | 5.0 | 55.0(-50.0)#3 | 52.0(-47.0)#81 |
| 82. | West Chester Borough | 5.0 | 51.0(-46.0)#11 | 52.0(-47.0)#82 |
| 83. | Macomb | 5.0 | 51.0(-46.0)#6 | 52.0(-47.0)#83 |
| 84. | Isla Vista | 5.0 | 48.0(-43.0)#2 | 52.0(-47.0)#84 |
| 85. | Ridgefield Borough | 5.0 | 51.0(-46.0)#2 | 52.0(-47.0)#85 |
| 86. | Sierra Madre | 5.0 | 48.0(-43.0)#3 | 52.0(-47.0)#86 |
| 87. | Pajaros | 5.0 | 28.0(-23.0)#1 | 52.0(-47.0)#87 |
| 88. | Sellersburg | 5.0 | 54.0(-49.0)#2 | 52.0(-47.0)#88 |
| 89. | Fredonia | 5.0 | 48.0(-43.0)#5 | 52.0(-47.0)#89 |
| 90. | Evergreen | 5.0 | 49.0(-44.0)#2 | 52.0(-47.0)#90 |
| 91. | Park City | 5.0 | 59.0(-54.0)#1 | 52.0(-47.0)#91 |
| 92. | Hampton | 5.0 | 51.0(-46.0)#3 | 52.0(-47.0)#92 |
| 93. | Park City | 5.0 | 51.0(-46.0)#7 | 52.0(-47.0)#93 |
| 94. | Ludington | 5.0 | 52.0(-47.0)#2 | 52.0(-47.0)#94 |
| 95. | Bremen | 5.0 | 51.0(-46.0)#4 | 52.0(-47.0)#95 |
| 96. | Hobart | 5.0 | 53.0(-48.0)#2 | 52.0(-47.0)#96 |
| 97. | Northborough | 5.0 | 44.0(-39.0)#1 | 52.0(-47.0)#97 |
| 98. | Waupaca | 5.0 | 51.0(-46.0)#4 | 52.0(-47.0)#98 |
| 99. | Guanica | 5.0 | 28.0(-23.0)#2 | 52.0(-47.0)#99 |
| 100. | Wellston | 5.0 | 55.0(-50.0)#4 | 52.0(-47.0)#100 |
Common Questions
What are the Top 10 Cities with the Fewest Births per 1,000 Women Receiving Public Assitance in the United States?
Top 10 Cities with the Fewest Births per 1,000 Women Receiving Public Assitance in the United States are:
#1
1.0
#2
1.0
#3
1.0
#4
1.0
#5
1.0
#6
1.0
#7
1.0
#8
1.0
#9
2.0
#10
2.0
What city has the Fewest Births per 1,000 Women Receiving Public Assitance in the United States?
Albertville has the Fewest Births per 1,000 Women Receiving Public Assitance in the United States with 1.0.
What is the Number of Births per 1,000 Women Receiving Public Assitance in the United States?
Number of Births per 1,000 Women Receiving Public Assitance in the United States is 52.0.