Cities with the Highest Percentage of Jordanian Population in the United States
RELATED REPORTS & OPTIONS
Jordanian
United States
Compare Cities
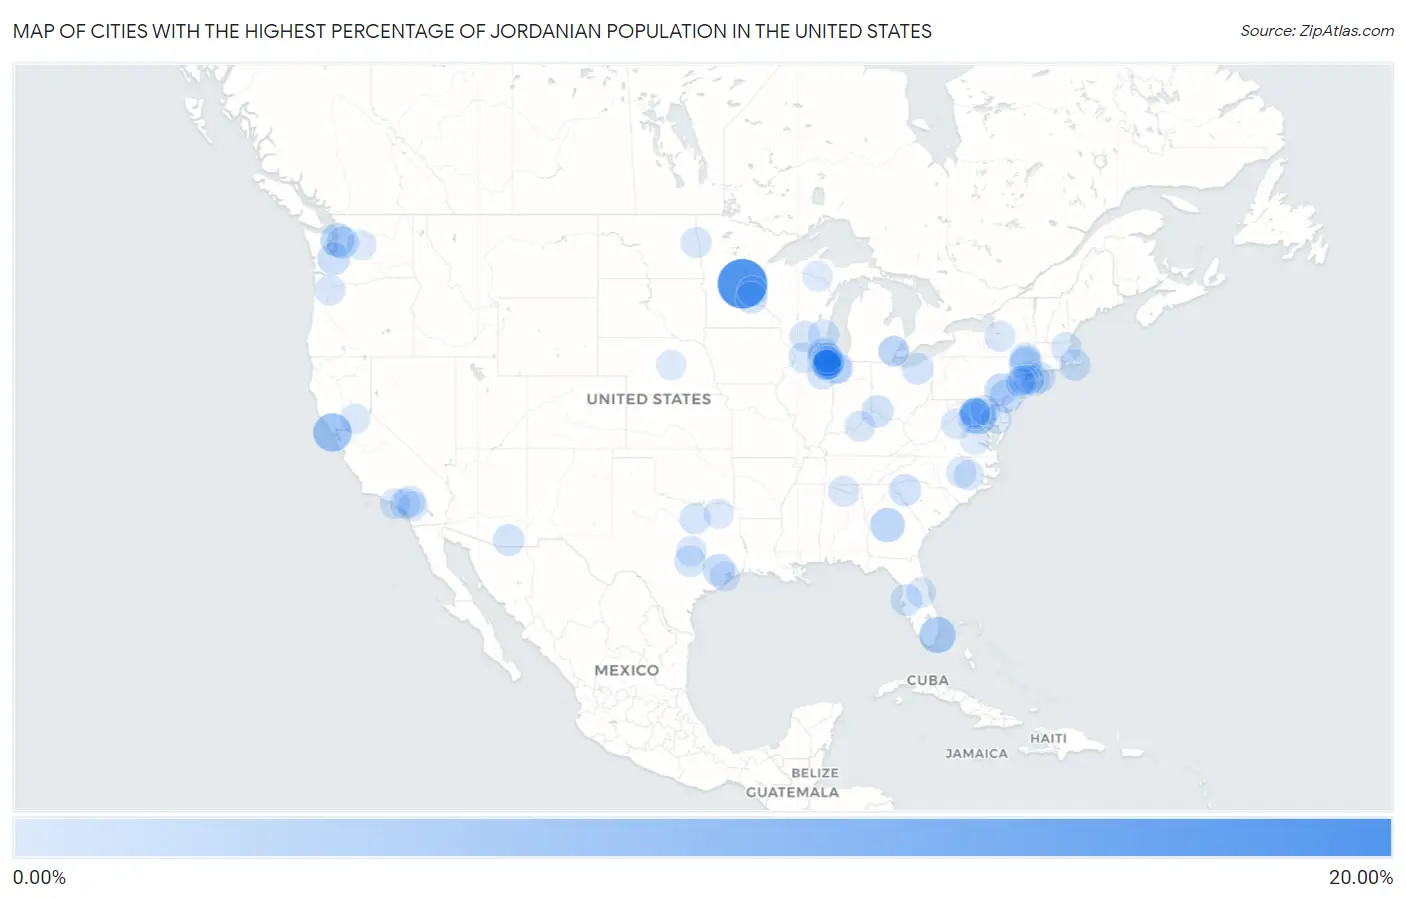
Map of Cities with the Highest Percentage of Jordanian Population in the United States
0.00%
20.00%
Cities with the Highest Percentage of Jordanian Population in the United States
| City | Jordanian | vs State | vs National | |
| 1. | Ronneby | 18.52% | 0.014%(+18.5)#1 | 0.028%(+18.5)#1 |
| 2. | Stinson Beach | 8.09% | 0.040%(+8.05)#1 | 0.028%(+8.06)#2 |
| 3. | Teterboro Borough | 7.69% | 0.060%(+7.63)#1 | 0.028%(+7.66)#3 |
| 4. | North Bay Village | 6.01% | 0.022%(+5.99)#1 | 0.028%(+5.98)#4 |
| 5. | Woodburn | 5.55% | 0.049%(+5.50)#1 | 0.028%(+5.52)#5 |
| 6. | Hurleyville | 4.92% | 0.030%(+4.89)#1 | 0.028%(+4.90)#6 |
| 7. | Centerville | 4.42% | 0.0093%(+4.41)#1 | 0.028%(+4.39)#7 |
| 8. | Woodway | 3.85% | 0.029%(+3.82)#1 | 0.028%(+3.82)#8 |
| 9. | Worth | 3.82% | 0.080%(+3.74)#1 | 0.028%(+3.79)#9 |
| 10. | Camp Barrett | 3.39% | 0.049%(+3.34)#2 | 0.028%(+3.36)#10 |
| 11. | Folsom | 3.16% | 0.015%(+3.15)#1 | 0.028%(+3.14)#11 |
| 12. | Halfway House | 3.14% | 0.015%(+3.12)#2 | 0.028%(+3.11)#12 |
| 13. | Orland Hills | 2.73% | 0.080%(+2.65)#2 | 0.028%(+2.70)#13 |
| 14. | Yelm | 2.70% | 0.029%(+2.67)#2 | 0.028%(+2.67)#14 |
| 15. | Union Hill Novelty Hill | 2.59% | 0.029%(+2.56)#3 | 0.028%(+2.56)#15 |
| 16. | Paulsboro Borough | 2.49% | 0.060%(+2.43)#2 | 0.028%(+2.46)#16 |
| 17. | Jersey Village | 2.47% | 0.041%(+2.43)#1 | 0.028%(+2.44)#17 |
| 18. | Palos Hills | 2.46% | 0.080%(+2.38)#3 | 0.028%(+2.43)#18 |
| 19. | Hickory Hills | 2.33% | 0.080%(+2.25)#4 | 0.028%(+2.30)#19 |
| 20. | Newtown | 2.27% | 0.040%(+2.23)#1 | 0.028%(+2.24)#20 |
| 21. | Chicago Ridge | 2.25% | 0.080%(+2.17)#5 | 0.028%(+2.23)#21 |
| 22. | West Pelzer | 2.16% | 0.0065%(+2.16)#1 | 0.028%(+2.14)#22 |
| 23. | Hilltop | 2.09% | 0.014%(+2.08)#2 | 0.028%(+2.06)#23 |
| 24. | Marlboro | 2.06% | 0.030%(+2.03)#2 | 0.028%(+2.03)#24 |
| 25. | Larchmont | 2.05% | 0.030%(+2.02)#3 | 0.028%(+2.02)#25 |
| 26. | Linton Hall | 2.02% | 0.049%(+1.97)#3 | 0.028%(+1.99)#26 |
| 27. | Temple Terrace | 1.94% | 0.022%(+1.92)#2 | 0.028%(+1.91)#27 |
| 28. | Bedford | 1.87% | 0.040%(+1.83)#2 | 0.028%(+1.84)#28 |
| 29. | Whetstone | 1.84% | 0.029%(+1.81)#1 | 0.028%(+1.81)#29 |
| 30. | New Seabury | 1.76% | 0.021%(+1.74)#1 | 0.028%(+1.73)#30 |
| 31. | Hyde Park | 1.73% | 0.030%(+1.70)#4 | 0.028%(+1.70)#31 |
| 32. | Downingtown Borough | 1.71% | 0.015%(+1.69)#3 | 0.028%(+1.68)#32 |
| 33. | Eldred Borough | 1.69% | 0.015%(+1.68)#4 | 0.028%(+1.66)#33 |
| 34. | Pflugerville | 1.63% | 0.041%(+1.59)#2 | 0.028%(+1.60)#34 |
| 35. | Westlake | 1.62% | 0.041%(+1.57)#3 | 0.028%(+1.59)#35 |
| 36. | El Sobrante Cdp Riverside County | 1.60% | 0.040%(+1.56)#2 | 0.028%(+1.57)#36 |
| 37. | Woodland Park Borough | 1.58% | 0.060%(+1.52)#3 | 0.028%(+1.55)#37 |
| 38. | Reddick | 1.50% | 0.080%(+1.42)#6 | 0.028%(+1.47)#38 |
| 39. | Shorewood Forest | 1.49% | 0.024%(+1.47)#1 | 0.028%(+1.46)#39 |
| 40. | Lannon | 1.48% | 0.012%(+1.47)#1 | 0.028%(+1.45)#40 |
| 41. | Milltown Borough | 1.47% | 0.060%(+1.41)#4 | 0.028%(+1.44)#41 |
| 42. | South Barrington | 1.44% | 0.080%(+1.36)#7 | 0.028%(+1.41)#42 |
| 43. | Arcola | 1.44% | 0.049%(+1.39)#4 | 0.028%(+1.41)#43 |
| 44. | Loma Linda | 1.39% | 0.040%(+1.35)#3 | 0.028%(+1.36)#44 |
| 45. | Kenilworth Borough | 1.35% | 0.060%(+1.29)#5 | 0.028%(+1.33)#45 |
| 46. | Miller Place | 1.35% | 0.030%(+1.32)#5 | 0.028%(+1.32)#46 |
| 47. | Ridgefield Borough | 1.32% | 0.060%(+1.26)#6 | 0.028%(+1.29)#47 |
| 48. | Deer Park | 1.31% | 0.030%(+1.28)#6 | 0.028%(+1.29)#48 |
| 49. | Langdon Place | 1.29% | 0.021%(+1.26)#1 | 0.028%(+1.26)#49 |
| 50. | Triana | 1.28% | 0.0028%(+1.28)#1 | 0.028%(+1.26)#50 |
| 51. | Reynolds | 1.26% | 0.0026%(+1.26)#1 | 0.028%(+1.23)#51 |
| 52. | Shorewood Hills | 1.25% | 0.012%(+1.23)#2 | 0.028%(+1.22)#52 |
| 53. | Port Barrington | 1.22% | 0.080%(+1.14)#8 | 0.028%(+1.19)#53 |
| 54. | Crestwood | 1.22% | 0.080%(+1.14)#9 | 0.028%(+1.19)#54 |
| 55. | Wayne | 1.21% | 0.080%(+1.13)#10 | 0.028%(+1.19)#55 |
| 56. | Winfield | 1.19% | 0.024%(+1.17)#2 | 0.028%(+1.16)#56 |
| 57. | Loudoun Valley Estates | 1.15% | 0.049%(+1.10)#5 | 0.028%(+1.12)#57 |
| 58. | Canastota | 1.14% | 0.030%(+1.11)#7 | 0.028%(+1.11)#58 |
| 59. | Wilkinsburg Borough | 1.12% | 0.015%(+1.10)#5 | 0.028%(+1.09)#59 |
| 60. | Bull Mountain | 1.09% | 0.0085%(+1.09)#1 | 0.028%(+1.07)#60 |
| 61. | Tinley Park | 1.09% | 0.080%(+1.01)#11 | 0.028%(+1.06)#61 |
| 62. | Alondra Park | 1.08% | 0.040%(+1.04)#4 | 0.028%(+1.05)#62 |
| 63. | Orland Park | 1.08% | 0.080%(+1.00)#12 | 0.028%(+1.05)#63 |
| 64. | Oak Lawn | 1.06% | 0.080%(+0.985)#13 | 0.028%(+1.04)#64 |
| 65. | Massanetta Springs | 1.04% | 0.049%(+0.990)#6 | 0.028%(+1.01)#65 |
| 66. | Polo | 1.03% | 0.080%(+0.952)#14 | 0.028%(+1.00)#66 |
| 67. | Stoneham | 1.03% | 0.021%(+1.01)#2 | 0.028%(+1.00)#67 |
| 68. | Clayton | 1.03% | 0.022%(+1.01)#1 | 0.028%(+1.00)#68 |
| 69. | Plandome | 1.03% | 0.030%(+0.995)#8 | 0.028%(+0.997)#69 |
| 70. | Avenel | 1.02% | 0.060%(+0.963)#7 | 0.028%(+0.994)#70 |
| 71. | Coronita | 1.02% | 0.040%(+0.980)#5 | 0.028%(+0.992)#71 |
| 72. | Palos Heights | 1.02% | 0.080%(+0.940)#15 | 0.028%(+0.991)#72 |
| 73. | Preakness | 1.01% | 0.060%(+0.952)#8 | 0.028%(+0.983)#73 |
| 74. | Westmont | 1.01% | 0.080%(+0.930)#16 | 0.028%(+0.981)#74 |
| 75. | Palos Park | 0.97% | 0.080%(+0.892)#17 | 0.028%(+0.944)#75 |
| 76. | East Bethel | 0.92% | 0.014%(+0.902)#3 | 0.028%(+0.888)#76 |
| 77. | Belton | 0.91% | 0.041%(+0.867)#4 | 0.028%(+0.879)#77 |
| 78. | Winchester | 0.89% | 0.040%(+0.851)#6 | 0.028%(+0.863)#78 |
| 79. | Dearborn | 0.88% | 0.051%(+0.824)#1 | 0.028%(+0.847)#79 |
| 80. | Nassau Bay | 0.86% | 0.041%(+0.822)#5 | 0.028%(+0.835)#80 |
| 81. | Fremont | 0.86% | 0.022%(+0.833)#2 | 0.028%(+0.827)#81 |
| 82. | Dearborn Heights | 0.83% | 0.051%(+0.780)#2 | 0.028%(+0.802)#82 |
| 83. | Burbank | 0.83% | 0.080%(+0.748)#18 | 0.028%(+0.799)#83 |
| 84. | Summit | 0.82% | 0.060%(+0.765)#9 | 0.028%(+0.796)#84 |
| 85. | North Laurel | 0.82% | 0.017%(+0.807)#1 | 0.028%(+0.795)#85 |
| 86. | Caspian | 0.82% | 0.051%(+0.767)#3 | 0.028%(+0.790)#86 |
| 87. | Lincoln Park | 0.80% | 0.030%(+0.770)#9 | 0.028%(+0.772)#87 |
| 88. | Trappe | 0.79% | 0.017%(+0.769)#2 | 0.028%(+0.757)#88 |
| 89. | Schiller Park | 0.78% | 0.080%(+0.696)#19 | 0.028%(+0.748)#89 |
| 90. | Ashburn | 0.77% | 0.049%(+0.723)#7 | 0.028%(+0.743)#90 |
| 91. | Hasbrouck Heights Borough | 0.77% | 0.060%(+0.710)#10 | 0.028%(+0.742)#91 |
| 92. | Ord | 0.75% | 0.0094%(+0.745)#1 | 0.028%(+0.726)#92 |
| 93. | Prospect Borough | 0.74% | 0.015%(+0.725)#6 | 0.028%(+0.712)#93 |
| 94. | Homer Glen | 0.74% | 0.080%(+0.659)#20 | 0.028%(+0.710)#94 |
| 95. | Manchester | 0.73% | 0.049%(+0.680)#8 | 0.028%(+0.701)#95 |
| 96. | Secaucus | 0.73% | 0.060%(+0.667)#11 | 0.028%(+0.698)#96 |
| 97. | Rio Pinar | 0.71% | 0.022%(+0.685)#3 | 0.028%(+0.678)#97 |
| 98. | Folsom | 0.69% | 0.040%(+0.651)#7 | 0.028%(+0.662)#98 |
| 99. | Leavenworth | 0.69% | 0.029%(+0.658)#4 | 0.028%(+0.659)#99 |
| 100. | Tira | 0.68% | 0.041%(+0.641)#6 | 0.028%(+0.653)#100 |
Common Questions
What are the Top 10 Cities with the Highest Percentage of Jordanian Population in the United States?
Top 10 Cities with the Highest Percentage of Jordanian Population in the United States are:
#1
18.52%
#2
8.09%
#3
6.01%
#4
5.55%
#5
4.42%
#6
3.85%
#7
3.82%
#8
3.16%
#9
3.14%
#10
2.73%
What city has the Highest Percentage of Jordanian Population in the United States?
Ronneby has the Highest Percentage of Jordanian Population in the United States with 18.52%.
What is the Percentage of Jordanian Population in the United States?
Percentage of Jordanian Population in the United States is 0.028%.