Indiana Map & Demographics
Indiana Map
Indiana Overview
Dec 11, 1816
INCORPORATED
36,417
TOTAL AREA [ SQ MI ]
35,823
LAND AREA [ SQ MI ]
594
WATER AREA [ SQ MI ]
700
ELEVATION AVG [ FT ]
1,257
ELEVATION HIGH [ FT ]
320
ELEVATION LOW [ FT ]
189.4
POP DENSITY [ PPL / SQ MI ]
$35,578
PER CAPITA INCOME
$84,657
AVG FAMILY INCOME
$67,173
AVG HOUSEHOLD INCOME
30.9%
WAGE / INCOME GAP [ % ]
69.1¢/ $1
WAGE / INCOME GAP [ $ ]
$11,207
FAMILY INCOME DEFICIT
0.45
INEQUALITY / GINI INDEX
47906
LARGEST ZIP CODE
Indianapolis
LARGEST CITY
Marion County
LARGEST COUNTY
6,784,403
TOTAL POPULATION
3,366,798
MALE POPULATION
3,417,605
FEMALE POPULATION
98.51
MALES / 100 FEMALES
101.51
FEMALES / 100 MALES
38.0
MEDIAN AGE
3.1
AVG FAMILY SIZE
2.5
AVG HOUSEHOLD SIZE
3,444,785
LABOR FORCE [ PEOPLE ]
63.9%
PERCENT IN LABOR FORCE
4.5%
UNEMPLOYMENT RATE
Income in Indiana
Income Overview in Indiana
Per Capita Income in Indiana is $35,578, while median incomes of families and households are $84,657 and $67,173 respectively.
| Characteristic | Number | Measure |
| Per Capita Income | 6,784,403 | $35,578 |
| Median Family Income | 1,696,018 | $84,657 |
| Mean Family Income | 1,696,018 | $106,594 |
| Median Household Income | 2,653,596 | $67,173 |
| Mean Household Income | 2,653,596 | $88,805 |
| Income Deficit | 1,696,018 | $11,207 |
| Wage / Income Gap (%) | 6,784,403 | 30.92% |
| Wage / Income Gap ($) | 6,784,403 | 69.08¢ per $1 |
| Gini / Inequality Index | 6,784,403 | 0.45 |
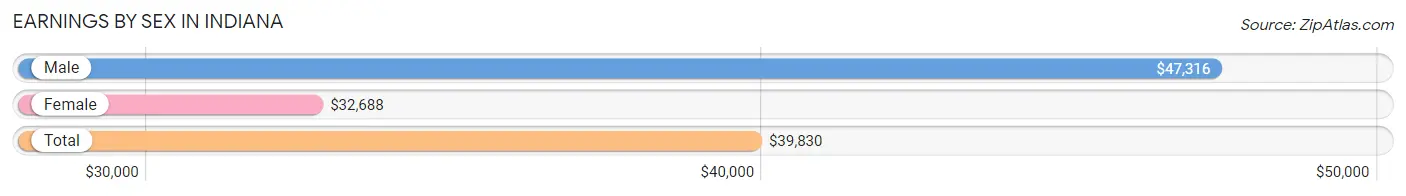
Earnings by Sex in Indiana
Average Earnings in Indiana are $39,830, $47,316 for men and $32,688 for women, a difference of 30.9%.
| Sex | Number | Average Earnings |
| Male | 1,918,533 (52.8%) | $47,316 |
| Female | 1,716,327 (47.2%) | $32,688 |
| Total | 3,634,860 (100.0%) | $39,830 |
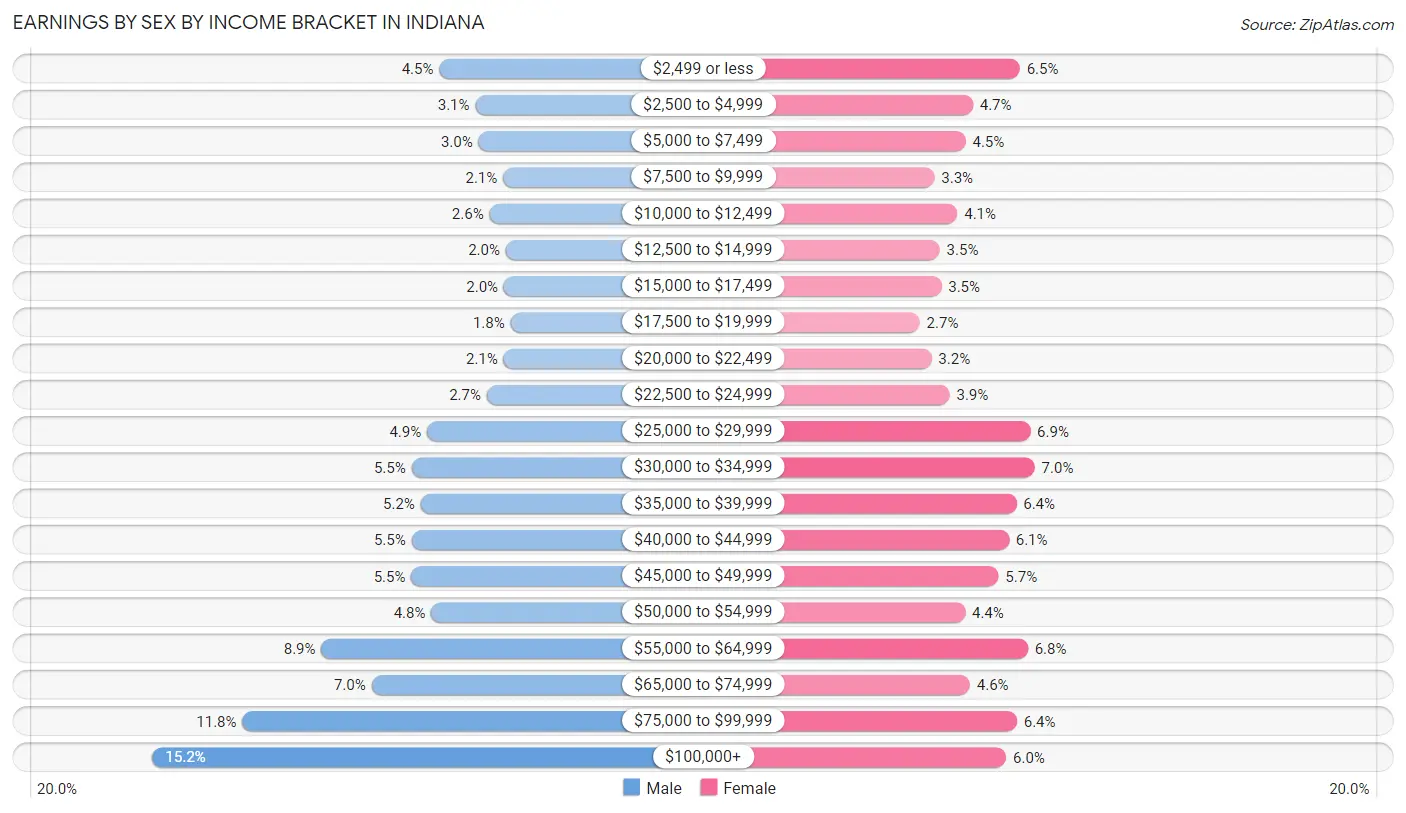
Earnings by Sex by Income Bracket in Indiana
The most common earnings brackets in Indiana are $100,000+ for men (291,718 | 15.2%) and $30,000 to $34,999 for women (120,763 | 7.0%).
| Income | Male | Female |
| $2,499 or less | 85,523 (4.5%) | 111,260 (6.5%) |
| $2,500 to $4,999 | 59,719 (3.1%) | 80,979 (4.7%) |
| $5,000 to $7,499 | 57,437 (3.0%) | 76,315 (4.4%) |
| $7,500 to $9,999 | 39,754 (2.1%) | 56,373 (3.3%) |
| $10,000 to $12,499 | 49,566 (2.6%) | 71,121 (4.1%) |
| $12,500 to $14,999 | 37,714 (2.0%) | 59,683 (3.5%) |
| $15,000 to $17,499 | 39,053 (2.0%) | 60,792 (3.5%) |
| $17,500 to $19,999 | 34,320 (1.8%) | 46,793 (2.7%) |
| $20,000 to $22,499 | 39,339 (2.1%) | 54,394 (3.2%) |
| $22,500 to $24,999 | 51,394 (2.7%) | 66,139 (3.8%) |
| $25,000 to $29,999 | 94,386 (4.9%) | 117,859 (6.9%) |
| $30,000 to $34,999 | 105,446 (5.5%) | 120,763 (7.0%) |
| $35,000 to $39,999 | 98,984 (5.2%) | 108,963 (6.4%) |
| $40,000 to $44,999 | 105,486 (5.5%) | 104,157 (6.1%) |
| $45,000 to $49,999 | 105,720 (5.5%) | 97,556 (5.7%) |
| $50,000 to $54,999 | 91,293 (4.8%) | 75,949 (4.4%) |
| $55,000 to $64,999 | 170,372 (8.9%) | 116,287 (6.8%) |
| $65,000 to $74,999 | 134,244 (7.0%) | 79,149 (4.6%) |
| $75,000 to $99,999 | 227,065 (11.8%) | 109,349 (6.4%) |
| $100,000+ | 291,718 (15.2%) | 102,446 (6.0%) |
| Total | 1,918,533 (100.0%) | 1,716,327 (100.0%) |
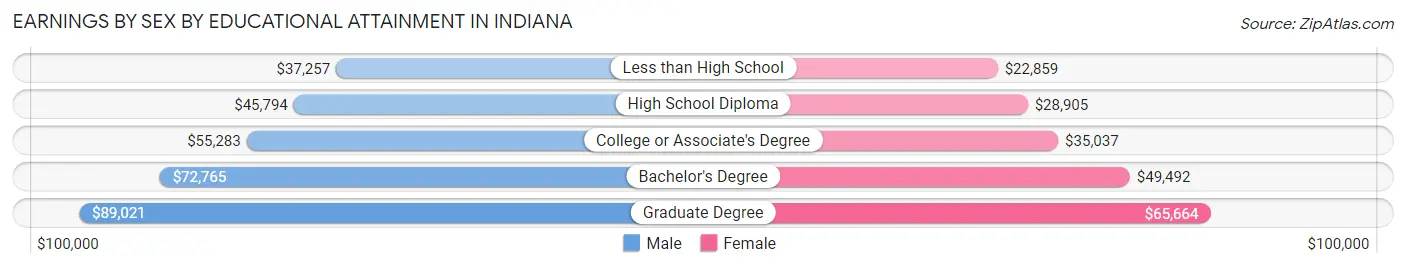
Earnings by Sex by Educational Attainment in Indiana
Average earnings in Indiana are $54,990 for men and $37,631 for women, a difference of 31.6%. Men with an educational attainment of graduate degree enjoy the highest average annual earnings of $89,021, while those with less than high school education earn the least with $37,257. Women with an educational attainment of graduate degree earn the most with the average annual earnings of $65,664, while those with less than high school education have the smallest earnings of $22,859.
| Educational Attainment | Male Income | Female Income |
| Less than High School | $37,257 | $22,859 |
| High School Diploma | $45,794 | $28,905 |
| College or Associate's Degree | $55,283 | $35,037 |
| Bachelor's Degree | $72,765 | $49,492 |
| Graduate Degree | $89,021 | $65,664 |
| Total | $54,990 | $37,631 |
Family Income in Indiana
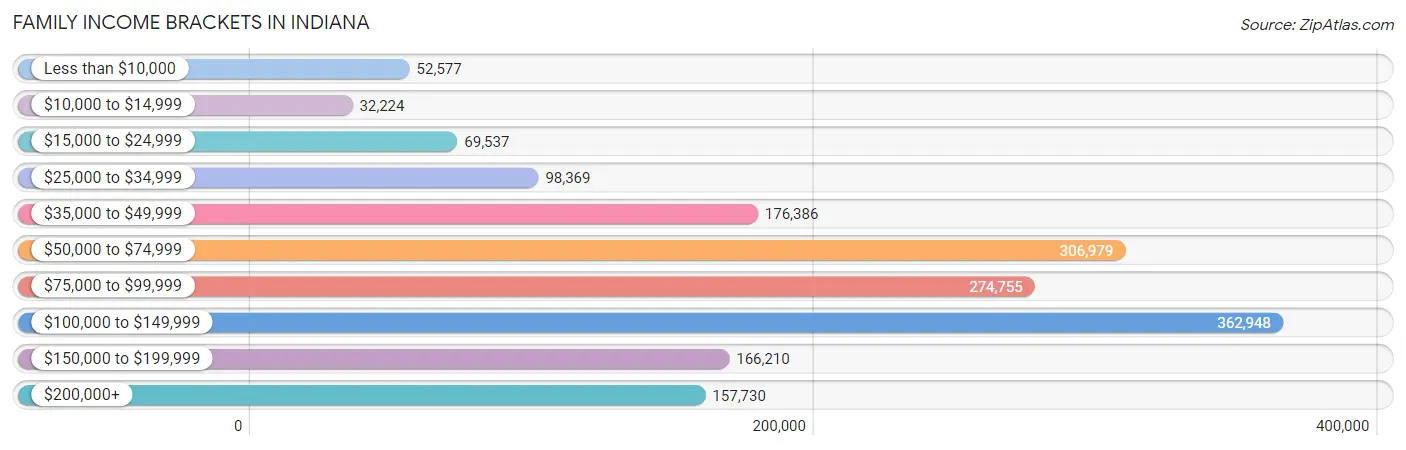
Family Income Brackets in Indiana
According to the Indiana family income data, there are 362,948 families falling into the $100,000 to $149,999 income range, which is the most common income bracket and makes up 21.4% of all families. Conversely, the $10,000 to $14,999 income bracket is the least frequent group with only 32,224 families (1.9%) belonging to this category.
| Income Bracket | # Families | % Families |
| Less than $10,000 | 52,577 | 3.1% |
| $10,000 to $14,999 | 32,224 | 1.9% |
| $15,000 to $24,999 | 69,537 | 4.1% |
| $25,000 to $34,999 | 98,369 | 5.8% |
| $35,000 to $49,999 | 176,386 | 10.4% |
| $50,000 to $74,999 | 306,979 | 18.1% |
| $75,000 to $99,999 | 274,755 | 16.2% |
| $100,000 to $149,999 | 362,948 | 21.4% |
| $150,000 to $199,999 | 166,210 | 9.8% |
| $200,000+ | 157,730 | 9.3% |
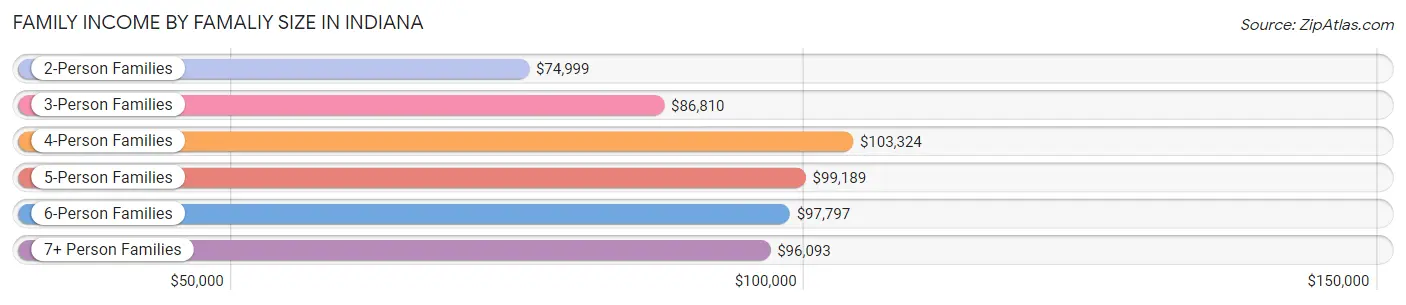
Family Income by Famaliy Size in Indiana
4-person families (291,478 | 17.2%) account for the highest median family income in Indiana with $103,324 per family, while 2-person families (831,745 | 49.0%) have the highest median income of $37,500 per family member.
| Income Bracket | # Families | Median Income |
| 2-Person Families | 831,745 (49.0%) | $74,999 |
| 3-Person Families | 360,283 (21.2%) | $86,810 |
| 4-Person Families | 291,478 (17.2%) | $103,324 |
| 5-Person Families | 135,733 (8.0%) | $99,189 |
| 6-Person Families | 48,621 (2.9%) | $97,797 |
| 7+ Person Families | 28,158 (1.7%) | $96,093 |
| Total | 1,696,018 (100.0%) | $84,657 |
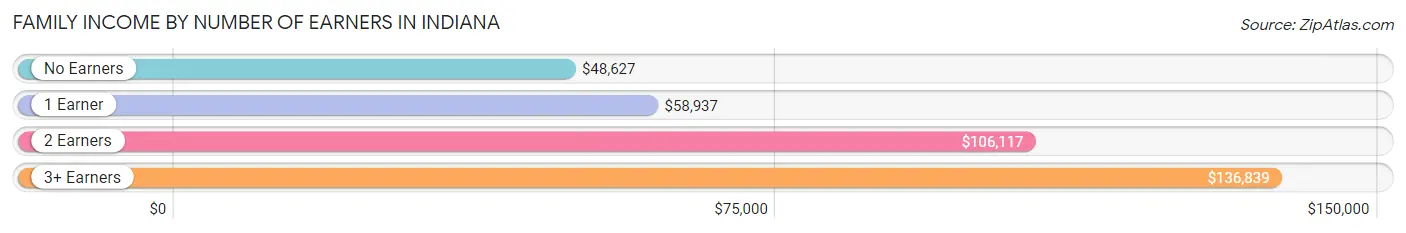
Family Income by Number of Earners in Indiana
The median family income in Indiana is $84,657, with families comprising 3+ earners (186,569) having the highest median family income of $136,839, while families with no earners (245,961) have the lowest median family income of $48,627, accounting for 11.0% and 14.5% of families, respectively.
| Number of Earners | # Families | Median Income |
| No Earners | 245,961 (14.5%) | $48,627 |
| 1 Earner | 536,387 (31.6%) | $58,937 |
| 2 Earners | 727,101 (42.9%) | $106,117 |
| 3+ Earners | 186,569 (11.0%) | $136,839 |
| Total | 1,696,018 (100.0%) | $84,657 |
Household Income in Indiana
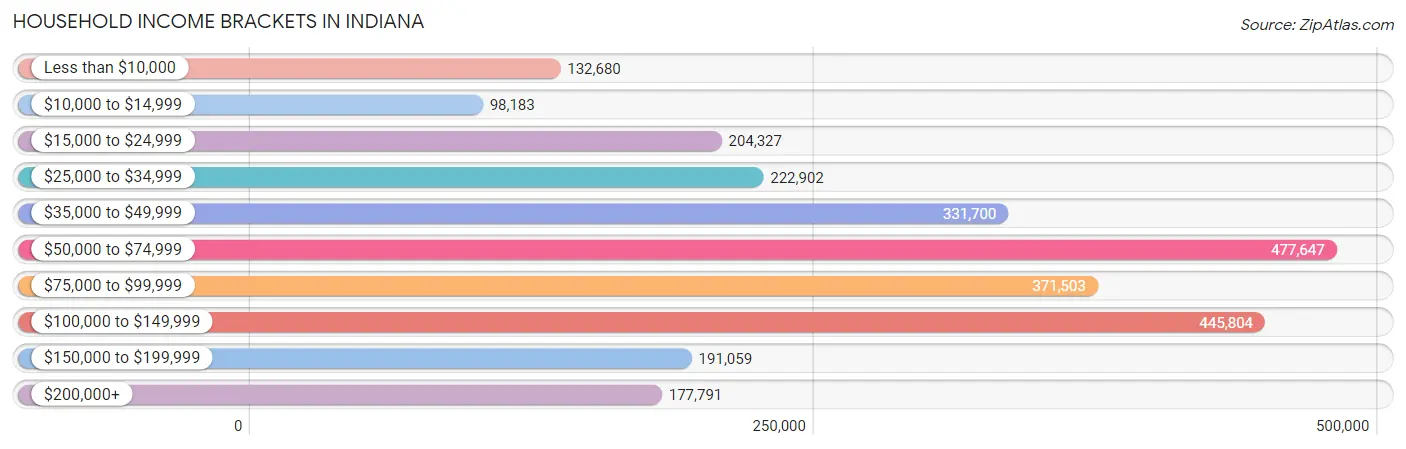
Household Income Brackets in Indiana
With 477,647 households falling in the category, the $50,000 to $74,999 income range is the most frequent in Indiana, accounting for 18.0% of all households. In contrast, only 98,183 households (3.7%) fall into the $10,000 to $14,999 income bracket, making it the least populous group.
| Income Bracket | # Households | % Households |
| Less than $10,000 | 132,680 | 5.0% |
| $10,000 to $14,999 | 98,183 | 3.7% |
| $15,000 to $24,999 | 204,327 | 7.7% |
| $25,000 to $34,999 | 222,902 | 8.4% |
| $35,000 to $49,999 | 331,700 | 12.5% |
| $50,000 to $74,999 | 477,647 | 18.0% |
| $75,000 to $99,999 | 371,503 | 14.0% |
| $100,000 to $149,999 | 445,804 | 16.8% |
| $150,000 to $199,999 | 191,059 | 7.2% |
| $200,000+ | 177,791 | 6.7% |
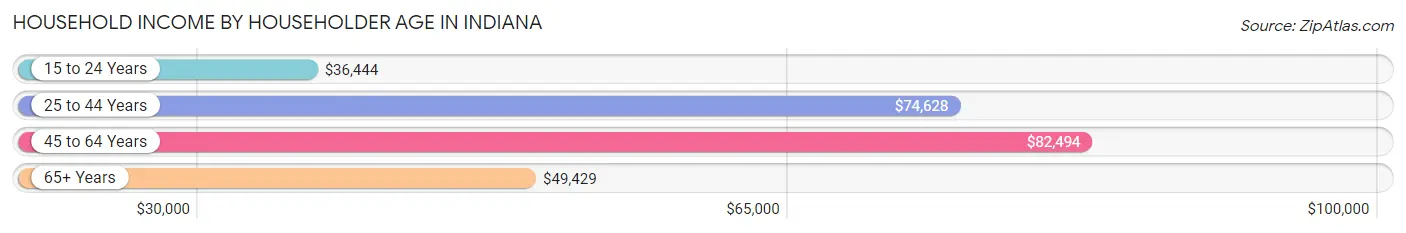
Household Income by Householder Age in Indiana
The median household income in Indiana is $67,173, with the highest median household income of $82,494 found in the 45 to 64 years age bracket for the primary householder. A total of 969,821 households (36.5%) fall into this category. Meanwhile, the 15 to 24 years age bracket for the primary householder has the lowest median household income of $36,444, with 129,430 households (4.9%) in this group.
| Income Bracket | # Households | Median Income |
| 15 to 24 Years | 129,430 (4.9%) | $36,444 |
| 25 to 44 Years | 865,028 (32.6%) | $74,628 |
| 45 to 64 Years | 969,821 (36.5%) | $82,494 |
| 65+ Years | 689,317 (26.0%) | $49,429 |
| Total | 2,653,596 (100.0%) | $67,173 |
Poverty in Indiana
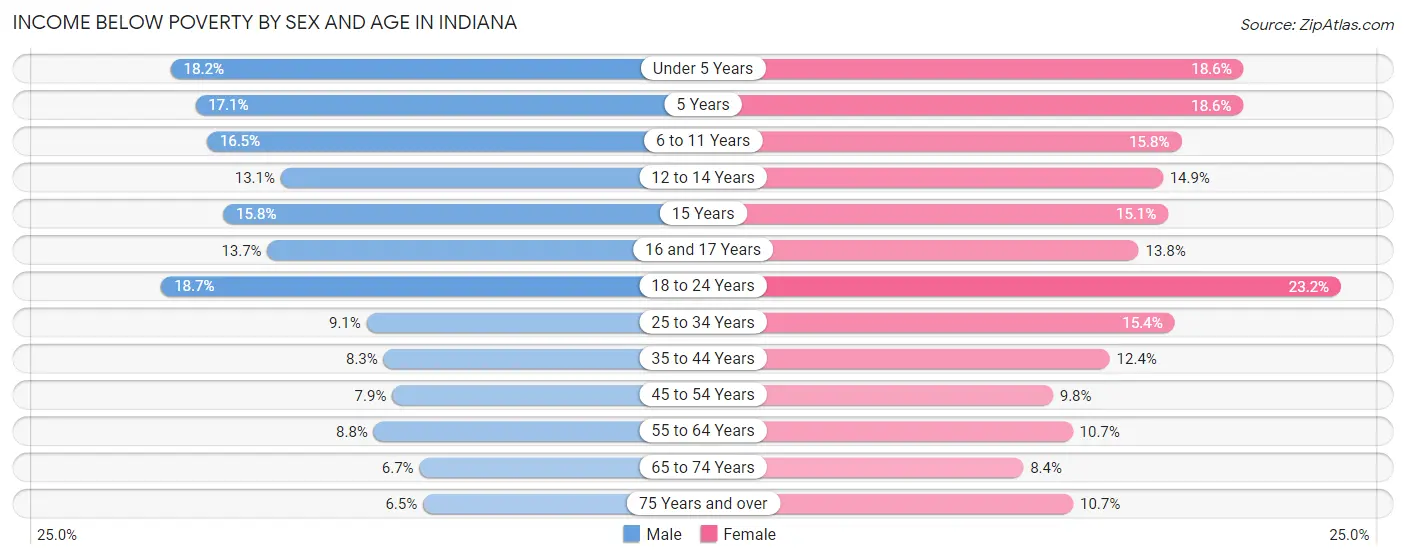
Income Below Poverty by Sex and Age in Indiana
With 11.1% poverty level for males and 13.5% for females among the residents of Indiana, 18 to 24 year old males and 18 to 24 year old females are the most vulnerable to poverty, with 57,685 males (18.7%) and 67,044 females (23.2%) in their respective age groups living below the poverty level.
| Age Bracket | Male | Female |
| Under 5 Years | 37,445 (18.2%) | 36,323 (18.6%) |
| 5 Years | 7,304 (17.1%) | 7,446 (18.6%) |
| 6 to 11 Years | 43,547 (16.5%) | 39,511 (15.8%) |
| 12 to 14 Years | 18,149 (13.1%) | 19,841 (14.9%) |
| 15 Years | 7,650 (15.8%) | 6,767 (15.1%) |
| 16 and 17 Years | 12,701 (13.7%) | 12,401 (13.8%) |
| 18 to 24 Years | 57,685 (18.7%) | 67,044 (23.2%) |
| 25 to 34 Years | 39,708 (9.1%) | 67,056 (15.4%) |
| 35 to 44 Years | 34,620 (8.3%) | 52,044 (12.4%) |
| 45 to 54 Years | 32,573 (7.9%) | 40,079 (9.8%) |
| 55 to 64 Years | 37,511 (8.8%) | 47,154 (10.7%) |
| 65 to 74 Years | 20,309 (6.7%) | 28,439 (8.4%) |
| 75 Years and over | 11,065 (6.5%) | 26,330 (10.7%) |
| Total | 360,267 (11.1%) | 450,435 (13.5%) |
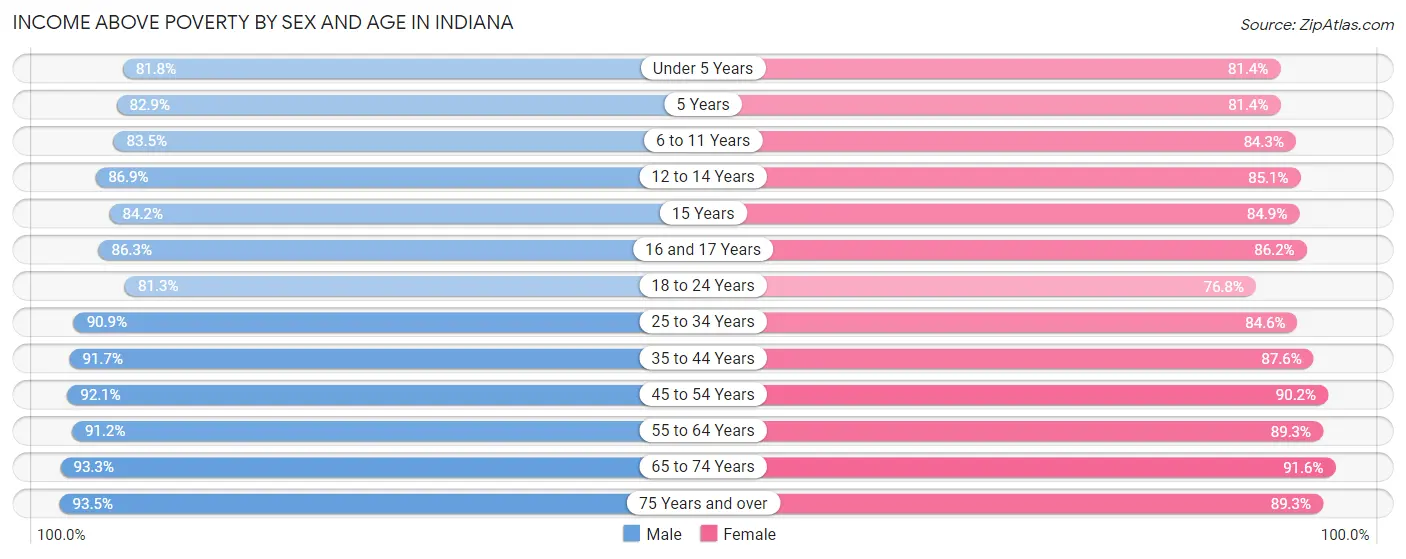
Income Above Poverty by Sex and Age in Indiana
According to the poverty statistics in Indiana, males aged 75 years and over and females aged 65 to 74 years are the age groups that are most secure financially, with 93.5% of males and 91.6% of females in these age groups living above the poverty line.
| Age Bracket | Male | Female |
| Under 5 Years | 168,078 (81.8%) | 158,553 (81.4%) |
| 5 Years | 35,463 (82.9%) | 32,514 (81.4%) |
| 6 to 11 Years | 219,679 (83.5%) | 211,336 (84.3%) |
| 12 to 14 Years | 120,302 (86.9%) | 113,406 (85.1%) |
| 15 Years | 40,786 (84.2%) | 37,943 (84.9%) |
| 16 and 17 Years | 79,804 (86.3%) | 77,631 (86.2%) |
| 18 to 24 Years | 251,430 (81.3%) | 222,388 (76.8%) |
| 25 to 34 Years | 395,441 (90.9%) | 367,141 (84.6%) |
| 35 to 44 Years | 380,390 (91.7%) | 366,642 (87.6%) |
| 45 to 54 Years | 377,580 (92.1%) | 369,376 (90.2%) |
| 55 to 64 Years | 388,627 (91.2%) | 393,094 (89.3%) |
| 65 to 74 Years | 283,587 (93.3%) | 309,322 (91.6%) |
| 75 Years and over | 158,826 (93.5%) | 219,094 (89.3%) |
| Total | 2,899,993 (88.9%) | 2,878,440 (86.5%) |
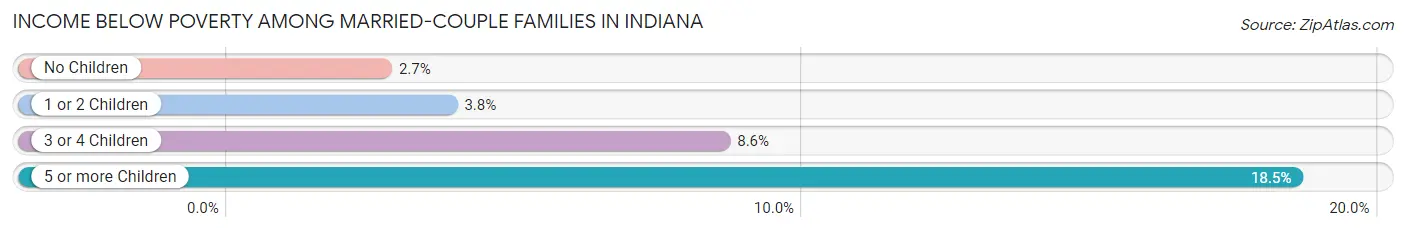
Income Below Poverty Among Married-Couple Families in Indiana
The poverty statistics for married-couple families in Indiana show that 3.7% or 47,088 of the total 1,265,185 families live below the poverty line. Families with 5 or more children have the highest poverty rate of 18.5%, comprising of 2,417 families. On the other hand, families with no children have the lowest poverty rate of 2.7%, which includes 20,114 families.
| Children | Above Poverty | Below Poverty |
| No Children | 731,675 (97.3%) | 20,114 (2.7%) |
| 1 or 2 Children | 371,144 (96.2%) | 14,747 (3.8%) |
| 3 or 4 Children | 104,661 (91.4%) | 9,810 (8.6%) |
| 5 or more Children | 10,617 (81.5%) | 2,417 (18.5%) |
| Total | 1,218,097 (96.3%) | 47,088 (3.7%) |
Income Below Poverty Among Single-Parent Households in Indiana
According to the poverty data in Indiana, 13.2% or 17,499 single-father households and 26.6% or 79,213 single-mother households are living below the poverty line. Among single-father households, those with 5 or more children have the highest poverty rate, with 292 households (32.0%) experiencing poverty. Likewise, among single-mother households, those with 5 or more children have the highest poverty rate, with 2,243 households (66.9%) falling below the poverty line.
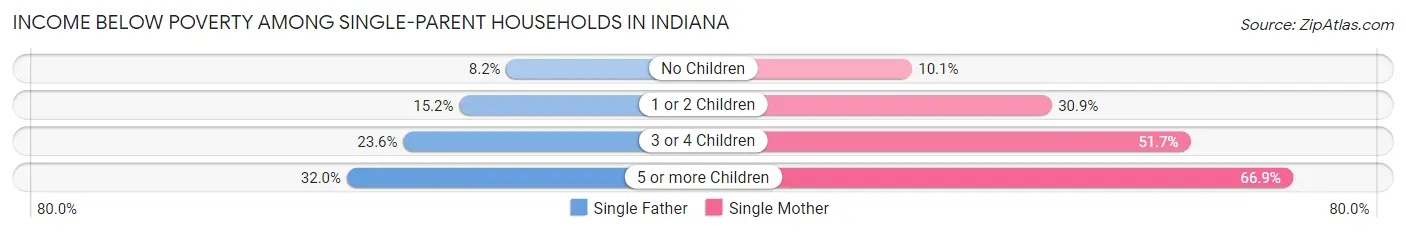
| Children | Single Father | Single Mother |
| No Children | 4,512 (8.2%) | 10,179 (10.1%) |
| 1 or 2 Children | 9,974 (15.2%) | 49,361 (30.9%) |
| 3 or 4 Children | 2,721 (23.6%) | 17,430 (51.7%) |
| 5 or more Children | 292 (32.0%) | 2,243 (66.9%) |
| Total | 17,499 (13.2%) | 79,213 (26.6%) |
Income Below Poverty Among Married-Couple vs Single-Parent Households in Indiana
The poverty data for Indiana shows that 47,088 of the married-couple family households (3.7%) and 96,712 of the single-parent households (22.5%) are living below the poverty level. Within the married-couple family households, those with 5 or more children have the highest poverty rate, with 2,417 households (18.5%) falling below the poverty line. Among the single-parent households, those with 5 or more children have the highest poverty rate, with 2,535 household (59.4%) living below poverty.
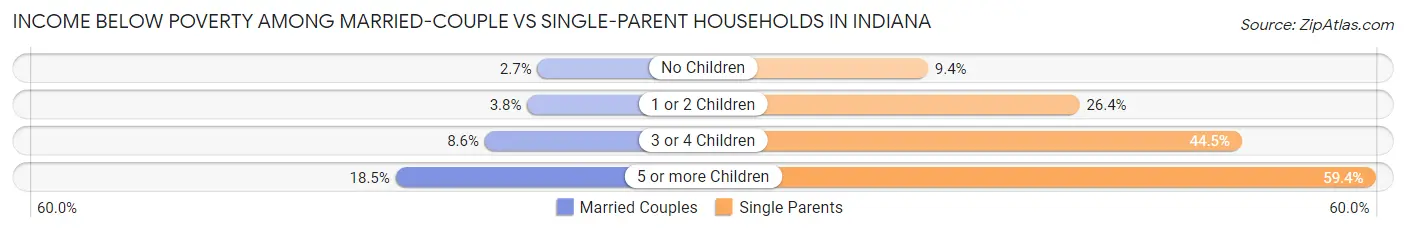
| Children | Married-Couple Families | Single-Parent Households |
| No Children | 20,114 (2.7%) | 14,691 (9.4%) |
| 1 or 2 Children | 14,747 (3.8%) | 59,335 (26.4%) |
| 3 or 4 Children | 9,810 (8.6%) | 20,151 (44.5%) |
| 5 or more Children | 2,417 (18.5%) | 2,535 (59.4%) |
| Total | 47,088 (3.7%) | 96,712 (22.5%) |
Largest Zip Codes by Population in Indiana
The largest zip codes in Indiana by population are 47906 (73,916), 46307 (71,355), 46143 (58,153), 46227 (56,794), and 46032 (51,250).
1.47906
73,916 (1.09%)
2.46307
71,355 (1.05%)
3.46143
58,153 (0.86%)
4.46227
56,794 (0.84%)
5.46032
51,250 (0.76%)
6.47150
49,722 (0.73%)
7.47130
48,599 (0.72%)
8.47201
48,043 (0.71%)
9.46060
47,340 (0.70%)
10.46037
46,858 (0.69%)
11.46226
45,716 (0.67%)
12.47374
45,480 (0.67%)
13.46350
44,923 (0.66%)
14.46074
44,075 (0.65%)
15.46360
43,891 (0.65%)
16.47909
43,169 (0.64%)
17.46038
43,112 (0.64%)
18.46237
42,223 (0.62%)
19.46140
41,879 (0.62%)
20.46123
41,870 (0.62%)
21.46383
41,811 (0.62%)
22.47905
41,689 (0.61%)
23.46112
41,437 (0.61%)
24.46385
41,304 (0.61%)
25.46254
41,259 (0.61%)
26.46514
41,248 (0.61%)
27.47401
40,399 (0.60%)
28.46368
39,947 (0.59%)
29.46033
39,859 (0.59%)
30.46224
39,704 (0.59%)
Largest Cities by Population in Indiana
The largest cities in Indiana by population are Indianapolis (882,006), Fort Wayne (264,514), Evansville (116,906), South Bend (103,084), and Carmel (99,453).
882,006 (13.00%)
264,514 (3.90%)
116,906 (1.72%)
103,084 (1.52%)
5.Carmel
99,453 (1.47%)
6.Fishers
99,041 (1.46%)
79,006 (1.16%)
8.Hammond
77,390 (1.14%)
70,828 (1.04%)
10.Noblesville
70,442 (1.04%)
11.Gary
69,136 (1.02%)
12.Muncie
65,167 (0.96%)
13.Greenwood
63,579 (0.94%)
14.Kokomo
59,534 (0.88%)
15.Terre Haute
58,599 (0.86%)
16.Anderson
55,011 (0.81%)
17.Elkhart
53,785 (0.79%)
18.Mishawaka
50,899 (0.75%)
19.Columbus
50,896 (0.75%)
49,771 (0.73%)
21.Lawrence
49,218 (0.73%)
22.Westfield
48,262 (0.71%)
44,861 (0.66%)
24.Portage
37,737 (0.56%)
25.New Albany
37,598 (0.55%)
26.Merrillville
36,214 (0.53%)
27.Richmond
35,642 (0.53%)
28.Plainfield
35,078 (0.52%)
29.Goshen
34,704 (0.51%)
30.Valparaiso
33,991 (0.50%)
Largest Counties by Population in Indiana
The largest counties in Indiana by population are Marion County (971,737), Lake County (497,682), Allen County (385,456), Hamilton County (349,527), and St. Joseph County (272,388).
971,737 (14.32%)
497,682 (7.34%)
385,456 (5.68%)
349,527 (5.15%)
272,388 (4.01%)
206,841 (3.05%)
186,955 (2.76%)
179,900 (2.65%)
175,639 (2.59%)
173,355 (2.56%)
161,952 (2.39%)
140,065 (2.06%)
130,545 (1.92%)
14.Clark County
121,484 (1.79%)
112,215 (1.65%)
112,156 (1.65%)
17.Vigo County
106,355 (1.57%)
83,452 (1.23%)
82,371 (1.21%)
80,442 (1.19%)
21.Floyd County
80,191 (1.18%)
80,170 (1.18%)
71,757 (1.06%)
24.Boone County
71,235 (1.05%)
25.Grant County
66,560 (0.98%)
26.Wayne County
66,522 (0.98%)
64,065 (0.94%)
50,709 (0.75%)
29.Henry County
48,913 (0.72%)
30.Noble County
47,431 (0.70%)
Race in Indiana
The most populous races in Indiana are White / Caucasian (5,426,227 | 80.0%), Black / African American (640,752 | 9.4%), and Hispanic or Latino (510,984 | 7.5%).
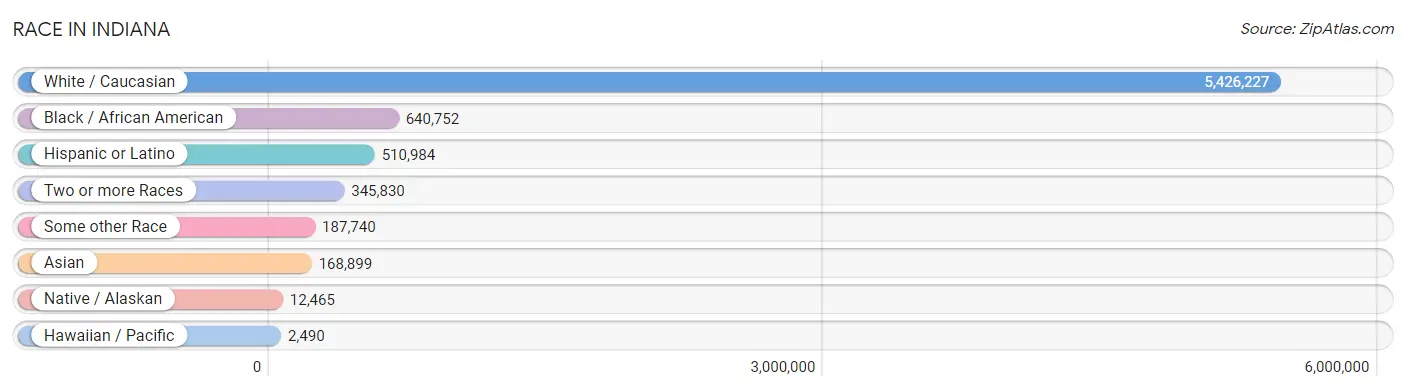
| Race | # Population | % Population |
| Asian | 168,899 | 2.5% |
| Black / African American | 640,752 | 9.4% |
| Hawaiian / Pacific | 2,490 | 0.0% |
| Hispanic or Latino | 510,984 | 7.5% |
| Native / Alaskan | 12,465 | 0.2% |
| White / Caucasian | 5,426,227 | 80.0% |
| Two or more Races | 345,830 | 5.1% |
| Some other Race | 187,740 | 2.8% |
| Total | 6,784,403 | 100.0% |
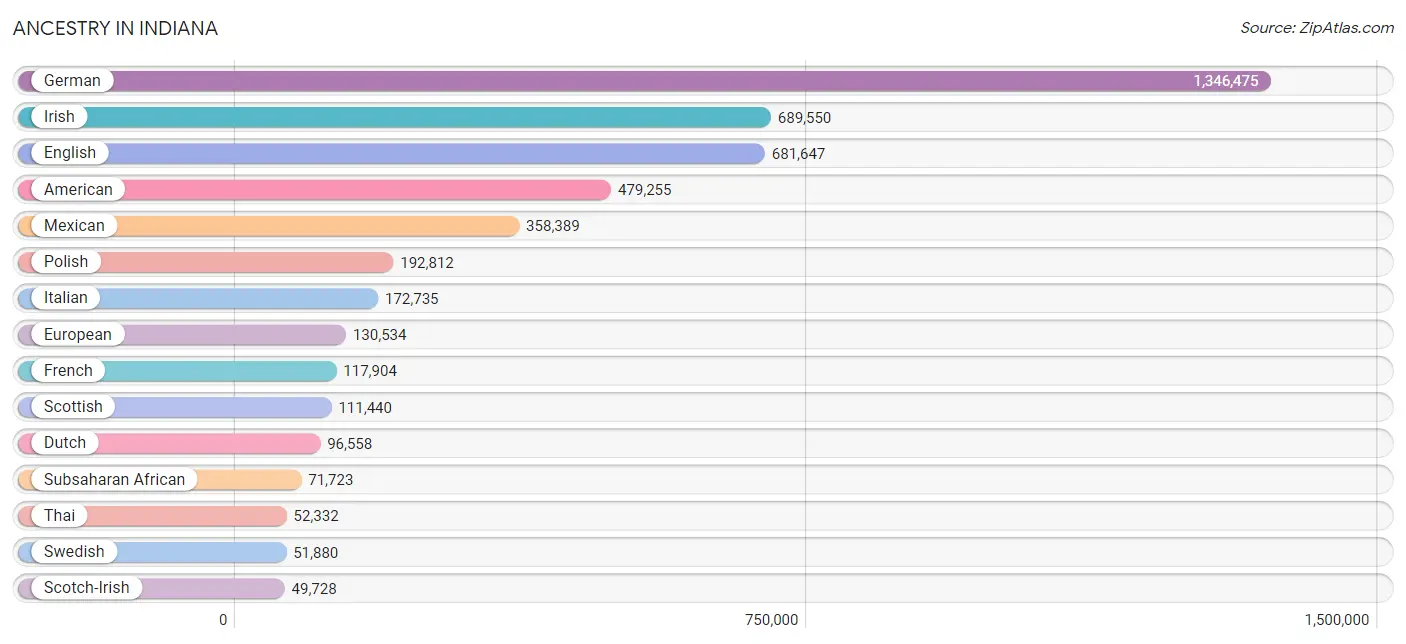
Ancestry in Indiana
The most populous ancestries reported in Indiana are German (1,346,475 | 19.9%), Irish (689,550 | 10.2%), English (681,647 | 10.1%), American (479,255 | 7.1%), and Mexican (358,389 | 5.3%), together accounting for 52.4% of all Indiana residents.
| Ancestry | # Population | % Population |
| Afghan | 794 | 0.0% |
| African | 39,278 | 0.6% |
| Alaska Native | 31 | 0.0% |
| Alaskan Athabascan | 151 | 0.0% |
| Albanian | 633 | 0.0% |
| Aleut | 52 | 0.0% |
| Alsatian | 212 | 0.0% |
| American | 479,255 | 7.1% |
| Apache | 1,486 | 0.0% |
| Arab | 22,388 | 0.3% |
| Arapaho | 71 | 0.0% |
| Argentinean | 1,812 | 0.0% |
| Armenian | 1,492 | 0.0% |
| Assyrian / Chaldean / Syriac | 365 | 0.0% |
| Australian | 904 | 0.0% |
| Austrian | 8,486 | 0.1% |
| Bahamian | 355 | 0.0% |
| Bangladeshi | 447 | 0.0% |
| Barbadian | 318 | 0.0% |
| Basque | 195 | 0.0% |
| Belgian | 10,128 | 0.2% |
| Belizean | 314 | 0.0% |
| Bermudan | 6 | 0.0% |
| Bhutanese | 12,843 | 0.2% |
| Blackfeet | 3,216 | 0.1% |
| Bolivian | 355 | 0.0% |
| Brazilian | 2,730 | 0.0% |
| British | 34,340 | 0.5% |
| British West Indian | 101 | 0.0% |
| Bulgarian | 1,684 | 0.0% |
| Burmese | 15,739 | 0.2% |
| Cajun | 474 | 0.0% |
| Cambodian | 183 | 0.0% |
| Canadian | 7,279 | 0.1% |
| Cape Verdean | 168 | 0.0% |
| Carpatho Rusyn | 128 | 0.0% |
| Celtic | 814 | 0.0% |
| Central American | 41,722 | 0.6% |
| Central American Indian | 2,362 | 0.0% |
| Cherokee | 18,915 | 0.3% |
| Cheyenne | 145 | 0.0% |
| Chickasaw | 100 | 0.0% |
| Chilean | 685 | 0.0% |
| Chinese | 86 | 0.0% |
| Chippewa | 893 | 0.0% |
| Choctaw | 1,199 | 0.0% |
| Colombian | 5,265 | 0.1% |
| Comanche | 141 | 0.0% |
| Costa Rican | 737 | 0.0% |
| Cree | 87 | 0.0% |
| Creek | 206 | 0.0% |
| Croatian | 10,908 | 0.2% |
| Crow | 207 | 0.0% |
| Cuban | 7,405 | 0.1% |
| Cypriot | 123 | 0.0% |
| Czech | 14,577 | 0.2% |
| Czechoslovakian | 3,442 | 0.1% |
| Danish | 10,200 | 0.2% |
| Delaware | 177 | 0.0% |
| Dominican | 4,826 | 0.1% |
| Dutch | 96,558 | 1.4% |
| Dutch West Indian | 162 | 0.0% |
| Eastern European | 11,800 | 0.2% |
| Ecuadorian | 1,881 | 0.0% |
| Egyptian | 3,027 | 0.0% |
| English | 681,647 | 10.1% |
| Estonian | 175 | 0.0% |
| Ethiopian | 3,377 | 0.1% |
| European | 130,534 | 1.9% |
| Fijian | 648 | 0.0% |
| Filipino | 1,375 | 0.0% |
| Finnish | 6,446 | 0.1% |
| French | 117,904 | 1.7% |
| French American Indian | 203 | 0.0% |
| French Canadian | 13,617 | 0.2% |
| German | 1,346,475 | 19.9% |
| German Russian | 402 | 0.0% |
| Ghanaian | 1,619 | 0.0% |
| Greek | 20,473 | 0.3% |
| Guamanian / Chamorro | 819 | 0.0% |
| Guatemalan | 13,194 | 0.2% |
| Guyanese | 332 | 0.0% |
| Haitian | 6,144 | 0.1% |
| Hmong | 187 | 0.0% |
| Honduran | 9,421 | 0.1% |
| Hopi | 14 | 0.0% |
| Houma | 19 | 0.0% |
| Hungarian | 28,237 | 0.4% |
| Icelander | 371 | 0.0% |
| Indian (Asian) | 38,234 | 0.6% |
| Indonesian | 27,674 | 0.4% |
| Inupiat | 103 | 0.0% |
| Iranian | 2,806 | 0.0% |
| Iraqi | 428 | 0.0% |
| Irish | 689,550 | 10.2% |
| Iroquois | 788 | 0.0% |
| Israeli | 785 | 0.0% |
| Italian | 172,735 | 2.5% |
| Jamaican | 3,532 | 0.1% |
| Japanese | 1,612 | 0.0% |
| Jordanian | 1,655 | 0.0% |
| Kenyan | 2,462 | 0.0% |
| Kiowa | 29 | 0.0% |
| Korean | 26,879 | 0.4% |
| Laotian | 1,441 | 0.0% |
| Latvian | 1,307 | 0.0% |
| Lebanese | 5,423 | 0.1% |
| Liberian | 963 | 0.0% |
| Lithuanian | 9,782 | 0.1% |
| Lumbee | 146 | 0.0% |
| Luxembourger | 535 | 0.0% |
| Macedonian | 4,250 | 0.1% |
| Malaysian | 2,040 | 0.0% |
| Maltese | 306 | 0.0% |
| Marshallese | 19 | 0.0% |
| Menominee | 56 | 0.0% |
| Mexican | 358,389 | 5.3% |
| Mexican American Indian | 5,706 | 0.1% |
| Mongolian | 970 | 0.0% |
| Moroccan | 918 | 0.0% |
| Native Hawaiian | 2,317 | 0.0% |
| Navajo | 866 | 0.0% |
| New Zealander | 289 | 0.0% |
| Nicaraguan | 2,151 | 0.0% |
| Nigerian | 13,662 | 0.2% |
| Northern European | 7,858 | 0.1% |
| Norwegian | 34,451 | 0.5% |
| Okinawan | 149 | 0.0% |
| Osage | 94 | 0.0% |
| Ottawa | 100 | 0.0% |
| Paiute | 8 | 0.0% |
| Pakistani | 3,515 | 0.1% |
| Palestinian | 1,375 | 0.0% |
| Panamanian | 2,214 | 0.0% |
| Paraguayan | 74 | 0.0% |
| Pennsylvania German | 11,127 | 0.2% |
| Peruvian | 3,247 | 0.1% |
| Pima | 87 | 0.0% |
| Polish | 192,812 | 2.8% |
| Portuguese | 4,479 | 0.1% |
| Potawatomi | 572 | 0.0% |
| Pueblo | 151 | 0.0% |
| Puerto Rican | 48,118 | 0.7% |
| Puget Sound Salish | 81 | 0.0% |
| Romanian | 7,996 | 0.1% |
| Russian | 18,842 | 0.3% |
| Salvadoran | 13,457 | 0.2% |
| Samoan | 1,020 | 0.0% |
| Scandinavian | 13,967 | 0.2% |
| Scotch-Irish | 49,728 | 0.7% |
| Scottish | 111,440 | 1.6% |
| Seminole | 309 | 0.0% |
| Senegalese | 736 | 0.0% |
| Serbian | 10,095 | 0.2% |
| Shoshone | 26 | 0.0% |
| Sierra Leonean | 261 | 0.0% |
| Sioux | 1,601 | 0.0% |
| Slavic | 2,646 | 0.0% |
| Slovak | 17,775 | 0.3% |
| Slovene | 3,258 | 0.1% |
| Somali | 345 | 0.0% |
| South African | 1,264 | 0.0% |
| South American | 21,578 | 0.3% |
| South American Indian | 305 | 0.0% |
| Soviet Union | 10 | 0.0% |
| Spaniard | 6,987 | 0.1% |
| Spanish | 5,707 | 0.1% |
| Spanish American | 178 | 0.0% |
| Spanish American Indian | 100 | 0.0% |
| Sri Lankan | 11,954 | 0.2% |
| Subsaharan African | 71,723 | 1.1% |
| Sudanese | 606 | 0.0% |
| Swedish | 51,880 | 0.8% |
| Swiss | 38,430 | 0.6% |
| Syrian | 2,085 | 0.0% |
| Taiwanese | 10 | 0.0% |
| Thai | 52,332 | 0.8% |
| Tlingit-Haida | 51 | 0.0% |
| Tohono O'Odham | 51 | 0.0% |
| Tongan | 129 | 0.0% |
| Trinidadian and Tobagonian | 570 | 0.0% |
| Turkish | 1,761 | 0.0% |
| U.S. Virgin Islander | 72 | 0.0% |
| Ugandan | 76 | 0.0% |
| Ukrainian | 9,467 | 0.1% |
| Uruguayan | 179 | 0.0% |
| Ute | 70 | 0.0% |
| Venezuelan | 7,953 | 0.1% |
| Vietnamese | 1,725 | 0.0% |
| Welsh | 36,798 | 0.5% |
| West Indian | 963 | 0.0% |
| Yaqui | 23 | 0.0% |
| Yugoslavian | 3,149 | 0.1% |
| Yup'ik | 62 | 0.0% |
| Zimbabwean | 548 | 0.0% | View All 195 Rows |
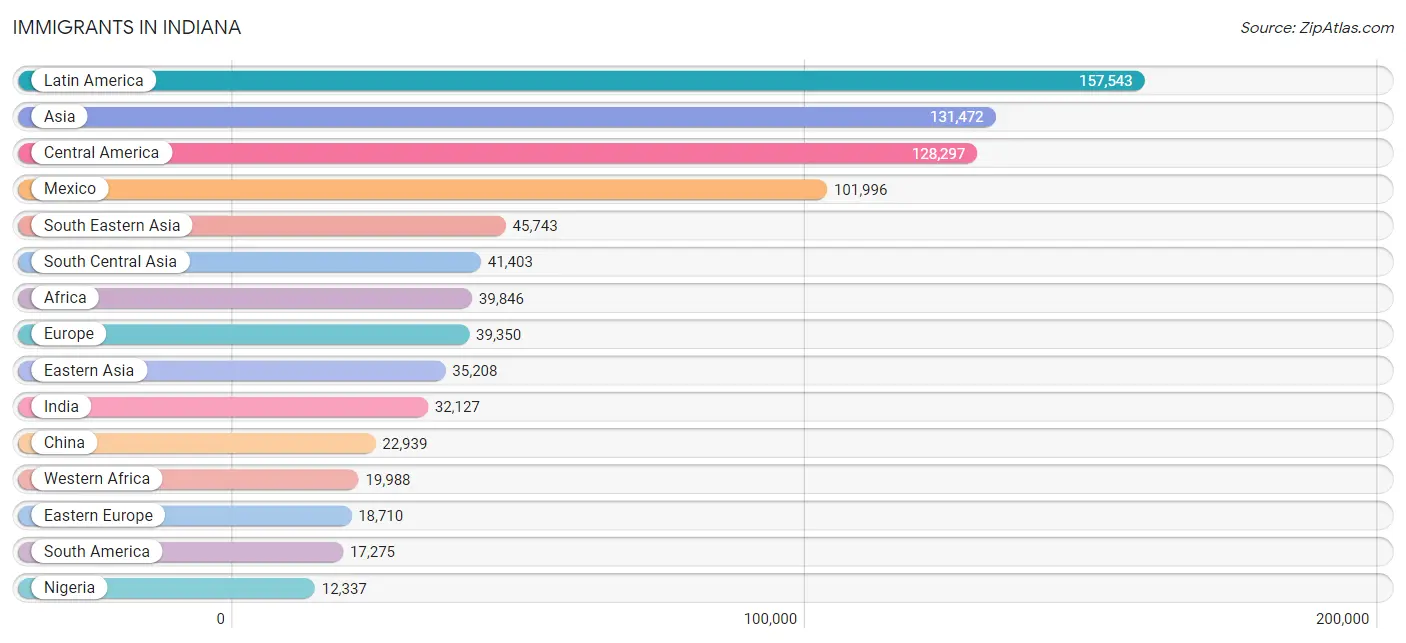
Immigrants in Indiana
The most numerous immigrant groups reported in Indiana came from Latin America (157,543 | 2.3%), Asia (131,472 | 1.9%), Central America (128,297 | 1.9%), Mexico (101,996 | 1.5%), and South Eastern Asia (45,743 | 0.7%), together accounting for 8.3% of all Indiana residents.
| Immigration Origin | # Population | % Population |
| Afghanistan | 589 | 0.0% |
| Africa | 39,846 | 0.6% |
| Albania | 169 | 0.0% |
| Argentina | 832 | 0.0% |
| Armenia | 78 | 0.0% |
| Asia | 131,472 | 1.9% |
| Australia | 639 | 0.0% |
| Austria | 200 | 0.0% |
| Azores | 22 | 0.0% |
| Bahamas | 331 | 0.0% |
| Bangladesh | 1,942 | 0.0% |
| Barbados | 412 | 0.0% |
| Belarus | 142 | 0.0% |
| Belgium | 204 | 0.0% |
| Belize | 346 | 0.0% |
| Bolivia | 280 | 0.0% |
| Bosnia and Herzegovina | 1,277 | 0.0% |
| Brazil | 2,626 | 0.0% |
| Bulgaria | 816 | 0.0% |
| Cabo Verde | 42 | 0.0% |
| Cambodia | 915 | 0.0% |
| Cameroon | 832 | 0.0% |
| Canada | 7,834 | 0.1% |
| Caribbean | 11,971 | 0.2% |
| Central America | 128,297 | 1.9% |
| Chile | 364 | 0.0% |
| China | 22,939 | 0.3% |
| Colombia | 3,114 | 0.1% |
| Congo | 918 | 0.0% |
| Costa Rica | 439 | 0.0% |
| Croatia | 968 | 0.0% |
| Cuba | 1,509 | 0.0% |
| Czechoslovakia | 274 | 0.0% |
| Denmark | 160 | 0.0% |
| Dominica | 86 | 0.0% |
| Dominican Republic | 2,421 | 0.0% |
| Eastern Africa | 9,576 | 0.1% |
| Eastern Asia | 35,208 | 0.5% |
| Eastern Europe | 18,710 | 0.3% |
| Ecuador | 835 | 0.0% |
| Egypt | 2,303 | 0.0% |
| El Salvador | 8,253 | 0.1% |
| England | 2,847 | 0.0% |
| Eritrea | 804 | 0.0% |
| Ethiopia | 2,532 | 0.0% |
| Europe | 39,350 | 0.6% |
| Fiji | 70 | 0.0% |
| France | 1,090 | 0.0% |
| Germany | 6,439 | 0.1% |
| Ghana | 1,776 | 0.0% |
| Greece | 1,317 | 0.0% |
| Grenada | 65 | 0.0% |
| Guatemala | 8,656 | 0.1% |
| Guyana | 267 | 0.0% |
| Haiti | 4,484 | 0.1% |
| Honduras | 5,892 | 0.1% |
| Hong Kong | 790 | 0.0% |
| Hungary | 785 | 0.0% |
| India | 32,127 | 0.5% |
| Indonesia | 1,177 | 0.0% |
| Iran | 1,600 | 0.0% |
| Iraq | 599 | 0.0% |
| Ireland | 757 | 0.0% |
| Israel | 422 | 0.0% |
| Italy | 1,173 | 0.0% |
| Jamaica | 1,808 | 0.0% |
| Japan | 4,520 | 0.1% |
| Jordan | 1,545 | 0.0% |
| Kazakhstan | 92 | 0.0% |
| Kenya | 2,987 | 0.0% |
| Korea | 7,653 | 0.1% |
| Kuwait | 614 | 0.0% |
| Laos | 921 | 0.0% |
| Latin America | 157,543 | 2.3% |
| Latvia | 294 | 0.0% |
| Lebanon | 751 | 0.0% |
| Liberia | 991 | 0.0% |
| Lithuania | 477 | 0.0% |
| Malaysia | 2,074 | 0.0% |
| Mexico | 101,996 | 1.5% |
| Micronesia | 15 | 0.0% |
| Middle Africa | 3,282 | 0.1% |
| Moldova | 125 | 0.0% |
| Morocco | 364 | 0.0% |
| Nepal | 770 | 0.0% |
| Netherlands | 705 | 0.0% |
| Nicaragua | 1,406 | 0.0% |
| Nigeria | 12,337 | 0.2% |
| North Macedonia | 1,056 | 0.0% |
| Northern Africa | 3,836 | 0.1% |
| Northern Europe | 7,431 | 0.1% |
| Norway | 143 | 0.0% |
| Oceania | 1,715 | 0.0% |
| Pakistan | 3,221 | 0.1% |
| Panama | 977 | 0.0% |
| Peru | 1,962 | 0.0% |
| Philippines | 11,851 | 0.2% |
| Poland | 2,959 | 0.0% |
| Portugal | 200 | 0.0% |
| Romania | 1,537 | 0.0% |
| Russia | 3,307 | 0.1% |
| Saudi Arabia | 1,388 | 0.0% |
| Scotland | 581 | 0.0% |
| Senegal | 761 | 0.0% |
| Serbia | 978 | 0.0% |
| Sierra Leone | 395 | 0.0% |
| Singapore | 412 | 0.0% |
| Somalia | 211 | 0.0% |
| South Africa | 1,540 | 0.0% |
| South America | 17,275 | 0.3% |
| South Central Asia | 41,403 | 0.6% |
| South Eastern Asia | 45,743 | 0.7% |
| Southern Europe | 4,161 | 0.1% |
| Spain | 1,393 | 0.0% |
| Sri Lanka | 803 | 0.0% |
| St. Vincent and the Grenadines | 91 | 0.0% |
| Sudan | 480 | 0.0% |
| Sweden | 152 | 0.0% |
| Switzerland | 336 | 0.0% |
| Syria | 975 | 0.0% |
| Taiwan | 2,272 | 0.0% |
| Thailand | 5,446 | 0.1% |
| Trinidad and Tobago | 455 | 0.0% |
| Turkey | 877 | 0.0% |
| Uganda | 366 | 0.0% |
| Ukraine | 2,450 | 0.0% |
| Uruguay | 129 | 0.0% |
| Uzbekistan | 87 | 0.0% |
| Venezuela | 6,718 | 0.1% |
| Vietnam | 6,645 | 0.1% |
| West Indies | 109 | 0.0% |
| Western Africa | 19,988 | 0.3% |
| Western Asia | 8,663 | 0.1% |
| Western Europe | 8,983 | 0.1% |
| Yemen | 654 | 0.0% |
| Zaire | 1,221 | 0.0% |
| Zimbabwe | 1,036 | 0.0% | View All 137 Rows |
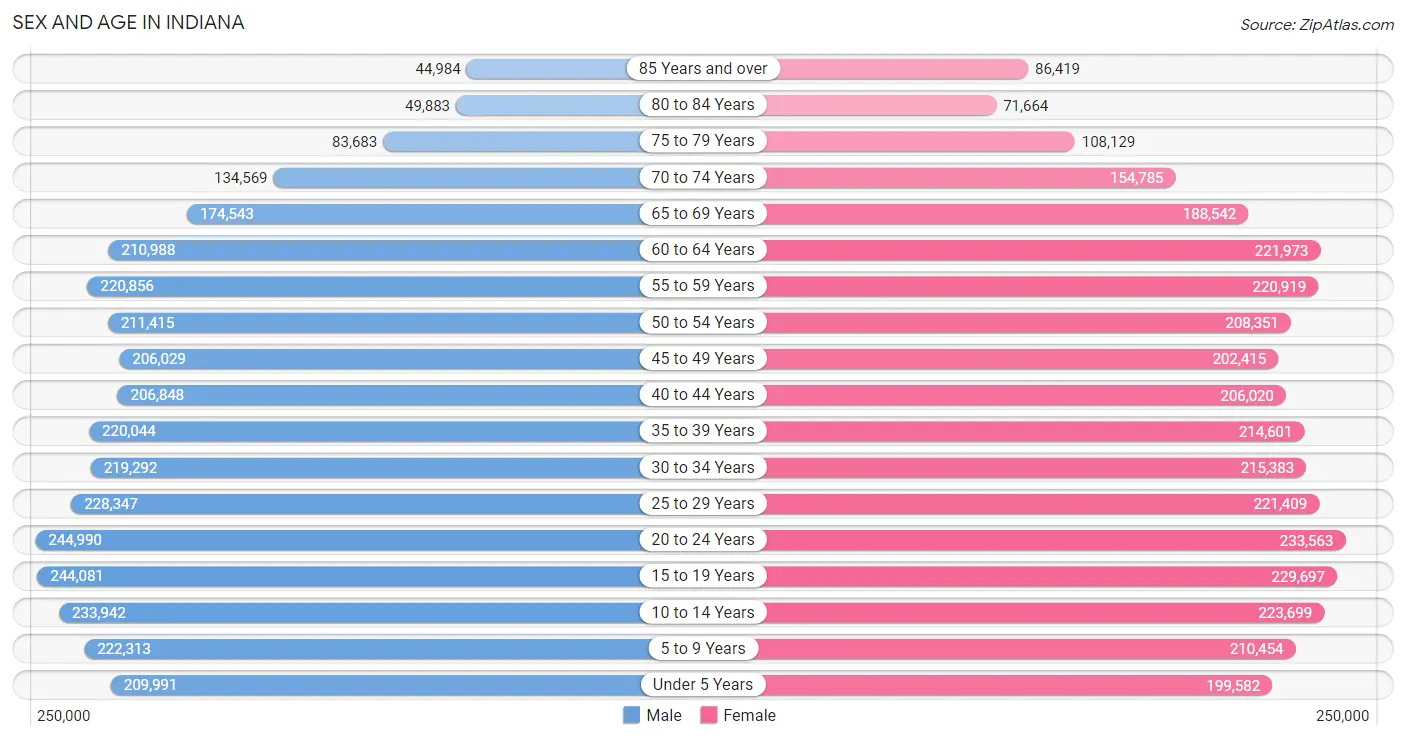
Sex and Age in Indiana
Sex and Age in Indiana
The most populous age groups in Indiana are 20 to 24 Years (244,990 | 7.3%) for men and 20 to 24 Years (233,563 | 6.8%) for women.
| Age Bracket | Male | Female |
| Under 5 Years | 209,991 (6.2%) | 199,582 (5.8%) |
| 5 to 9 Years | 222,313 (6.6%) | 210,454 (6.2%) |
| 10 to 14 Years | 233,942 (7.0%) | 223,699 (6.6%) |
| 15 to 19 Years | 244,081 (7.2%) | 229,697 (6.7%) |
| 20 to 24 Years | 244,990 (7.3%) | 233,563 (6.8%) |
| 25 to 29 Years | 228,347 (6.8%) | 221,409 (6.5%) |
| 30 to 34 Years | 219,292 (6.5%) | 215,383 (6.3%) |
| 35 to 39 Years | 220,044 (6.5%) | 214,601 (6.3%) |
| 40 to 44 Years | 206,848 (6.1%) | 206,020 (6.0%) |
| 45 to 49 Years | 206,029 (6.1%) | 202,415 (5.9%) |
| 50 to 54 Years | 211,415 (6.3%) | 208,351 (6.1%) |
| 55 to 59 Years | 220,856 (6.6%) | 220,919 (6.5%) |
| 60 to 64 Years | 210,988 (6.3%) | 221,973 (6.5%) |
| 65 to 69 Years | 174,543 (5.2%) | 188,542 (5.5%) |
| 70 to 74 Years | 134,569 (4.0%) | 154,785 (4.5%) |
| 75 to 79 Years | 83,683 (2.5%) | 108,129 (3.2%) |
| 80 to 84 Years | 49,883 (1.5%) | 71,664 (2.1%) |
| 85 Years and over | 44,984 (1.3%) | 86,419 (2.5%) |
| Total | 3,366,798 (100.0%) | 3,417,605 (100.0%) |
Families and Households in Indiana
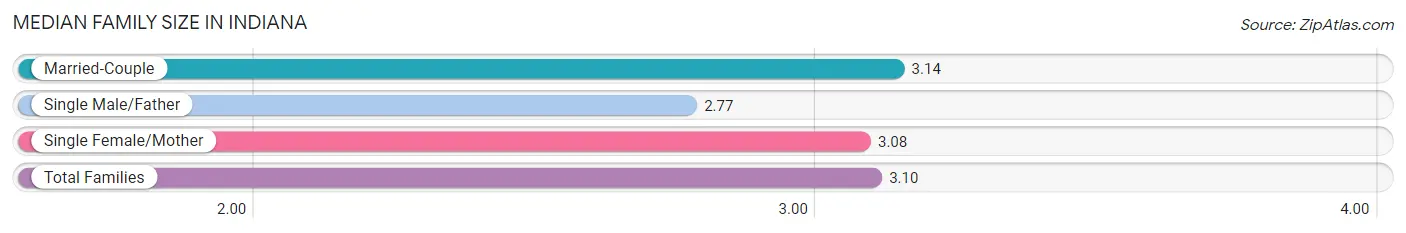
Median Family Size in Indiana
The median family size in Indiana is 3.10 persons per family, with married-couple families (1,265,185 | 74.6%) accounting for the largest median family size of 3.14 persons per family. On the other hand, single male/father families (132,999 | 7.8%) represent the smallest median family size with 2.77 persons per family.
| Family Type | # Families | Family Size |
| Married-Couple | 1,265,185 (74.6%) | 3.14 |
| Single Male/Father | 132,999 (7.8%) | 2.77 |
| Single Female/Mother | 297,834 (17.6%) | 3.08 |
| Total Families | 1,696,018 (100.0%) | 3.10 |
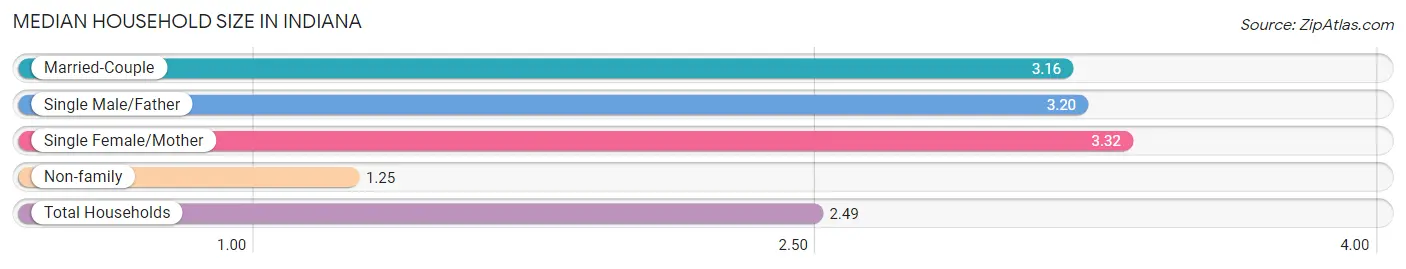
Median Household Size in Indiana
The median household size in Indiana is 2.49 persons per household, with single female/mother households (297,834 | 11.2%) accounting for the largest median household size of 3.32 persons per household. non-family households (957,578 | 36.1%) represent the smallest median household size with 1.25 persons per household.
| Household Type | # Households | Household Size |
| Married-Couple | 1,265,185 (47.7%) | 3.16 |
| Single Male/Father | 132,999 (5.0%) | 3.20 |
| Single Female/Mother | 297,834 (11.2%) | 3.32 |
| Non-family | 957,578 (36.1%) | 1.25 |
| Total Households | 2,653,596 (100.0%) | 2.49 |
Household Size by Marriage Status in Indiana
Out of a total of 2,653,596 households in Indiana, 1,696,018 (63.9%) are family households, while 957,578 (36.1%) are nonfamily households. The most numerous type of family households are 2-person households, comprising 777,674, and the most common type of nonfamily households are 1-person households, comprising 781,063.
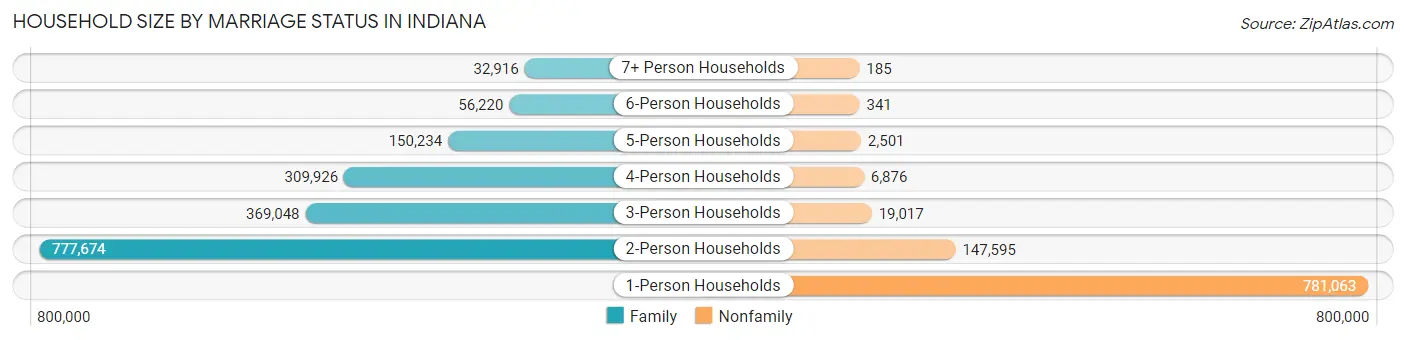
| Household Size | Family Households | Nonfamily Households |
| 1-Person Households | - | 781,063 (29.4%) |
| 2-Person Households | 777,674 (29.3%) | 147,595 (5.6%) |
| 3-Person Households | 369,048 (13.9%) | 19,017 (0.7%) |
| 4-Person Households | 309,926 (11.7%) | 6,876 (0.3%) |
| 5-Person Households | 150,234 (5.7%) | 2,501 (0.1%) |
| 6-Person Households | 56,220 (2.1%) | 341 (0.0%) |
| 7+ Person Households | 32,916 (1.2%) | 185 (0.0%) |
| Total | 1,696,018 (63.9%) | 957,578 (36.1%) |
Female Fertility in Indiana
Fertility by Age in Indiana
Average fertility rate in Indiana is 54.0 births per 1,000 women. Women in the age bracket of 20 to 34 years have the highest fertility rate with 99.0 births per 1,000 women. Women in the age bracket of 20 to 34 years acount for 77.5% of all women with births.
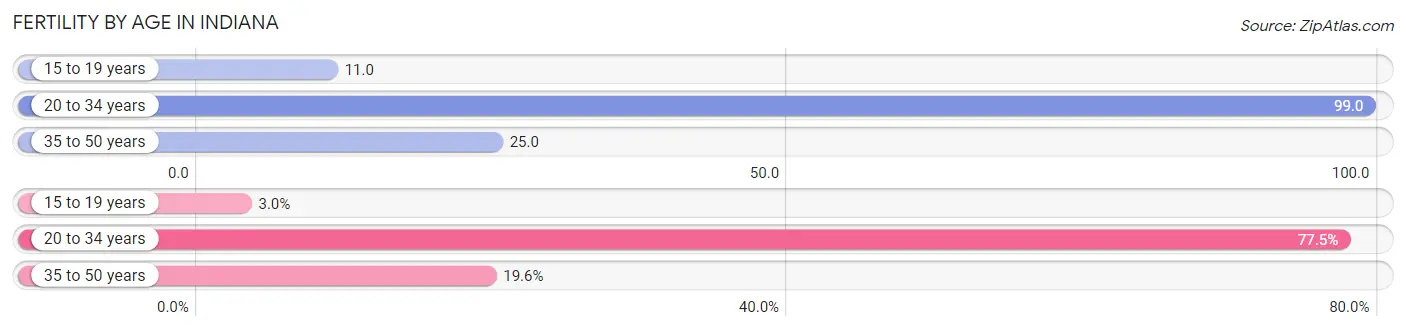
| Age Bracket | Women with Births | Births / 1,000 Women |
| 15 to 19 years | 2,512 (2.9%) | 11.0 |
| 20 to 34 years | 66,086 (77.5%) | 99.0 |
| 35 to 50 years | 16,678 (19.6%) | 25.0 |
| Total | 85,276 (100.0%) | 54.0 |
Fertility by Age by Marriage Status in Indiana
64.5% of women with births (85,276) in Indiana are married. The highest percentage of unmarried women with births falls into 15 to 19 years age bracket with 91.8% of them unmarried at the time of birth, while the lowest percentage of unmarried women with births belong to 35 to 50 years age bracket with 22.1% of them unmarried.
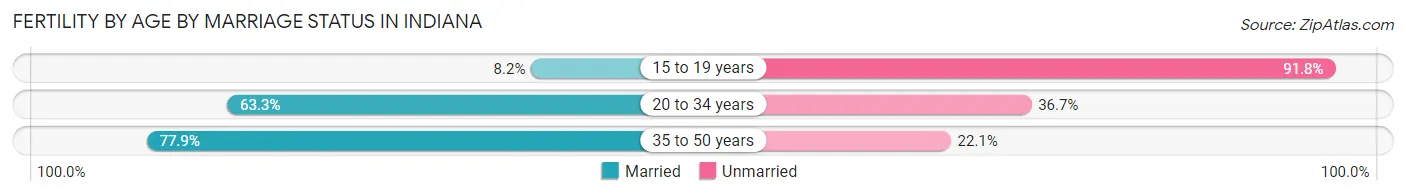
| Age Bracket | Married | Unmarried |
| 15 to 19 years | 206 (8.2%) | 2,306 (91.8%) |
| 20 to 34 years | 41,832 (63.3%) | 24,254 (36.7%) |
| 35 to 50 years | 12,992 (77.9%) | 3,686 (22.1%) |
| Total | 55,003 (64.5%) | 30,273 (35.5%) |
Fertility by Education in Indiana
Average fertility rate in Indiana is 54.0 births per 1,000 women. Women with the education attainment of graduate degree have the highest fertility rate of 63.0 births per 1,000 women, while women with the education attainment of less than high school have the lowest fertility at 34.0 births per 1,000 women. Women with the education attainment of college or associate's degree represent 30.7% of all women with births.
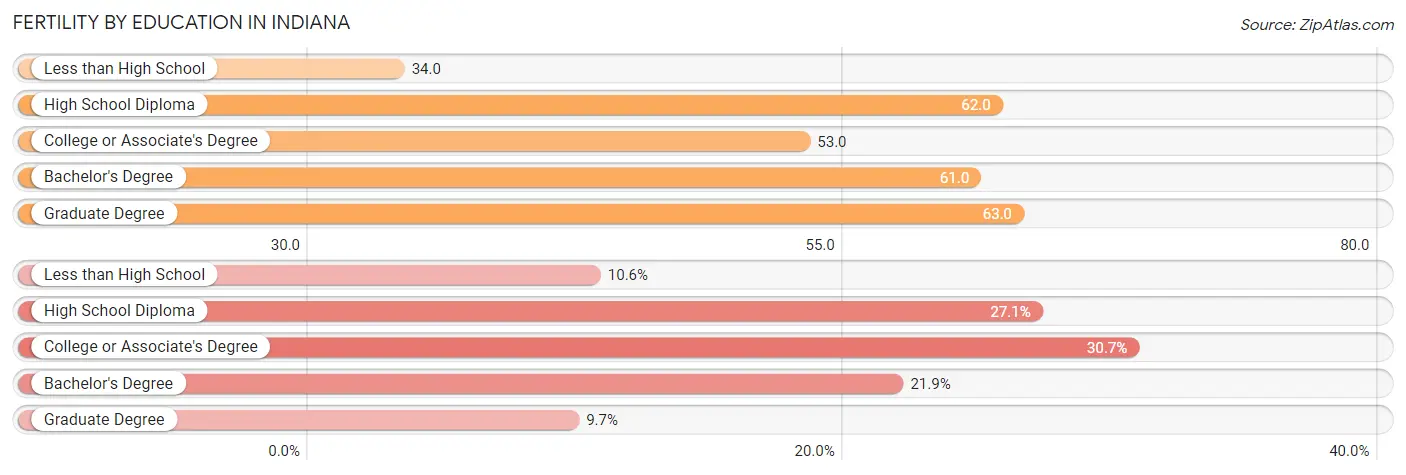
| Educational Attainment | Women with Births | Births / 1,000 Women |
| Less than High School | 9,000 (10.5%) | 34.0 |
| High School Diploma | 23,107 (27.1%) | 62.0 |
| College or Associate's Degree | 26,193 (30.7%) | 53.0 |
| Bachelor's Degree | 18,668 (21.9%) | 61.0 |
| Graduate Degree | 8,308 (9.7%) | 63.0 |
| Total | 85,276 (100.0%) | 54.0 |
Fertility by Education by Marriage Status in Indiana
35.5% of women with births in Indiana are unmarried. Women with the educational attainment of graduate degree are most likely to be married with 95.8% of them married at childbirth, while women with the educational attainment of high school diploma are least likely to be married with 53.5% of them unmarried at childbirth.
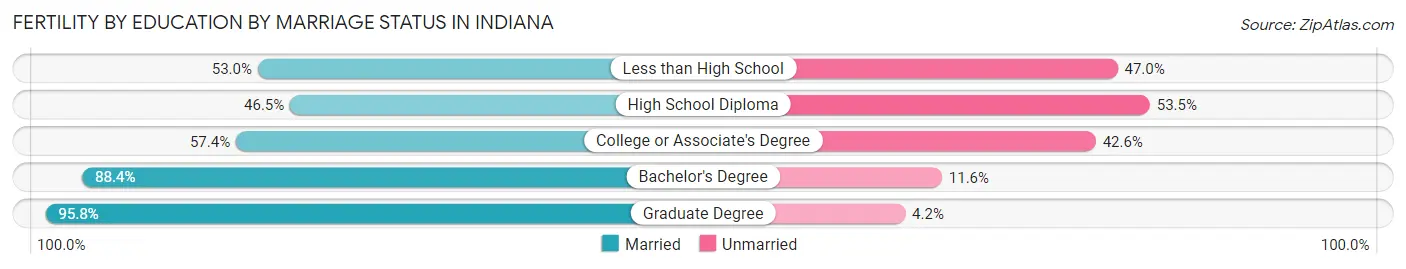
| Educational Attainment | Married | Unmarried |
| Less than High School | 4,770 (53.0%) | 4,230 (47.0%) |
| High School Diploma | 10,745 (46.5%) | 12,362 (53.5%) |
| College or Associate's Degree | 15,035 (57.4%) | 11,158 (42.6%) |
| Bachelor's Degree | 16,503 (88.4%) | 2,165 (11.6%) |
| Graduate Degree | 7,959 (95.8%) | 349 (4.2%) |
| Total | 55,003 (64.5%) | 30,273 (35.5%) |
Employment Characteristics in Indiana
Employment by Class of Employer in Indiana
Among the 3,222,821 employed individuals in Indiana, private company employees (2,286,463 | 71.0%), not-for-profit organizations (315,192 | 9.8%), and local government employees (198,927 | 6.2%) make up the most common classes of employment.
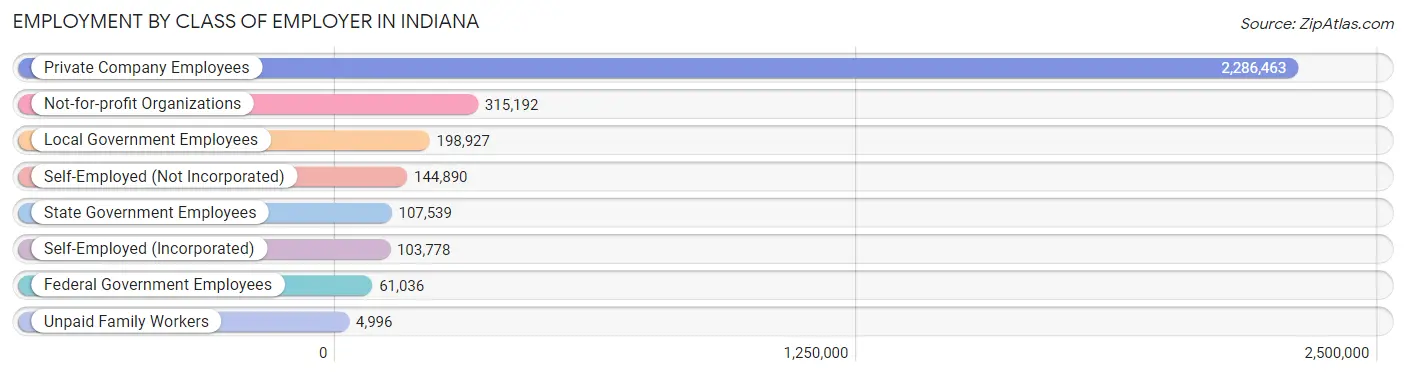
| Employer Class | # Employees | % Employees |
| Private Company Employees | 2,286,463 | 71.0% |
| Self-Employed (Incorporated) | 103,778 | 3.2% |
| Self-Employed (Not Incorporated) | 144,890 | 4.5% |
| Not-for-profit Organizations | 315,192 | 9.8% |
| Local Government Employees | 198,927 | 6.2% |
| State Government Employees | 107,539 | 3.3% |
| Federal Government Employees | 61,036 | 1.9% |
| Unpaid Family Workers | 4,996 | 0.2% |
| Total | 3,222,821 | 100.0% |
Employment Status by Age in Indiana
According to the labor force statistics for Indiana, out of the total population over 16 years of age (5,390,900), 63.9% or 3,444,785 individuals are in the labor force, with 4.5% or 155,015 of them unemployed. The age group with the highest labor force participation rate is 25 to 29 years, with 83.5% or 375,546 individuals in the labor force. Within the labor force, the 16 to 19 years age range has the highest percentage of unemployed individuals, with 11.2% or 19,037 of them being unemployed.
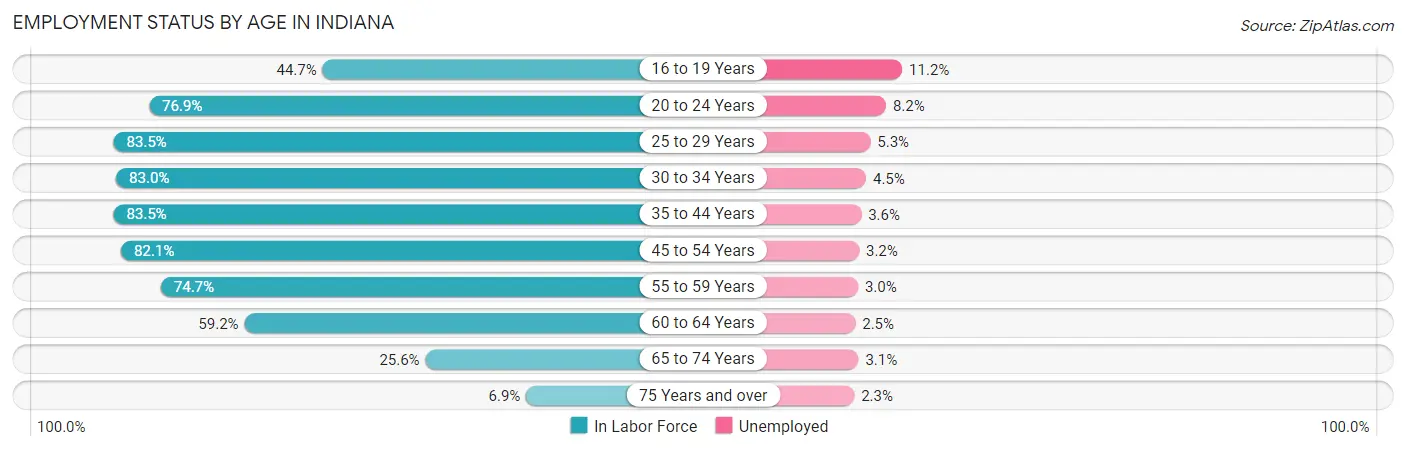
| Age Bracket | In Labor Force | Unemployed |
| 16 to 19 Years | 169,974 (44.7%) | 19,037 (11.2%) |
| 20 to 24 Years | 368,007 (76.9%) | 30,177 (8.2%) |
| 25 to 29 Years | 375,546 (83.5%) | 19,904 (5.3%) |
| 30 to 34 Years | 360,780 (83.0%) | 16,235 (4.5%) |
| 35 to 44 Years | 707,673 (83.5%) | 25,476 (3.6%) |
| 45 to 54 Years | 679,960 (82.1%) | 21,759 (3.2%) |
| 55 to 59 Years | 330,006 (74.7%) | 9,900 (3.0%) |
| 60 to 64 Years | 256,313 (59.2%) | 6,408 (2.5%) |
| 65 to 74 Years | 167,024 (25.6%) | 5,178 (3.1%) |
| 75 Years and over | 30,689 (6.9%) | 706 (2.3%) |
| Total | 3,444,785 (63.9%) | 155,015 (4.5%) |
Employment Status by Educational Attainment in Indiana
According to labor force statistics for Indiana, 78.9% of individuals (2,710,128) out of the total population between 25 and 64 years of age (3,434,890) are in the labor force, with 3.7% or 100,275 of them being unemployed. The group with the highest labor force participation rate are those with the educational attainment of bachelor's degree or higher, with 88.4% or 910,213 individuals in the labor force. Within the labor force, individuals with less than high school education have the highest percentage of unemployment, with 8.0% or 15,227 of them being unemployed.
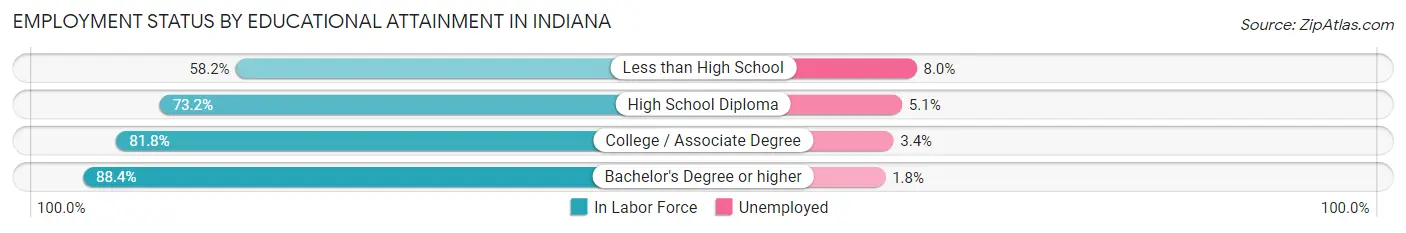
| Educational Attainment | In Labor Force | Unemployed |
| Less than High School | 190,336 (58.2%) | 26,163 (8.0%) |
| High School Diploma | 769,102 (73.2%) | 53,585 (5.1%) |
| College / Associate Degree | 840,506 (81.8%) | 34,935 (3.4%) |
| Bachelor's Degree or higher | 910,213 (88.4%) | 18,534 (1.8%) |
| Total | 2,710,128 (78.9%) | 127,091 (3.7%) |
Employment Occupations by Sex in Indiana
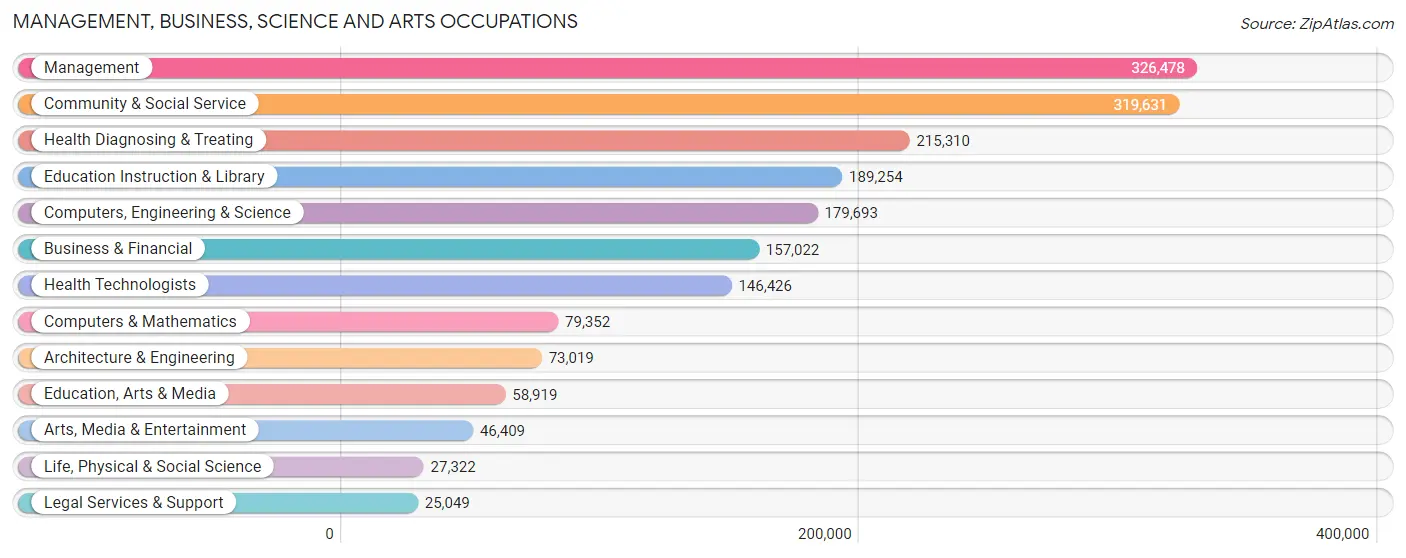
Management, Business, Science and Arts Occupations
The most common Management, Business, Science and Arts occupations in Indiana are Management (326,478 | 9.9%), Community & Social Service (319,631 | 9.7%), Health Diagnosing & Treating (215,310 | 6.6%), Education Instruction & Library (189,254 | 5.8%), and Computers, Engineering & Science (179,693 | 5.5%).
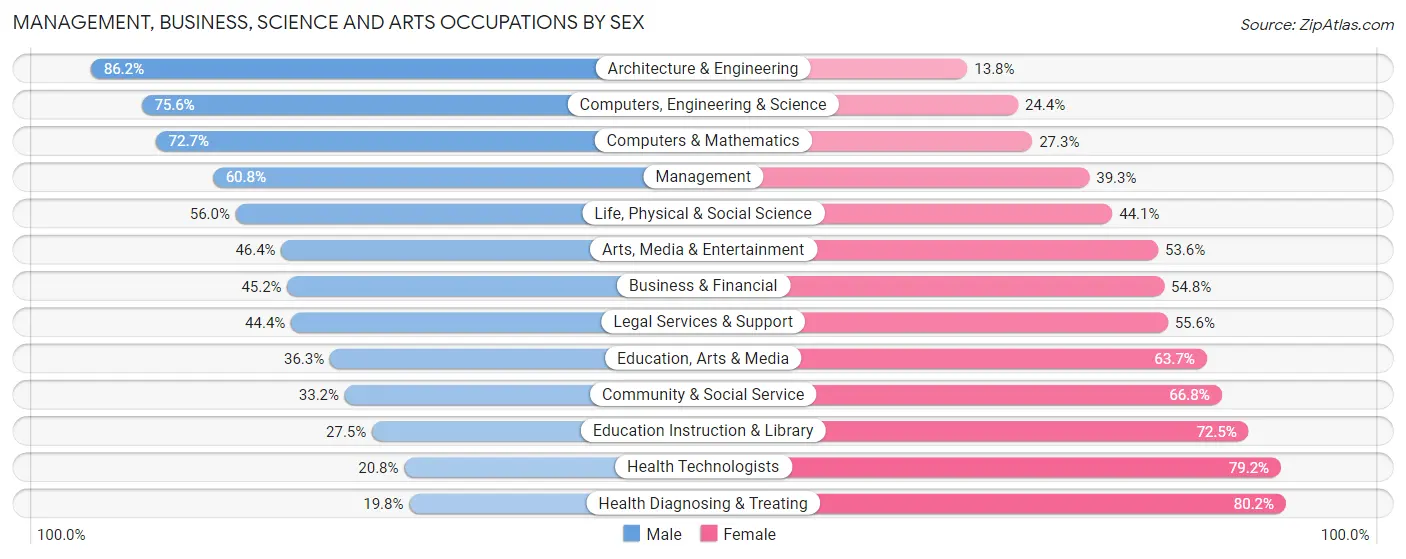
Management, Business, Science and Arts Occupations by Sex
Within the Management, Business, Science and Arts occupations in Indiana, the most male-oriented occupations are Architecture & Engineering (86.2%), Computers, Engineering & Science (75.6%), and Computers & Mathematics (72.7%), while the most female-oriented occupations are Health Diagnosing & Treating (80.2%), Health Technologists (79.2%), and Education Instruction & Library (72.5%).
| Occupation | Male | Female |
| Management | 198,343 (60.8%) | 128,135 (39.3%) |
| Business & Financial | 70,927 (45.2%) | 86,095 (54.8%) |
| Computers, Engineering & Science | 135,883 (75.6%) | 43,810 (24.4%) |
| Computers & Mathematics | 57,660 (72.7%) | 21,692 (27.3%) |
| Architecture & Engineering | 62,936 (86.2%) | 10,083 (13.8%) |
| Life, Physical & Social Science | 15,287 (55.9%) | 12,035 (44.1%) |
| Community & Social Service | 106,101 (33.2%) | 213,530 (66.8%) |
| Education, Arts & Media | 21,376 (36.3%) | 37,543 (63.7%) |
| Legal Services & Support | 11,118 (44.4%) | 13,931 (55.6%) |
| Education Instruction & Library | 52,062 (27.5%) | 137,192 (72.5%) |
| Arts, Media & Entertainment | 21,545 (46.4%) | 24,864 (53.6%) |
| Health Diagnosing & Treating | 42,544 (19.8%) | 172,766 (80.2%) |
| Health Technologists | 30,427 (20.8%) | 115,999 (79.2%) |
| Total (Category) | 553,798 (46.2%) | 644,336 (53.8%) |
| Total (Overall) | 1,738,091 (52.9%) | 1,548,623 (47.1%) |
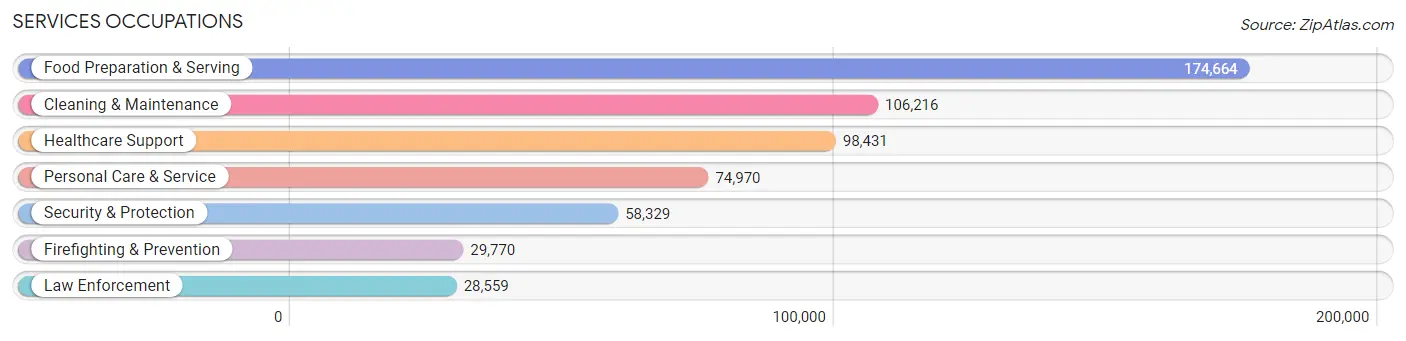
Services Occupations
The most common Services occupations in Indiana are Food Preparation & Serving (174,664 | 5.3%), Cleaning & Maintenance (106,216 | 3.2%), Healthcare Support (98,431 | 3.0%), Personal Care & Service (74,970 | 2.3%), and Security & Protection (58,329 | 1.8%).
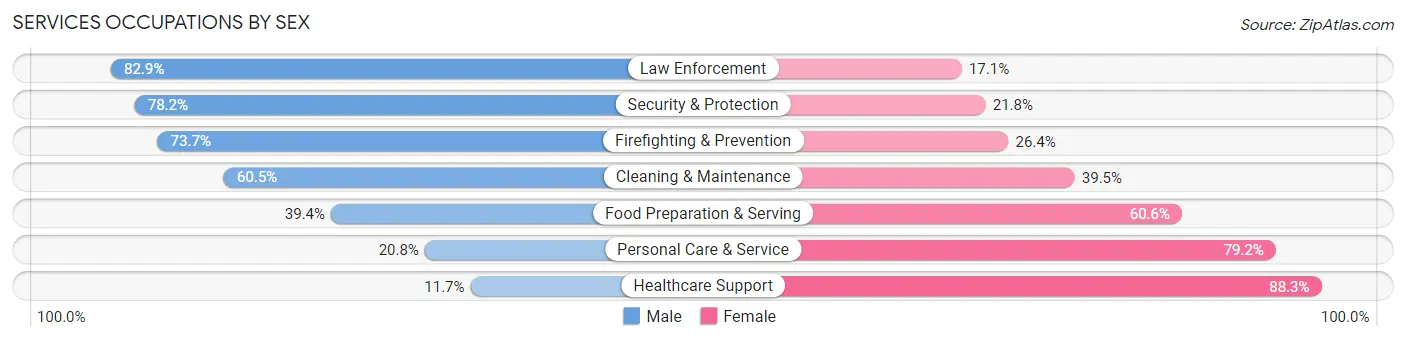
Services Occupations by Sex
Within the Services occupations in Indiana, the most male-oriented occupations are Law Enforcement (82.9%), Security & Protection (78.2%), and Firefighting & Prevention (73.7%), while the most female-oriented occupations are Healthcare Support (88.3%), Personal Care & Service (79.2%), and Food Preparation & Serving (60.6%).
| Occupation | Male | Female |
| Healthcare Support | 11,549 (11.7%) | 86,882 (88.3%) |
| Security & Protection | 45,595 (78.2%) | 12,734 (21.8%) |
| Firefighting & Prevention | 21,926 (73.7%) | 7,844 (26.4%) |
| Law Enforcement | 23,669 (82.9%) | 4,890 (17.1%) |
| Food Preparation & Serving | 68,753 (39.4%) | 105,911 (60.6%) |
| Cleaning & Maintenance | 64,289 (60.5%) | 41,927 (39.5%) |
| Personal Care & Service | 15,572 (20.8%) | 59,398 (79.2%) |
| Total (Category) | 205,758 (40.1%) | 306,852 (59.9%) |
| Total (Overall) | 1,738,091 (52.9%) | 1,548,623 (47.1%) |
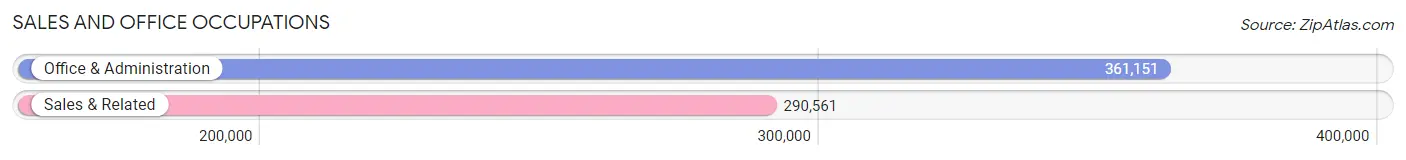
Sales and Office Occupations
The most common Sales and Office occupations in Indiana are Office & Administration (361,151 | 11.0%), and Sales & Related (290,561 | 8.8%).
Sales and Office Occupations by Sex
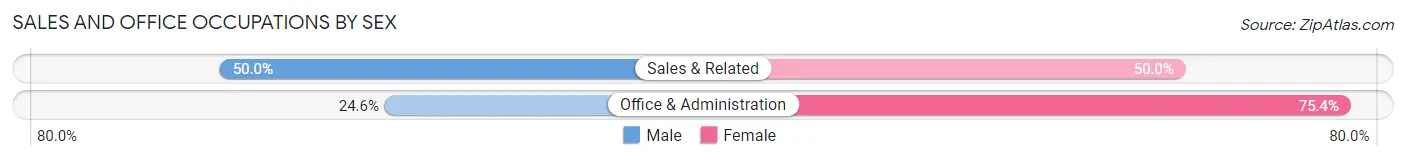
| Occupation | Male | Female |
| Sales & Related | 145,186 (50.0%) | 145,375 (50.0%) |
| Office & Administration | 88,774 (24.6%) | 272,377 (75.4%) |
| Total (Category) | 233,960 (35.9%) | 417,752 (64.1%) |
| Total (Overall) | 1,738,091 (52.9%) | 1,548,623 (47.1%) |
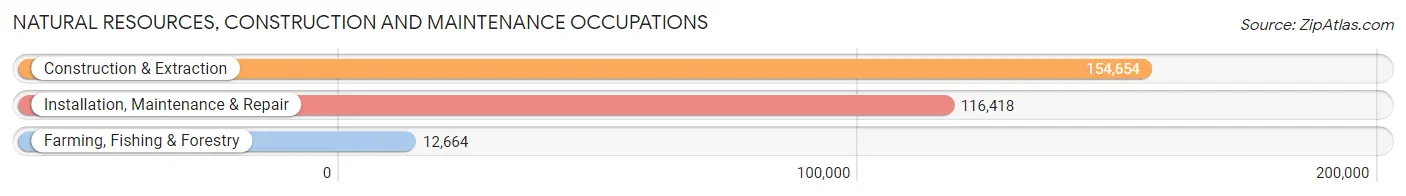
Natural Resources, Construction and Maintenance Occupations
The most common Natural Resources, Construction and Maintenance occupations in Indiana are Construction & Extraction (154,654 | 4.7%), Installation, Maintenance & Repair (116,418 | 3.5%), and Farming, Fishing & Forestry (12,664 | 0.4%).
Natural Resources, Construction and Maintenance Occupations by Sex
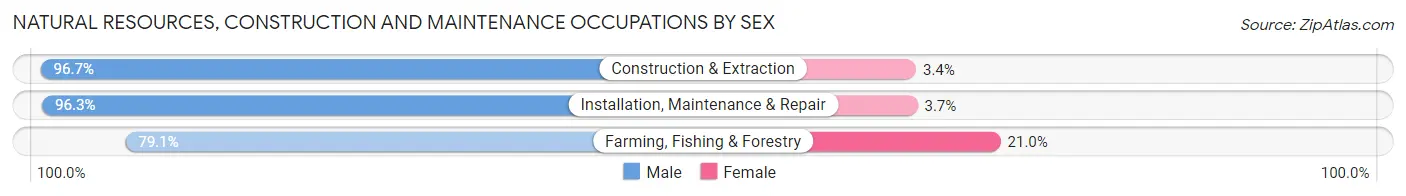
| Occupation | Male | Female |
| Farming, Fishing & Forestry | 10,011 (79.0%) | 2,653 (20.9%) |
| Construction & Extraction | 149,478 (96.7%) | 5,176 (3.4%) |
| Installation, Maintenance & Repair | 112,156 (96.3%) | 4,262 (3.7%) |
| Total (Category) | 271,645 (95.7%) | 12,091 (4.3%) |
| Total (Overall) | 1,738,091 (52.9%) | 1,548,623 (47.1%) |
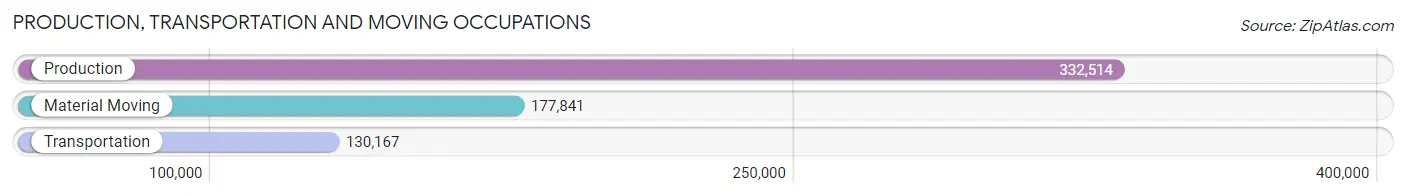
Production, Transportation and Moving Occupations
The most common Production, Transportation and Moving occupations in Indiana are Production (332,514 | 10.1%), Material Moving (177,841 | 5.4%), and Transportation (130,167 | 4.0%).
Production, Transportation and Moving Occupations by Sex
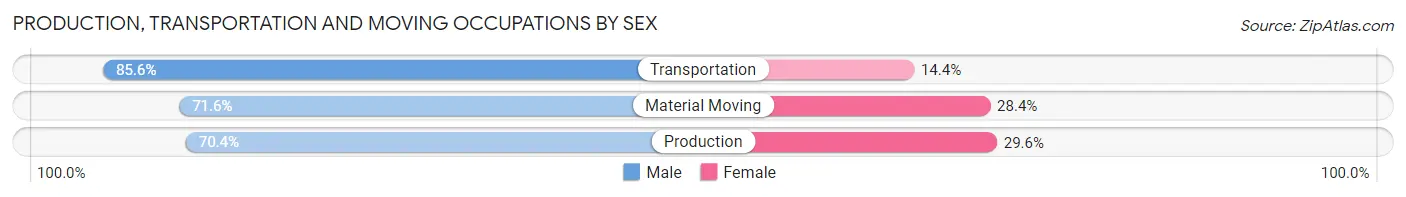
| Occupation | Male | Female |
| Production | 234,117 (70.4%) | 98,397 (29.6%) |
| Transportation | 111,430 (85.6%) | 18,737 (14.4%) |
| Material Moving | 127,383 (71.6%) | 50,458 (28.4%) |
| Total (Category) | 472,930 (73.8%) | 167,592 (26.2%) |
| Total (Overall) | 1,738,091 (52.9%) | 1,548,623 (47.1%) |
Employment Industries by Sex in Indiana
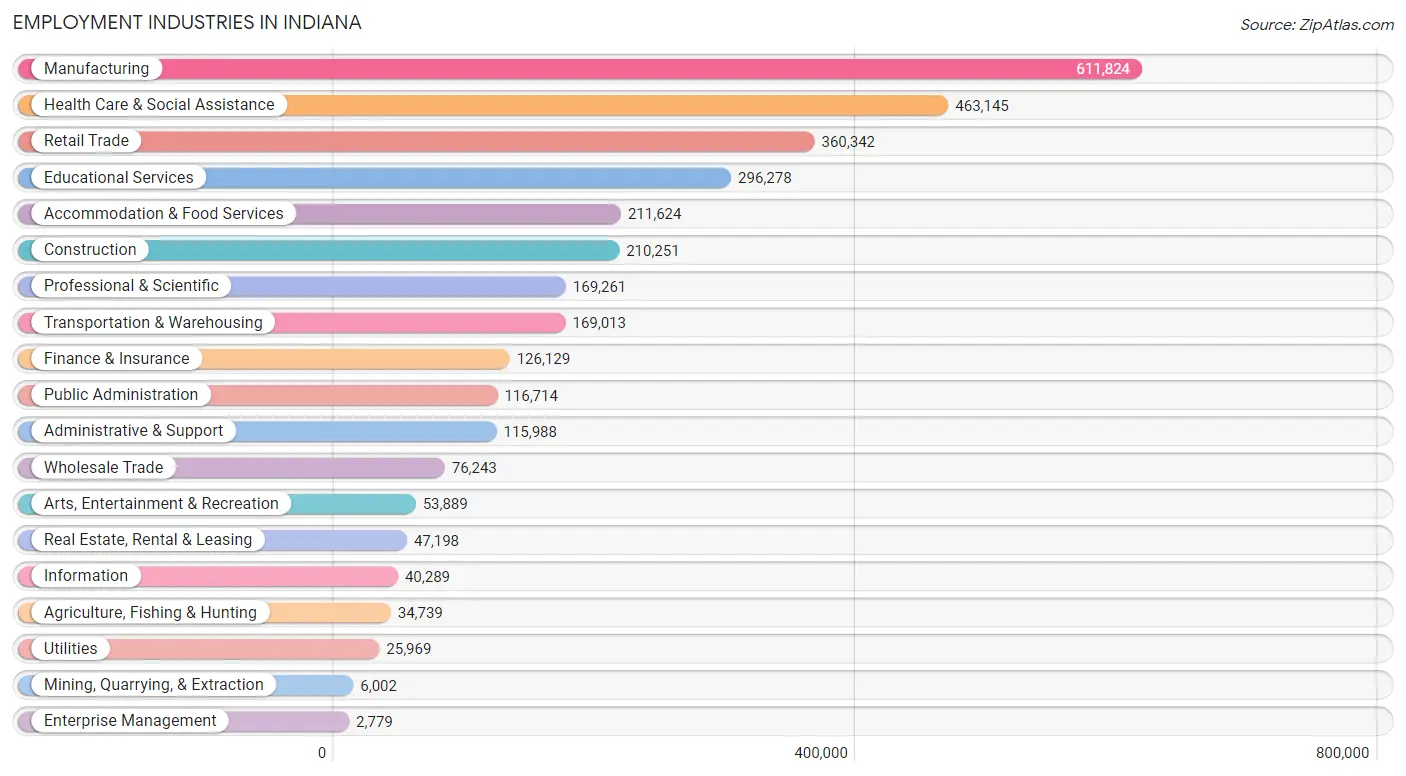
Employment Industries in Indiana
The major employment industries in Indiana include Manufacturing (611,824 | 18.6%), Health Care & Social Assistance (463,145 | 14.1%), Retail Trade (360,342 | 11.0%), Educational Services (296,278 | 9.0%), and Accommodation & Food Services (211,624 | 6.4%).
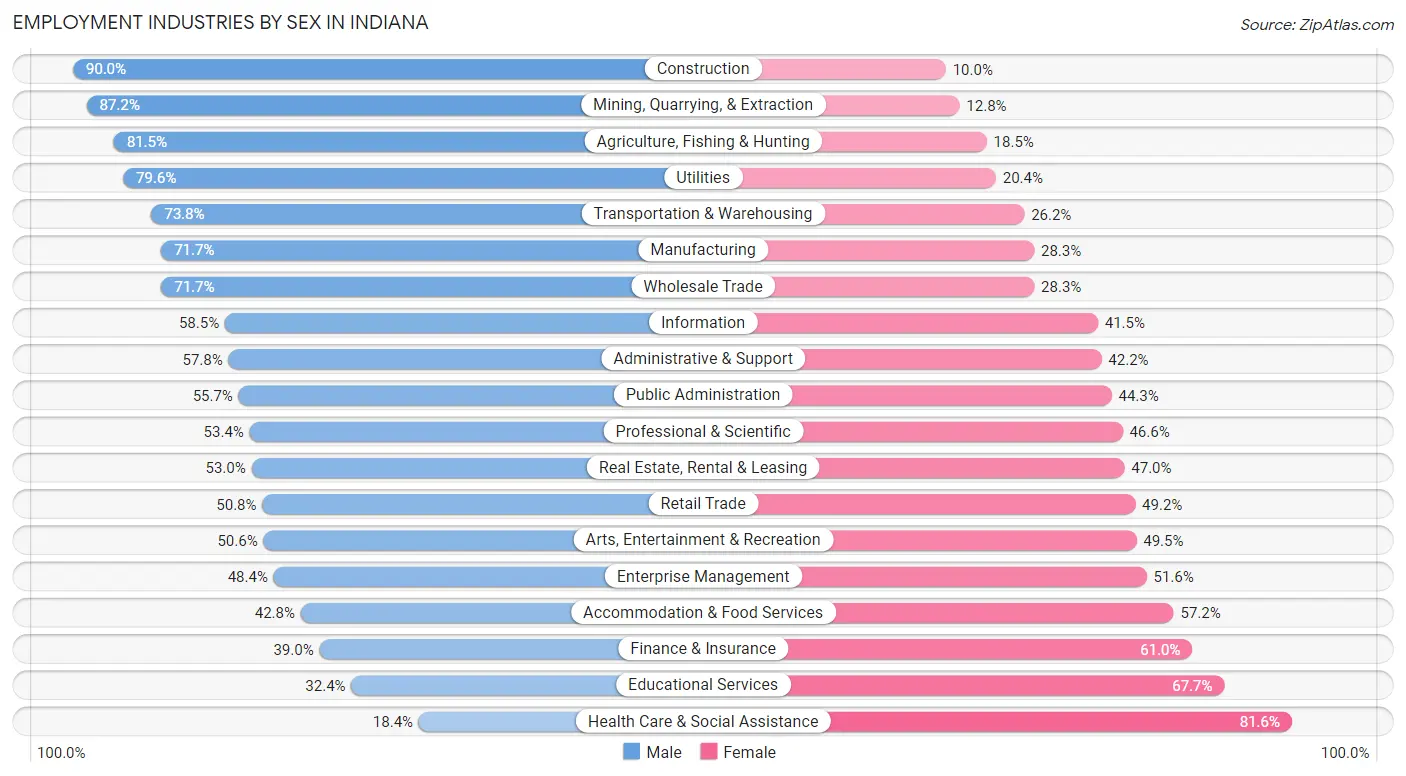
Employment Industries by Sex in Indiana
The Indiana industries that see more men than women are Construction (90.0%), Mining, Quarrying, & Extraction (87.2%), and Agriculture, Fishing & Hunting (81.5%), whereas the industries that tend to have a higher number of women are Health Care & Social Assistance (81.6%), Educational Services (67.6%), and Finance & Insurance (61.0%).
| Industry | Male | Female |
| Agriculture, Fishing & Hunting | 28,322 (81.5%) | 6,417 (18.5%) |
| Mining, Quarrying, & Extraction | 5,232 (87.2%) | 770 (12.8%) |
| Construction | 189,218 (90.0%) | 21,033 (10.0%) |
| Manufacturing | 438,795 (71.7%) | 173,029 (28.3%) |
| Wholesale Trade | 54,667 (71.7%) | 21,576 (28.3%) |
| Retail Trade | 183,026 (50.8%) | 177,316 (49.2%) |
| Transportation & Warehousing | 124,667 (73.8%) | 44,346 (26.2%) |
| Utilities | 20,679 (79.6%) | 5,290 (20.4%) |
| Information | 23,578 (58.5%) | 16,711 (41.5%) |
| Finance & Insurance | 49,144 (39.0%) | 76,985 (61.0%) |
| Real Estate, Rental & Leasing | 25,025 (53.0%) | 22,173 (47.0%) |
| Professional & Scientific | 90,417 (53.4%) | 78,844 (46.6%) |
| Enterprise Management | 1,346 (48.4%) | 1,433 (51.6%) |
| Administrative & Support | 67,017 (57.8%) | 48,971 (42.2%) |
| Educational Services | 95,832 (32.4%) | 200,446 (67.6%) |
| Health Care & Social Assistance | 85,105 (18.4%) | 378,040 (81.6%) |
| Arts, Entertainment & Recreation | 27,243 (50.5%) | 26,646 (49.4%) |
| Accommodation & Food Services | 90,663 (42.8%) | 120,961 (57.2%) |
| Public Administration | 64,983 (55.7%) | 51,731 (44.3%) |
| Total | 1,738,091 (52.9%) | 1,548,623 (47.1%) |
Education in Indiana
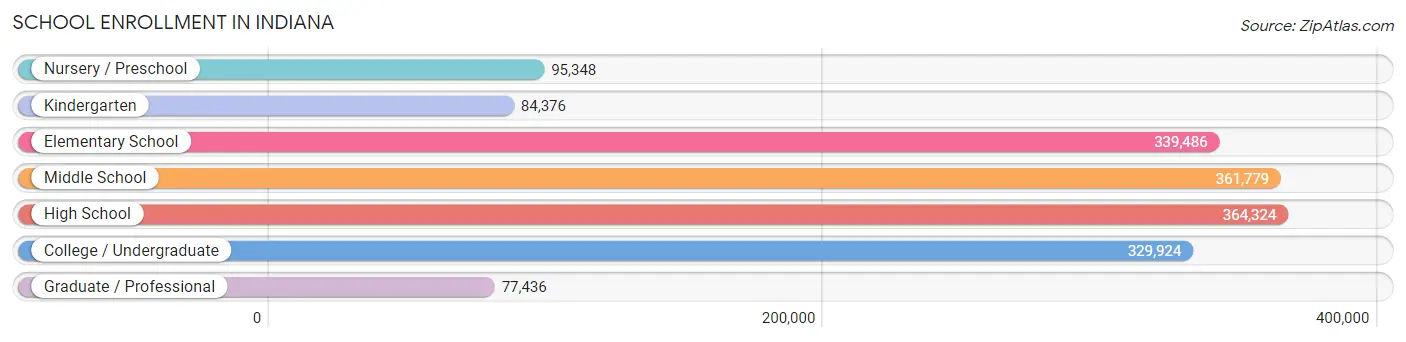
School Enrollment in Indiana
The most common levels of schooling among the 1,652,673 students in Indiana are high school (364,324 | 22.0%), middle school (361,779 | 21.9%), and elementary school (339,486 | 20.5%).
| School Level | # Students | % Students |
| Nursery / Preschool | 95,348 | 5.8% |
| Kindergarten | 84,376 | 5.1% |
| Elementary School | 339,486 | 20.5% |
| Middle School | 361,779 | 21.9% |
| High School | 364,324 | 22.0% |
| College / Undergraduate | 329,924 | 20.0% |
| Graduate / Professional | 77,436 | 4.7% |
| Total | 1,652,673 | 100.0% |
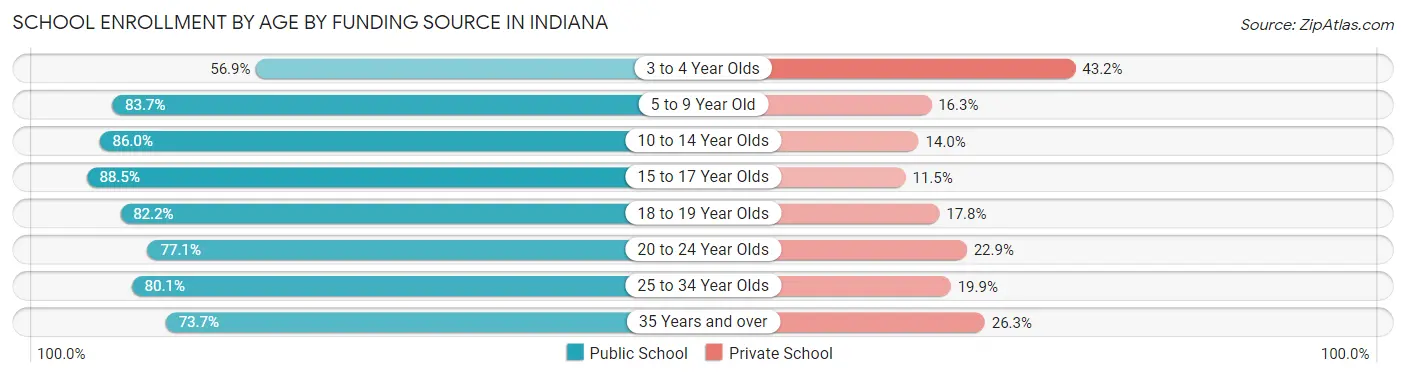
School Enrollment by Age by Funding Source in Indiana
Out of a total of 1,652,673 students who are enrolled in schools in Indiana, 287,565 (17.4%) attend a private institution, while the remaining 1,365,108 (82.6%) are enrolled in public schools. The age group of 3 to 4 year olds has the highest likelihood of being enrolled in private schools, with 29,022 (43.1% in the age bracket) enrolled. Conversely, the age group of 15 to 17 year olds has the lowest likelihood of being enrolled in a private school, with 235,155 (88.5% in the age bracket) attending a public institution.
| Age Bracket | Public School | Private School |
| 3 to 4 Year Olds | 38,232 (56.9%) | 29,022 (43.1%) |
| 5 to 9 Year Old | 334,607 (83.7%) | 65,213 (16.3%) |
| 10 to 14 Year Olds | 384,266 (86.0%) | 62,352 (14.0%) |
| 15 to 17 Year Olds | 235,155 (88.5%) | 30,655 (11.5%) |
| 18 to 19 Year Olds | 116,981 (82.2%) | 25,350 (17.8%) |
| 20 to 24 Year Olds | 136,993 (77.1%) | 40,743 (22.9%) |
| 25 to 34 Year Olds | 65,893 (80.1%) | 16,416 (19.9%) |
| 35 Years and over | 52,186 (73.7%) | 18,609 (26.3%) |
| Total | 1,365,108 (82.6%) | 287,565 (17.4%) |
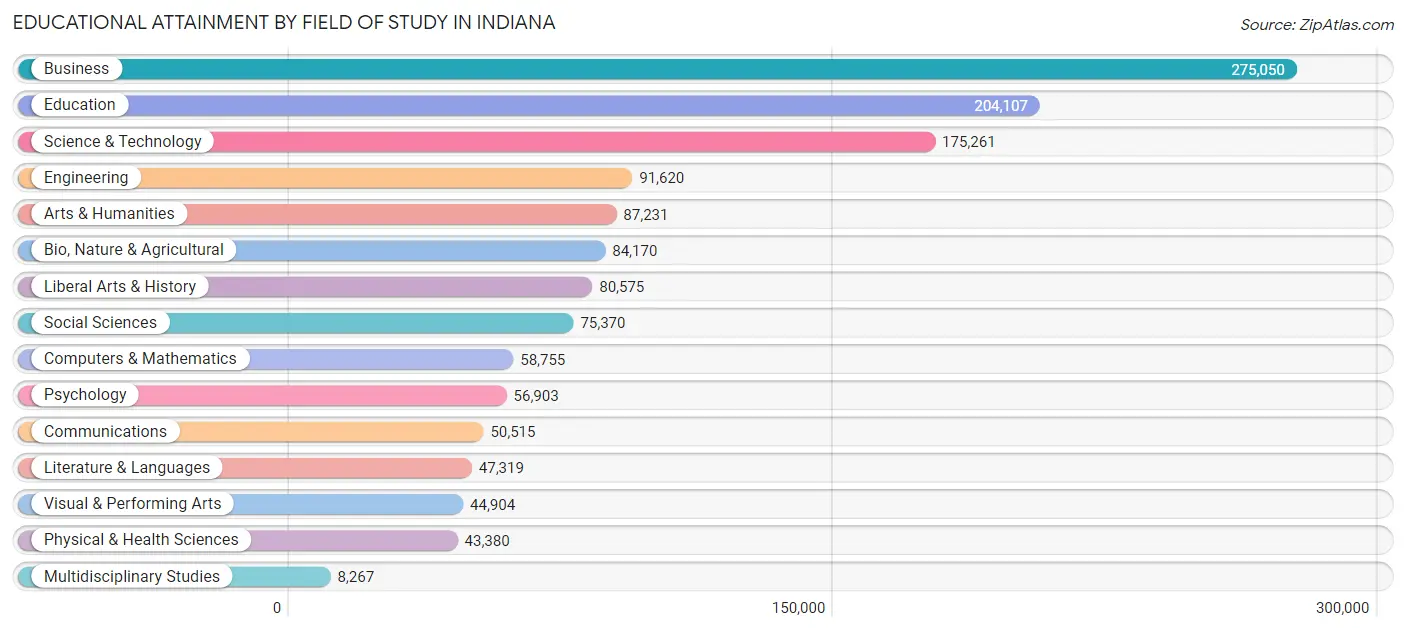
Educational Attainment by Field of Study in Indiana
Business (275,050 | 19.9%), education (204,107 | 14.7%), science & technology (175,261 | 12.7%), engineering (91,620 | 6.6%), and arts & humanities (87,231 | 6.3%) are the most common fields of study among 1,383,427 individuals in Indiana who have obtained a bachelor's degree or higher.
| Field of Study | # Graduates | % Graduates |
| Computers & Mathematics | 58,755 | 4.3% |
| Bio, Nature & Agricultural | 84,170 | 6.1% |
| Physical & Health Sciences | 43,380 | 3.1% |
| Psychology | 56,903 | 4.1% |
| Social Sciences | 75,370 | 5.4% |
| Engineering | 91,620 | 6.6% |
| Multidisciplinary Studies | 8,267 | 0.6% |
| Science & Technology | 175,261 | 12.7% |
| Business | 275,050 | 19.9% |
| Education | 204,107 | 14.7% |
| Literature & Languages | 47,319 | 3.4% |
| Liberal Arts & History | 80,575 | 5.8% |
| Visual & Performing Arts | 44,904 | 3.3% |
| Communications | 50,515 | 3.6% |
| Arts & Humanities | 87,231 | 6.3% |
| Total | 1,383,427 | 100.0% |
Transportation & Commute in Indiana
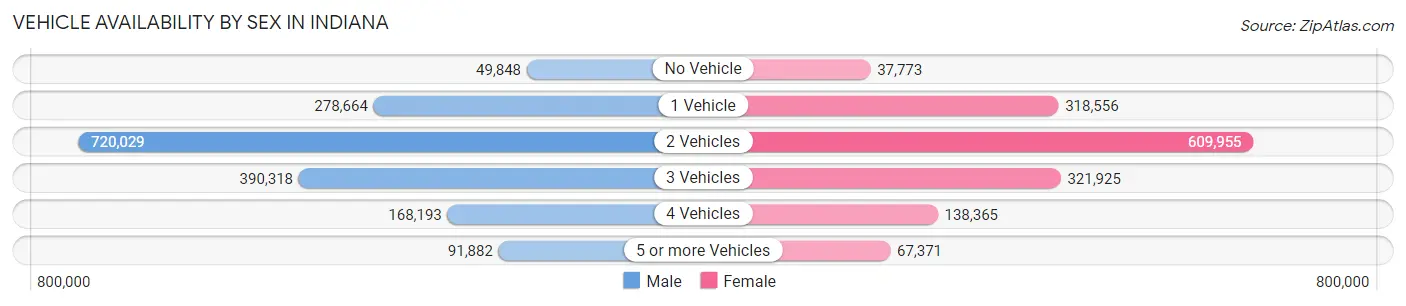
Vehicle Availability by Sex in Indiana
The most prevalent vehicle ownership categories in Indiana are males with 2 vehicles (720,029, accounting for 42.4%) and females with 2 vehicles (609,955, making up 48.2%).
| Vehicles Available | Male | Female |
| No Vehicle | 49,848 (2.9%) | 37,773 (2.5%) |
| 1 Vehicle | 278,664 (16.4%) | 318,556 (21.3%) |
| 2 Vehicles | 720,029 (42.4%) | 609,955 (40.8%) |
| 3 Vehicles | 390,318 (23.0%) | 321,925 (21.5%) |
| 4 Vehicles | 168,193 (9.9%) | 138,365 (9.3%) |
| 5 or more Vehicles | 91,882 (5.4%) | 67,371 (4.5%) |
| Total | 1,698,934 (100.0%) | 1,493,945 (100.0%) |
Commute Time in Indiana
The most frequently occuring commute durations in Indiana are 15 to 19 minutes (478,556 commuters, 16.2%), 10 to 14 minutes (446,612 commuters, 15.1%), and 20 to 24 minutes (427,252 commuters, 14.4%).
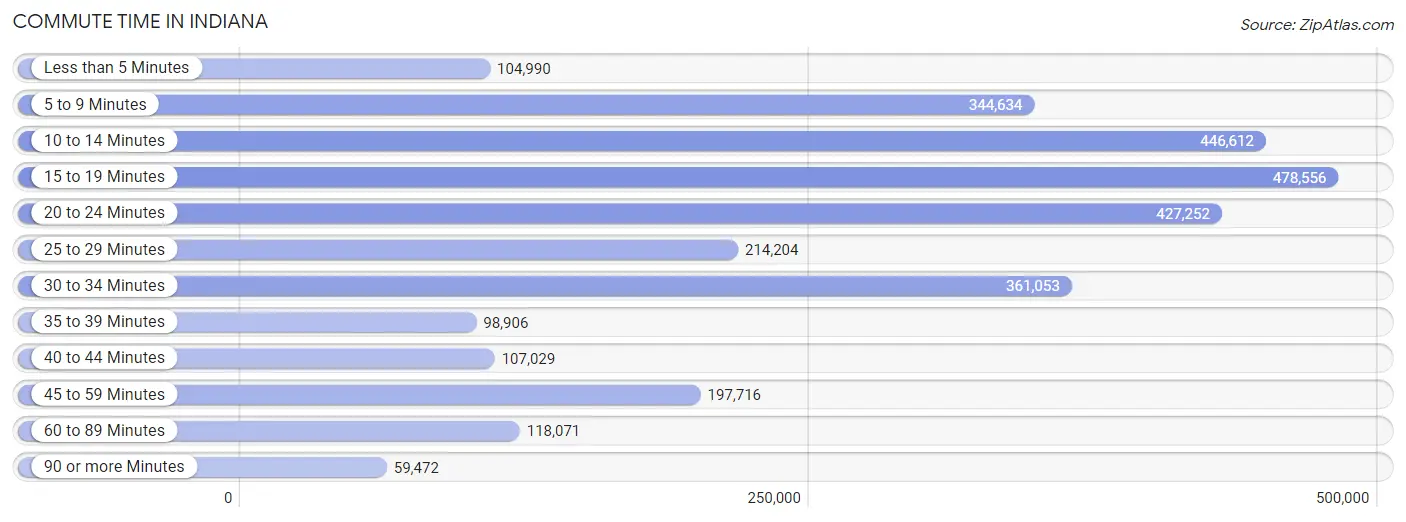
| Commute Time | # Commuters | % Commuters |
| Less than 5 Minutes | 104,990 | 3.5% |
| 5 to 9 Minutes | 344,634 | 11.7% |
| 10 to 14 Minutes | 446,612 | 15.1% |
| 15 to 19 Minutes | 478,556 | 16.2% |
| 20 to 24 Minutes | 427,252 | 14.4% |
| 25 to 29 Minutes | 214,204 | 7.2% |
| 30 to 34 Minutes | 361,053 | 12.2% |
| 35 to 39 Minutes | 98,906 | 3.3% |
| 40 to 44 Minutes | 107,029 | 3.6% |
| 45 to 59 Minutes | 197,716 | 6.7% |
| 60 to 89 Minutes | 118,071 | 4.0% |
| 90 or more Minutes | 59,472 | 2.0% |
Commute Time by Sex in Indiana
The most common commute times in Indiana are 15 to 19 minutes (240,519 commuters, 15.2%) for males and 15 to 19 minutes (238,037 commuters, 17.3%) for females.
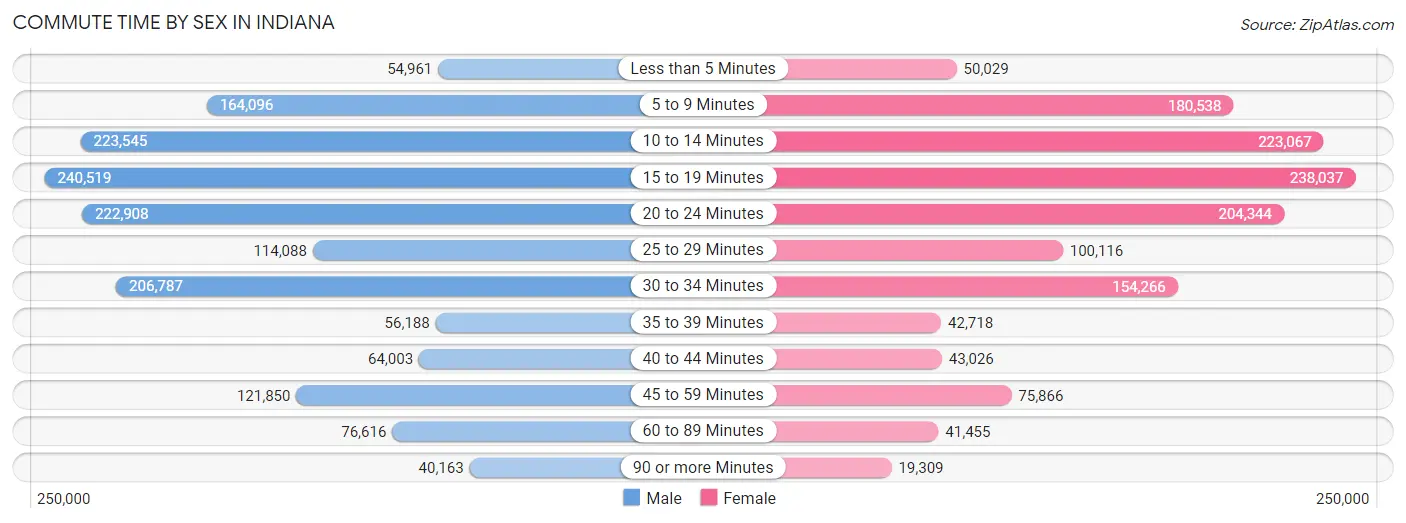
| Commute Time | Male | Female |
| Less than 5 Minutes | 54,961 (3.5%) | 50,029 (3.6%) |
| 5 to 9 Minutes | 164,096 (10.3%) | 180,538 (13.2%) |
| 10 to 14 Minutes | 223,545 (14.1%) | 223,067 (16.3%) |
| 15 to 19 Minutes | 240,519 (15.2%) | 238,037 (17.3%) |
| 20 to 24 Minutes | 222,908 (14.1%) | 204,344 (14.9%) |
| 25 to 29 Minutes | 114,088 (7.2%) | 100,116 (7.3%) |
| 30 to 34 Minutes | 206,787 (13.0%) | 154,266 (11.2%) |
| 35 to 39 Minutes | 56,188 (3.5%) | 42,718 (3.1%) |
| 40 to 44 Minutes | 64,003 (4.0%) | 43,026 (3.1%) |
| 45 to 59 Minutes | 121,850 (7.7%) | 75,866 (5.5%) |
| 60 to 89 Minutes | 76,616 (4.8%) | 41,455 (3.0%) |
| 90 or more Minutes | 40,163 (2.5%) | 19,309 (1.4%) |
Time of Departure to Work by Sex in Indiana
The most frequent times of departure to work in Indiana are 7:00 AM to 7:29 AM (207,830, 13.1%) for males and 7:00 AM to 7:29 AM (208,314, 15.2%) for females.
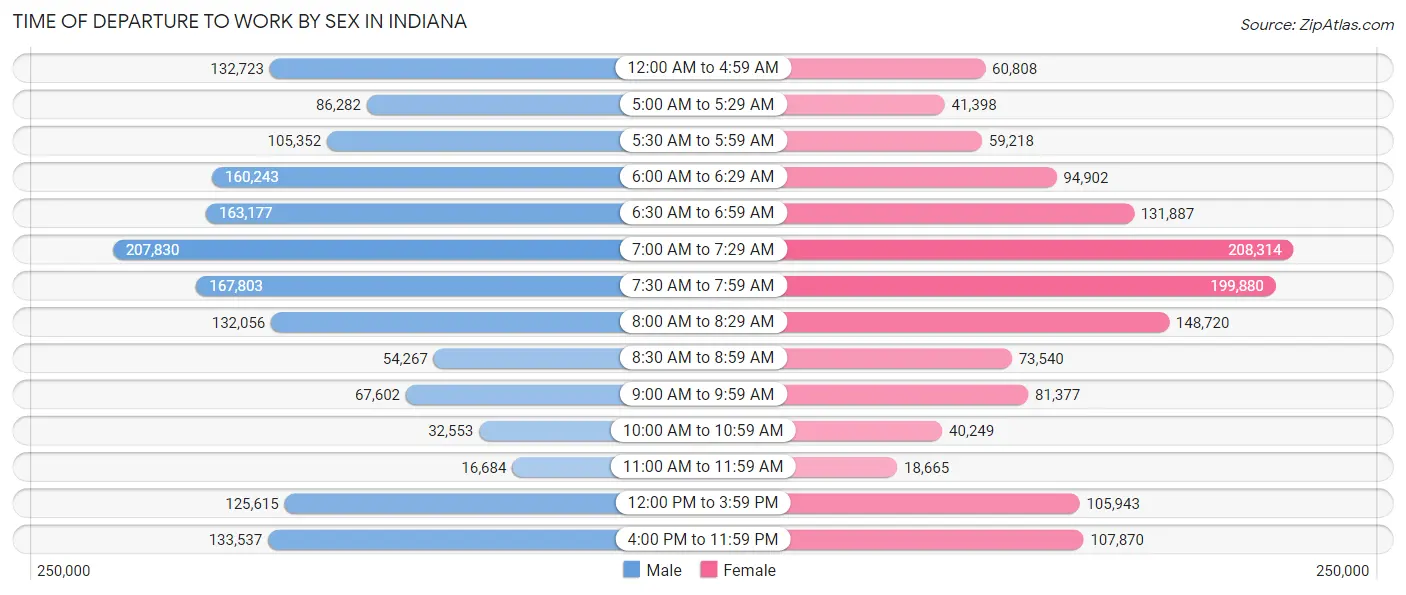
| Time of Departure | Male | Female |
| 12:00 AM to 4:59 AM | 132,723 (8.4%) | 60,808 (4.4%) |
| 5:00 AM to 5:29 AM | 86,282 (5.4%) | 41,398 (3.0%) |
| 5:30 AM to 5:59 AM | 105,352 (6.6%) | 59,218 (4.3%) |
| 6:00 AM to 6:29 AM | 160,243 (10.1%) | 94,902 (6.9%) |
| 6:30 AM to 6:59 AM | 163,177 (10.3%) | 131,887 (9.6%) |
| 7:00 AM to 7:29 AM | 207,830 (13.1%) | 208,314 (15.2%) |
| 7:30 AM to 7:59 AM | 167,803 (10.6%) | 199,880 (14.6%) |
| 8:00 AM to 8:29 AM | 132,056 (8.3%) | 148,720 (10.8%) |
| 8:30 AM to 8:59 AM | 54,267 (3.4%) | 73,540 (5.4%) |
| 9:00 AM to 9:59 AM | 67,602 (4.3%) | 81,377 (5.9%) |
| 10:00 AM to 10:59 AM | 32,553 (2.1%) | 40,249 (2.9%) |
| 11:00 AM to 11:59 AM | 16,684 (1.1%) | 18,665 (1.4%) |
| 12:00 PM to 3:59 PM | 125,615 (7.9%) | 105,943 (7.7%) |
| 4:00 PM to 11:59 PM | 133,537 (8.4%) | 107,870 (7.9%) |
| Total | 1,585,724 (100.0%) | 1,372,771 (100.0%) |
Housing Occupancy in Indiana
Occupancy by Ownership in Indiana
Of the total 2,653,596 dwellings in Indiana, owner-occupied units account for 1,860,566 (70.1%), while renter-occupied units make up 793,030 (29.9%).
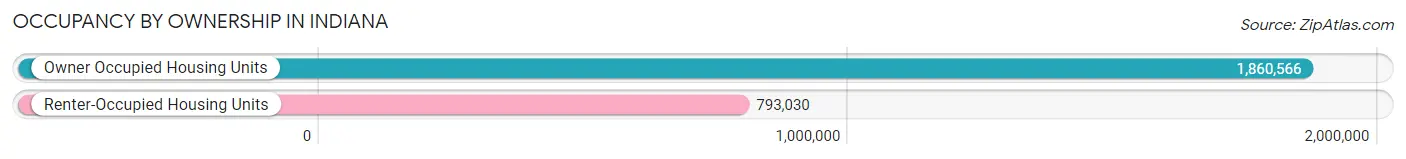
| Occupancy | # Housing Units | % Housing Units |
| Owner Occupied Housing Units | 1,860,566 | 70.1% |
| Renter-Occupied Housing Units | 793,030 | 29.9% |
| Total Occupied Housing Units | 2,653,596 | 100.0% |
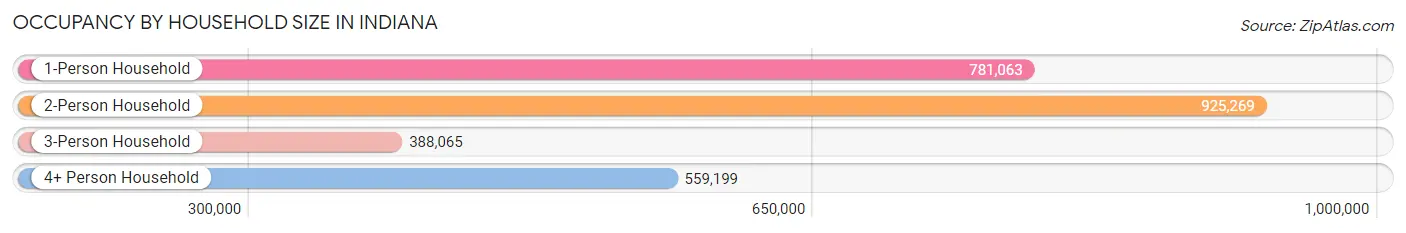
Occupancy by Household Size in Indiana
| Household Size | # Housing Units | % Housing Units |
| 1-Person Household | 781,063 | 29.4% |
| 2-Person Household | 925,269 | 34.9% |
| 3-Person Household | 388,065 | 14.6% |
| 4+ Person Household | 559,199 | 21.1% |
| Total Housing Units | 2,653,596 | 100.0% |
Occupancy by Ownership by Household Size in Indiana
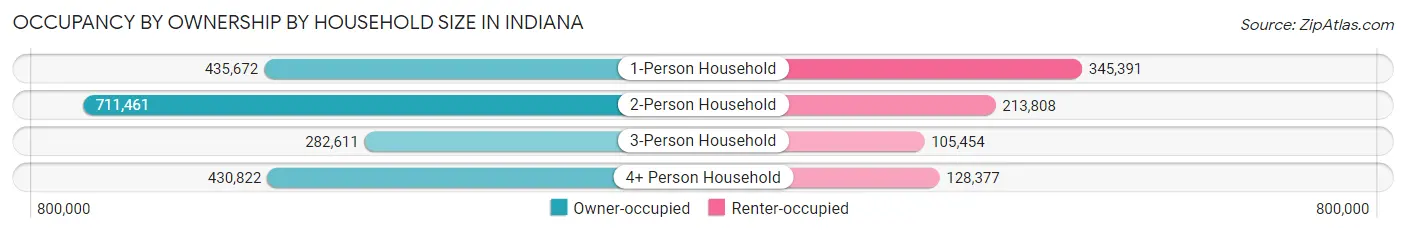
| Household Size | Owner-occupied | Renter-occupied |
| 1-Person Household | 435,672 (55.8%) | 345,391 (44.2%) |
| 2-Person Household | 711,461 (76.9%) | 213,808 (23.1%) |
| 3-Person Household | 282,611 (72.8%) | 105,454 (27.2%) |
| 4+ Person Household | 430,822 (77.0%) | 128,377 (23.0%) |
| Total Housing Units | 1,860,566 (70.1%) | 793,030 (29.9%) |
Occupancy by Educational Attainment in Indiana
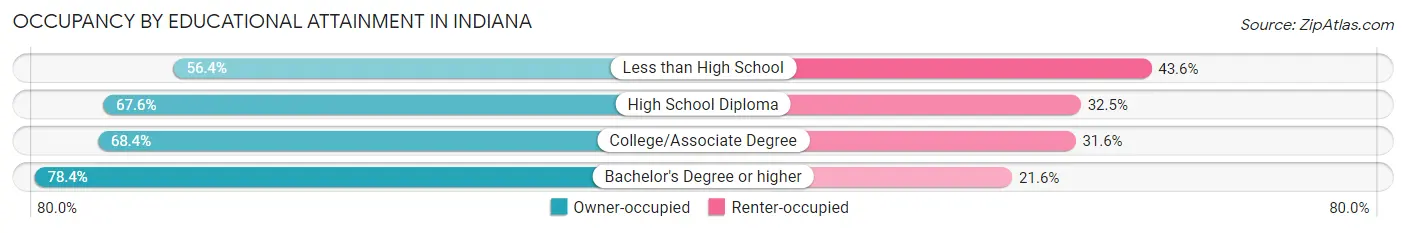
| Household Size | Owner-occupied | Renter-occupied |
| Less than High School | 128,520 (56.4%) | 99,520 (43.6%) |
| High School Diploma | 547,116 (67.5%) | 262,871 (32.5%) |
| College/Associate Degree | 559,664 (68.4%) | 258,697 (31.6%) |
| Bachelor's Degree or higher | 625,266 (78.4%) | 171,942 (21.6%) |
Occupancy by Age of Householder in Indiana
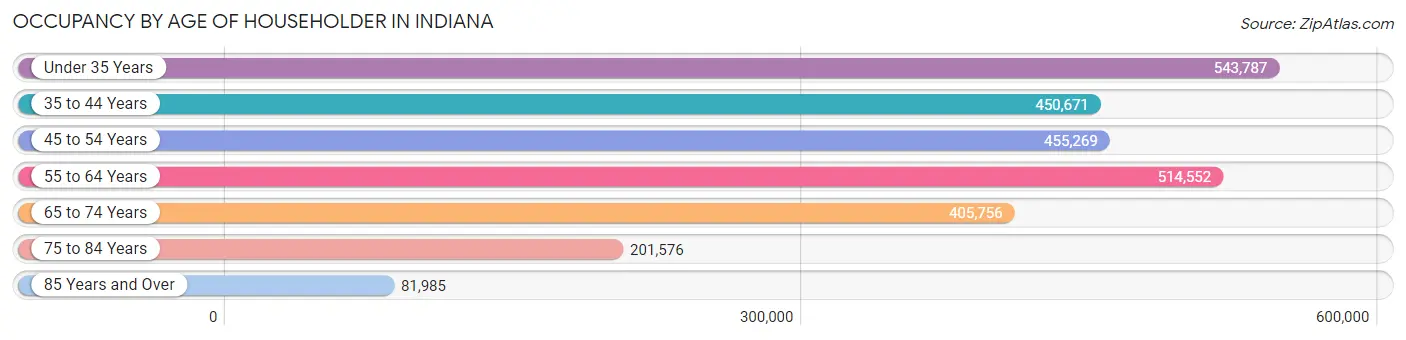
| Age Bracket | # Households | % Households |
| Under 35 Years | 543,787 | 20.5% |
| 35 to 44 Years | 450,671 | 17.0% |
| 45 to 54 Years | 455,269 | 17.2% |
| 55 to 64 Years | 514,552 | 19.4% |
| 65 to 74 Years | 405,756 | 15.3% |
| 75 to 84 Years | 201,576 | 7.6% |
| 85 Years and Over | 81,985 | 3.1% |
| Total | 2,653,596 | 100.0% |
Housing Finances in Indiana
Median Income by Occupancy in Indiana
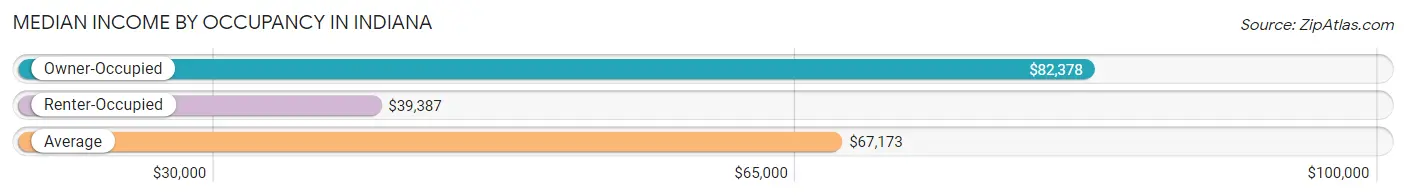
| Occupancy Type | # Households | Median Income |
| Owner-Occupied | 1,860,566 (70.1%) | $82,378 |
| Renter-Occupied | 793,030 (29.9%) | $39,387 |
| Average | 2,653,596 (100.0%) | $67,173 |
Occupancy by Householder Income Bracket in Indiana
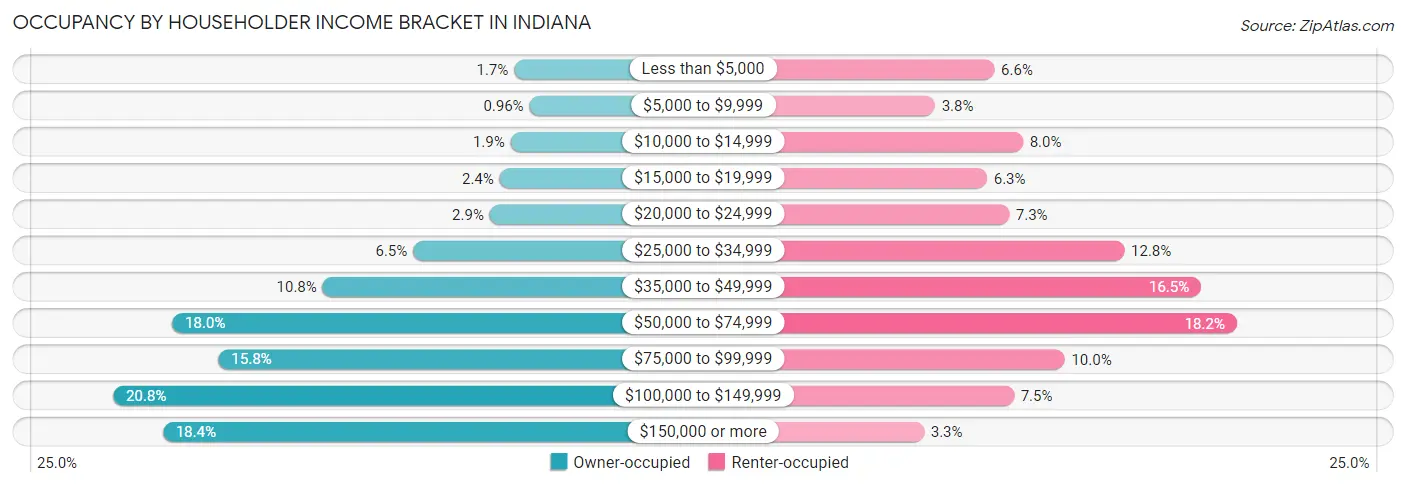
| Income Bracket | Owner-occupied | Renter-occupied |
| Less than $5,000 | 31,381 (1.7%) | 52,338 (6.6%) |
| $5,000 to $9,999 | 17,869 (1.0%) | 29,915 (3.8%) |
| $10,000 to $14,999 | 34,520 (1.9%) | 63,157 (8.0%) |
| $15,000 to $19,999 | 44,194 (2.4%) | 49,540 (6.2%) |
| $20,000 to $24,999 | 53,109 (2.9%) | 57,852 (7.3%) |
| $25,000 to $34,999 | 120,984 (6.5%) | 101,458 (12.8%) |
| $35,000 to $49,999 | 201,099 (10.8%) | 130,448 (16.5%) |
| $50,000 to $74,999 | 334,599 (18.0%) | 143,973 (18.1%) |
| $75,000 to $99,999 | 293,360 (15.8%) | 78,903 (10.0%) |
| $100,000 to $149,999 | 386,726 (20.8%) | 59,684 (7.5%) |
| $150,000 or more | 342,725 (18.4%) | 25,762 (3.3%) |
| Total | 1,860,566 (100.0%) | 793,030 (100.0%) |
Monthly Housing Cost Tiers in Indiana
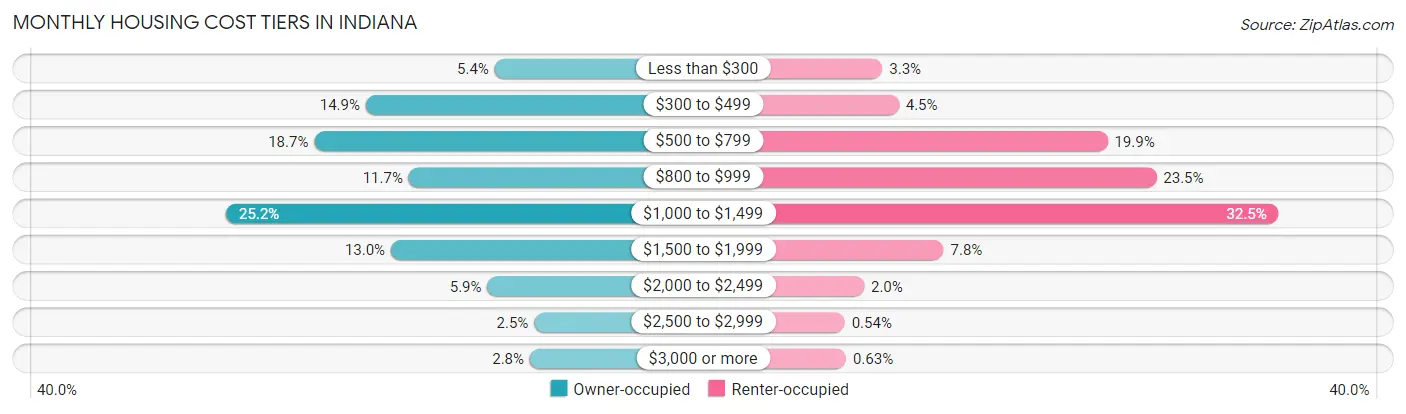
| Monthly Cost | Owner-occupied | Renter-occupied |
| Less than $300 | 100,085 (5.4%) | 26,285 (3.3%) |
| $300 to $499 | 276,609 (14.9%) | 35,810 (4.5%) |
| $500 to $799 | 347,456 (18.7%) | 157,734 (19.9%) |
| $800 to $999 | 217,816 (11.7%) | 186,281 (23.5%) |
| $1,000 to $1,499 | 468,336 (25.2%) | 257,695 (32.5%) |
| $1,500 to $1,999 | 242,187 (13.0%) | 62,023 (7.8%) |
| $2,000 to $2,499 | 110,181 (5.9%) | 15,507 (2.0%) |
| $2,500 to $2,999 | 46,023 (2.5%) | 4,286 (0.5%) |
| $3,000 or more | 51,873 (2.8%) | 5,002 (0.6%) |
| Total | 1,860,566 (100.0%) | 793,030 (100.0%) |
Physical Housing Characteristics in Indiana
Housing Structures in Indiana
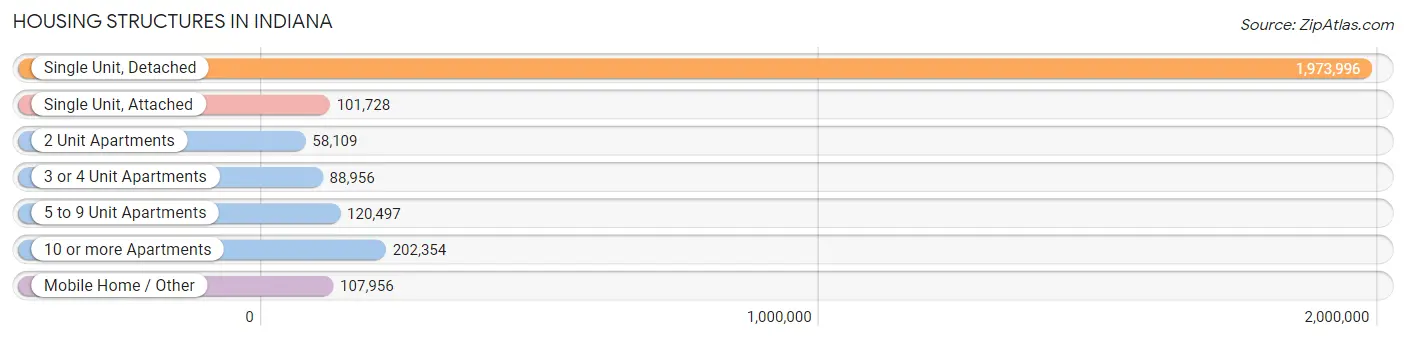
| Structure Type | # Housing Units | % Housing Units |
| Single Unit, Detached | 1,973,996 | 74.4% |
| Single Unit, Attached | 101,728 | 3.8% |
| 2 Unit Apartments | 58,109 | 2.2% |
| 3 or 4 Unit Apartments | 88,956 | 3.4% |
| 5 to 9 Unit Apartments | 120,497 | 4.5% |
| 10 or more Apartments | 202,354 | 7.6% |
| Mobile Home / Other | 107,956 | 4.1% |
| Total | 2,653,596 | 100.0% |
Housing Structures by Occupancy in Indiana
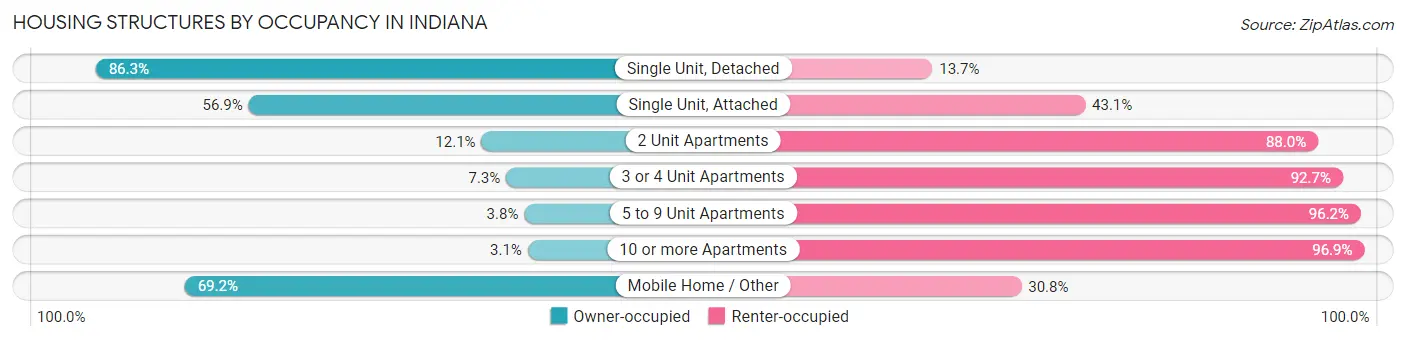
| Structure Type | Owner-occupied | Renter-occupied |
| Single Unit, Detached | 1,703,627 (86.3%) | 270,369 (13.7%) |
| Single Unit, Attached | 57,866 (56.9%) | 43,862 (43.1%) |
| 2 Unit Apartments | 7,004 (12.0%) | 51,105 (87.9%) |
| 3 or 4 Unit Apartments | 6,484 (7.3%) | 82,472 (92.7%) |
| 5 to 9 Unit Apartments | 4,576 (3.8%) | 115,921 (96.2%) |
| 10 or more Apartments | 6,332 (3.1%) | 196,022 (96.9%) |
| Mobile Home / Other | 74,677 (69.2%) | 33,279 (30.8%) |
| Total | 1,860,566 (70.1%) | 793,030 (29.9%) |
Housing Structures by Number of Rooms in Indiana
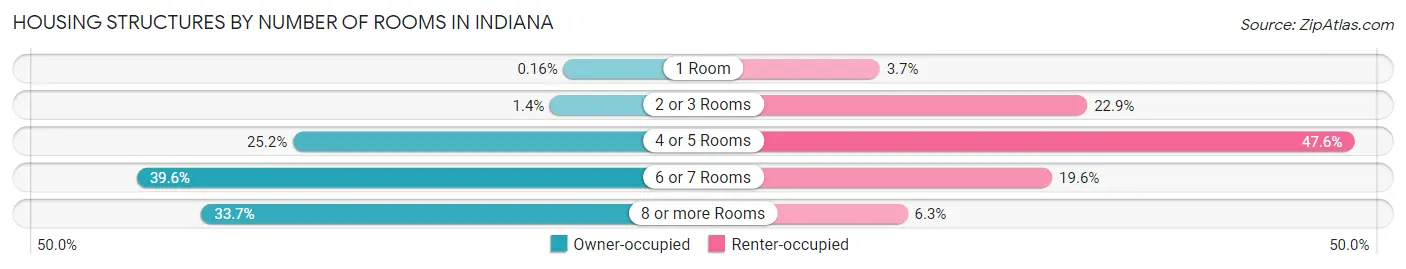
| Number of Rooms | Owner-occupied | Renter-occupied |
| 1 Room | 2,896 (0.2%) | 29,222 (3.7%) |
| 2 or 3 Rooms | 25,780 (1.4%) | 181,391 (22.9%) |
| 4 or 5 Rooms | 468,422 (25.2%) | 377,121 (47.5%) |
| 6 or 7 Rooms | 737,306 (39.6%) | 155,669 (19.6%) |
| 8 or more Rooms | 626,162 (33.7%) | 49,627 (6.3%) |
| Total | 1,860,566 (100.0%) | 793,030 (100.0%) |
Housing Structure by Heating Type in Indiana
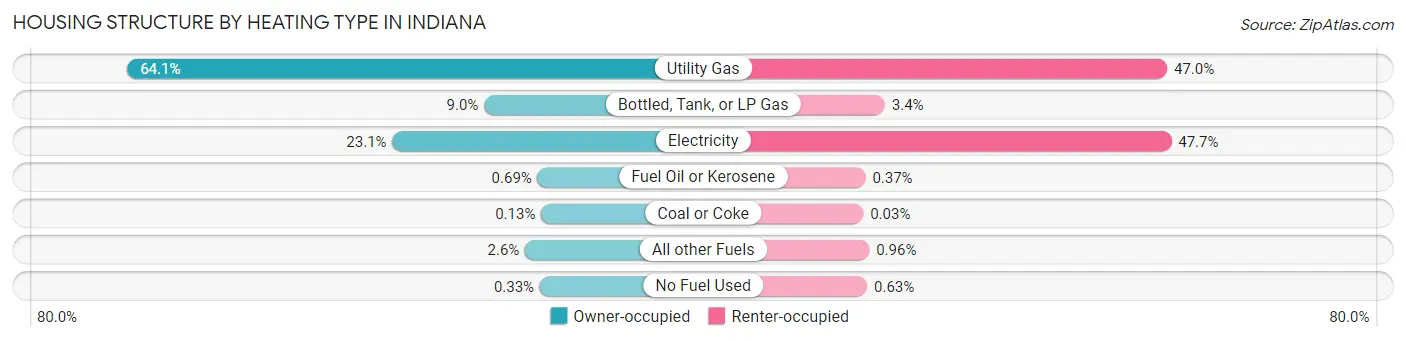
| Heating Type | Owner-occupied | Renter-occupied |
| Utility Gas | 1,193,234 (64.1%) | 372,660 (47.0%) |
| Bottled, Tank, or LP Gas | 166,454 (8.9%) | 26,759 (3.4%) |
| Electricity | 430,585 (23.1%) | 377,854 (47.6%) |
| Fuel Oil or Kerosene | 12,841 (0.7%) | 2,901 (0.4%) |
| Coal or Coke | 2,468 (0.1%) | 256 (0.0%) |
| All other Fuels | 48,763 (2.6%) | 7,637 (1.0%) |
| No Fuel Used | 6,221 (0.3%) | 4,963 (0.6%) |
| Total | 1,860,566 (100.0%) | 793,030 (100.0%) |
Household Vehicle Usage in Indiana
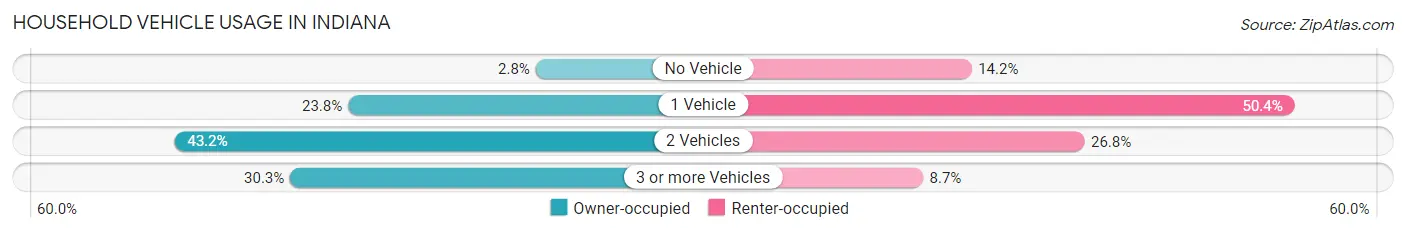
| Vehicles per Household | Owner-occupied | Renter-occupied |
| No Vehicle | 51,077 (2.8%) | 112,253 (14.1%) |
| 1 Vehicle | 442,180 (23.8%) | 399,331 (50.4%) |
| 2 Vehicles | 804,302 (43.2%) | 212,456 (26.8%) |
| 3 or more Vehicles | 563,007 (30.3%) | 68,990 (8.7%) |
| Total | 1,860,566 (100.0%) | 793,030 (100.0%) |
Real Estate & Mortgages in Indiana
Real Estate and Mortgage Overview in Indiana
| Characteristic | Without Mortgage | With Mortgage |
| Housing Units | 657,670 | 1,202,896 |
| Median Property Value | $161,700 | $194,800 |
| Median Household Income | $61,593 | $261,678 |
| Monthly Housing Costs | $477 | $50,588 |
| Real Estate Taxes | $1,274 | $30,029 |
Property Value by Mortgage Status in Indiana
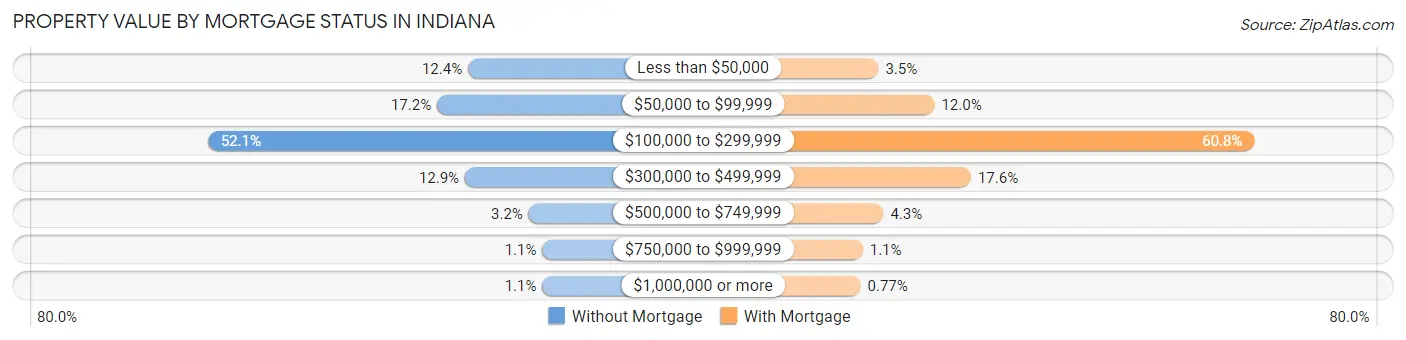
| Property Value | Without Mortgage | With Mortgage |
| Less than $50,000 | 81,839 (12.4%) | 42,007 (3.5%) |
| $50,000 to $99,999 | 112,853 (17.2%) | 144,698 (12.0%) |
| $100,000 to $299,999 | 342,555 (52.1%) | 730,820 (60.8%) |
| $300,000 to $499,999 | 84,841 (12.9%) | 211,642 (17.6%) |
| $500,000 to $749,999 | 21,012 (3.2%) | 51,248 (4.3%) |
| $750,000 to $999,999 | 7,296 (1.1%) | 13,264 (1.1%) |
| $1,000,000 or more | 7,274 (1.1%) | 9,217 (0.8%) |
| Total | 657,670 (100.0%) | 1,202,896 (100.0%) |
Household Income by Mortgage Status in Indiana
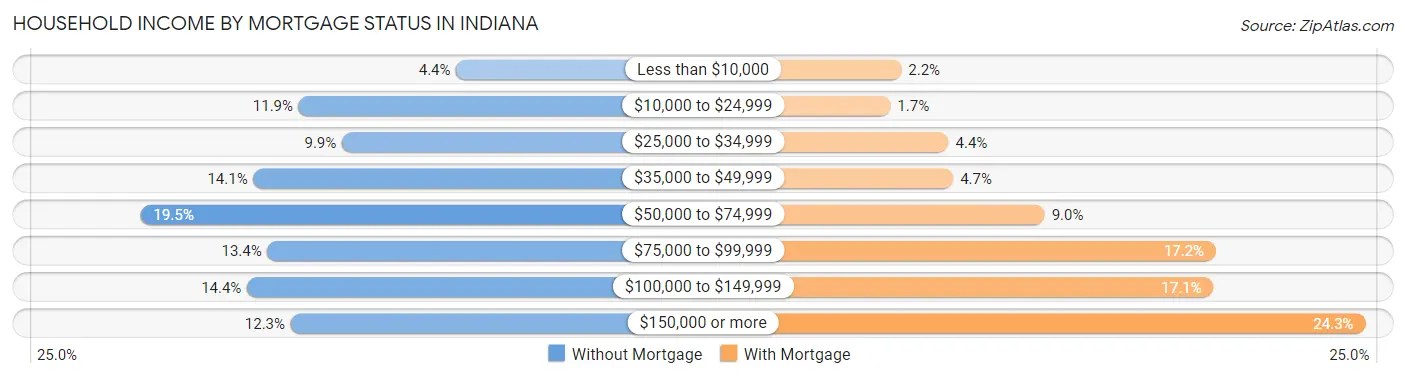
| Household Income | Without Mortgage | With Mortgage |
| Less than $10,000 | 29,232 (4.4%) | 26,250 (2.2%) |
| $10,000 to $24,999 | 78,521 (11.9%) | 20,018 (1.7%) |
| $25,000 to $34,999 | 64,998 (9.9%) | 53,302 (4.4%) |
| $35,000 to $49,999 | 92,736 (14.1%) | 55,986 (4.6%) |
| $50,000 to $74,999 | 128,128 (19.5%) | 108,363 (9.0%) |
| $75,000 to $99,999 | 88,321 (13.4%) | 206,471 (17.2%) |
| $100,000 to $149,999 | 94,687 (14.4%) | 205,039 (17.1%) |
| $150,000 or more | 81,047 (12.3%) | 292,039 (24.3%) |
| Total | 657,670 (100.0%) | 1,202,896 (100.0%) |
Property Value to Household Income Ratio in Indiana
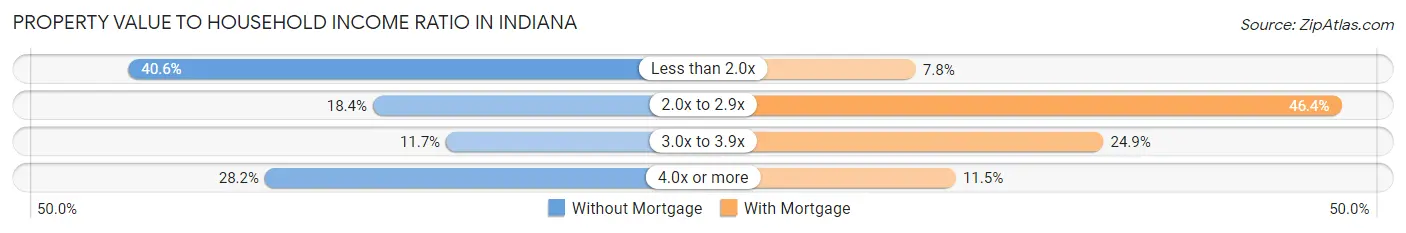
| Value-to-Income Ratio | Without Mortgage | With Mortgage |
| Less than 2.0x | 266,824 (40.6%) | 93,904 (7.8%) |
| 2.0x to 2.9x | 120,870 (18.4%) | 558,525 (46.4%) |
| 3.0x to 3.9x | 77,198 (11.7%) | 298,963 (24.8%) |
| 4.0x or more | 185,415 (28.2%) | 137,679 (11.5%) |
| Total | 657,670 (100.0%) | 1,202,896 (100.0%) |
Real Estate Taxes by Mortgage Status in Indiana
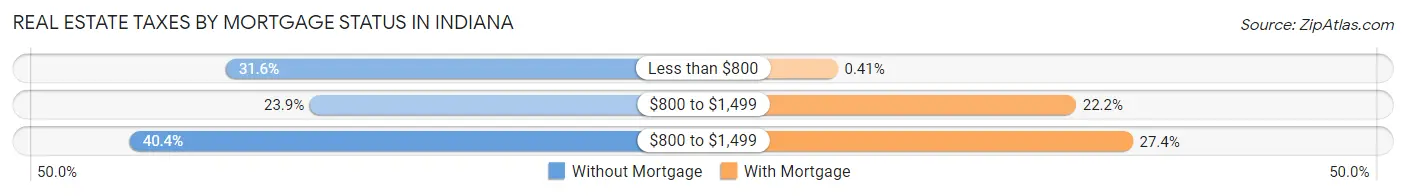
| Property Taxes | Without Mortgage | With Mortgage |
| Less than $800 | 207,923 (31.6%) | 4,935 (0.4%) |
| $800 to $1,499 | 157,358 (23.9%) | 266,739 (22.2%) |
| $800 to $1,499 | 265,654 (40.4%) | 329,007 (27.4%) |
| Total | 657,670 (100.0%) | 1,202,896 (100.0%) |
Health & Disability in Indiana
Health Insurance Coverage by Age in Indiana
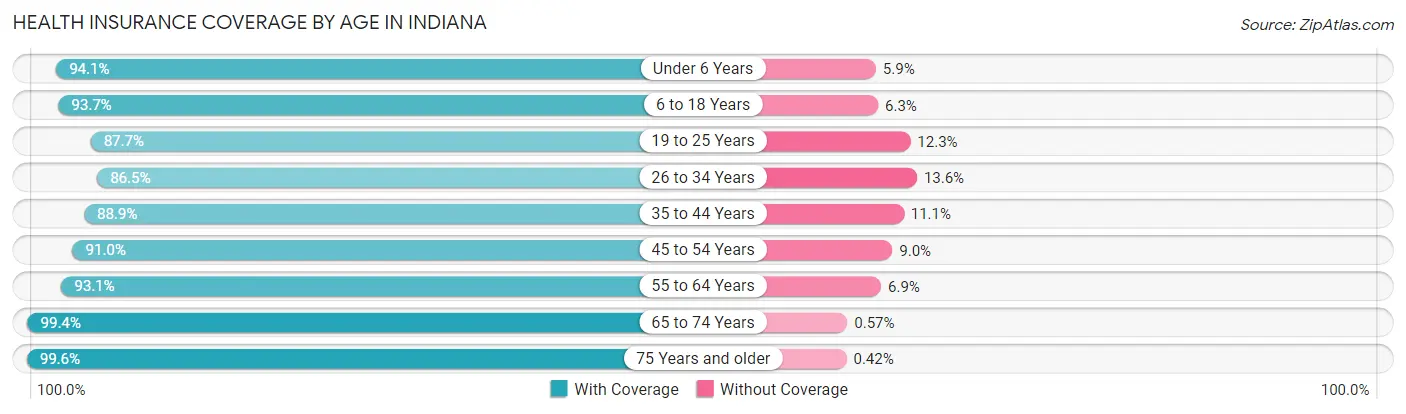
| Age Bracket | With Coverage | Without Coverage |
| Under 6 Years | 465,347 (94.1%) | 29,197 (5.9%) |
| 6 to 18 Years | 1,107,958 (93.7%) | 74,558 (6.3%) |
| 19 to 25 Years | 573,997 (87.7%) | 80,757 (12.3%) |
| 26 to 34 Years | 675,635 (86.5%) | 105,884 (13.6%) |
| 35 to 44 Years | 739,852 (88.9%) | 92,322 (11.1%) |
| 45 to 54 Years | 745,695 (91.0%) | 73,434 (9.0%) |
| 55 to 64 Years | 806,990 (93.1%) | 59,398 (6.9%) |
| 65 to 74 Years | 638,027 (99.4%) | 3,630 (0.6%) |
| 75 Years and older | 413,591 (99.6%) | 1,724 (0.4%) |
| Total | 6,167,092 (92.2%) | 520,904 (7.8%) |
Health Insurance Coverage by Citizenship Status in Indiana
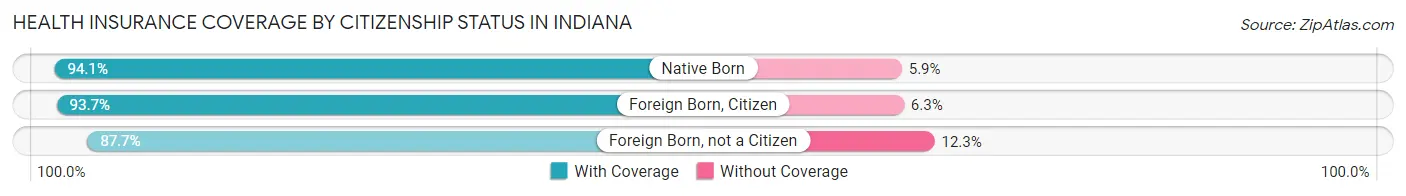
| Citizenship Status | With Coverage | Without Coverage |
| Native Born | 465,347 (94.1%) | 29,197 (5.9%) |
| Foreign Born, Citizen | 1,107,958 (93.7%) | 74,558 (6.3%) |
| Foreign Born, not a Citizen | 573,997 (87.7%) | 80,757 (12.3%) |
Health Insurance Coverage by Household Income in Indiana
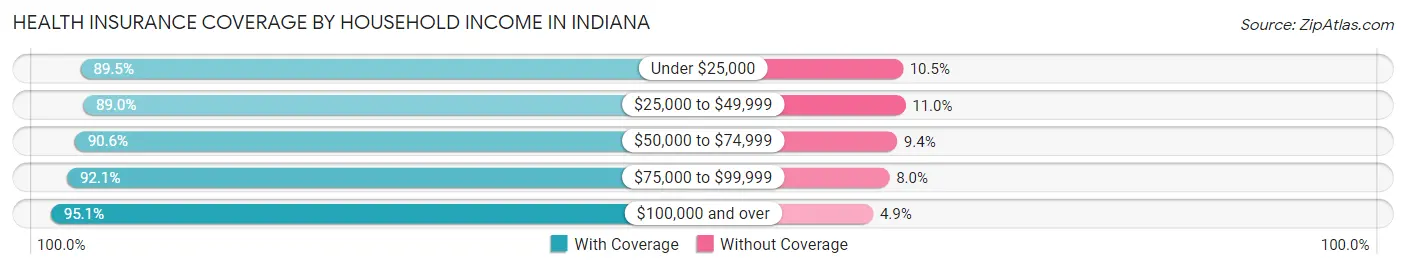
| Household Income | With Coverage | Without Coverage |
| Under $25,000 | 664,476 (89.5%) | 77,758 (10.5%) |
| $25,000 to $49,999 | 996,853 (89.0%) | 122,765 (11.0%) |
| $50,000 to $74,999 | 1,041,192 (90.6%) | 107,918 (9.4%) |
| $75,000 to $99,999 | 948,343 (92.0%) | 81,885 (8.0%) |
| $100,000 and over | 2,433,816 (95.1%) | 125,712 (4.9%) |
Public vs Private Health Insurance Coverage by Age in Indiana
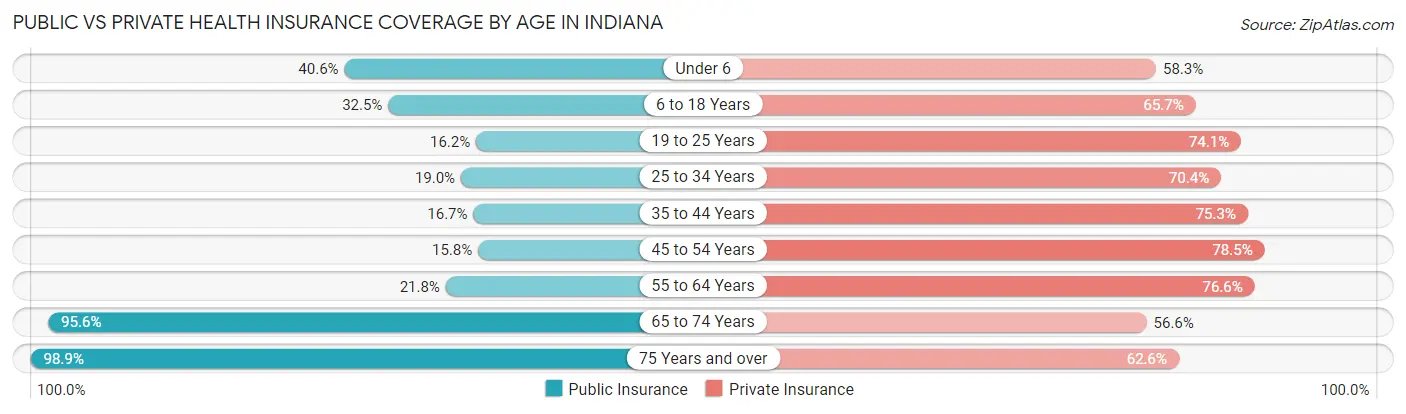
| Age Bracket | Public Insurance | Private Insurance |
| Under 6 | 200,971 (40.6%) | 288,470 (58.3%) |
| 6 to 18 Years | 384,458 (32.5%) | 776,385 (65.7%) |
| 19 to 25 Years | 106,154 (16.2%) | 485,206 (74.1%) |
| 25 to 34 Years | 148,540 (19.0%) | 550,077 (70.4%) |
| 35 to 44 Years | 138,957 (16.7%) | 626,963 (75.3%) |
| 45 to 54 Years | 129,686 (15.8%) | 642,606 (78.4%) |
| 55 to 64 Years | 189,231 (21.8%) | 663,824 (76.6%) |
| 65 to 74 Years | 613,640 (95.6%) | 363,077 (56.6%) |
| 75 Years and over | 410,733 (98.9%) | 259,786 (62.5%) |
| Total | 2,322,370 (34.7%) | 4,656,394 (69.6%) |
Disability Status by Sex by Age in Indiana
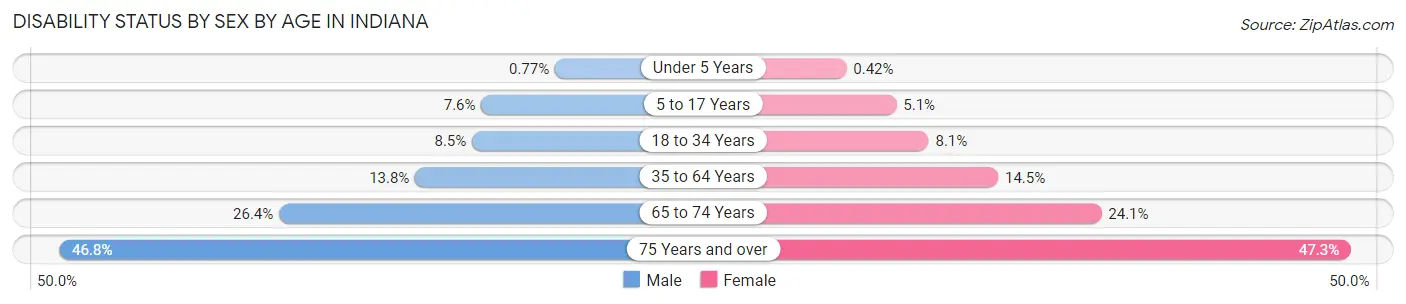
| Age Bracket | Male | Female |
| Under 5 Years | 1,620 (0.8%) | 846 (0.4%) |
| 5 to 17 Years | 45,461 (7.6%) | 28,808 (5.1%) |
| 18 to 34 Years | 65,744 (8.5%) | 61,321 (8.1%) |
| 35 to 64 Years | 171,810 (13.8%) | 183,937 (14.5%) |
| 65 to 74 Years | 80,181 (26.4%) | 81,350 (24.1%) |
| 75 Years and over | 79,507 (46.8%) | 115,980 (47.3%) |
Disability Class by Sex by Age in Indiana
Disability Class: Hearing Difficulty
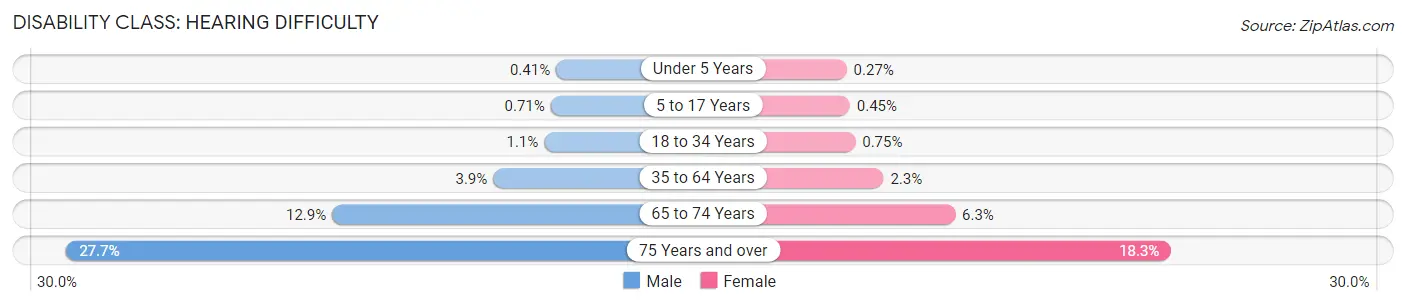
| Age Bracket | Male | Female |
| Under 5 Years | 858 (0.4%) | 539 (0.3%) |
| 5 to 17 Years | 4,225 (0.7%) | 2,576 (0.4%) |
| 18 to 34 Years | 8,271 (1.1%) | 5,697 (0.7%) |
| 35 to 64 Years | 48,837 (3.9%) | 29,451 (2.3%) |
| 65 to 74 Years | 39,136 (12.9%) | 21,329 (6.3%) |
| 75 Years and over | 47,024 (27.7%) | 45,018 (18.3%) |
Disability Class: Vision Difficulty
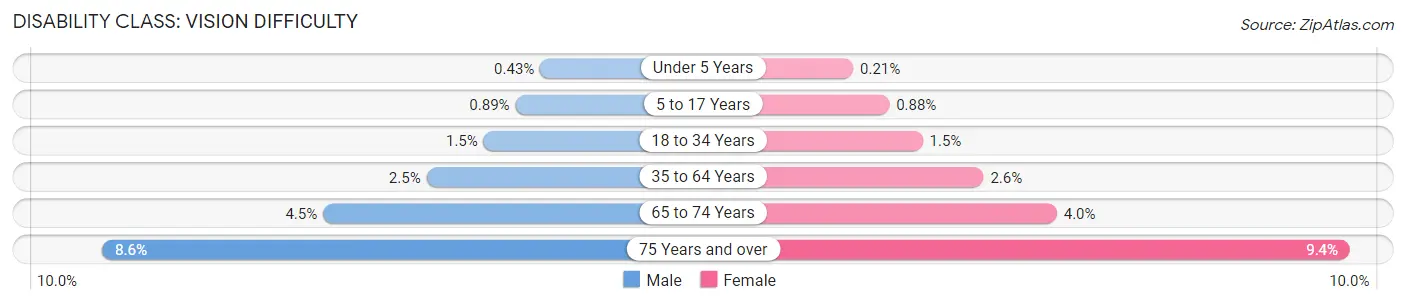
| Age Bracket | Male | Female |
| Under 5 Years | 904 (0.4%) | 425 (0.2%) |
| 5 to 17 Years | 5,293 (0.9%) | 5,030 (0.9%) |
| 18 to 34 Years | 11,465 (1.5%) | 11,398 (1.5%) |
| 35 to 64 Years | 31,723 (2.5%) | 33,312 (2.6%) |
| 65 to 74 Years | 13,559 (4.5%) | 13,487 (4.0%) |
| 75 Years and over | 14,541 (8.6%) | 23,143 (9.4%) |
Disability Class: Cognitive Difficulty
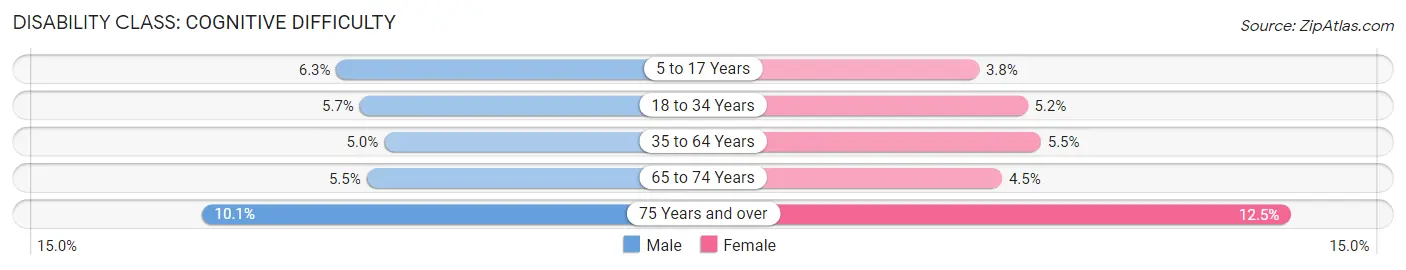
| Age Bracket | Male | Female |
| 5 to 17 Years | 37,713 (6.3%) | 21,725 (3.8%) |
| 18 to 34 Years | 43,985 (5.7%) | 39,386 (5.2%) |
| 35 to 64 Years | 62,289 (5.0%) | 70,285 (5.5%) |
| 65 to 74 Years | 16,644 (5.5%) | 15,071 (4.5%) |
| 75 Years and over | 17,109 (10.1%) | 30,693 (12.5%) |
Disability Class: Ambulatory Difficulty
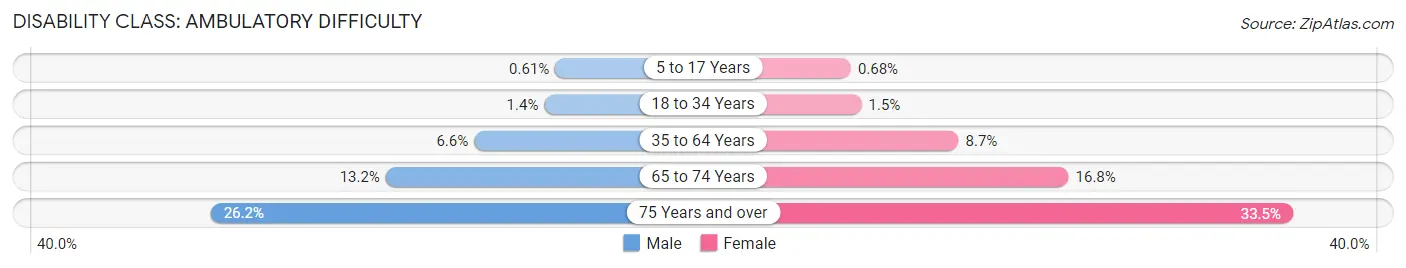
| Age Bracket | Male | Female |
| 5 to 17 Years | 3,670 (0.6%) | 3,842 (0.7%) |
| 18 to 34 Years | 10,987 (1.4%) | 11,168 (1.5%) |
| 35 to 64 Years | 82,776 (6.6%) | 109,950 (8.7%) |
| 65 to 74 Years | 40,086 (13.2%) | 56,891 (16.8%) |
| 75 Years and over | 44,477 (26.2%) | 82,176 (33.5%) |
Disability Class: Self-Care Difficulty
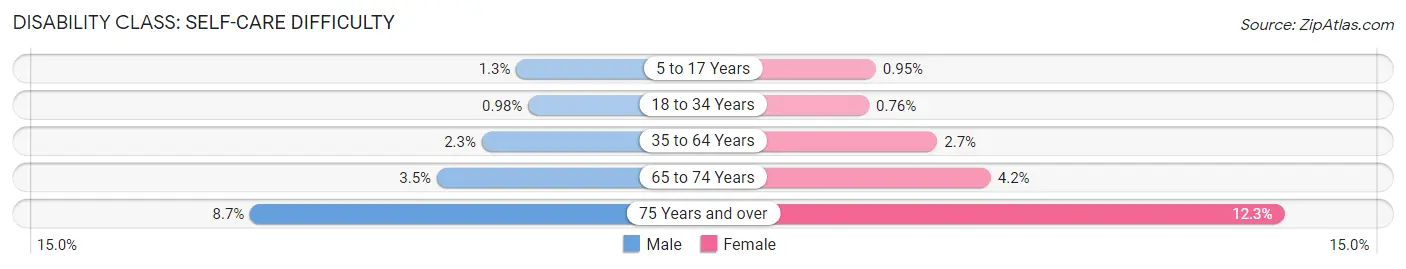
| Age Bracket | Male | Female |
| 5 to 17 Years | 7,825 (1.3%) | 5,386 (0.9%) |
| 18 to 34 Years | 7,628 (1.0%) | 5,810 (0.8%) |
| 35 to 64 Years | 28,309 (2.3%) | 33,734 (2.7%) |
| 65 to 74 Years | 10,703 (3.5%) | 14,033 (4.2%) |
| 75 Years and over | 14,807 (8.7%) | 30,237 (12.3%) |
Technology Access in Indiana
Computing Device Access in Indiana
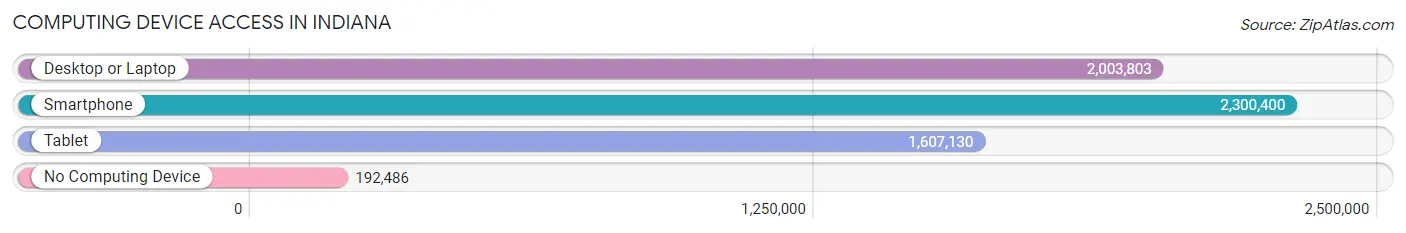
| Device Type | # Households | % Households |
| Desktop or Laptop | 2,003,803 | 75.5% |
| Smartphone | 2,300,400 | 86.7% |
| Tablet | 1,607,130 | 60.6% |
| No Computing Device | 192,486 | 7.2% |
| Total | 2,653,596 | 100.0% |
Internet Access in Indiana
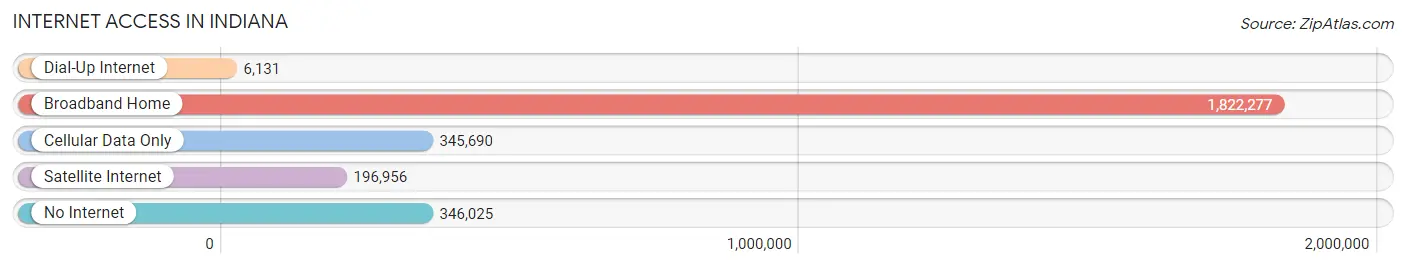
| Internet Type | # Households | % Households |
| Dial-Up Internet | 6,131 | 0.2% |
| Broadband Home | 1,822,277 | 68.7% |
| Cellular Data Only | 345,690 | 13.0% |
| Satellite Internet | 196,956 | 7.4% |
| No Internet | 346,025 | 13.0% |
| Total | 2,653,596 | 100.0% |
Indiana Summary
Indiana is a state located in the Midwestern United States. It is bordered by Michigan to the north, Ohio to the east, Kentucky to the south, and Illinois to the west. Indiana is the 38th largest state in the United States, with an area of 36,418 square miles (94,320 km2). Its population was 6,080,485 in 2019, making it the 16th most populous state in the country.
Geography
Indiana is located in the Midwest region of the United States. It is bordered by Michigan to the north, Ohio to the east, Kentucky to the south, and Illinois to the west. The state has a total area of 36,418 square miles (94,320 km2), making it the 38th largest state in the country. Indiana is divided into 92 counties and has a generally flat terrain. The highest point in the state is Hoosier Hill, at 1,257 feet (383 m) above sea level. The state is home to several large rivers, including the Wabash, White, and Ohio rivers.
Climate
Indiana has a humid continental climate, with cold winters and hot, humid summers. The average temperature in the state ranges from a low of 20°F (-7°C) in January to a high of 85°F (29°C) in July. The average annual precipitation in the state is 40 inches (1,016 mm).
Economy
Indiana has a diverse economy, with a mix of manufacturing, agriculture, and services. The state is home to several large companies, including Eli Lilly and Company, Cummins, and Steel Dynamics. The state's largest industries are manufacturing, agriculture, and health care. Indiana is also home to several universities and colleges, including Indiana University, Purdue University, and the University of Notre Dame.
Demographics
As of 2019, the population of Indiana was 6,080,485, making it the 16th most populous state in the country. The state has a population density of 166 people per square mile (64 people per km2). The largest racial group in the state is white, making up 81.2% of the population. The other major racial groups in the state are African American (9.4%), Hispanic or Latino (7.2%), and Asian (2.2%). The median household income in the state is $54,181, and the median age is 38.7 years.
Religion
The largest religious group in Indiana is Christianity, with 78.2% of the population identifying as Christian. The other major religious groups in the state are non-Christian religions (7.2%), unaffiliated (7.1%), and other religions (7.5%).
Education
Indiana has a strong education system, with a high school graduation rate of 87.2%. The state is home to several universities and colleges, including Indiana University, Purdue University, and the University of Notre Dame. The state also has several community colleges and technical schools.
Conclusion
Indiana is a state located in the Midwestern United States. It is bordered by Michigan to the north, Ohio to the east, Kentucky to the south, and Illinois to the west. Indiana has a diverse economy, with a mix of manufacturing, agriculture, and services. The state has a population of 6,080,485, with the largest racial group being white. The state has a strong education system, with a high school graduation rate of 87.2%. Indiana is home to several universities and colleges, including Indiana University, Purdue University, and the University of Notre Dame.
Common Questions
When was Indiana Incorporated?
Indiana was Incorporated into the Union on Dec 11, 1816.
What is the Total Area of Indiana?
Total Area of Indiana is 36,417 Square Miles.
What is the Total Land Area of Indiana?
Total Land Area of Indiana is 35,823 Square Miles.
What is the Total Water Area of Indiana?
Total Water Area of Indiana is 594 Square Miles.
What is the Average Elevation in Indiana?
Average Elevation in Indiana is 700 Feet.
What is the Highest Elevation in Indiana?
Highest Elevation in Indiana is 1,257 Feet.
What is the Lowest Elevation in Indiana?
Lowest Elevation in Indiana is 320 Feet.
What is the Population Density in Indiana?
Population Density in Indiana is 189.4 People per Square Mile.
What is Per Capita Income in Indiana?
Per Capita income in Indiana is $35,578.
What is the Median Family Income in Indiana?
Median Family Income in Indiana is $84,657.
What is the Median Household income in Indiana?
Median Household Income in Indiana is $67,173.
What is Income or Wage Gap in Indiana?
Income or Wage Gap in Indiana is 30.9%.
Women in Indiana earn 69.1 cents for every dollar earned by a man.
What is Family Income Deficit in Indiana?
Family Income Deficit in Indiana is $11,207.
Families that are below poverty line in Indiana earn $11,207 less on average than the poverty threshold level.
What is Inequality or Gini Index in Indiana?
Inequality or Gini Index in Indiana is 0.45.
What is the Total Population of Indiana?
Total Population of Indiana is 6,784,403.
What is the Total Male Population of Indiana?
Total Male Population of Indiana is 3,366,798.
What is the Total Female Population of Indiana?
Total Female Population of Indiana is 3,417,605.
What is the Ratio of Males per 100 Females in Indiana?
There are 98.51 Males per 100 Females in Indiana.
What is the Ratio of Females per 100 Males in Indiana?
There are 101.51 Females per 100 Males in Indiana.
What is the Median Population Age in Indiana?
Median Population Age in Indiana is 38.0 Years.
What is the Average Family Size in Indiana
Average Family Size in Indiana is 3.1 People.
What is the Average Household Size in Indiana
Average Household Size in Indiana is 2.5 People.
How Large is the Labor Force in Indiana?
There are 3,444,785 People in the Labor Forcein in Indiana.
What is the Percentage of People in the Labor Force in Indiana?
63.9% of People are in the Labor Force in Indiana.
What is the Unemployment Rate in Indiana?
Unemployment Rate in Indiana is 4.5%.