Cities with the Lowest Poverty Level Among Children Under the Age of 16 in the United States
RELATED REPORTS & OPTIONS
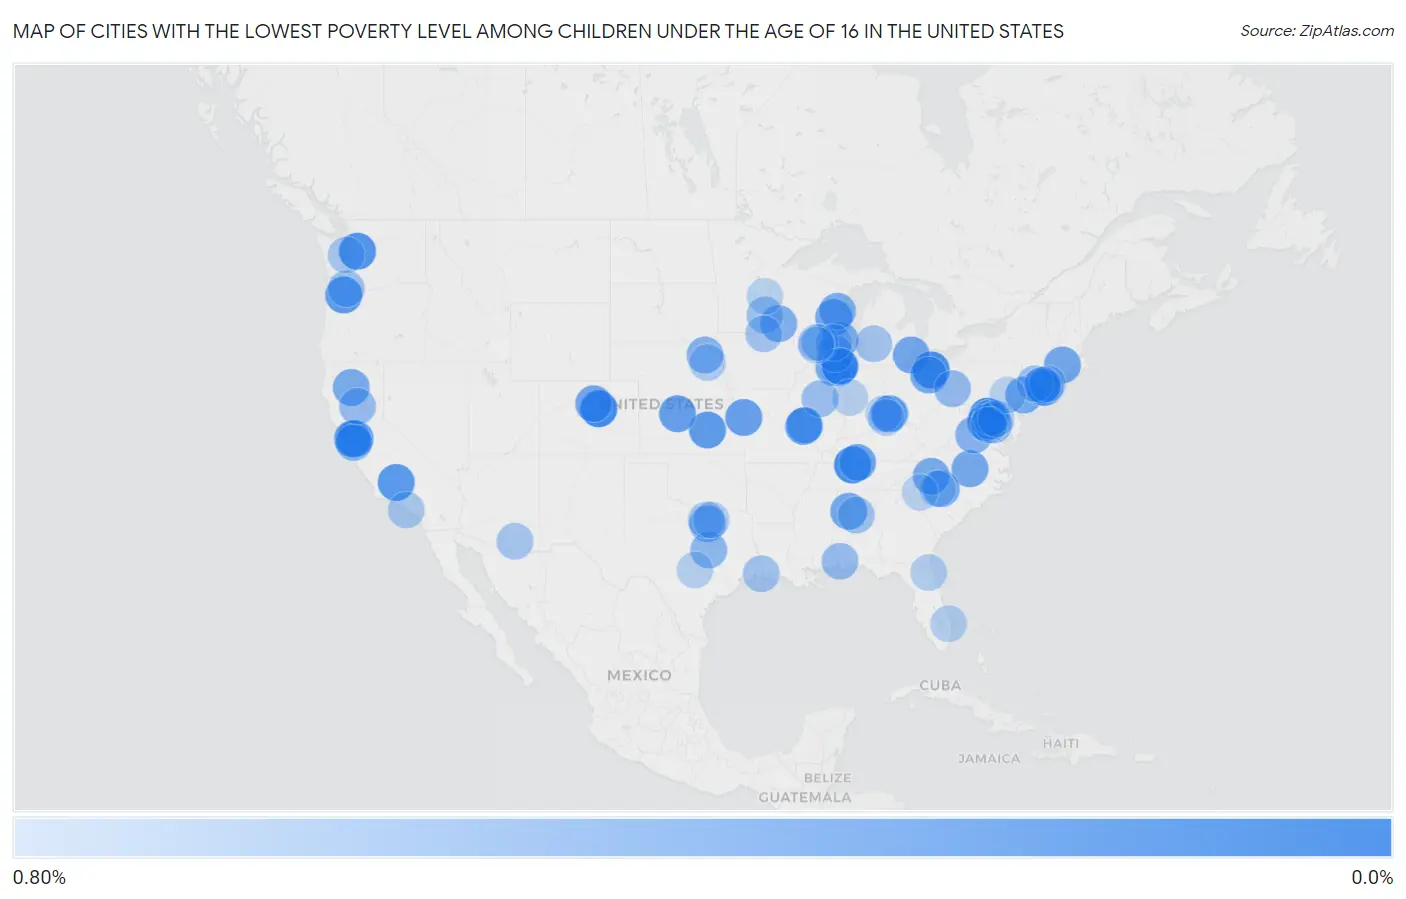
Lowest Poverty | Child 0-16
United States
Compare Cities
Map of Cities with the Lowest Poverty Level Among Children Under the Age of 16 in the United States
0.80%
0.0%
Cities with the Lowest Poverty Level Among Children Under the Age of 16 in the United States
| City | Child Poverty | vs State | vs National | |
| 1. | Belmont | 0.039% | 12.9%(-12.9)#1 | 16.9%(-16.9)#1 |
| 2. | Lone Tree | 0.091% | 11.4%(-11.3)#1 | 16.9%(-16.8)#2 |
| 3. | Pleasant View | 0.11% | 19.7%(-19.6)#1 | 16.9%(-16.8)#3 |
| 4. | Highland Heights | 0.12% | 18.8%(-18.6)#1 | 16.9%(-16.8)#4 |
| 5. | Sunset Hills | 0.13% | 16.9%(-16.8)#1 | 16.9%(-16.8)#5 |
| 6. | Snoqualmie | 0.16% | 12.1%(-12.0)#1 | 16.9%(-16.8)#6 |
| 7. | Alamo | 0.16% | 15.7%(-15.5)#1 | 16.9%(-16.8)#7 |
| 8. | Greenacres | 0.19% | 15.7%(-15.5)#2 | 16.9%(-16.8)#8 |
| 9. | King City | 0.20% | 13.6%(-13.4)#1 | 16.9%(-16.7)#9 |
| 10. | Hillsboro | 0.21% | 14.1%(-13.9)#1 | 16.9%(-16.7)#10 |
| 11. | North Valley Stream | 0.22% | 18.3%(-18.1)#1 | 16.9%(-16.7)#11 |
| 12. | Roslyn | 0.22% | 16.5%(-16.3)#1 | 16.9%(-16.7)#12 |
| 13. | Lemont | 0.22% | 15.9%(-15.7)#1 | 16.9%(-16.7)#13 |
| 14. | Orinda | 0.23% | 15.7%(-15.4)#3 | 16.9%(-16.7)#14 |
| 15. | Mission Hills | 0.24% | 14.1%(-13.9)#2 | 16.9%(-16.7)#15 |
| 16. | Plainville | 0.25% | 14.1%(-13.9)#3 | 16.9%(-16.7)#16 |
| 17. | Linton Hall | 0.25% | 12.9%(-12.7)#2 | 16.9%(-16.7)#17 |
| 18. | Cross Plains | 0.28% | 19.7%(-19.4)#2 | 16.9%(-16.7)#18 |
| 19. | Grosse Pointe | 0.29% | 18.2%(-18.0)#1 | 16.9%(-16.6)#19 |
| 20. | Storrs | 0.29% | 13.6%(-13.3)#1 | 16.9%(-16.6)#20 |
| 21. | Little Chute | 0.30% | 13.6%(-13.3)#1 | 16.9%(-16.6)#21 |
| 22. | Fairmount | 0.30% | 11.4%(-11.1)#2 | 16.9%(-16.6)#22 |
| 23. | Parrish | 0.30% | 22.5%(-22.2)#1 | 16.9%(-16.6)#23 |
| 24. | Brecksville | 0.31% | 18.8%(-18.4)#2 | 16.9%(-16.6)#24 |
| 25. | Stem | 0.31% | 18.9%(-18.6)#1 | 16.9%(-16.6)#25 |
| 26. | Newtown Grant | 0.31% | 16.5%(-16.2)#2 | 16.9%(-16.6)#26 |
| 27. | Weddington | 0.32% | 18.9%(-18.6)#2 | 16.9%(-16.6)#27 |
| 28. | Rhodhiss | 0.32% | 18.9%(-18.6)#3 | 16.9%(-16.6)#28 |
| 29. | Bella Vista | 0.33% | 15.7%(-15.3)#4 | 16.9%(-16.6)#29 |
| 30. | Montgomery | 0.33% | 18.8%(-18.4)#3 | 16.9%(-16.6)#30 |
| 31. | Fox Point | 0.33% | 13.6%(-13.2)#2 | 16.9%(-16.6)#31 |
| 32. | Oswego | 0.34% | 15.9%(-15.6)#2 | 16.9%(-16.6)#32 |
| 33. | Brambleton | 0.35% | 12.9%(-12.6)#3 | 16.9%(-16.6)#33 |
| 34. | Hinsdale | 0.35% | 15.9%(-15.6)#3 | 16.9%(-16.6)#34 |
| 35. | Suamico | 0.36% | 13.6%(-13.2)#3 | 16.9%(-16.6)#35 |
| 36. | Eyota | 0.36% | 11.1%(-10.7)#1 | 16.9%(-16.6)#36 |
| 37. | Pantops | 0.37% | 12.9%(-12.6)#4 | 16.9%(-16.6)#37 |
| 38. | Falls Church | 0.37% | 12.9%(-12.6)#5 | 16.9%(-16.6)#38 |
| 39. | Trophy Club | 0.38% | 19.7%(-19.3)#1 | 16.9%(-16.6)#39 |
| 40. | Randolph | 0.38% | 12.2%(-11.8)#1 | 16.9%(-16.6)#40 |
| 41. | Glen Rock Borough | 0.40% | 13.5%(-13.1)#1 | 16.9%(-16.5)#41 |
| 42. | Rockville Centre | 0.41% | 18.3%(-17.9)#2 | 16.9%(-16.5)#42 |
| 43. | Woodsdale | 0.42% | 18.8%(-18.3)#4 | 16.9%(-16.5)#43 |
| 44. | Robinson | 0.42% | 19.7%(-19.3)#2 | 16.9%(-16.5)#44 |
| 45. | New Baltimore | 0.43% | 12.9%(-12.5)#6 | 16.9%(-16.5)#45 |
| 46. | Somerville Borough | 0.43% | 13.5%(-13.1)#2 | 16.9%(-16.5)#46 |
| 47. | East Massapequa | 0.43% | 18.3%(-17.9)#3 | 16.9%(-16.5)#47 |
| 48. | Allison Park | 0.44% | 16.5%(-16.0)#3 | 16.9%(-16.5)#48 |
| 49. | Spring Grove | 0.44% | 15.9%(-15.5)#4 | 16.9%(-16.5)#49 |
| 50. | Topton Borough | 0.44% | 16.5%(-16.0)#4 | 16.9%(-16.5)#50 |
| 51. | Fairview | 0.44% | 15.7%(-15.2)#5 | 16.9%(-16.5)#51 |
| 52. | Durham | 0.45% | 15.7%(-15.2)#6 | 16.9%(-16.5)#52 |
| 53. | Bryans Road | 0.46% | 12.0%(-11.5)#1 | 16.9%(-16.5)#53 |
| 54. | Spanish Fort | 0.46% | 22.5%(-22.0)#2 | 16.9%(-16.5)#54 |
| 55. | Mount Pulaski | 0.47% | 15.9%(-15.4)#5 | 16.9%(-16.5)#55 |
| 56. | Mcfarland | 0.48% | 13.6%(-13.1)#4 | 16.9%(-16.5)#56 |
| 57. | Mountain Brook | 0.48% | 22.5%(-22.0)#3 | 16.9%(-16.5)#57 |
| 58. | Barberton | 0.49% | 12.1%(-11.6)#2 | 16.9%(-16.5)#58 |
| 59. | Dundas | 0.49% | 11.1%(-10.6)#2 | 16.9%(-16.5)#59 |
| 60. | Upper Montclair | 0.49% | 13.5%(-13.0)#3 | 16.9%(-16.5)#60 |
| 61. | Rancho Mission Viejo | 0.49% | 15.7%(-15.2)#7 | 16.9%(-16.4)#61 |
| 62. | Steiner Ranch | 0.50% | 19.7%(-19.2)#3 | 16.9%(-16.4)#62 |
| 63. | Hackberry | 0.50% | 26.3%(-25.8)#1 | 16.9%(-16.4)#63 |
| 64. | Northwood | 0.51% | 13.2%(-12.7)#1 | 16.9%(-16.4)#64 |
| 65. | Forest Hills | 0.51% | 18.2%(-17.7)#2 | 16.9%(-16.4)#65 |
| 66. | Gig Harbor | 0.51% | 12.1%(-11.6)#3 | 16.9%(-16.4)#66 |
| 67. | Wyoming | 0.52% | 18.8%(-18.2)#5 | 16.9%(-16.4)#67 |
| 68. | Corona De Tucson | 0.52% | 18.1%(-17.6)#1 | 16.9%(-16.4)#68 |
| 69. | Rolling Hills Estates | 0.53% | 15.7%(-15.1)#8 | 16.9%(-16.4)#69 |
| 70. | Stanhope Borough | 0.53% | 13.5%(-13.0)#4 | 16.9%(-16.4)#70 |
| 71. | Fairfax Station | 0.53% | 12.9%(-12.4)#7 | 16.9%(-16.4)#71 |
| 72. | Wales | 0.54% | 13.6%(-13.0)#5 | 16.9%(-16.4)#72 |
| 73. | Ponder | 0.54% | 19.7%(-19.1)#4 | 16.9%(-16.4)#73 |
| 74. | Greenville Cdp Westchester County | 0.54% | 18.3%(-17.8)#4 | 16.9%(-16.4)#74 |
| 75. | Elwood | 0.54% | 18.3%(-17.8)#5 | 16.9%(-16.4)#75 |
| 76. | Stanton | 0.55% | 12.2%(-11.6)#2 | 16.9%(-16.4)#76 |
| 77. | Burr Ridge | 0.55% | 15.9%(-15.3)#6 | 16.9%(-16.4)#77 |
| 78. | Manasquan Borough | 0.56% | 13.5%(-13.0)#5 | 16.9%(-16.4)#78 |
| 79. | Paloma Creek South | 0.57% | 19.7%(-19.1)#5 | 16.9%(-16.4)#79 |
| 80. | Proctor | 0.57% | 11.5%(-10.9)#1 | 16.9%(-16.4)#80 |
| 81. | Travilah | 0.57% | 12.0%(-11.4)#2 | 16.9%(-16.4)#81 |
| 82. | Fruit Cove | 0.57% | 17.9%(-17.3)#1 | 16.9%(-16.4)#82 |
| 83. | Tehaleh | 0.57% | 12.1%(-11.5)#4 | 16.9%(-16.4)#83 |
| 84. | Williston Park | 0.57% | 18.3%(-17.8)#6 | 16.9%(-16.4)#84 |
| 85. | Harrison | 0.57% | 18.8%(-18.2)#6 | 16.9%(-16.4)#85 |
| 86. | Jupiter Farms | 0.58% | 17.9%(-17.3)#2 | 16.9%(-16.4)#86 |
| 87. | Oakbrook | 0.58% | 21.6%(-21.0)#1 | 16.9%(-16.4)#87 |
| 88. | Bladensburg | 0.58% | 12.0%(-11.4)#3 | 16.9%(-16.4)#88 |
| 89. | Dripping Springs | 0.59% | 19.7%(-19.1)#6 | 16.9%(-16.4)#89 |
| 90. | Hillsboro | 0.59% | 16.4%(-15.9)#1 | 16.9%(-16.4)#90 |
| 91. | Verona | 0.59% | 13.6%(-13.0)#6 | 16.9%(-16.3)#91 |
| 92. | Warson Woods | 0.59% | 16.9%(-16.3)#2 | 16.9%(-16.3)#92 |
| 93. | Belleville | 0.60% | 13.6%(-13.0)#7 | 16.9%(-16.3)#93 |
| 94. | East Bethel | 0.60% | 11.1%(-10.5)#3 | 16.9%(-16.3)#94 |
| 95. | Sienna | 0.60% | 19.7%(-19.1)#7 | 16.9%(-16.3)#95 |
| 96. | Reinholds | 0.60% | 16.5%(-15.9)#5 | 16.9%(-16.3)#96 |
| 97. | Tega Cay | 0.60% | 20.8%(-20.2)#1 | 16.9%(-16.3)#97 |
| 98. | Independent Hill | 0.60% | 12.9%(-12.3)#8 | 16.9%(-16.3)#98 |
| 99. | Ringwood Borough | 0.60% | 13.5%(-12.9)#6 | 16.9%(-16.3)#99 |
| 100. | Five Forks | 0.61% | 20.8%(-20.2)#2 | 16.9%(-16.3)#100 |
Common Questions
What are the Top 10 Cities with the Lowest Poverty Level Among Children Under the Age of 16 in the United States?
Top 10 Cities with the Lowest Poverty Level Among Children Under the Age of 16 in the United States are:
#1
0.039%
#2
0.091%
#3
0.11%
#4
0.12%
#5
0.13%
#6
0.16%
#7
0.16%
#8
0.19%
#9
0.20%
#10
0.21%
What city has the Lowest Poverty Level Among Children Under the Age of 16 in the United States?
Belmont has the Lowest Poverty Level Among Children Under the Age of 16 in the United States with 0.039%.
What is the Poverty Level Among Children Under the Age of 16 in the United States?
Poverty Level Among Children Under the Age of 16 in the United States is 16.9%.