Cities with the Highest Percentage of Births to Unmarried Women in the United States
RELATED REPORTS & OPTIONS
Highest Illegitimacy | All Women
United States
Compare Cities
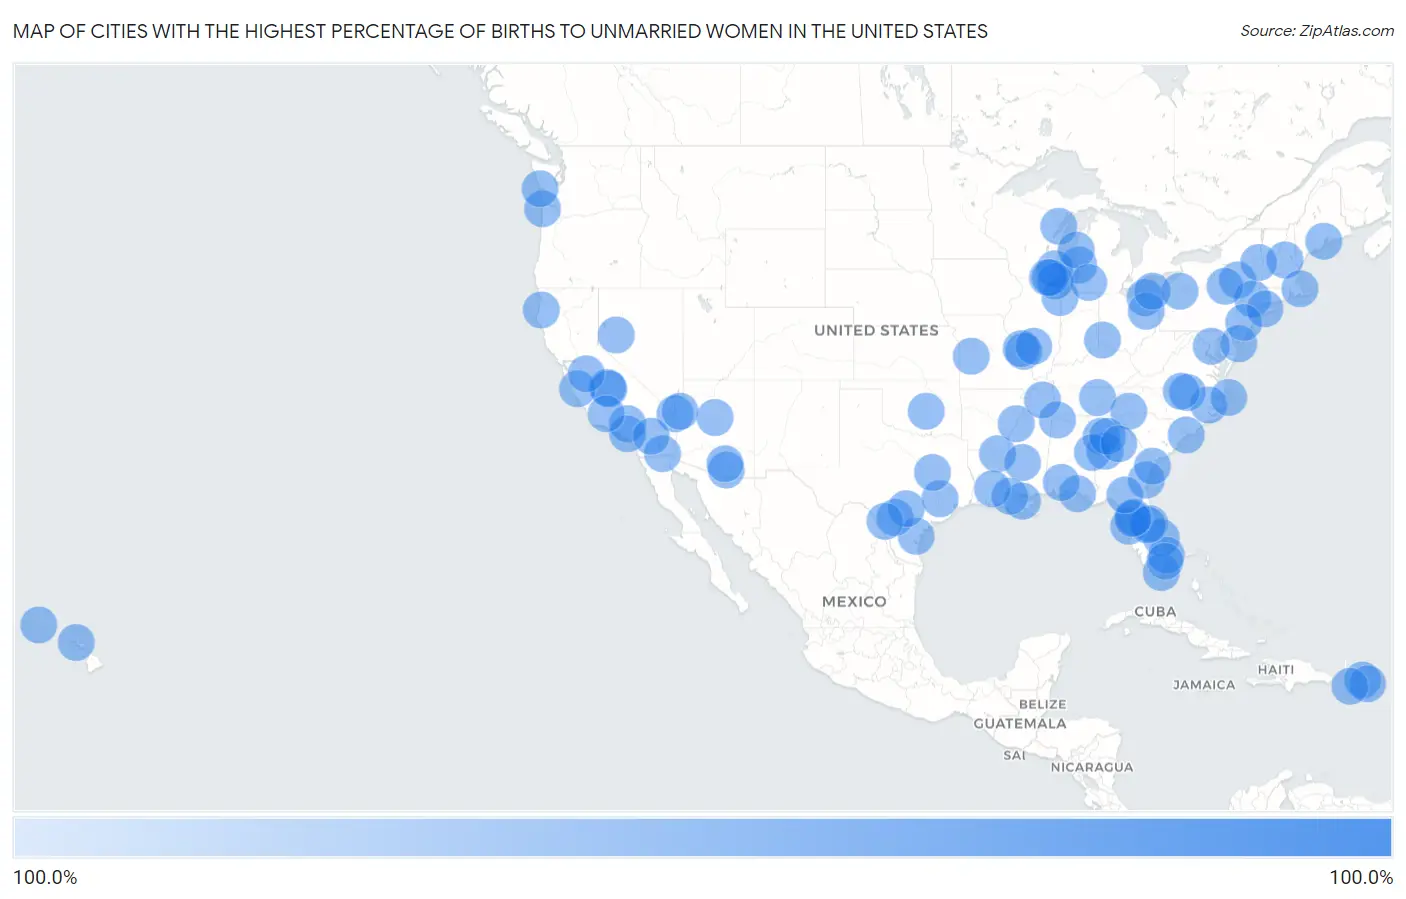
Map of Cities with the Highest Percentage of Births to Unmarried Women in the United States
0.0%
100.0%
Cities with the Highest Percentage of Births to Unmarried Women in the United States
| City | % Unmarried | vs State | vs National | |
| 1. | Green Valley | 100.0% | 36.4%(+63.6)#1 | 32.1%(+67.9)#1 |
| 2. | East St Louis | 100.0% | 32.2%(+67.8)#1 | 32.1%(+67.9)#2 |
| 3. | Arcata | 100.0% | 30.6%(+69.4)#1 | 32.1%(+67.9)#3 |
| 4. | Vero Beach | 100.0% | 37.7%(+62.3)#1 | 32.1%(+67.9)#4 |
| 5. | Palmer Ranch | 100.0% | 37.7%(+62.3)#2 | 32.1%(+67.9)#5 |
| 6. | Oneonta | 100.0% | 28.8%(+71.2)#1 | 32.1%(+67.9)#6 |
| 7. | East Cleveland | 100.0% | 37.8%(+62.2)#1 | 32.1%(+67.9)#7 |
| 8. | Naranja | 100.0% | 37.7%(+62.3)#3 | 32.1%(+67.9)#8 |
| 9. | Dorado | 100.0% | 59.9%(+40.1)#1 | 32.1%(+67.9)#9 |
| 10. | Tucson Estates | 100.0% | 36.4%(+63.6)#2 | 32.1%(+67.9)#10 |
| 11. | Lantana | 100.0% | 37.7%(+62.3)#4 | 32.1%(+67.9)#11 |
| 12. | Sun Village | 100.0% | 30.6%(+69.4)#2 | 32.1%(+67.9)#12 |
| 13. | Wilton Manors | 100.0% | 37.7%(+62.3)#5 | 32.1%(+67.9)#13 |
| 14. | Manati | 100.0% | 59.9%(+40.1)#2 | 32.1%(+67.9)#14 |
| 15. | Kapaa | 100.0% | 29.3%(+70.7)#1 | 32.1%(+67.9)#15 |
| 16. | Union Park | 100.0% | 37.7%(+62.3)#6 | 32.1%(+67.9)#16 |
| 17. | Hudson | 100.0% | 37.7%(+62.3)#7 | 32.1%(+67.9)#17 |
| 18. | Bellefontaine Neighbors | 100.0% | 30.2%(+69.8)#1 | 32.1%(+67.9)#18 |
| 19. | Berwick Borough | 100.0% | 32.6%(+67.4)#1 | 32.1%(+67.9)#19 |
| 20. | East Whittier | 100.0% | 30.6%(+69.4)#3 | 32.1%(+67.9)#20 |
| 21. | Robstown | 100.0% | 32.3%(+67.7)#1 | 32.1%(+67.9)#21 |
| 22. | Walker Mill | 100.0% | 31.9%(+68.1)#1 | 32.1%(+67.9)#22 |
| 23. | Muskegon Heights | 100.0% | 34.8%(+65.2)#1 | 32.1%(+67.9)#23 |
| 24. | Villas | 100.0% | 26.4%(+73.6)#1 | 32.1%(+67.9)#24 |
| 25. | Sauk Village | 100.0% | 32.2%(+67.8)#2 | 32.1%(+67.9)#25 |
| 26. | Little River | 100.0% | 41.0%(+59.0)#1 | 32.1%(+67.9)#26 |
| 27. | Washington | 100.0% | 34.6%(+65.4)#1 | 32.1%(+67.9)#27 |
| 28. | Sedona | 100.0% | 36.4%(+63.6)#3 | 32.1%(+67.9)#28 |
| 29. | Thomaston | 100.0% | 36.1%(+63.9)#1 | 32.1%(+67.9)#29 |
| 30. | Orange Cove | 100.0% | 30.6%(+69.4)#4 | 32.1%(+67.9)#30 |
| 31. | Bastrop | 100.0% | 46.9%(+53.1)#1 | 32.1%(+67.9)#31 |
| 32. | Pine Castle | 100.0% | 37.7%(+62.3)#8 | 32.1%(+67.9)#32 |
| 33. | Helena West Helena | 100.0% | 38.4%(+61.6)#1 | 32.1%(+67.9)#33 |
| 34. | Warren | 100.0% | 32.6%(+67.4)#2 | 32.1%(+67.9)#34 |
| 35. | St Francis | 100.0% | 28.1%(+71.9)#1 | 32.1%(+67.9)#35 |
| 36. | Fairfield Glade | 100.0% | 33.4%(+66.6)#1 | 32.1%(+67.9)#36 |
| 37. | Fallon | 100.0% | 37.6%(+62.4)#1 | 32.1%(+67.9)#37 |
| 38. | Miramar Beach | 100.0% | 37.7%(+62.3)#9 | 32.1%(+67.9)#38 |
| 39. | Orosi | 100.0% | 30.6%(+69.4)#5 | 32.1%(+67.9)#39 |
| 40. | Tuscumbia | 100.0% | 38.7%(+61.3)#1 | 32.1%(+67.9)#40 |
| 41. | Juncos | 100.0% | 59.9%(+40.1)#3 | 32.1%(+67.9)#41 |
| 42. | Hernando | 100.0% | 37.7%(+62.3)#10 | 32.1%(+67.9)#42 |
| 43. | Clinton | 100.0% | 30.2%(+69.8)#2 | 32.1%(+67.9)#43 |
| 44. | Pearsall | 100.0% | 32.3%(+67.7)#2 | 32.1%(+67.9)#44 |
| 45. | New Windsor | 100.0% | 28.8%(+71.2)#2 | 32.1%(+67.9)#45 |
| 46. | Perry Heights | 100.0% | 37.8%(+62.2)#2 | 32.1%(+67.9)#46 |
| 47. | Stony Brook University | 100.0% | 28.8%(+71.2)#3 | 32.1%(+67.9)#47 |
| 48. | Franklin | 100.0% | 29.4%(+70.6)#1 | 32.1%(+67.9)#48 |
| 49. | Oxford | 100.0% | 34.6%(+65.4)#2 | 32.1%(+67.9)#49 |
| 50. | Gonzales | 100.0% | 30.6%(+69.4)#6 | 32.1%(+67.9)#50 |
| 51. | Atmore | 100.0% | 38.7%(+61.3)#2 | 32.1%(+67.9)#51 |
| 52. | Menominee | 100.0% | 34.8%(+65.2)#2 | 32.1%(+67.9)#52 |
| 53. | Lake Geneva | 100.0% | 28.1%(+71.9)#2 | 32.1%(+67.9)#53 |
| 54. | North Madison | 100.0% | 37.8%(+62.2)#3 | 32.1%(+67.9)#54 |
| 55. | Brookhaven Borough | 100.0% | 32.6%(+67.4)#3 | 32.1%(+67.9)#55 |
| 56. | Laughlin | 100.0% | 37.6%(+62.4)#2 | 32.1%(+67.9)#56 |
| 57. | Dock Junction | 100.0% | 36.1%(+63.9)#2 | 32.1%(+67.9)#57 |
| 58. | Milan | 100.0% | 33.4%(+66.6)#2 | 32.1%(+67.9)#58 |
| 59. | Juana Diaz | 100.0% | 59.9%(+40.1)#4 | 32.1%(+67.9)#59 |
| 60. | Kirby | 100.0% | 32.3%(+67.7)#3 | 32.1%(+67.9)#60 |
| 61. | Roxboro | 100.0% | 34.6%(+65.4)#3 | 32.1%(+67.9)#61 |
| 62. | Austell | 100.0% | 36.1%(+63.9)#3 | 32.1%(+67.9)#62 |
| 63. | Prairie View | 100.0% | 32.3%(+67.7)#4 | 32.1%(+67.9)#63 |
| 64. | Heber | 100.0% | 30.6%(+69.4)#7 | 32.1%(+67.9)#64 |
| 65. | Golden Valley | 100.0% | 36.4%(+63.6)#4 | 32.1%(+67.9)#65 |
| 66. | Brevard | 100.0% | 34.6%(+65.4)#4 | 32.1%(+67.9)#66 |
| 67. | Park City | 100.0% | 32.2%(+67.8)#3 | 32.1%(+67.9)#67 |
| 68. | Ludington | 100.0% | 34.8%(+65.2)#3 | 32.1%(+67.9)#68 |
| 69. | Kill Devil Hills | 100.0% | 34.6%(+65.4)#5 | 32.1%(+67.9)#69 |
| 70. | Plymouth | 100.0% | 27.2%(+72.8)#1 | 32.1%(+67.9)#70 |
| 71. | Hudson Falls | 100.0% | 28.8%(+71.2)#4 | 32.1%(+67.9)#71 |
| 72. | Taft | 100.0% | 30.6%(+69.4)#8 | 32.1%(+67.9)#72 |
| 73. | Washington Borough | 100.0% | 26.4%(+73.6)#2 | 32.1%(+67.9)#73 |
| 74. | Richland | 100.0% | 45.8%(+54.2)#1 | 32.1%(+67.9)#74 |
| 75. | Seaside | 100.0% | 23.4%(+76.6)#1 | 32.1%(+67.9)#75 |
| 76. | Greenville | 100.0% | 32.2%(+67.8)#4 | 32.1%(+67.9)#76 |
| 77. | Belfast | 100.0% | 30.0%(+70.0)#1 | 32.1%(+67.9)#77 |
| 78. | Mount Healthy | 100.0% | 37.8%(+62.2)#4 | 32.1%(+67.9)#78 |
| 79. | Lecanto | 100.0% | 37.7%(+62.3)#11 | 32.1%(+67.9)#79 |
| 80. | Bridge City | 100.0% | 46.9%(+53.1)#2 | 32.1%(+67.9)#80 |
| 81. | Mexia | 100.0% | 32.3%(+67.7)#5 | 32.1%(+67.9)#81 |
| 82. | Lanett | 100.0% | 38.7%(+61.3)#3 | 32.1%(+67.9)#82 |
| 83. | Ocean Shores | 100.0% | 24.1%(+75.9)#1 | 32.1%(+67.9)#83 |
| 84. | Live Oak | 100.0% | 37.7%(+62.3)#12 | 32.1%(+67.9)#84 |
| 85. | Whitemarsh Island | 100.0% | 36.1%(+63.9)#4 | 32.1%(+67.9)#85 |
| 86. | Napili Honokowai | 100.0% | 29.3%(+70.7)#2 | 32.1%(+67.9)#86 |
| 87. | Fairview Cdp Dutchess County | 100.0% | 28.8%(+71.2)#5 | 32.1%(+67.9)#87 |
| 88. | Stone Mountain | 100.0% | 36.1%(+63.9)#5 | 32.1%(+67.9)#88 |
| 89. | St Gabriel | 100.0% | 46.9%(+53.1)#3 | 32.1%(+67.9)#89 |
| 90. | Eastwood | 100.0% | 34.8%(+65.2)#4 | 32.1%(+67.9)#90 |
| 91. | Hilmar Irwin | 100.0% | 30.6%(+69.4)#9 | 32.1%(+67.9)#91 |
| 92. | Desert Palms | 100.0% | 30.6%(+69.4)#10 | 32.1%(+67.9)#92 |
| 93. | Yardville | 100.0% | 26.4%(+73.6)#3 | 32.1%(+67.9)#94 |
| 94. | Binghamton University | 100.0% | 28.8%(+71.2)#6 | 32.1%(+67.9)#95 |
| 95. | Eatonton | 100.0% | 36.1%(+63.9)#6 | 32.1%(+67.9)#96 |
| 96. | Ville Platte | 100.0% | 46.9%(+53.1)#4 | 32.1%(+67.9)#97 |
| 97. | Twin Lakes | 100.0% | 28.1%(+71.9)#3 | 32.1%(+67.9)#98 |
| 98. | Crystal City | 100.0% | 32.3%(+67.7)#6 | 32.1%(+67.9)#99 |
| 99. | Tecumseh | 100.0% | 32.5%(+67.5)#1 | 32.1%(+67.9)#100 |
| 100. | Puerto Real | 100.0% | 59.9%(+40.1)#5 | 32.1%(+67.9)#101 |
Common Questions
What are the Top 10 Cities with the Highest Percentage of Births to Unmarried Women in the United States?
Top 10 Cities with the Highest Percentage of Births to Unmarried Women in the United States are:
#1
100.0%
#2
100.0%
#3
100.0%
#4
100.0%
#5
100.0%
#6
100.0%
#7
100.0%
#8
100.0%
#9
100.0%
#10
100.0%
What city has the Highest Percentage of Births to Unmarried Women in the United States?
Green Valley has the Highest Percentage of Births to Unmarried Women in the United States with 100.0%.
What is the Percentage of Births to Unmarried Women in the United States?
Percentage of Births to Unmarried Women in the United States is 32.1%.