West Virginia Map & Demographics
West Virginia Map
West Virginia Overview
Jun 20, 1863
INCORPORATED
24,230
TOTAL AREA [ SQ MI ]
24,038
LAND AREA [ SQ MI ]
192
WATER AREA [ SQ MI ]
1,500
ELEVATION AVG [ FT ]
4,863
ELEVATION HIGH [ FT ]
240
ELEVATION LOW [ FT ]
74.6
POP DENSITY [ PPL / SQ MI ]
$31,462
PER CAPITA INCOME
$71,678
AVG FAMILY INCOME
$55,217
AVG HOUSEHOLD INCOME
31.9%
WAGE / INCOME GAP [ % ]
68.1¢/ $1
WAGE / INCOME GAP [ $ ]
$10,702
FAMILY INCOME DEFICIT
0.47
INEQUALITY / GINI INDEX
26554
LARGEST ZIP CODE
Charleston
LARGEST CITY
Kanawha County
LARGEST COUNTY
1,792,967
TOTAL POPULATION
894,772
MALE POPULATION
898,195
FEMALE POPULATION
99.62
MALES / 100 FEMALES
100.38
FEMALES / 100 MALES
42.6
MEDIAN AGE
3.0
AVG FAMILY SIZE
2.4
AVG HOUSEHOLD SIZE
785,678
LABOR FORCE [ PEOPLE ]
53.2%
PERCENT IN LABOR FORCE
6.1%
UNEMPLOYMENT RATE
Income in West Virginia
Income Overview in West Virginia
Per Capita Income in West Virginia is $31,462, while median incomes of families and households are $71,678 and $55,217 respectively.
| Characteristic | Number | Measure |
| Per Capita Income | 1,792,967 | $31,462 |
| Median Family Income | 449,704 | $71,678 |
| Mean Family Income | 449,704 | $91,003 |
| Median Household Income | 716,040 | $55,217 |
| Mean Household Income | 716,040 | $75,575 |
| Income Deficit | 449,704 | $10,702 |
| Wage / Income Gap (%) | 1,792,967 | 31.88% |
| Wage / Income Gap ($) | 1,792,967 | 68.12¢ per $1 |
| Gini / Inequality Index | 1,792,967 | 0.47 |
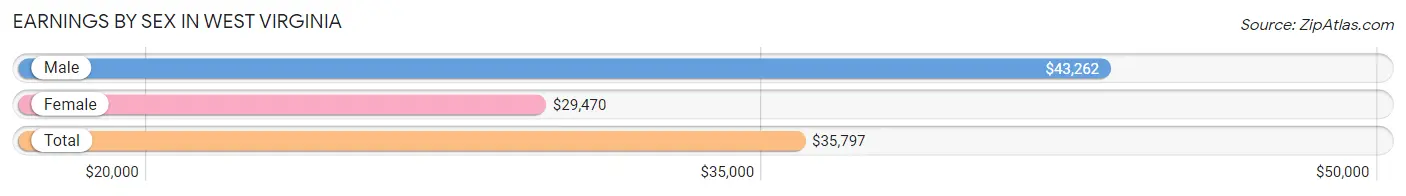
Earnings by Sex in West Virginia
Average Earnings in West Virginia are $35,797, $43,262 for men and $29,470 for women, a difference of 31.9%.
| Sex | Number | Average Earnings |
| Male | 436,556 (53.0%) | $43,262 |
| Female | 386,730 (47.0%) | $29,470 |
| Total | 823,286 (100.0%) | $35,797 |
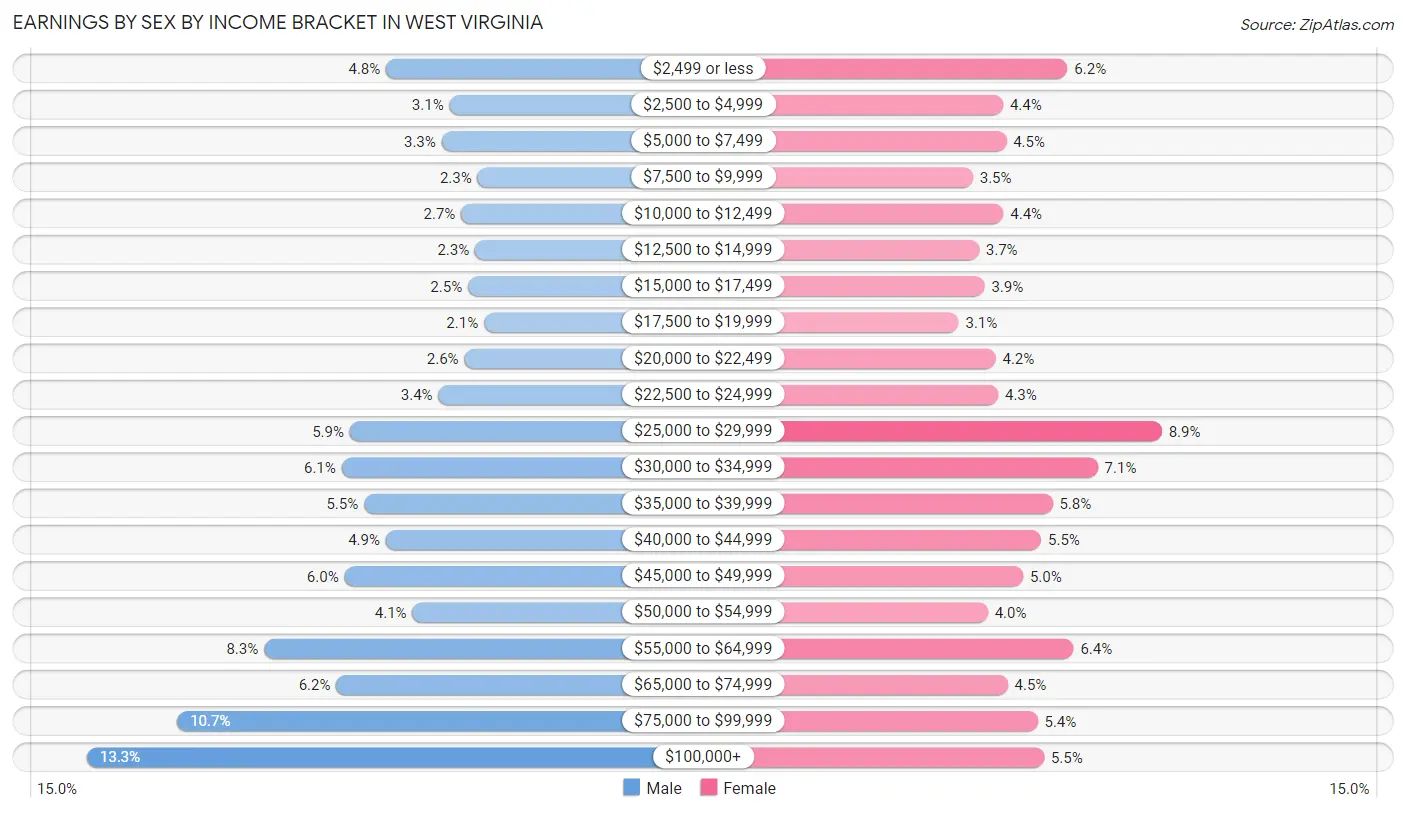
Earnings by Sex by Income Bracket in West Virginia
The most common earnings brackets in West Virginia are $100,000+ for men (57,850 | 13.3%) and $25,000 to $29,999 for women (34,227 | 8.8%).
| Income | Male | Female |
| $2,499 or less | 21,121 (4.8%) | 23,963 (6.2%) |
| $2,500 to $4,999 | 13,351 (3.1%) | 16,967 (4.4%) |
| $5,000 to $7,499 | 14,328 (3.3%) | 17,313 (4.5%) |
| $7,500 to $9,999 | 9,890 (2.3%) | 13,674 (3.5%) |
| $10,000 to $12,499 | 11,912 (2.7%) | 17,012 (4.4%) |
| $12,500 to $14,999 | 10,201 (2.3%) | 14,350 (3.7%) |
| $15,000 to $17,499 | 11,109 (2.5%) | 14,955 (3.9%) |
| $17,500 to $19,999 | 9,136 (2.1%) | 12,151 (3.1%) |
| $20,000 to $22,499 | 11,533 (2.6%) | 16,155 (4.2%) |
| $22,500 to $24,999 | 14,709 (3.4%) | 16,447 (4.3%) |
| $25,000 to $29,999 | 25,563 (5.9%) | 34,227 (8.8%) |
| $30,000 to $34,999 | 26,608 (6.1%) | 27,278 (7.0%) |
| $35,000 to $39,999 | 23,830 (5.5%) | 22,353 (5.8%) |
| $40,000 to $44,999 | 21,153 (4.9%) | 21,126 (5.5%) |
| $45,000 to $49,999 | 26,257 (6.0%) | 19,137 (5.0%) |
| $50,000 to $54,999 | 17,914 (4.1%) | 15,308 (4.0%) |
| $55,000 to $64,999 | 36,105 (8.3%) | 24,649 (6.4%) |
| $65,000 to $74,999 | 27,238 (6.2%) | 17,487 (4.5%) |
| $75,000 to $99,999 | 46,748 (10.7%) | 20,743 (5.4%) |
| $100,000+ | 57,850 (13.3%) | 21,435 (5.5%) |
| Total | 436,556 (100.0%) | 386,730 (100.0%) |
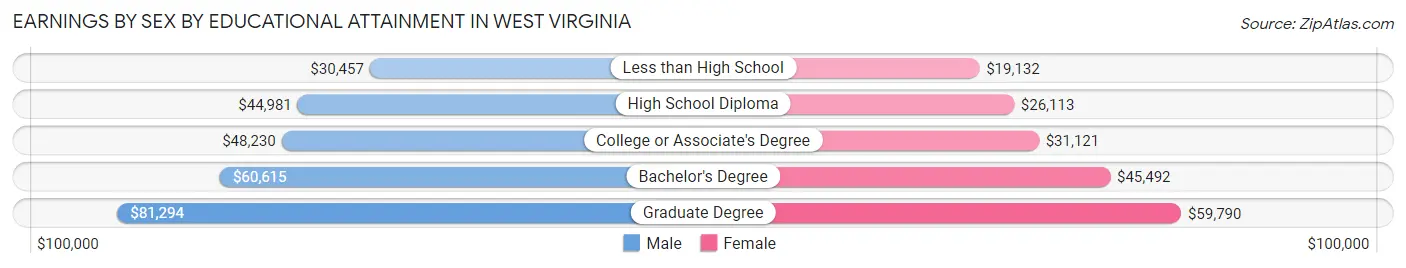
Earnings by Sex by Educational Attainment in West Virginia
Average earnings in West Virginia are $48,835 for men and $33,922 for women, a difference of 30.5%. Men with an educational attainment of graduate degree enjoy the highest average annual earnings of $81,294, while those with less than high school education earn the least with $30,457. Women with an educational attainment of graduate degree earn the most with the average annual earnings of $59,790, while those with less than high school education have the smallest earnings of $19,132.
| Educational Attainment | Male Income | Female Income |
| Less than High School | $30,457 | $19,132 |
| High School Diploma | $44,981 | $26,113 |
| College or Associate's Degree | $48,230 | $31,121 |
| Bachelor's Degree | $60,615 | $45,492 |
| Graduate Degree | $81,294 | $59,790 |
| Total | $48,835 | $33,922 |
Family Income in West Virginia
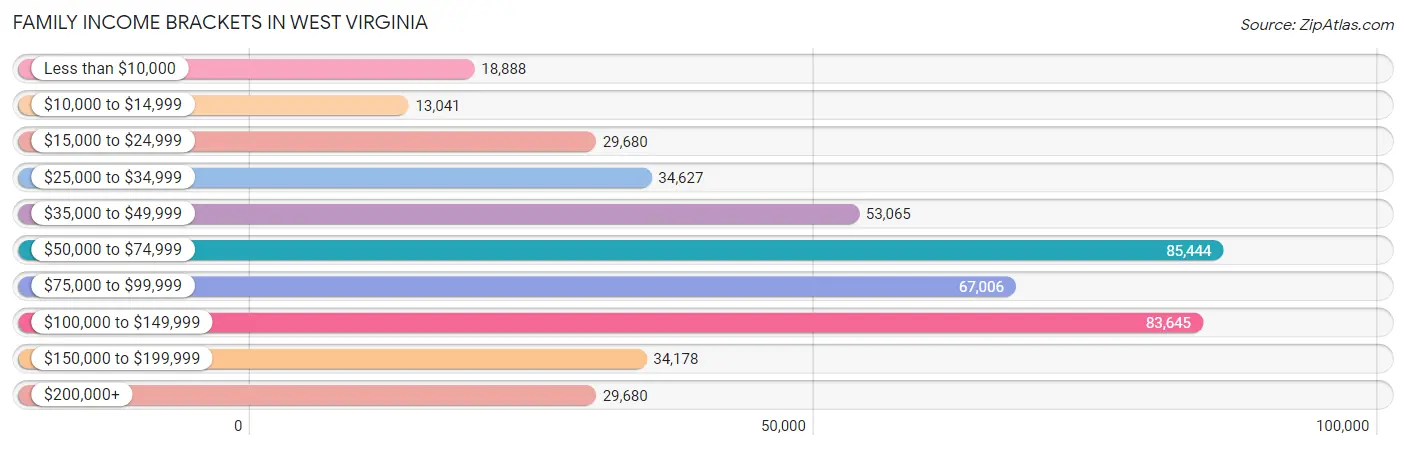
Family Income Brackets in West Virginia
According to the West Virginia family income data, there are 85,444 families falling into the $50,000 to $74,999 income range, which is the most common income bracket and makes up 19.0% of all families. Conversely, the $10,000 to $14,999 income bracket is the least frequent group with only 13,041 families (2.9%) belonging to this category.
| Income Bracket | # Families | % Families |
| Less than $10,000 | 18,888 | 4.2% |
| $10,000 to $14,999 | 13,041 | 2.9% |
| $15,000 to $24,999 | 29,680 | 6.6% |
| $25,000 to $34,999 | 34,627 | 7.7% |
| $35,000 to $49,999 | 53,065 | 11.8% |
| $50,000 to $74,999 | 85,444 | 19.0% |
| $75,000 to $99,999 | 67,006 | 14.9% |
| $100,000 to $149,999 | 83,645 | 18.6% |
| $150,000 to $199,999 | 34,178 | 7.6% |
| $200,000+ | 29,680 | 6.6% |
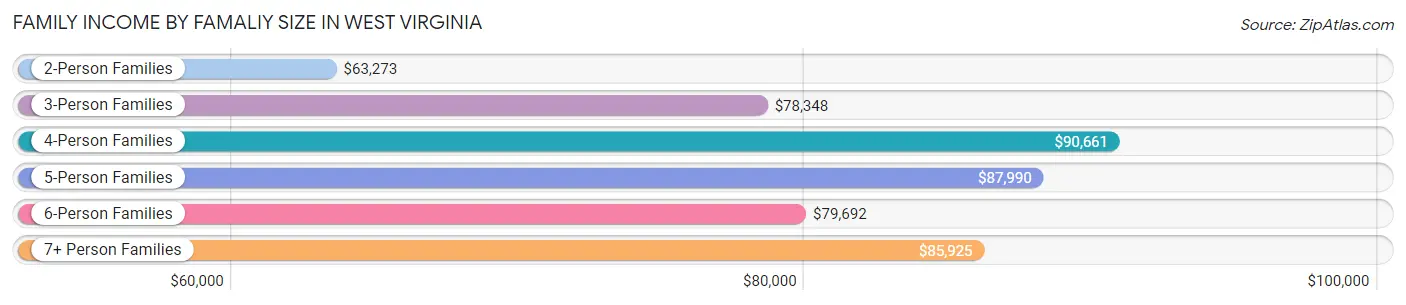
Family Income by Famaliy Size in West Virginia
4-person families (67,791 | 15.1%) account for the highest median family income in West Virginia with $90,661 per family, while 2-person families (241,082 | 53.6%) have the highest median income of $31,636 per family member.
| Income Bracket | # Families | Median Income |
| 2-Person Families | 241,082 (53.6%) | $63,273 |
| 3-Person Families | 100,605 (22.4%) | $78,348 |
| 4-Person Families | 67,791 (15.1%) | $90,661 |
| 5-Person Families | 26,766 (5.9%) | $87,990 |
| 6-Person Families | 8,742 (1.9%) | $79,692 |
| 7+ Person Families | 4,718 (1.1%) | $85,925 |
| Total | 449,704 (100.0%) | $71,678 |
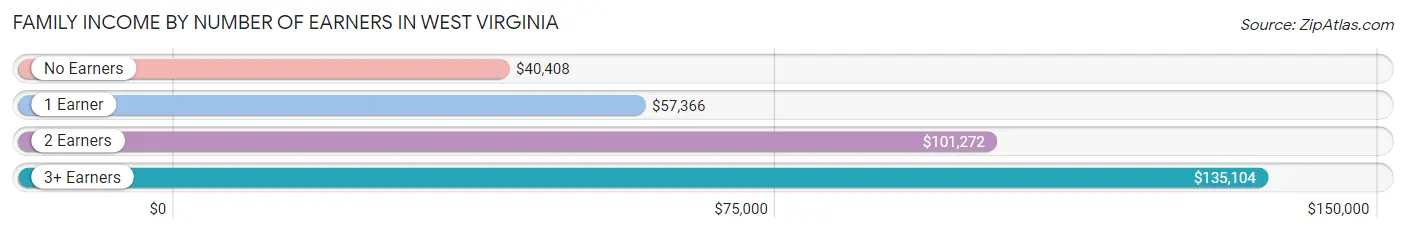
Family Income by Number of Earners in West Virginia
The median family income in West Virginia is $71,678, with families comprising 3+ earners (32,146) having the highest median family income of $135,104, while families with no earners (107,311) have the lowest median family income of $40,408, accounting for 7.1% and 23.9% of families, respectively.
| Number of Earners | # Families | Median Income |
| No Earners | 107,311 (23.9%) | $40,408 |
| 1 Earner | 150,993 (33.6%) | $57,366 |
| 2 Earners | 159,254 (35.4%) | $101,272 |
| 3+ Earners | 32,146 (7.1%) | $135,104 |
| Total | 449,704 (100.0%) | $71,678 |
Household Income in West Virginia
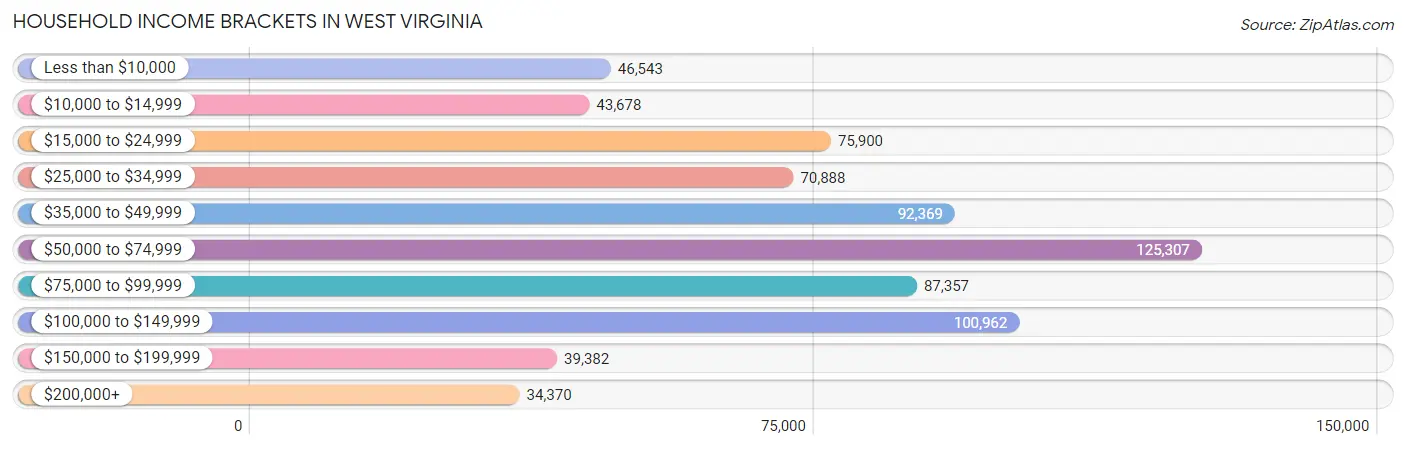
Household Income Brackets in West Virginia
With 125,307 households falling in the category, the $50,000 to $74,999 income range is the most frequent in West Virginia, accounting for 17.5% of all households. In contrast, only 34,370 households (4.8%) fall into the $200,000+ income bracket, making it the least populous group.
| Income Bracket | # Households | % Households |
| Less than $10,000 | 46,543 | 6.5% |
| $10,000 to $14,999 | 43,678 | 6.1% |
| $15,000 to $24,999 | 75,900 | 10.6% |
| $25,000 to $34,999 | 70,888 | 9.9% |
| $35,000 to $49,999 | 92,369 | 12.9% |
| $50,000 to $74,999 | 125,307 | 17.5% |
| $75,000 to $99,999 | 87,357 | 12.2% |
| $100,000 to $149,999 | 100,962 | 14.1% |
| $150,000 to $199,999 | 39,382 | 5.5% |
| $200,000+ | 34,370 | 4.8% |
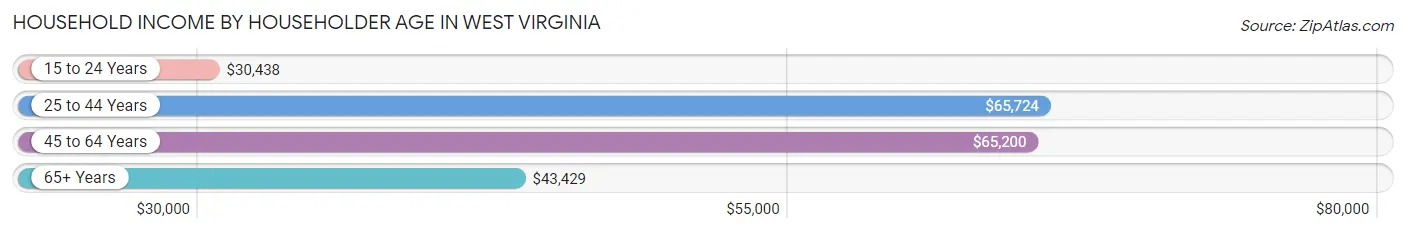
Household Income by Householder Age in West Virginia
The median household income in West Virginia is $55,217, with the highest median household income of $65,724 found in the 25 to 44 years age bracket for the primary householder. A total of 190,224 households (26.6%) fall into this category. Meanwhile, the 15 to 24 years age bracket for the primary householder has the lowest median household income of $30,438, with 28,104 households (3.9%) in this group.
| Income Bracket | # Households | Median Income |
| 15 to 24 Years | 28,104 (3.9%) | $30,438 |
| 25 to 44 Years | 190,224 (26.6%) | $65,724 |
| 45 to 64 Years | 263,834 (36.8%) | $65,200 |
| 65+ Years | 233,878 (32.7%) | $43,429 |
| Total | 716,040 (100.0%) | $55,217 |
Poverty in West Virginia
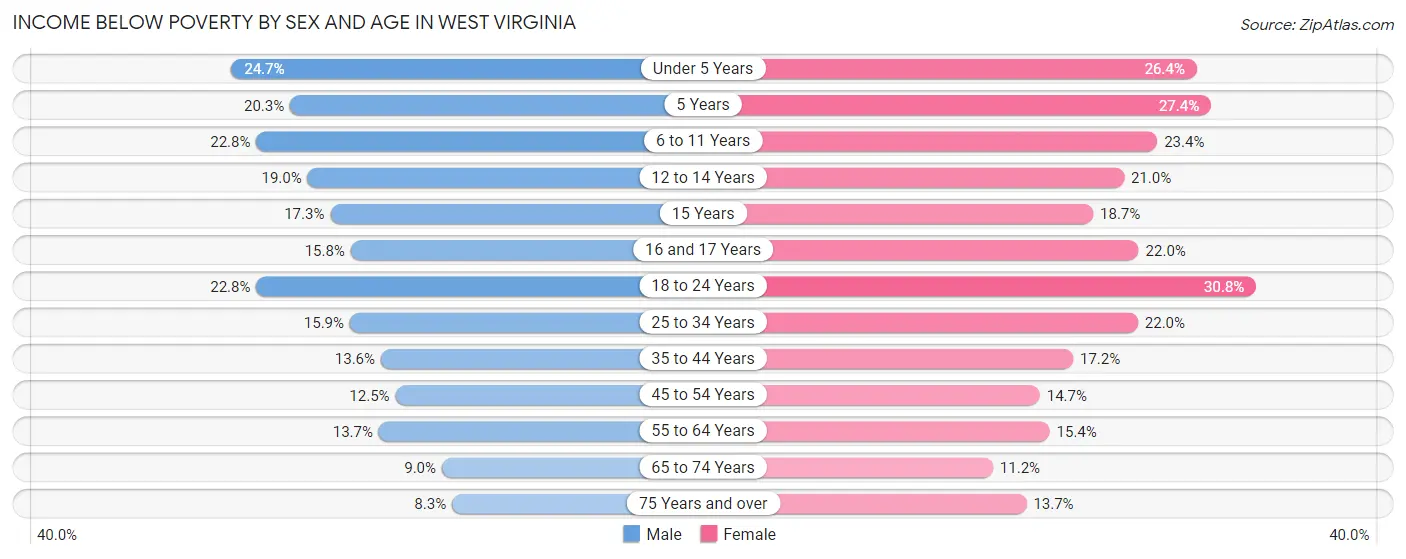
Income Below Poverty by Sex and Age in West Virginia
With 15.2% poverty level for males and 18.4% for females among the residents of West Virginia, under 5 year old males and 18 to 24 year old females are the most vulnerable to poverty, with 10,964 males (24.6%) and 21,140 females (30.8%) in their respective age groups living below the poverty level.
| Age Bracket | Male | Female |
| Under 5 Years | 10,964 (24.6%) | 11,274 (26.4%) |
| 5 Years | 1,872 (20.3%) | 2,378 (27.4%) |
| 6 to 11 Years | 14,236 (22.8%) | 13,524 (23.4%) |
| 12 to 14 Years | 5,929 (19.0%) | 6,322 (20.9%) |
| 15 Years | 1,881 (17.3%) | 1,877 (18.7%) |
| 16 and 17 Years | 3,487 (15.8%) | 4,630 (22.0%) |
| 18 to 24 Years | 17,114 (22.8%) | 21,140 (30.8%) |
| 25 to 34 Years | 16,367 (15.9%) | 22,141 (22.0%) |
| 35 to 44 Years | 14,120 (13.6%) | 17,890 (17.2%) |
| 45 to 54 Years | 14,097 (12.5%) | 16,384 (14.7%) |
| 55 to 64 Years | 16,673 (13.7%) | 19,570 (15.4%) |
| 65 to 74 Years | 9,387 (9.0%) | 12,672 (11.2%) |
| 75 Years and over | 4,953 (8.3%) | 10,978 (13.7%) |
| Total | 131,080 (15.2%) | 160,780 (18.4%) |
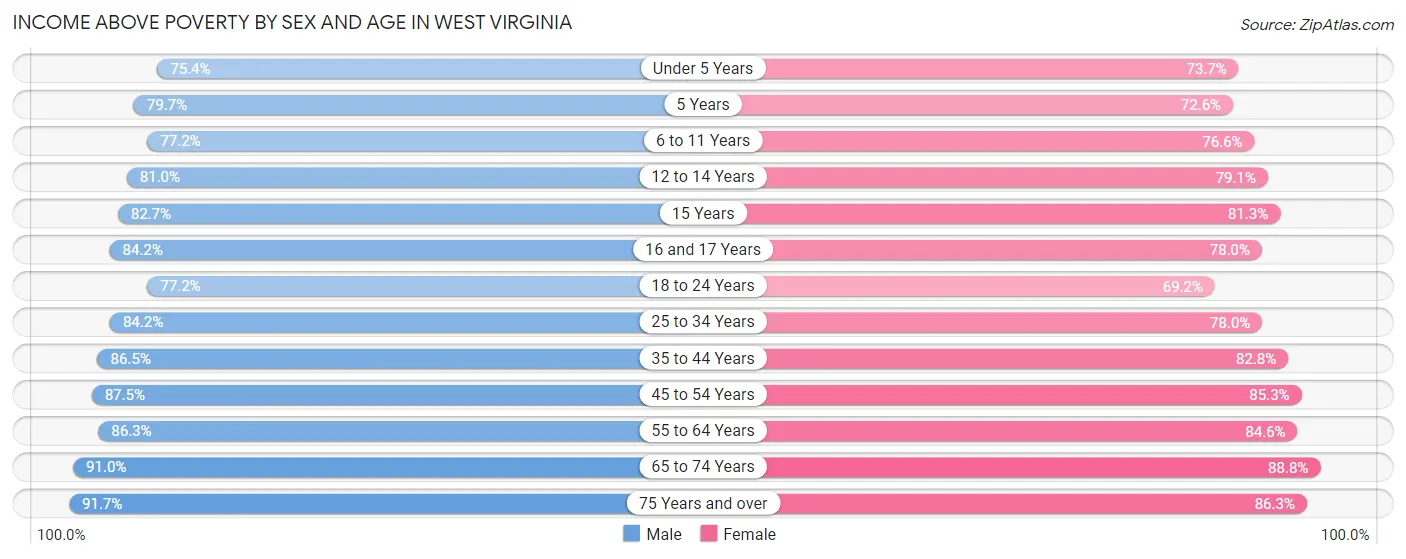
Income Above Poverty by Sex and Age in West Virginia
According to the poverty statistics in West Virginia, males aged 75 years and over and females aged 65 to 74 years are the age groups that are most secure financially, with 91.7% of males and 88.8% of females in these age groups living above the poverty line.
| Age Bracket | Male | Female |
| Under 5 Years | 33,514 (75.3%) | 31,504 (73.7%) |
| 5 Years | 7,355 (79.7%) | 6,298 (72.6%) |
| 6 to 11 Years | 48,201 (77.2%) | 44,230 (76.6%) |
| 12 to 14 Years | 25,299 (81.0%) | 23,853 (79.0%) |
| 15 Years | 8,988 (82.7%) | 8,181 (81.3%) |
| 16 and 17 Years | 18,594 (84.2%) | 16,376 (78.0%) |
| 18 to 24 Years | 57,934 (77.2%) | 47,576 (69.2%) |
| 25 to 34 Years | 86,869 (84.2%) | 78,602 (78.0%) |
| 35 to 44 Years | 90,112 (86.5%) | 86,326 (82.8%) |
| 45 to 54 Years | 98,932 (87.5%) | 95,090 (85.3%) |
| 55 to 64 Years | 104,992 (86.3%) | 107,284 (84.6%) |
| 65 to 74 Years | 94,653 (91.0%) | 100,220 (88.8%) |
| 75 Years and over | 54,918 (91.7%) | 69,122 (86.3%) |
| Total | 730,361 (84.8%) | 714,662 (81.6%) |
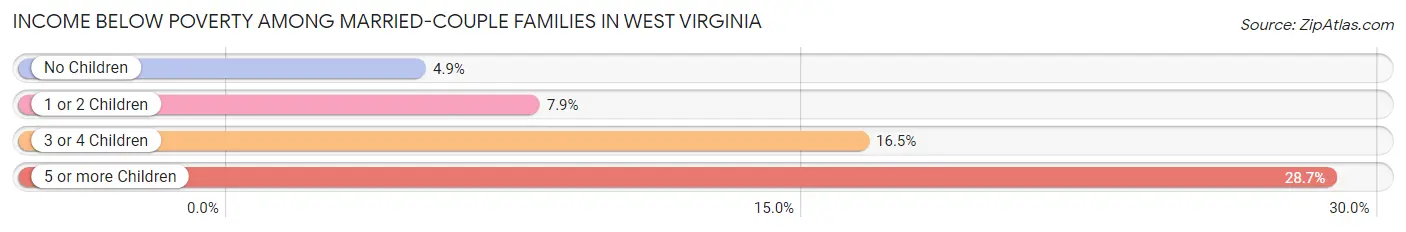
Income Below Poverty Among Married-Couple Families in West Virginia
The poverty statistics for married-couple families in West Virginia show that 6.6% or 22,297 of the total 338,650 families live below the poverty line. Families with 5 or more children have the highest poverty rate of 28.7%, comprising of 487 families. On the other hand, families with no children have the lowest poverty rate of 4.9%, which includes 10,782 families.
| Children | Above Poverty | Below Poverty |
| No Children | 208,734 (95.1%) | 10,782 (4.9%) |
| 1 or 2 Children | 89,167 (92.1%) | 7,627 (7.9%) |
| 3 or 4 Children | 17,242 (83.5%) | 3,401 (16.5%) |
| 5 or more Children | 1,210 (71.3%) | 487 (28.7%) |
| Total | 316,353 (93.4%) | 22,297 (6.6%) |
Income Below Poverty Among Single-Parent Households in West Virginia
According to the poverty data in West Virginia, 20.6% or 7,135 single-father households and 31.7% or 24,240 single-mother households are living below the poverty line. Among single-father households, those with 3 or 4 children have the highest poverty rate, with 1,034 households (43.7%) experiencing poverty. Likewise, among single-mother households, those with 5 or more children have the highest poverty rate, with 390 households (62.8%) falling below the poverty line.
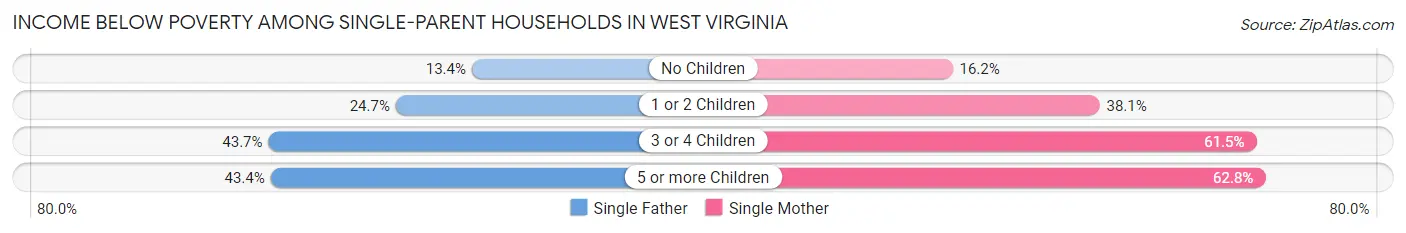
| Children | Single Father | Single Mother |
| No Children | 2,214 (13.4%) | 4,961 (16.2%) |
| 1 or 2 Children | 3,812 (24.7%) | 14,641 (38.1%) |
| 3 or 4 Children | 1,034 (43.7%) | 4,248 (61.5%) |
| 5 or more Children | 75 (43.3%) | 390 (62.8%) |
| Total | 7,135 (20.6%) | 24,240 (31.7%) |
Income Below Poverty Among Married-Couple vs Single-Parent Households in West Virginia
The poverty data for West Virginia shows that 22,297 of the married-couple family households (6.6%) and 31,375 of the single-parent households (28.2%) are living below the poverty level. Within the married-couple family households, those with 5 or more children have the highest poverty rate, with 487 households (28.7%) falling below the poverty line. Among the single-parent households, those with 5 or more children have the highest poverty rate, with 465 household (58.6%) living below poverty.
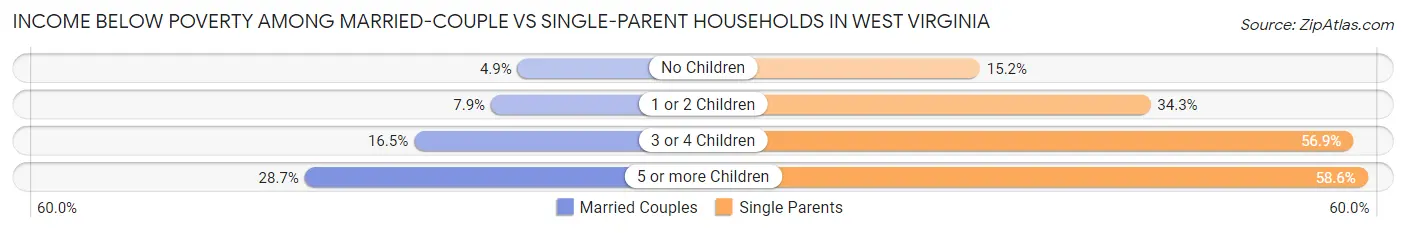
| Children | Married-Couple Families | Single-Parent Households |
| No Children | 10,782 (4.9%) | 7,175 (15.2%) |
| 1 or 2 Children | 7,627 (7.9%) | 18,453 (34.3%) |
| 3 or 4 Children | 3,401 (16.5%) | 5,282 (56.9%) |
| 5 or more Children | 487 (28.7%) | 465 (58.6%) |
| Total | 22,297 (6.6%) | 31,375 (28.2%) |
Largest Zip Codes by Population in West Virginia
The largest zip codes in West Virginia by population are 26554 (41,983), 26003 (40,714), 26508 (38,427), 26505 (38,056), and 25801 (31,056).
1.26554
41,983 (2.34%)
2.26003
40,714 (2.27%)
3.26508
38,427 (2.14%)
4.26505
38,056 (2.12%)
5.25801
31,056 (1.73%)
6.26101
28,751 (1.60%)
7.26301
28,736 (1.60%)
8.25177
23,208 (1.29%)
9.25404
22,950 (1.28%)
10.25526
22,903 (1.28%)
11.25701
21,862 (1.22%)
12.26062
21,142 (1.18%)
13.25705
20,621 (1.15%)
14.25414
20,132 (1.12%)
15.26201
19,662 (1.10%)
16.26501
19,219 (1.07%)
17.24701
18,086 (1.01%)
18.24740
16,510 (0.92%)
19.26104
16,011 (0.89%)
20.25427
15,946 (0.89%)
21.26041
15,659 (0.87%)
22.25405
15,322 (0.85%)
23.26330
15,252 (0.85%)
24.25314
15,212 (0.85%)
25.25401
15,074 (0.84%)
26.25704
14,756 (0.82%)
27.25403
14,739 (0.82%)
28.25428
14,518 (0.81%)
29.26241
14,012 (0.78%)
30.25425
13,436 (0.75%)
Largest Cities by Population in West Virginia
The largest cities in West Virginia by population are Charleston (48,415), Huntington (46,637), Morgantown (30,220), Parkersburg (29,685), and Wheeling (26,900).
48,415 (2.70%)
46,637 (2.60%)
30,220 (1.69%)
29,685 (1.66%)
5.Wheeling
26,900 (1.50%)
6.Weirton
18,971 (1.06%)
18,678 (1.04%)
8.Fairmont
18,402 (1.03%)
9.Beckley
17,132 (0.96%)
10.Clarksburg
15,977 (0.89%)
11.Teays Valley
13,816 (0.77%)
13,527 (0.75%)
13.St Albans
10,753 (0.60%)
14.Vienna
10,642 (0.59%)
15.Cross Lanes
10,037 (0.56%)
16.Cheat Lake
10,034 (0.56%)
17.Bluefield
9,619 (0.54%)
18.Bridgeport
9,255 (0.52%)
19.Oak Hill
8,157 (0.45%)
20.Moundsville
8,056 (0.45%)
21.Dunbar
7,418 (0.41%)
22.Elkins
6,935 (0.39%)
23.Hurricane
6,908 (0.39%)
24.Pea Ridge
6,884 (0.38%)
25.Charles Town
6,584 (0.37%)
26.Nitro
6,540 (0.36%)
27.Brookhaven
6,485 (0.36%)
28.Princeton
5,833 (0.33%)
5,497 (0.31%)
5,210 (0.29%)
Largest Counties by Population in West Virginia
The largest counties in West Virginia by population are Kanawha County (179,895), Berkeley County (123,283), Monongalia County (105,988), Cabell County (93,965), and Wood County (84,272).
179,895 (10.03%)
123,283 (6.88%)
105,988 (5.91%)
93,965 (5.24%)
84,272 (4.70%)
74,303 (4.14%)
65,862 (3.67%)
59,530 (3.32%)
58,043 (3.24%)
57,347 (3.20%)
56,194 (3.13%)
12.Ohio County
42,224 (2.35%)
40,545 (2.26%)
14.Wayne County
38,933 (2.17%)
34,206 (1.91%)
32,995 (1.84%)
17.Logan County
32,350 (1.80%)
30,509 (1.70%)
28,907 (1.61%)
28,005 (1.56%)
27,868 (1.55%)
26,957 (1.50%)
23.Mason County
25,488 (1.42%)
24,624 (1.37%)
23,875 (1.33%)
26.Mingo County
23,466 (1.31%)
23,275 (1.30%)
22,349 (1.25%)
29.Boone County
21,705 (1.21%)
21,237 (1.18%)
Race in West Virginia
The most populous races in West Virginia are White / Caucasian (1,639,342 | 91.4%), Two or more Races (66,905 | 3.7%), and Black / African American (61,227 | 3.4%).
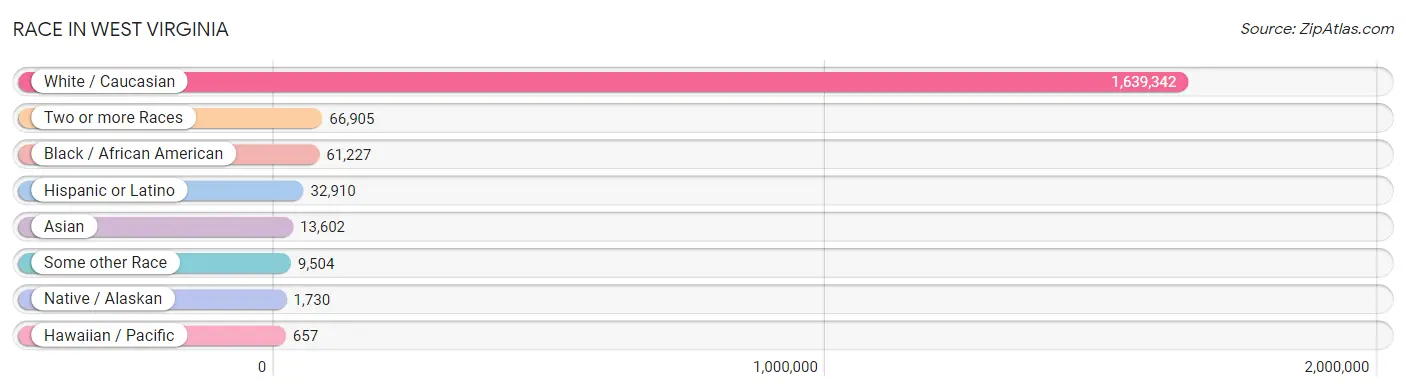
| Race | # Population | % Population |
| Asian | 13,602 | 0.8% |
| Black / African American | 61,227 | 3.4% |
| Hawaiian / Pacific | 657 | 0.0% |
| Hispanic or Latino | 32,910 | 1.8% |
| Native / Alaskan | 1,730 | 0.1% |
| White / Caucasian | 1,639,342 | 91.4% |
| Two or more Races | 66,905 | 3.7% |
| Some other Race | 9,504 | 0.5% |
| Total | 1,792,967 | 100.0% |
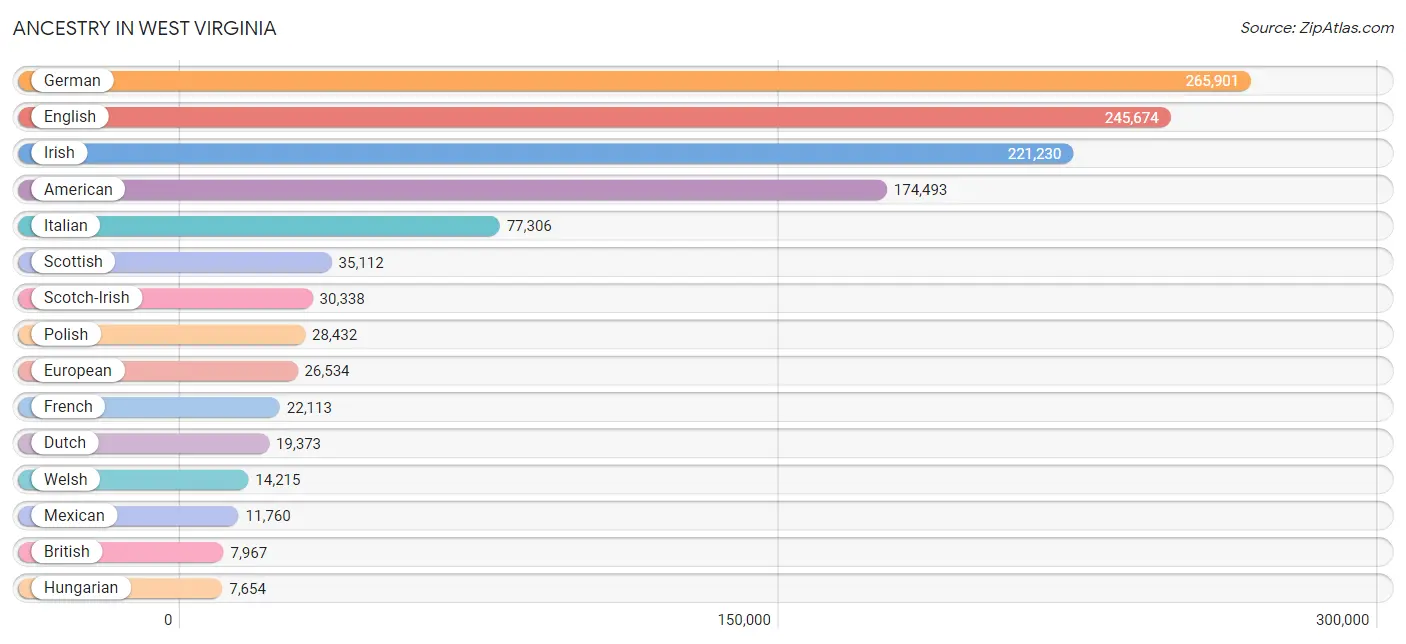
Ancestry in West Virginia
The most populous ancestries reported in West Virginia are German (265,901 | 14.8%), English (245,674 | 13.7%), Irish (221,230 | 12.3%), American (174,493 | 9.7%), and Italian (77,306 | 4.3%), together accounting for 54.9% of all West Virginia residents.
| Ancestry | # Population | % Population |
| African | 3,670 | 0.2% |
| Alaska Native | 10 | 0.0% |
| Albanian | 57 | 0.0% |
| Aleut | 46 | 0.0% |
| Alsatian | 42 | 0.0% |
| American | 174,493 | 9.7% |
| Apache | 351 | 0.0% |
| Arab | 6,739 | 0.4% |
| Arapaho | 14 | 0.0% |
| Argentinean | 296 | 0.0% |
| Armenian | 114 | 0.0% |
| Assyrian / Chaldean / Syriac | 26 | 0.0% |
| Australian | 216 | 0.0% |
| Austrian | 1,686 | 0.1% |
| Bahamian | 113 | 0.0% |
| Basque | 21 | 0.0% |
| Belgian | 1,102 | 0.1% |
| Belizean | 7 | 0.0% |
| Bhutanese | 2,230 | 0.1% |
| Blackfeet | 1,211 | 0.1% |
| Bolivian | 71 | 0.0% |
| Brazilian | 507 | 0.0% |
| British | 7,967 | 0.4% |
| British West Indian | 48 | 0.0% |
| Bulgarian | 47 | 0.0% |
| Burmese | 1,888 | 0.1% |
| Cajun | 245 | 0.0% |
| Canadian | 1,197 | 0.1% |
| Carpatho Rusyn | 10 | 0.0% |
| Celtic | 752 | 0.0% |
| Central American | 4,509 | 0.3% |
| Central American Indian | 246 | 0.0% |
| Cherokee | 5,201 | 0.3% |
| Chickasaw | 43 | 0.0% |
| Chilean | 192 | 0.0% |
| Chinese | 27 | 0.0% |
| Chippewa | 61 | 0.0% |
| Choctaw | 191 | 0.0% |
| Colombian | 485 | 0.0% |
| Costa Rican | 312 | 0.0% |
| Cree | 19 | 0.0% |
| Creek | 37 | 0.0% |
| Croatian | 2,140 | 0.1% |
| Crow | 18 | 0.0% |
| Cuban | 1,200 | 0.1% |
| Cypriot | 28 | 0.0% |
| Czech | 2,762 | 0.2% |
| Czechoslovakian | 1,018 | 0.1% |
| Danish | 1,236 | 0.1% |
| Delaware | 76 | 0.0% |
| Dominican | 924 | 0.1% |
| Dutch | 19,373 | 1.1% |
| Dutch West Indian | 44 | 0.0% |
| Eastern European | 3,518 | 0.2% |
| Ecuadorian | 294 | 0.0% |
| Egyptian | 709 | 0.0% |
| English | 245,674 | 13.7% |
| Estonian | 39 | 0.0% |
| Ethiopian | 244 | 0.0% |
| European | 26,534 | 1.5% |
| Fijian | 10 | 0.0% |
| Filipino | 140 | 0.0% |
| Finnish | 1,139 | 0.1% |
| French | 22,113 | 1.2% |
| French American Indian | 37 | 0.0% |
| French Canadian | 2,292 | 0.1% |
| German | 265,901 | 14.8% |
| German Russian | 8 | 0.0% |
| Ghanaian | 165 | 0.0% |
| Greek | 4,246 | 0.2% |
| Guamanian / Chamorro | 140 | 0.0% |
| Guatemalan | 1,270 | 0.1% |
| Guyanese | 373 | 0.0% |
| Haitian | 264 | 0.0% |
| Honduran | 745 | 0.0% |
| Houma | 5 | 0.0% |
| Hungarian | 7,654 | 0.4% |
| Icelander | 89 | 0.0% |
| Indian (Asian) | 3,218 | 0.2% |
| Indonesian | 231 | 0.0% |
| Inupiat | 195 | 0.0% |
| Iranian | 723 | 0.0% |
| Iraqi | 90 | 0.0% |
| Irish | 221,230 | 12.3% |
| Iroquois | 125 | 0.0% |
| Israeli | 69 | 0.0% |
| Italian | 77,306 | 4.3% |
| Jamaican | 1,340 | 0.1% |
| Japanese | 42 | 0.0% |
| Jordanian | 68 | 0.0% |
| Kenyan | 94 | 0.0% |
| Korean | 4,915 | 0.3% |
| Laotian | 95 | 0.0% |
| Latvian | 81 | 0.0% |
| Lebanese | 3,004 | 0.2% |
| Liberian | 90 | 0.0% |
| Lithuanian | 1,200 | 0.1% |
| Lumbee | 21 | 0.0% |
| Luxembourger | 88 | 0.0% |
| Macedonian | 24 | 0.0% |
| Malaysian | 58 | 0.0% |
| Maltese | 14 | 0.0% |
| Menominee | 2 | 0.0% |
| Mexican | 11,760 | 0.7% |
| Mexican American Indian | 247 | 0.0% |
| Mongolian | 10 | 0.0% |
| Moroccan | 249 | 0.0% |
| Native Hawaiian | 759 | 0.0% |
| Navajo | 226 | 0.0% |
| Nicaraguan | 138 | 0.0% |
| Nigerian | 1,073 | 0.1% |
| Northern European | 1,855 | 0.1% |
| Norwegian | 4,969 | 0.3% |
| Pakistani | 644 | 0.0% |
| Palestinian | 441 | 0.0% |
| Panamanian | 344 | 0.0% |
| Pennsylvania German | 534 | 0.0% |
| Peruvian | 553 | 0.0% |
| Pima | 10 | 0.0% |
| Polish | 28,432 | 1.6% |
| Portuguese | 888 | 0.1% |
| Potawatomi | 13 | 0.0% |
| Pueblo | 43 | 0.0% |
| Puerto Rican | 5,899 | 0.3% |
| Romanian | 998 | 0.1% |
| Russian | 4,724 | 0.3% |
| Salvadoran | 1,700 | 0.1% |
| Samoan | 325 | 0.0% |
| Scandinavian | 3,466 | 0.2% |
| Scotch-Irish | 30,338 | 1.7% |
| Scottish | 35,112 | 2.0% |
| Seminole | 98 | 0.0% |
| Serbian | 947 | 0.1% |
| Shoshone | 9 | 0.0% |
| Sioux | 423 | 0.0% |
| Slavic | 954 | 0.1% |
| Slovak | 3,800 | 0.2% |
| Slovene | 582 | 0.0% |
| South African | 229 | 0.0% |
| South American | 2,320 | 0.1% |
| South American Indian | 15 | 0.0% |
| Spaniard | 1,473 | 0.1% |
| Spanish | 1,838 | 0.1% |
| Spanish American | 88 | 0.0% |
| Spanish American Indian | 17 | 0.0% |
| Sri Lankan | 1,864 | 0.1% |
| Subsaharan African | 6,233 | 0.4% |
| Sudanese | 186 | 0.0% |
| Swedish | 5,938 | 0.3% |
| Swiss | 2,951 | 0.2% |
| Syrian | 1,044 | 0.1% |
| Thai | 3,905 | 0.2% |
| Tlingit-Haida | 1 | 0.0% |
| Trinidadian and Tobagonian | 113 | 0.0% |
| Turkish | 300 | 0.0% |
| U.S. Virgin Islander | 18 | 0.0% |
| Ukrainian | 1,438 | 0.1% |
| Uruguayan | 61 | 0.0% |
| Ute | 8 | 0.0% |
| Venezuelan | 345 | 0.0% |
| Vietnamese | 131 | 0.0% |
| Welsh | 14,215 | 0.8% |
| West Indian | 168 | 0.0% |
| Yaqui | 25 | 0.0% |
| Yugoslavian | 478 | 0.0% |
| Zimbabwean | 99 | 0.0% | View All 166 Rows |
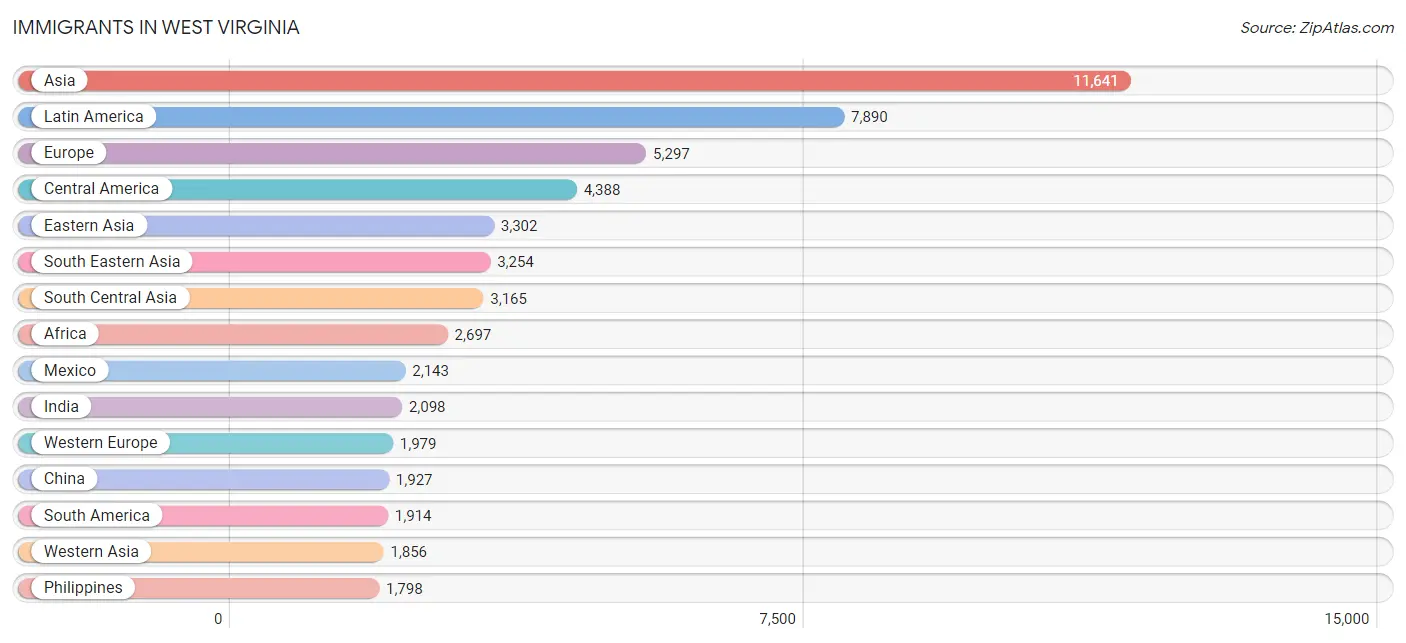
Immigrants in West Virginia
The most numerous immigrant groups reported in West Virginia came from Asia (11,641 | 0.6%), Latin America (7,890 | 0.4%), Europe (5,297 | 0.3%), Central America (4,388 | 0.2%), and Eastern Asia (3,302 | 0.2%), together accounting for 1.8% of all West Virginia residents.
| Immigration Origin | # Population | % Population |
| Africa | 2,697 | 0.2% |
| Albania | 21 | 0.0% |
| Argentina | 173 | 0.0% |
| Asia | 11,641 | 0.6% |
| Australia | 148 | 0.0% |
| Austria | 36 | 0.0% |
| Bahamas | 116 | 0.0% |
| Bangladesh | 183 | 0.0% |
| Belarus | 106 | 0.0% |
| Belgium | 38 | 0.0% |
| Bolivia | 40 | 0.0% |
| Bosnia and Herzegovina | 7 | 0.0% |
| Brazil | 291 | 0.0% |
| Bulgaria | 11 | 0.0% |
| Cambodia | 26 | 0.0% |
| Cameroon | 102 | 0.0% |
| Canada | 1,233 | 0.1% |
| Caribbean | 1,588 | 0.1% |
| Central America | 4,388 | 0.2% |
| Chile | 92 | 0.0% |
| China | 1,927 | 0.1% |
| Colombia | 235 | 0.0% |
| Congo | 16 | 0.0% |
| Costa Rica | 224 | 0.0% |
| Croatia | 16 | 0.0% |
| Cuba | 229 | 0.0% |
| Czechoslovakia | 119 | 0.0% |
| Denmark | 33 | 0.0% |
| Dominican Republic | 504 | 0.0% |
| Eastern Africa | 600 | 0.0% |
| Eastern Asia | 3,302 | 0.2% |
| Eastern Europe | 1,016 | 0.1% |
| Ecuador | 178 | 0.0% |
| Egypt | 510 | 0.0% |
| El Salvador | 737 | 0.0% |
| England | 665 | 0.0% |
| Eritrea | 98 | 0.0% |
| Ethiopia | 178 | 0.0% |
| Europe | 5,297 | 0.3% |
| France | 168 | 0.0% |
| Germany | 1,585 | 0.1% |
| Ghana | 168 | 0.0% |
| Greece | 104 | 0.0% |
| Guatemala | 758 | 0.0% |
| Guyana | 349 | 0.0% |
| Haiti | 50 | 0.0% |
| Honduras | 381 | 0.0% |
| Hong Kong | 52 | 0.0% |
| Hungary | 31 | 0.0% |
| India | 2,098 | 0.1% |
| Indonesia | 91 | 0.0% |
| Iran | 196 | 0.0% |
| Iraq | 77 | 0.0% |
| Ireland | 28 | 0.0% |
| Israel | 58 | 0.0% |
| Italy | 604 | 0.0% |
| Jamaica | 479 | 0.0% |
| Japan | 642 | 0.0% |
| Jordan | 57 | 0.0% |
| Kazakhstan | 43 | 0.0% |
| Kenya | 63 | 0.0% |
| Korea | 733 | 0.0% |
| Kuwait | 571 | 0.0% |
| Laos | 30 | 0.0% |
| Latin America | 7,890 | 0.4% |
| Latvia | 15 | 0.0% |
| Lebanon | 163 | 0.0% |
| Liberia | 89 | 0.0% |
| Lithuania | 9 | 0.0% |
| Malaysia | 45 | 0.0% |
| Mexico | 2,143 | 0.1% |
| Middle Africa | 118 | 0.0% |
| Moldova | 40 | 0.0% |
| Morocco | 80 | 0.0% |
| Nepal | 195 | 0.0% |
| Netherlands | 133 | 0.0% |
| Nicaragua | 37 | 0.0% |
| Nigeria | 705 | 0.0% |
| Northern Africa | 734 | 0.0% |
| Northern Europe | 1,348 | 0.1% |
| Oceania | 182 | 0.0% |
| Pakistan | 326 | 0.0% |
| Panama | 108 | 0.0% |
| Peru | 294 | 0.0% |
| Philippines | 1,798 | 0.1% |
| Poland | 82 | 0.0% |
| Portugal | 94 | 0.0% |
| Romania | 107 | 0.0% |
| Russia | 250 | 0.0% |
| Saudi Arabia | 335 | 0.0% |
| Scotland | 80 | 0.0% |
| Serbia | 17 | 0.0% |
| Sierra Leone | 27 | 0.0% |
| Singapore | 28 | 0.0% |
| Somalia | 18 | 0.0% |
| South Africa | 145 | 0.0% |
| South America | 1,914 | 0.1% |
| South Central Asia | 3,165 | 0.2% |
| South Eastern Asia | 3,254 | 0.2% |
| Southern Europe | 928 | 0.1% |
| Spain | 126 | 0.0% |
| Sri Lanka | 124 | 0.0% |
| St. Vincent and the Grenadines | 6 | 0.0% |
| Sudan | 86 | 0.0% |
| Sweden | 40 | 0.0% |
| Switzerland | 19 | 0.0% |
| Syria | 368 | 0.0% |
| Taiwan | 202 | 0.0% |
| Thailand | 207 | 0.0% |
| Trinidad and Tobago | 147 | 0.0% |
| Turkey | 134 | 0.0% |
| Uganda | 17 | 0.0% |
| Ukraine | 42 | 0.0% |
| Uruguay | 61 | 0.0% |
| Venezuela | 199 | 0.0% |
| Vietnam | 877 | 0.1% |
| Western Africa | 1,039 | 0.1% |
| Western Asia | 1,856 | 0.1% |
| Western Europe | 1,979 | 0.1% |
| Zimbabwe | 188 | 0.0% | View All 120 Rows |
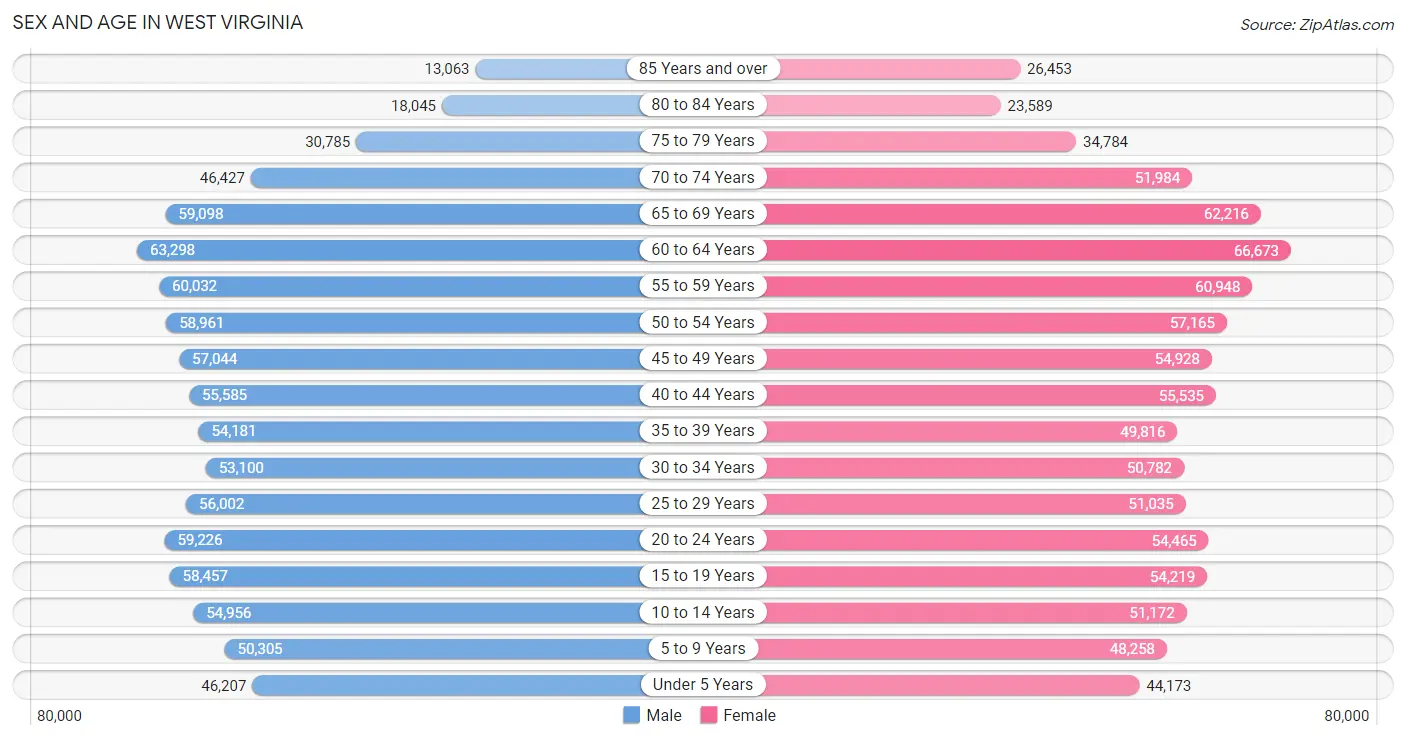
Sex and Age in West Virginia
Sex and Age in West Virginia
The most populous age groups in West Virginia are 60 to 64 Years (63,298 | 7.1%) for men and 60 to 64 Years (66,673 | 7.4%) for women.
| Age Bracket | Male | Female |
| Under 5 Years | 46,207 (5.2%) | 44,173 (4.9%) |
| 5 to 9 Years | 50,305 (5.6%) | 48,258 (5.4%) |
| 10 to 14 Years | 54,956 (6.1%) | 51,172 (5.7%) |
| 15 to 19 Years | 58,457 (6.5%) | 54,219 (6.0%) |
| 20 to 24 Years | 59,226 (6.6%) | 54,465 (6.1%) |
| 25 to 29 Years | 56,002 (6.3%) | 51,035 (5.7%) |
| 30 to 34 Years | 53,100 (5.9%) | 50,782 (5.7%) |
| 35 to 39 Years | 54,181 (6.1%) | 49,816 (5.6%) |
| 40 to 44 Years | 55,585 (6.2%) | 55,535 (6.2%) |
| 45 to 49 Years | 57,044 (6.4%) | 54,928 (6.1%) |
| 50 to 54 Years | 58,961 (6.6%) | 57,165 (6.4%) |
| 55 to 59 Years | 60,032 (6.7%) | 60,948 (6.8%) |
| 60 to 64 Years | 63,298 (7.1%) | 66,673 (7.4%) |
| 65 to 69 Years | 59,098 (6.6%) | 62,216 (6.9%) |
| 70 to 74 Years | 46,427 (5.2%) | 51,984 (5.8%) |
| 75 to 79 Years | 30,785 (3.4%) | 34,784 (3.9%) |
| 80 to 84 Years | 18,045 (2.0%) | 23,589 (2.6%) |
| 85 Years and over | 13,063 (1.5%) | 26,453 (2.9%) |
| Total | 894,772 (100.0%) | 898,195 (100.0%) |
Families and Households in West Virginia
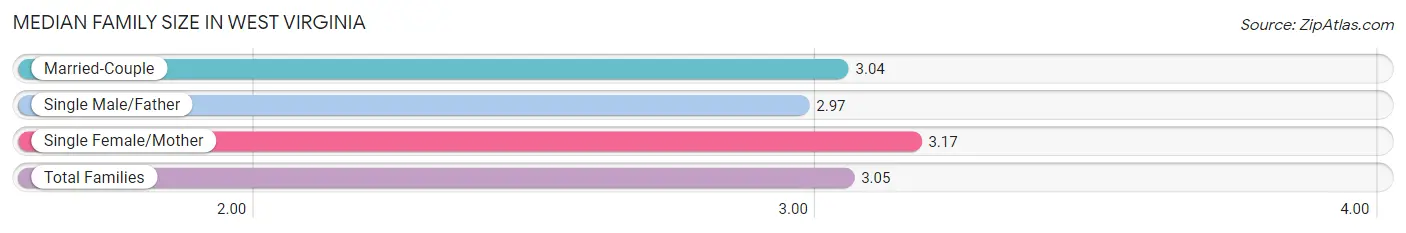
Median Family Size in West Virginia
The median family size in West Virginia is 3.05 persons per family, with single female/mother families (76,505 | 17.0%) accounting for the largest median family size of 3.17 persons per family. On the other hand, single male/father families (34,549 | 7.7%) represent the smallest median family size with 2.97 persons per family.
| Family Type | # Families | Family Size |
| Married-Couple | 338,650 (75.3%) | 3.04 |
| Single Male/Father | 34,549 (7.7%) | 2.97 |
| Single Female/Mother | 76,505 (17.0%) | 3.17 |
| Total Families | 449,704 (100.0%) | 3.05 |
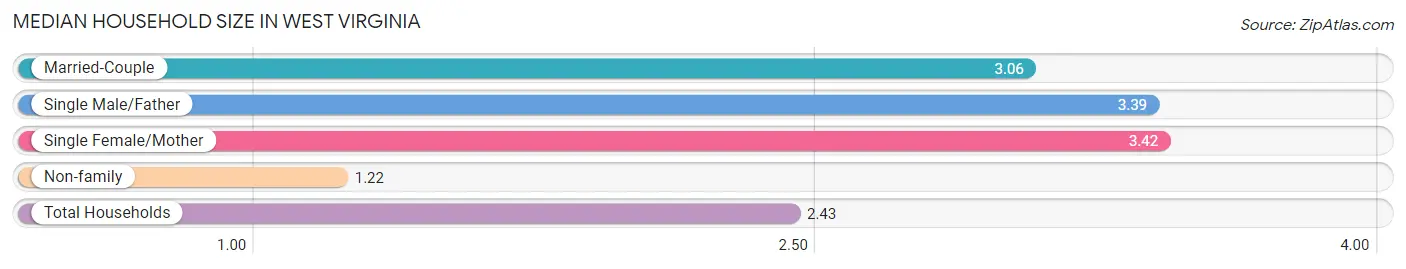
Median Household Size in West Virginia
The median household size in West Virginia is 2.43 persons per household, with single female/mother households (76,505 | 10.7%) accounting for the largest median household size of 3.42 persons per household. non-family households (266,336 | 37.2%) represent the smallest median household size with 1.22 persons per household.
| Household Type | # Households | Household Size |
| Married-Couple | 338,650 (47.3%) | 3.06 |
| Single Male/Father | 34,549 (4.8%) | 3.39 |
| Single Female/Mother | 76,505 (10.7%) | 3.42 |
| Non-family | 266,336 (37.2%) | 1.22 |
| Total Households | 716,040 (100.0%) | 2.43 |
Household Size by Marriage Status in West Virginia
Out of a total of 716,040 households in West Virginia, 449,704 (62.8%) are family households, while 266,336 (37.2%) are nonfamily households. The most numerous type of family households are 2-person households, comprising 225,541, and the most common type of nonfamily households are 1-person households, comprising 223,309.
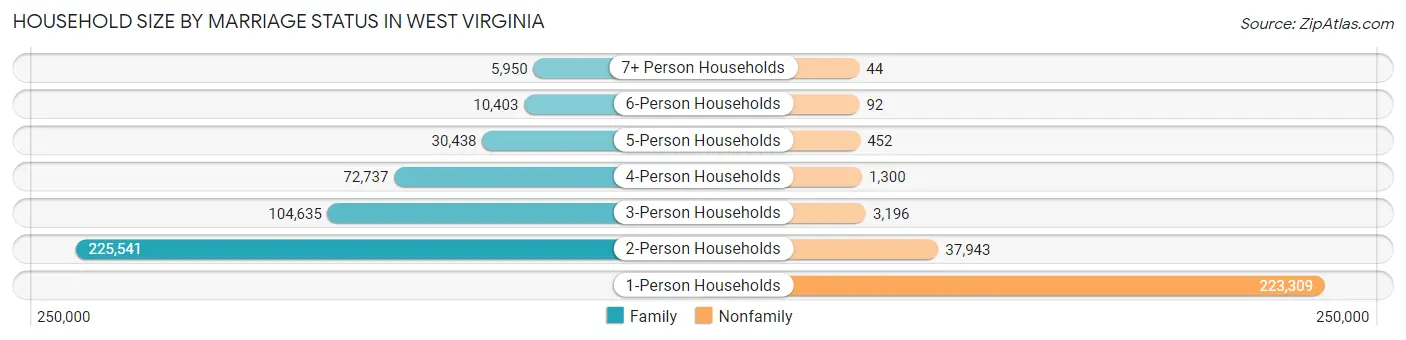
| Household Size | Family Households | Nonfamily Households |
| 1-Person Households | - | 223,309 (31.2%) |
| 2-Person Households | 225,541 (31.5%) | 37,943 (5.3%) |
| 3-Person Households | 104,635 (14.6%) | 3,196 (0.4%) |
| 4-Person Households | 72,737 (10.2%) | 1,300 (0.2%) |
| 5-Person Households | 30,438 (4.3%) | 452 (0.1%) |
| 6-Person Households | 10,403 (1.5%) | 92 (0.0%) |
| 7+ Person Households | 5,950 (0.8%) | 44 (0.0%) |
| Total | 449,704 (62.8%) | 266,336 (37.2%) |
Female Fertility in West Virginia
Fertility by Age in West Virginia
Average fertility rate in West Virginia is 49.0 births per 1,000 women. Women in the age bracket of 20 to 34 years have the highest fertility rate with 95.0 births per 1,000 women. Women in the age bracket of 20 to 34 years acount for 78.5% of all women with births.
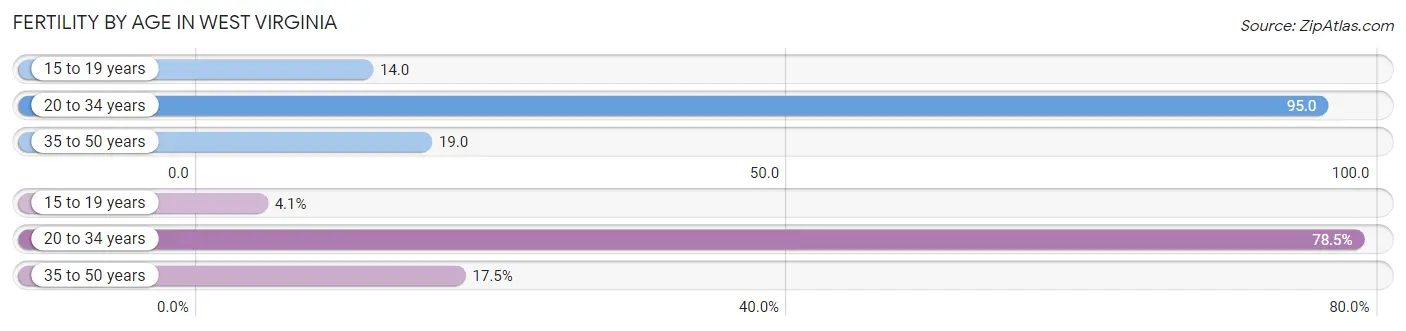
| Age Bracket | Women with Births | Births / 1,000 Women |
| 15 to 19 years | 763 (4.1%) | 14.0 |
| 20 to 34 years | 14,787 (78.5%) | 95.0 |
| 35 to 50 years | 3,294 (17.5%) | 19.0 |
| Total | 18,844 (100.0%) | 49.0 |
Fertility by Age by Marriage Status in West Virginia
60.5% of women with births (18,844) in West Virginia are married. The highest percentage of unmarried women with births falls into 15 to 19 years age bracket with 84.3% of them unmarried at the time of birth, while the lowest percentage of unmarried women with births belong to 35 to 50 years age bracket with 28.5% of them unmarried.
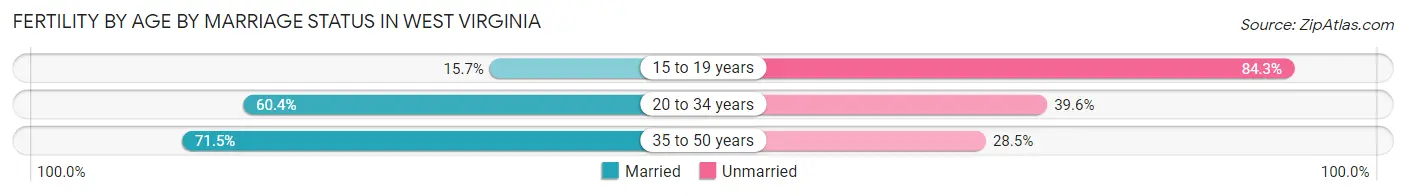
| Age Bracket | Married | Unmarried |
| 15 to 19 years | 120 (15.7%) | 643 (84.3%) |
| 20 to 34 years | 8,931 (60.4%) | 5,856 (39.6%) |
| 35 to 50 years | 2,355 (71.5%) | 939 (28.5%) |
| Total | 11,401 (60.5%) | 7,443 (39.5%) |
Fertility by Education in West Virginia
Average fertility rate in West Virginia is 49.0 births per 1,000 women. Women with the education attainment of high school diploma have the highest fertility rate of 61.0 births per 1,000 women, while women with the education attainment of less than high school have the lowest fertility at 29.0 births per 1,000 women. Women with the education attainment of high school diploma represent 34.9% of all women with births.
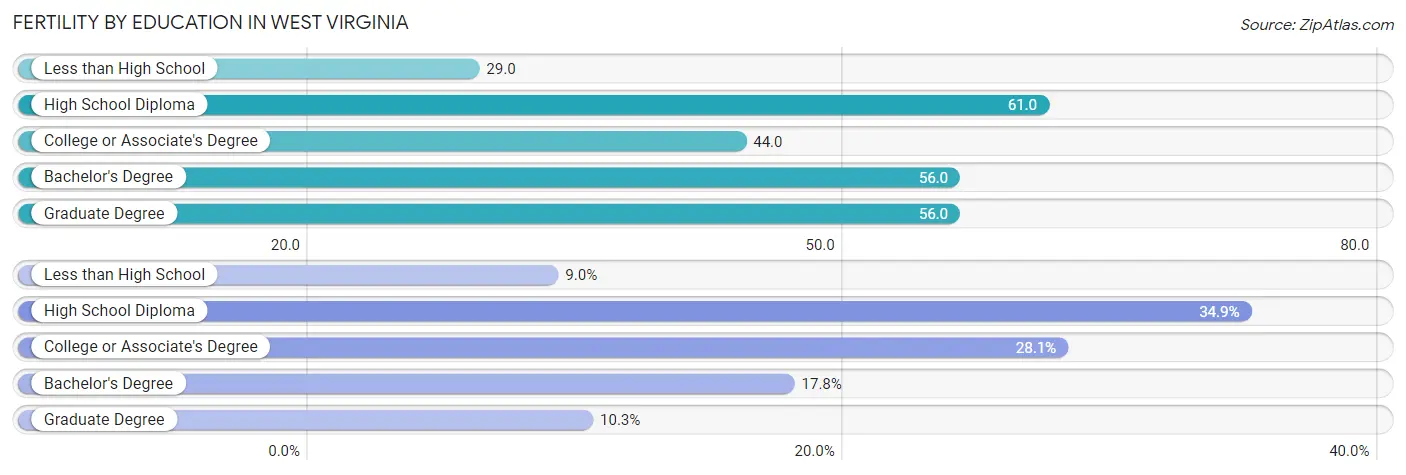
| Educational Attainment | Women with Births | Births / 1,000 Women |
| Less than High School | 1,689 (9.0%) | 29.0 |
| High School Diploma | 6,581 (34.9%) | 61.0 |
| College or Associate's Degree | 5,285 (28.1%) | 44.0 |
| Bachelor's Degree | 3,356 (17.8%) | 56.0 |
| Graduate Degree | 1,933 (10.3%) | 56.0 |
| Total | 18,844 (100.0%) | 49.0 |
Fertility by Education by Marriage Status in West Virginia
39.5% of women with births in West Virginia are unmarried. Women with the educational attainment of graduate degree are most likely to be married with 91.3% of them married at childbirth, while women with the educational attainment of less than high school are least likely to be married with 53.6% of them unmarried at childbirth.
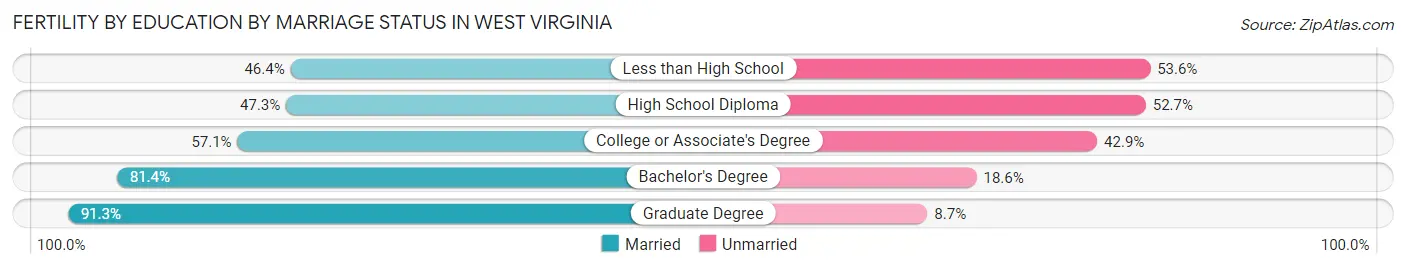
| Educational Attainment | Married | Unmarried |
| Less than High School | 784 (46.4%) | 905 (53.6%) |
| High School Diploma | 3,113 (47.3%) | 3,468 (52.7%) |
| College or Associate's Degree | 3,018 (57.1%) | 2,267 (42.9%) |
| Bachelor's Degree | 2,732 (81.4%) | 624 (18.6%) |
| Graduate Degree | 1,765 (91.3%) | 168 (8.7%) |
| Total | 11,401 (60.5%) | 7,443 (39.5%) |
Employment Characteristics in West Virginia
Employment by Class of Employer in West Virginia
Among the 723,217 employed individuals in West Virginia, private company employees (470,287 | 65.0%), not-for-profit organizations (60,277 | 8.3%), and state government employees (58,371 | 8.1%) make up the most common classes of employment.
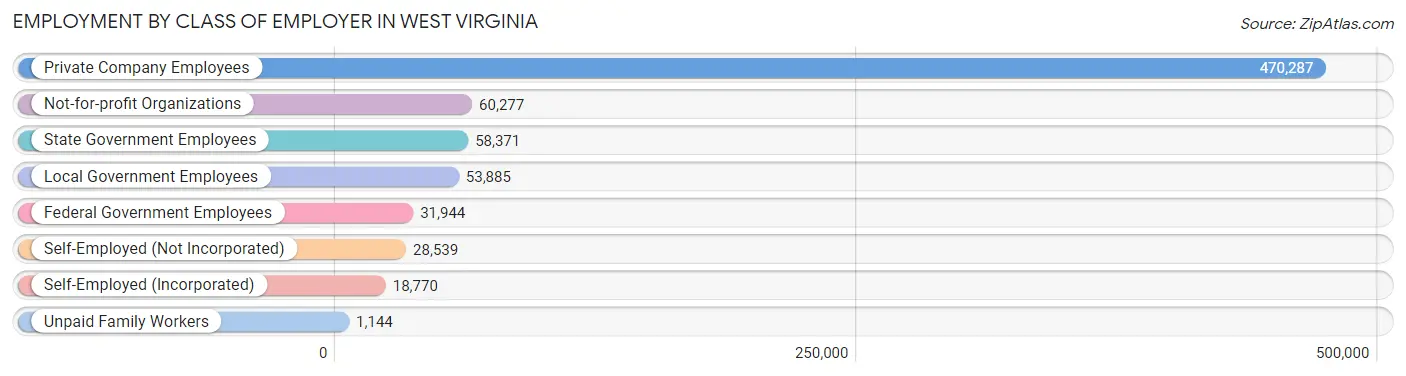
| Employer Class | # Employees | % Employees |
| Private Company Employees | 470,287 | 65.0% |
| Self-Employed (Incorporated) | 18,770 | 2.6% |
| Self-Employed (Not Incorporated) | 28,539 | 4.0% |
| Not-for-profit Organizations | 60,277 | 8.3% |
| Local Government Employees | 53,885 | 7.4% |
| State Government Employees | 58,371 | 8.1% |
| Federal Government Employees | 31,944 | 4.4% |
| Unpaid Family Workers | 1,144 | 0.2% |
| Total | 723,217 | 100.0% |
Employment Status by Age in West Virginia
According to the labor force statistics for West Virginia, out of the total population over 16 years of age (1,476,838), 53.2% or 785,678 individuals are in the labor force, with 6.1% or 47,926 of them unemployed. The age group with the highest labor force participation rate is 25 to 29 years, with 76.1% or 81,455 individuals in the labor force. Within the labor force, the 16 to 19 years age range has the highest percentage of unemployed individuals, with 18.9% or 6,251 of them being unemployed.
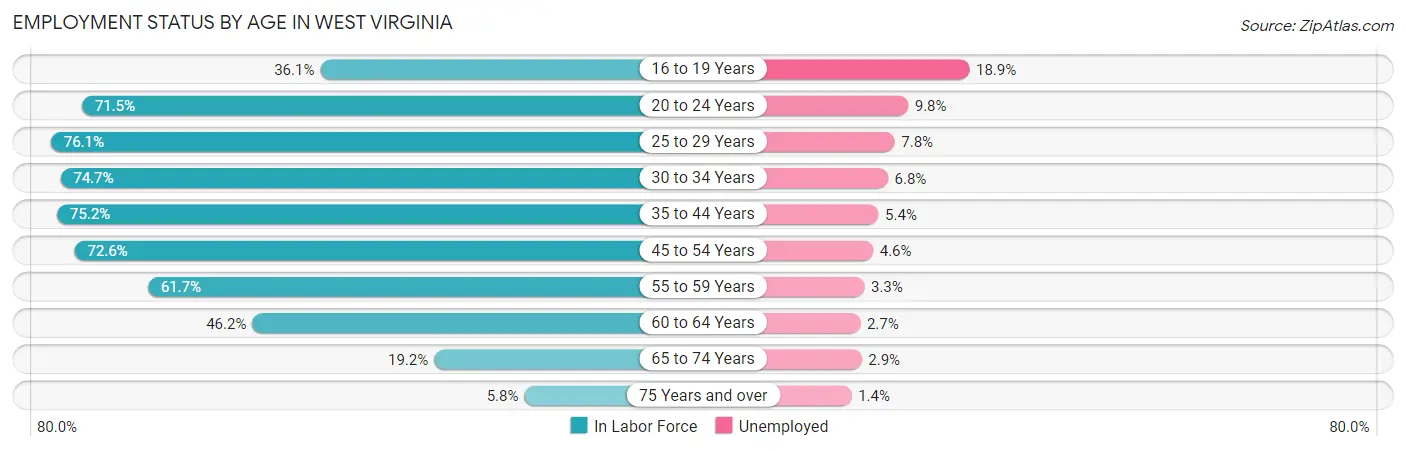
| Age Bracket | In Labor Force | Unemployed |
| 16 to 19 Years | 33,074 (36.1%) | 6,251 (18.9%) |
| 20 to 24 Years | 81,289 (71.5%) | 7,966 (9.8%) |
| 25 to 29 Years | 81,455 (76.1%) | 6,353 (7.8%) |
| 30 to 34 Years | 77,600 (74.7%) | 5,277 (6.8%) |
| 35 to 44 Years | 161,768 (75.2%) | 8,735 (5.4%) |
| 45 to 54 Years | 165,599 (72.6%) | 7,618 (4.6%) |
| 55 to 59 Years | 74,645 (61.7%) | 2,463 (3.3%) |
| 60 to 64 Years | 60,047 (46.2%) | 1,621 (2.7%) |
| 65 to 74 Years | 42,187 (19.2%) | 1,223 (2.9%) |
| 75 Years and over | 8,510 (5.8%) | 119 (1.4%) |
| Total | 785,678 (53.2%) | 47,926 (6.1%) |
Employment Status by Educational Attainment in West Virginia
According to labor force statistics for West Virginia, 68.6% of individuals (620,888) out of the total population between 25 and 64 years of age (905,085) are in the labor force, with 5.2% or 32,286 of them being unemployed. The group with the highest labor force participation rate are those with the educational attainment of bachelor's degree or higher, with 84.6% or 183,832 individuals in the labor force. Within the labor force, individuals with less than high school education have the highest percentage of unemployment, with 12.9% or 4,648 of them being unemployed.
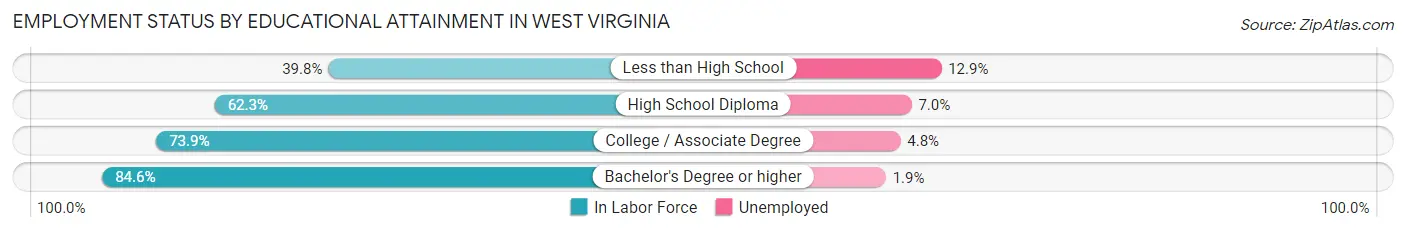
| Educational Attainment | In Labor Force | Unemployed |
| Less than High School | 36,031 (39.8%) | 11,678 (12.9%) |
| High School Diploma | 215,071 (62.3%) | 24,165 (7.0%) |
| College / Associate Degree | 186,260 (73.9%) | 12,098 (4.8%) |
| Bachelor's Degree or higher | 183,832 (84.6%) | 4,129 (1.9%) |
| Total | 620,888 (68.6%) | 47,064 (5.2%) |
Employment Occupations by Sex in West Virginia
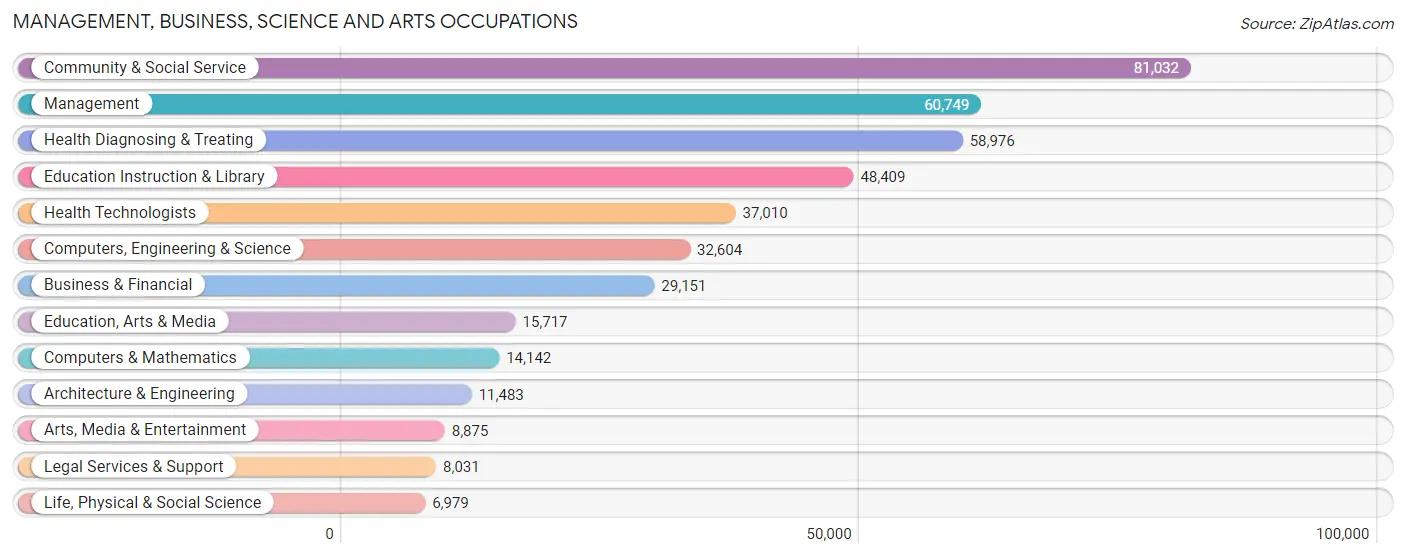
Management, Business, Science and Arts Occupations
The most common Management, Business, Science and Arts occupations in West Virginia are Community & Social Service (81,032 | 11.0%), Management (60,749 | 8.3%), Health Diagnosing & Treating (58,976 | 8.0%), Education Instruction & Library (48,409 | 6.6%), and Health Technologists (37,010 | 5.0%).
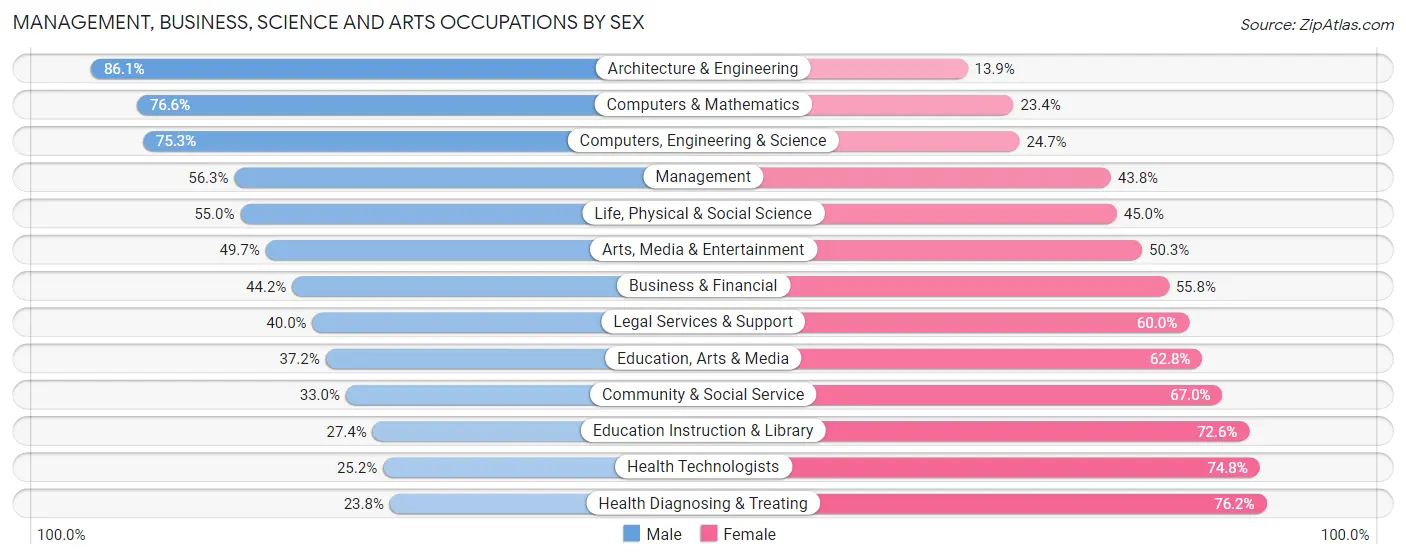
Management, Business, Science and Arts Occupations by Sex
Within the Management, Business, Science and Arts occupations in West Virginia, the most male-oriented occupations are Architecture & Engineering (86.1%), Computers & Mathematics (76.6%), and Computers, Engineering & Science (75.3%), while the most female-oriented occupations are Health Diagnosing & Treating (76.2%), Health Technologists (74.8%), and Education Instruction & Library (72.6%).
| Occupation | Male | Female |
| Management | 34,171 (56.2%) | 26,578 (43.8%) |
| Business & Financial | 12,882 (44.2%) | 16,269 (55.8%) |
| Computers, Engineering & Science | 24,559 (75.3%) | 8,045 (24.7%) |
| Computers & Mathematics | 10,828 (76.6%) | 3,314 (23.4%) |
| Architecture & Engineering | 9,891 (86.1%) | 1,592 (13.9%) |
| Life, Physical & Social Science | 3,840 (55.0%) | 3,139 (45.0%) |
| Community & Social Service | 26,744 (33.0%) | 54,288 (67.0%) |
| Education, Arts & Media | 5,850 (37.2%) | 9,867 (62.8%) |
| Legal Services & Support | 3,209 (40.0%) | 4,822 (60.0%) |
| Education Instruction & Library | 13,271 (27.4%) | 35,138 (72.6%) |
| Arts, Media & Entertainment | 4,414 (49.7%) | 4,461 (50.3%) |
| Health Diagnosing & Treating | 14,054 (23.8%) | 44,922 (76.2%) |
| Health Technologists | 9,342 (25.2%) | 27,668 (74.8%) |
| Total (Category) | 112,410 (42.8%) | 150,102 (57.2%) |
| Total (Overall) | 388,757 (52.8%) | 347,455 (47.2%) |
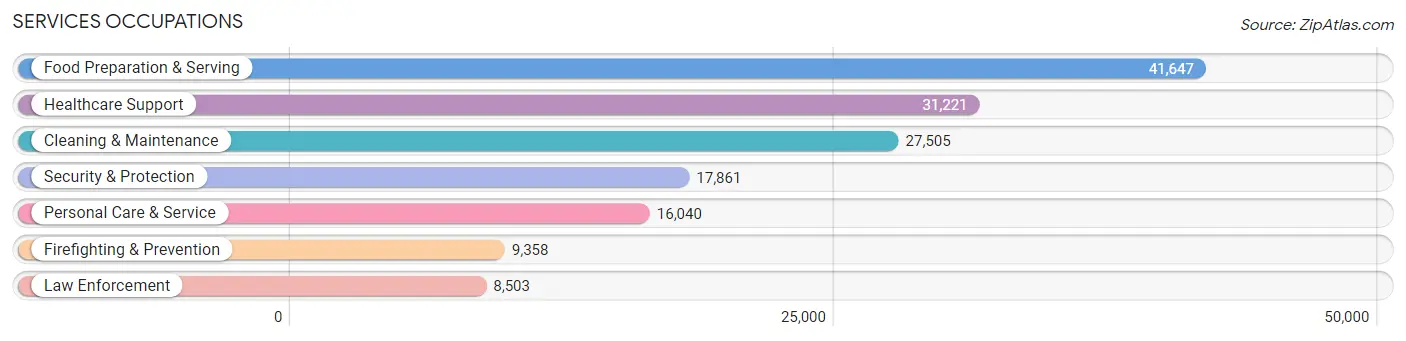
Services Occupations
The most common Services occupations in West Virginia are Food Preparation & Serving (41,647 | 5.7%), Healthcare Support (31,221 | 4.2%), Cleaning & Maintenance (27,505 | 3.7%), Security & Protection (17,861 | 2.4%), and Personal Care & Service (16,040 | 2.2%).
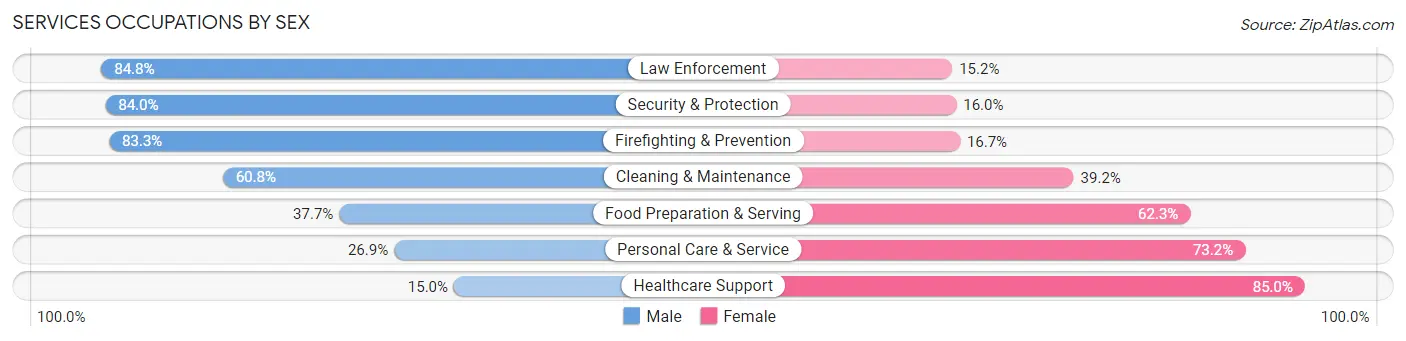
Services Occupations by Sex
Within the Services occupations in West Virginia, the most male-oriented occupations are Law Enforcement (84.8%), Security & Protection (84.0%), and Firefighting & Prevention (83.3%), while the most female-oriented occupations are Healthcare Support (85.0%), Personal Care & Service (73.2%), and Food Preparation & Serving (62.3%).
| Occupation | Male | Female |
| Healthcare Support | 4,683 (15.0%) | 26,538 (85.0%) |
| Security & Protection | 15,005 (84.0%) | 2,856 (16.0%) |
| Firefighting & Prevention | 7,794 (83.3%) | 1,564 (16.7%) |
| Law Enforcement | 7,211 (84.8%) | 1,292 (15.2%) |
| Food Preparation & Serving | 15,704 (37.7%) | 25,943 (62.3%) |
| Cleaning & Maintenance | 16,716 (60.8%) | 10,789 (39.2%) |
| Personal Care & Service | 4,306 (26.9%) | 11,734 (73.2%) |
| Total (Category) | 56,414 (42.0%) | 77,860 (58.0%) |
| Total (Overall) | 388,757 (52.8%) | 347,455 (47.2%) |
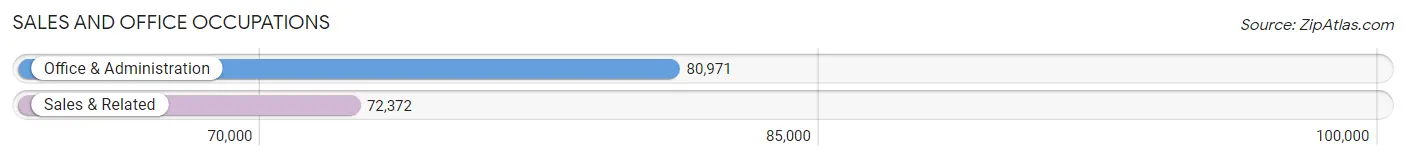
Sales and Office Occupations
The most common Sales and Office occupations in West Virginia are Office & Administration (80,971 | 11.0%), and Sales & Related (72,372 | 9.8%).
Sales and Office Occupations by Sex
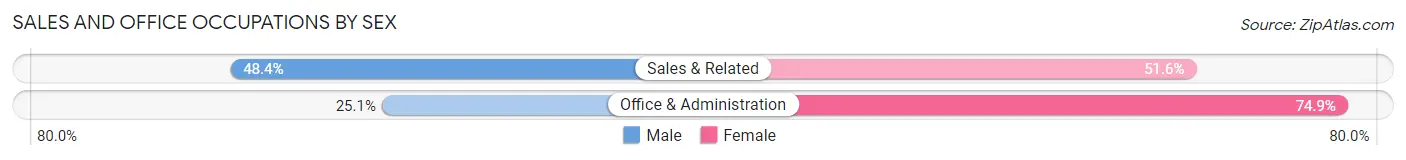
| Occupation | Male | Female |
| Sales & Related | 35,000 (48.4%) | 37,372 (51.6%) |
| Office & Administration | 20,288 (25.1%) | 60,683 (74.9%) |
| Total (Category) | 55,288 (36.1%) | 98,055 (63.9%) |
| Total (Overall) | 388,757 (52.8%) | 347,455 (47.2%) |
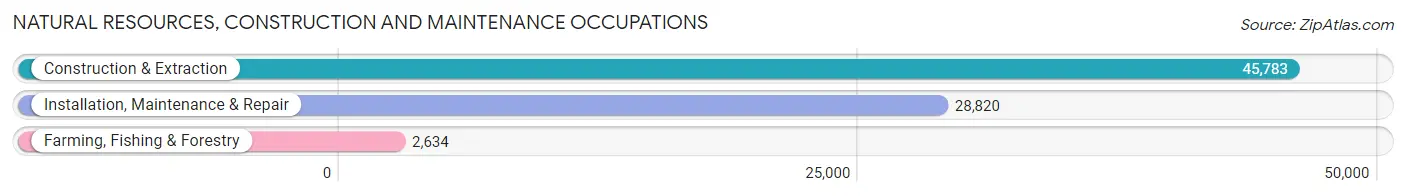
Natural Resources, Construction and Maintenance Occupations
The most common Natural Resources, Construction and Maintenance occupations in West Virginia are Construction & Extraction (45,783 | 6.2%), Installation, Maintenance & Repair (28,820 | 3.9%), and Farming, Fishing & Forestry (2,634 | 0.4%).
Natural Resources, Construction and Maintenance Occupations by Sex
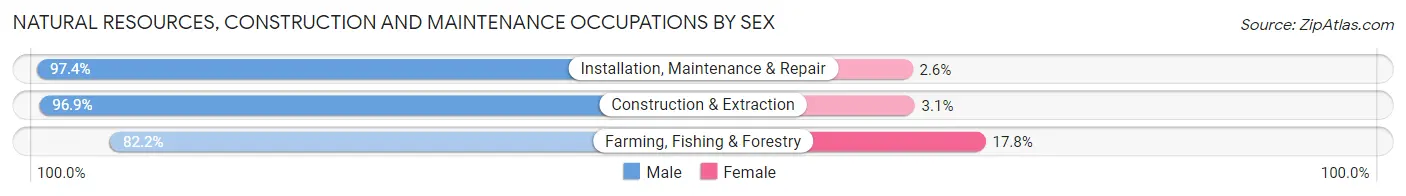
| Occupation | Male | Female |
| Farming, Fishing & Forestry | 2,165 (82.2%) | 469 (17.8%) |
| Construction & Extraction | 44,379 (96.9%) | 1,404 (3.1%) |
| Installation, Maintenance & Repair | 28,066 (97.4%) | 754 (2.6%) |
| Total (Category) | 74,610 (96.6%) | 2,627 (3.4%) |
| Total (Overall) | 388,757 (52.8%) | 347,455 (47.2%) |
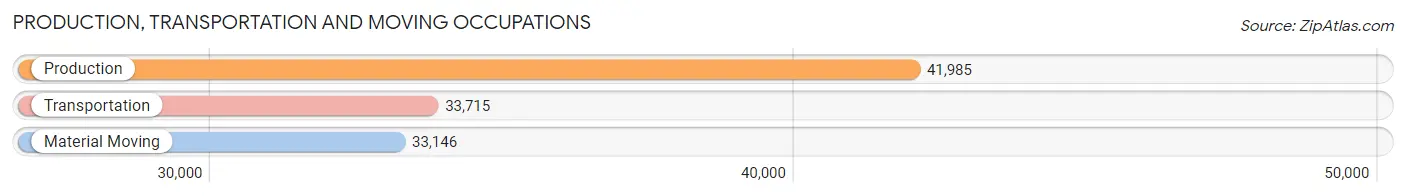
Production, Transportation and Moving Occupations
The most common Production, Transportation and Moving occupations in West Virginia are Production (41,985 | 5.7%), Transportation (33,715 | 4.6%), and Material Moving (33,146 | 4.5%).
Production, Transportation and Moving Occupations by Sex
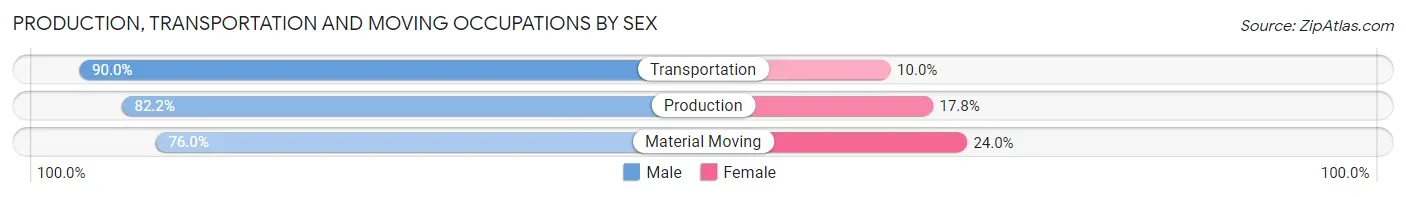
| Occupation | Male | Female |
| Production | 34,516 (82.2%) | 7,469 (17.8%) |
| Transportation | 30,336 (90.0%) | 3,379 (10.0%) |
| Material Moving | 25,183 (76.0%) | 7,963 (24.0%) |
| Total (Category) | 90,035 (82.7%) | 18,811 (17.3%) |
| Total (Overall) | 388,757 (52.8%) | 347,455 (47.2%) |
Employment Industries by Sex in West Virginia
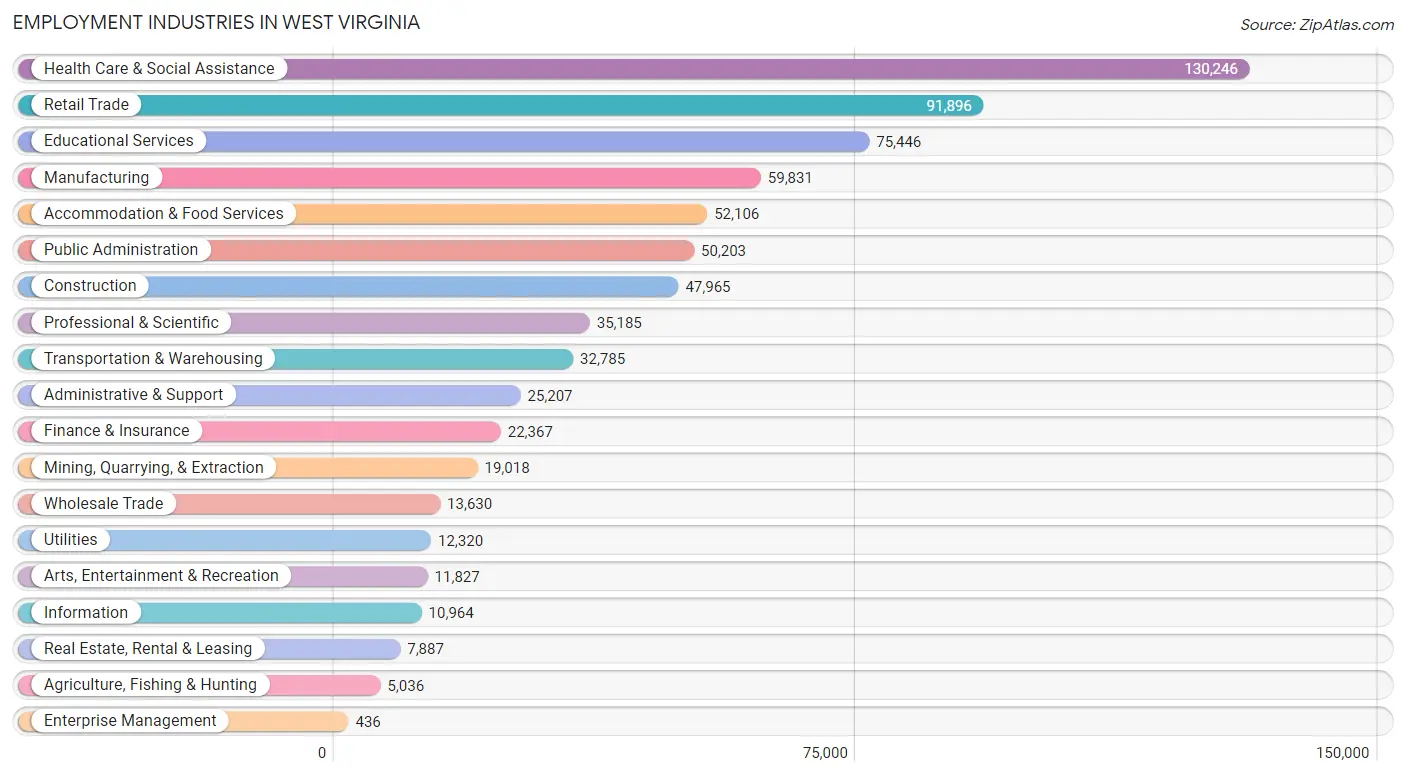
Employment Industries in West Virginia
The major employment industries in West Virginia include Health Care & Social Assistance (130,246 | 17.7%), Retail Trade (91,896 | 12.5%), Educational Services (75,446 | 10.2%), Manufacturing (59,831 | 8.1%), and Accommodation & Food Services (52,106 | 7.1%).
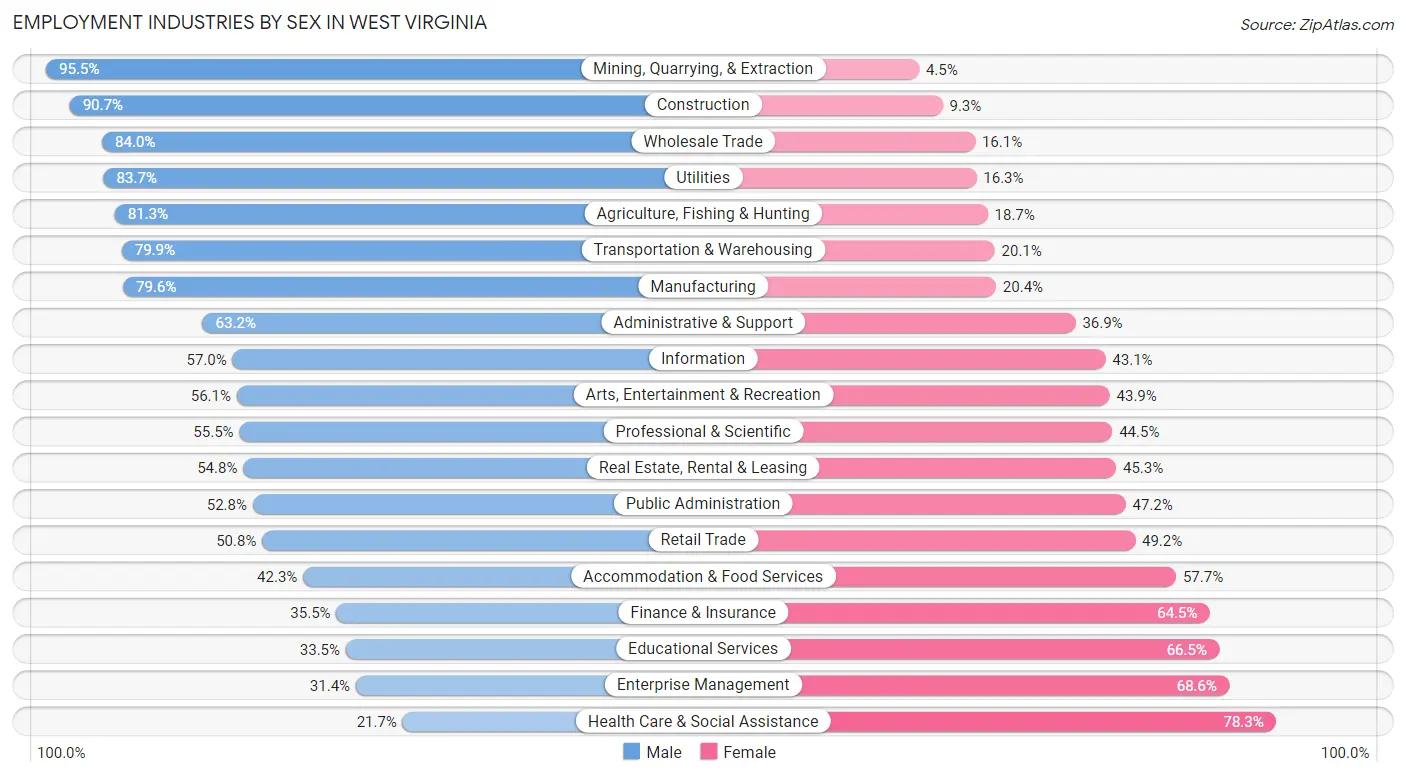
Employment Industries by Sex in West Virginia
The West Virginia industries that see more men than women are Mining, Quarrying, & Extraction (95.5%), Construction (90.7%), and Wholesale Trade (84.0%), whereas the industries that tend to have a higher number of women are Health Care & Social Assistance (78.3%), Enterprise Management (68.6%), and Educational Services (66.5%).
| Industry | Male | Female |
| Agriculture, Fishing & Hunting | 4,096 (81.3%) | 940 (18.7%) |
| Mining, Quarrying, & Extraction | 18,169 (95.5%) | 849 (4.5%) |
| Construction | 43,486 (90.7%) | 4,479 (9.3%) |
| Manufacturing | 47,638 (79.6%) | 12,193 (20.4%) |
| Wholesale Trade | 11,442 (84.0%) | 2,188 (16.1%) |
| Retail Trade | 46,691 (50.8%) | 45,205 (49.2%) |
| Transportation & Warehousing | 26,190 (79.9%) | 6,595 (20.1%) |
| Utilities | 10,307 (83.7%) | 2,013 (16.3%) |
| Information | 6,244 (57.0%) | 4,720 (43.0%) |
| Finance & Insurance | 7,931 (35.5%) | 14,436 (64.5%) |
| Real Estate, Rental & Leasing | 4,318 (54.7%) | 3,569 (45.3%) |
| Professional & Scientific | 19,542 (55.5%) | 15,643 (44.5%) |
| Enterprise Management | 137 (31.4%) | 299 (68.6%) |
| Administrative & Support | 15,917 (63.1%) | 9,290 (36.8%) |
| Educational Services | 25,275 (33.5%) | 50,171 (66.5%) |
| Health Care & Social Assistance | 28,319 (21.7%) | 101,927 (78.3%) |
| Arts, Entertainment & Recreation | 6,633 (56.1%) | 5,194 (43.9%) |
| Accommodation & Food Services | 22,063 (42.3%) | 30,043 (57.7%) |
| Public Administration | 26,491 (52.8%) | 23,712 (47.2%) |
| Total | 388,757 (52.8%) | 347,455 (47.2%) |
Education in West Virginia
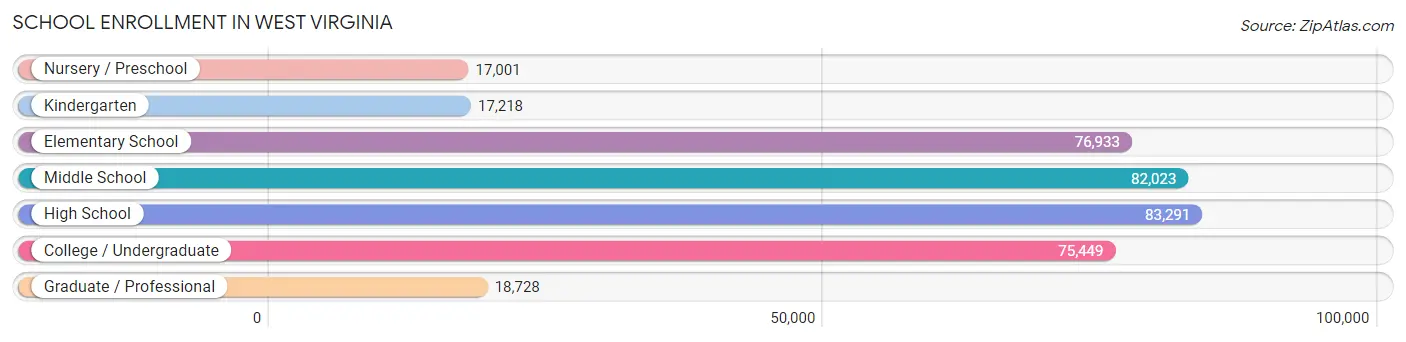
School Enrollment in West Virginia
The most common levels of schooling among the 370,643 students in West Virginia are high school (83,291 | 22.5%), middle school (82,023 | 22.1%), and elementary school (76,933 | 20.8%).
| School Level | # Students | % Students |
| Nursery / Preschool | 17,001 | 4.6% |
| Kindergarten | 17,218 | 4.6% |
| Elementary School | 76,933 | 20.8% |
| Middle School | 82,023 | 22.1% |
| High School | 83,291 | 22.5% |
| College / Undergraduate | 75,449 | 20.4% |
| Graduate / Professional | 18,728 | 5.1% |
| Total | 370,643 | 100.0% |
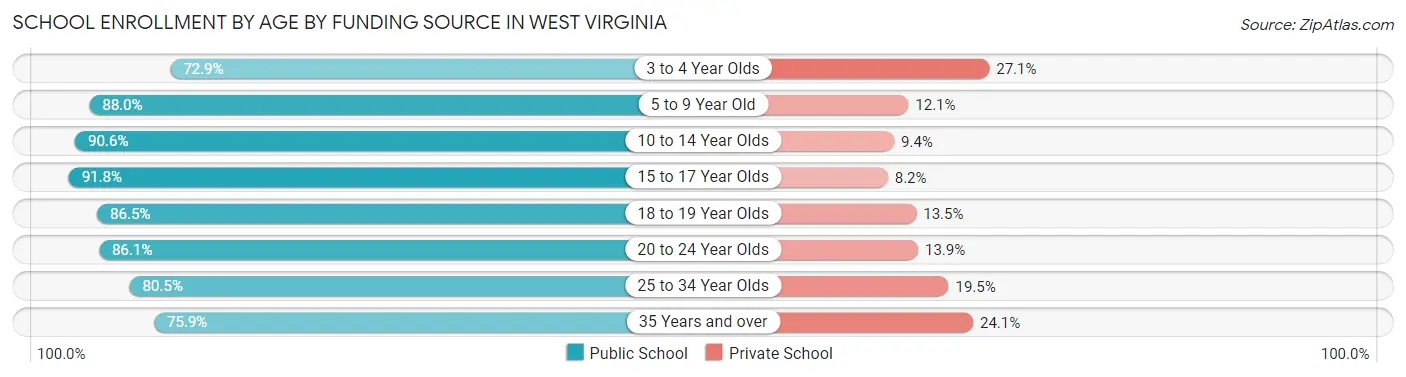
School Enrollment by Age by Funding Source in West Virginia
Out of a total of 370,643 students who are enrolled in schools in West Virginia, 45,589 (12.3%) attend a private institution, while the remaining 325,054 (87.7%) are enrolled in public schools. The age group of 3 to 4 year olds has the highest likelihood of being enrolled in private schools, with 2,796 (27.1% in the age bracket) enrolled. Conversely, the age group of 15 to 17 year olds has the lowest likelihood of being enrolled in a private school, with 56,074 (91.8% in the age bracket) attending a public institution.
| Age Bracket | Public School | Private School |
| 3 to 4 Year Olds | 7,510 (72.9%) | 2,796 (27.1%) |
| 5 to 9 Year Old | 78,542 (87.9%) | 10,764 (12.0%) |
| 10 to 14 Year Olds | 91,887 (90.6%) | 9,532 (9.4%) |
| 15 to 17 Year Olds | 56,074 (91.8%) | 5,022 (8.2%) |
| 18 to 19 Year Olds | 29,319 (86.5%) | 4,583 (13.5%) |
| 20 to 24 Year Olds | 35,493 (86.1%) | 5,709 (13.9%) |
| 25 to 34 Year Olds | 14,671 (80.5%) | 3,564 (19.5%) |
| 35 Years and over | 11,520 (75.9%) | 3,657 (24.1%) |
| Total | 325,054 (87.7%) | 45,589 (12.3%) |
Educational Attainment by Field of Study in West Virginia
Education (59,669 | 19.2%), business (53,317 | 17.1%), science & technology (42,158 | 13.5%), arts & humanities (22,901 | 7.3%), and bio, nature & agricultural (21,581 | 6.9%) are the most common fields of study among 311,538 individuals in West Virginia who have obtained a bachelor's degree or higher.
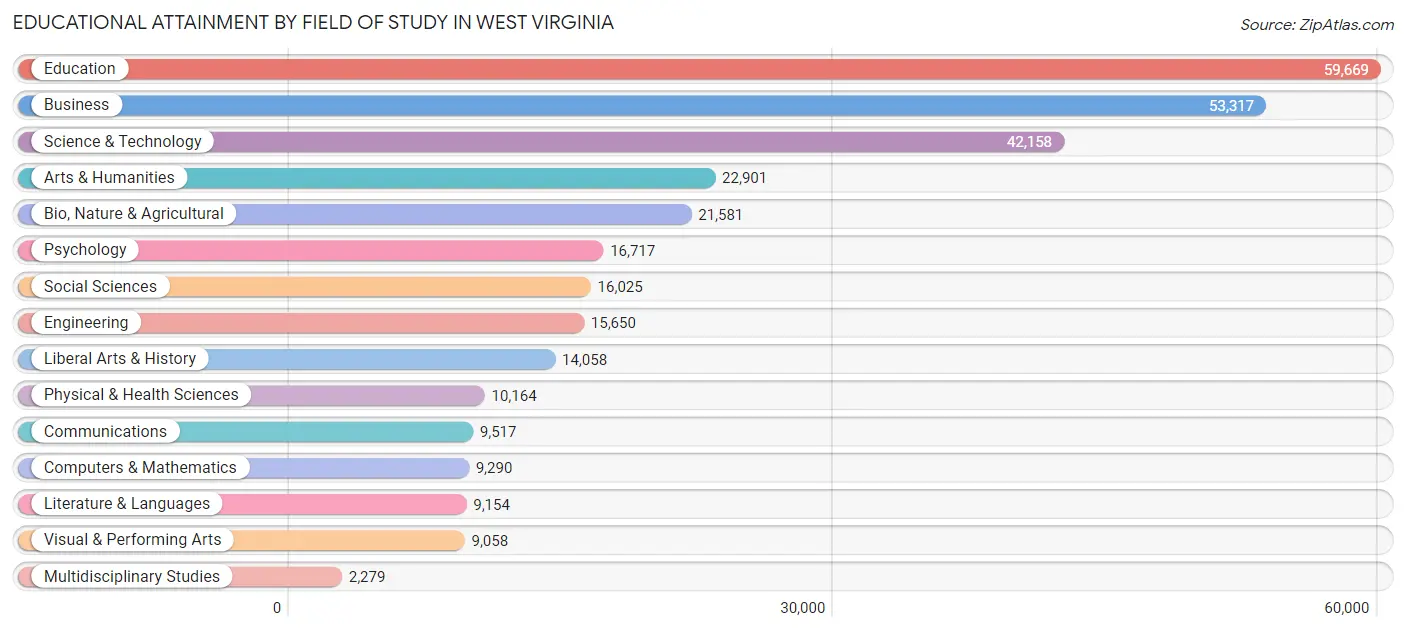
| Field of Study | # Graduates | % Graduates |
| Computers & Mathematics | 9,290 | 3.0% |
| Bio, Nature & Agricultural | 21,581 | 6.9% |
| Physical & Health Sciences | 10,164 | 3.3% |
| Psychology | 16,717 | 5.4% |
| Social Sciences | 16,025 | 5.1% |
| Engineering | 15,650 | 5.0% |
| Multidisciplinary Studies | 2,279 | 0.7% |
| Science & Technology | 42,158 | 13.5% |
| Business | 53,317 | 17.1% |
| Education | 59,669 | 19.2% |
| Literature & Languages | 9,154 | 2.9% |
| Liberal Arts & History | 14,058 | 4.5% |
| Visual & Performing Arts | 9,058 | 2.9% |
| Communications | 9,517 | 3.0% |
| Arts & Humanities | 22,901 | 7.3% |
| Total | 311,538 | 100.0% |
Transportation & Commute in West Virginia
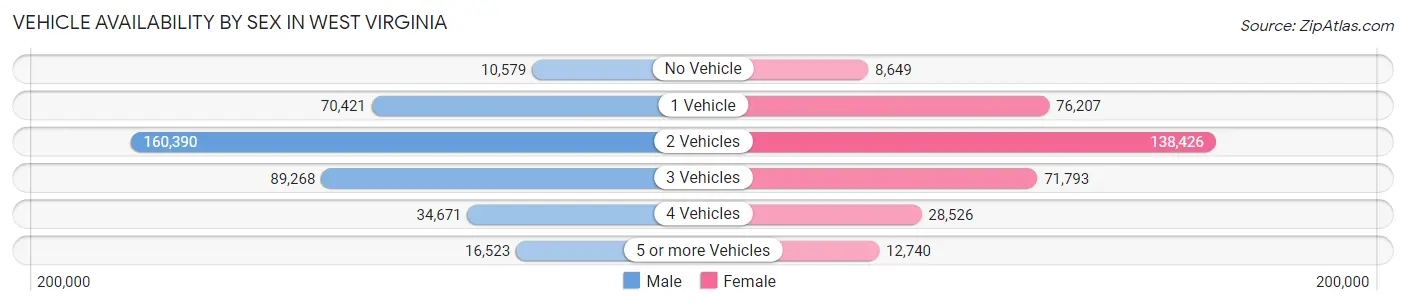
Vehicle Availability by Sex in West Virginia
The most prevalent vehicle ownership categories in West Virginia are males with 2 vehicles (160,390, accounting for 42.0%) and females with 2 vehicles (138,426, making up 47.7%).
| Vehicles Available | Male | Female |
| No Vehicle | 10,579 (2.8%) | 8,649 (2.6%) |
| 1 Vehicle | 70,421 (18.4%) | 76,207 (22.7%) |
| 2 Vehicles | 160,390 (42.0%) | 138,426 (41.2%) |
| 3 Vehicles | 89,268 (23.4%) | 71,793 (21.3%) |
| 4 Vehicles | 34,671 (9.1%) | 28,526 (8.5%) |
| 5 or more Vehicles | 16,523 (4.3%) | 12,740 (3.8%) |
| Total | 381,852 (100.0%) | 336,341 (100.0%) |
Commute Time in West Virginia
The most frequently occuring commute durations in West Virginia are 15 to 19 minutes (106,679 commuters, 15.8%), 20 to 24 minutes (98,717 commuters, 14.7%), and 10 to 14 minutes (96,313 commuters, 14.3%).
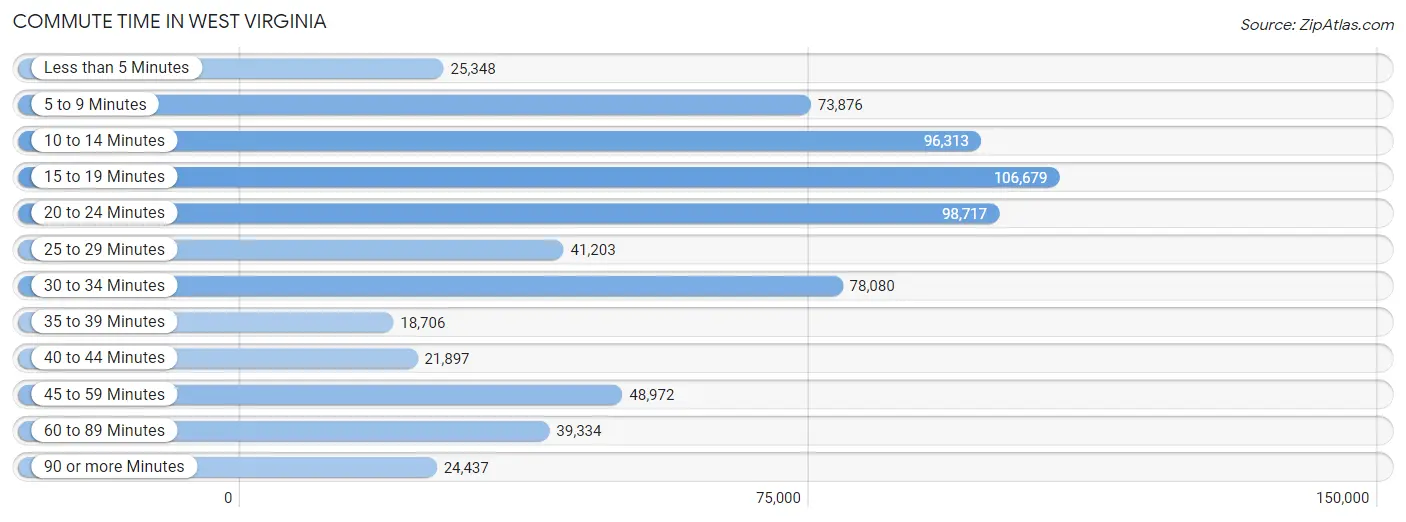
| Commute Time | # Commuters | % Commuters |
| Less than 5 Minutes | 25,348 | 3.8% |
| 5 to 9 Minutes | 73,876 | 11.0% |
| 10 to 14 Minutes | 96,313 | 14.3% |
| 15 to 19 Minutes | 106,679 | 15.8% |
| 20 to 24 Minutes | 98,717 | 14.7% |
| 25 to 29 Minutes | 41,203 | 6.1% |
| 30 to 34 Minutes | 78,080 | 11.6% |
| 35 to 39 Minutes | 18,706 | 2.8% |
| 40 to 44 Minutes | 21,897 | 3.3% |
| 45 to 59 Minutes | 48,972 | 7.3% |
| 60 to 89 Minutes | 39,334 | 5.8% |
| 90 or more Minutes | 24,437 | 3.6% |
Commute Time by Sex in West Virginia
The most common commute times in West Virginia are 15 to 19 minutes (52,440 commuters, 14.5%) for males and 15 to 19 minutes (54,239 commuters, 17.4%) for females.
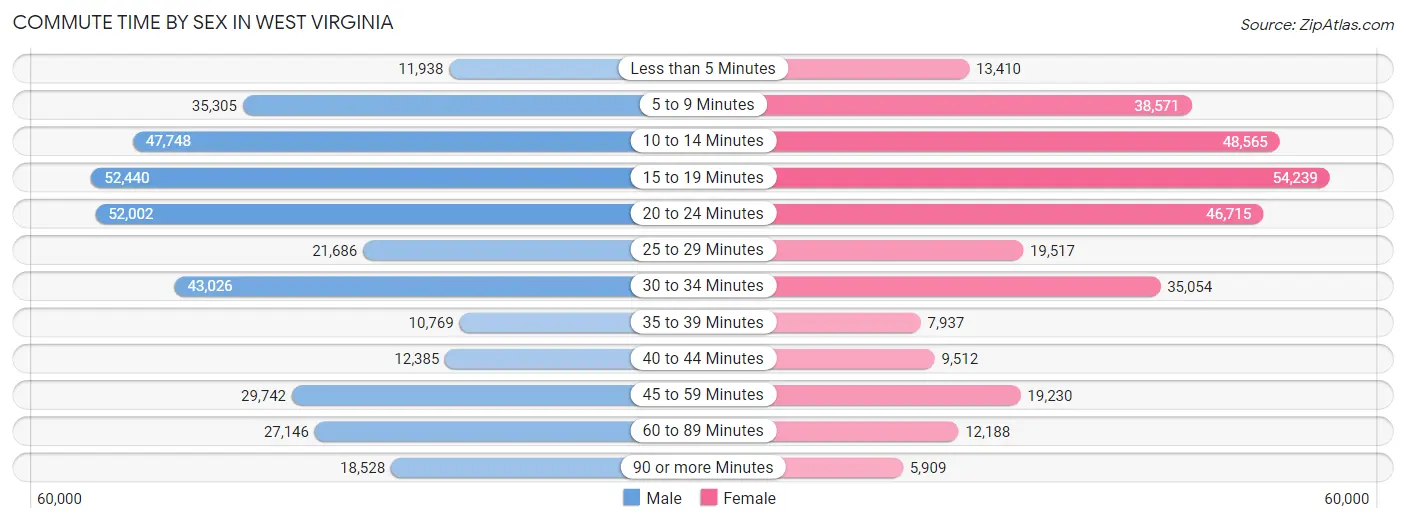
| Commute Time | Male | Female |
| Less than 5 Minutes | 11,938 (3.3%) | 13,410 (4.3%) |
| 5 to 9 Minutes | 35,305 (9.7%) | 38,571 (12.4%) |
| 10 to 14 Minutes | 47,748 (13.2%) | 48,565 (15.6%) |
| 15 to 19 Minutes | 52,440 (14.5%) | 54,239 (17.4%) |
| 20 to 24 Minutes | 52,002 (14.3%) | 46,715 (15.0%) |
| 25 to 29 Minutes | 21,686 (6.0%) | 19,517 (6.3%) |
| 30 to 34 Minutes | 43,026 (11.9%) | 35,054 (11.3%) |
| 35 to 39 Minutes | 10,769 (3.0%) | 7,937 (2.5%) |
| 40 to 44 Minutes | 12,385 (3.4%) | 9,512 (3.1%) |
| 45 to 59 Minutes | 29,742 (8.2%) | 19,230 (6.2%) |
| 60 to 89 Minutes | 27,146 (7.5%) | 12,188 (3.9%) |
| 90 or more Minutes | 18,528 (5.1%) | 5,909 (1.9%) |
Time of Departure to Work by Sex in West Virginia
The most frequent times of departure to work in West Virginia are 7:00 AM to 7:29 AM (45,886, 12.7%) for males and 7:00 AM to 7:29 AM (49,009, 15.8%) for females.
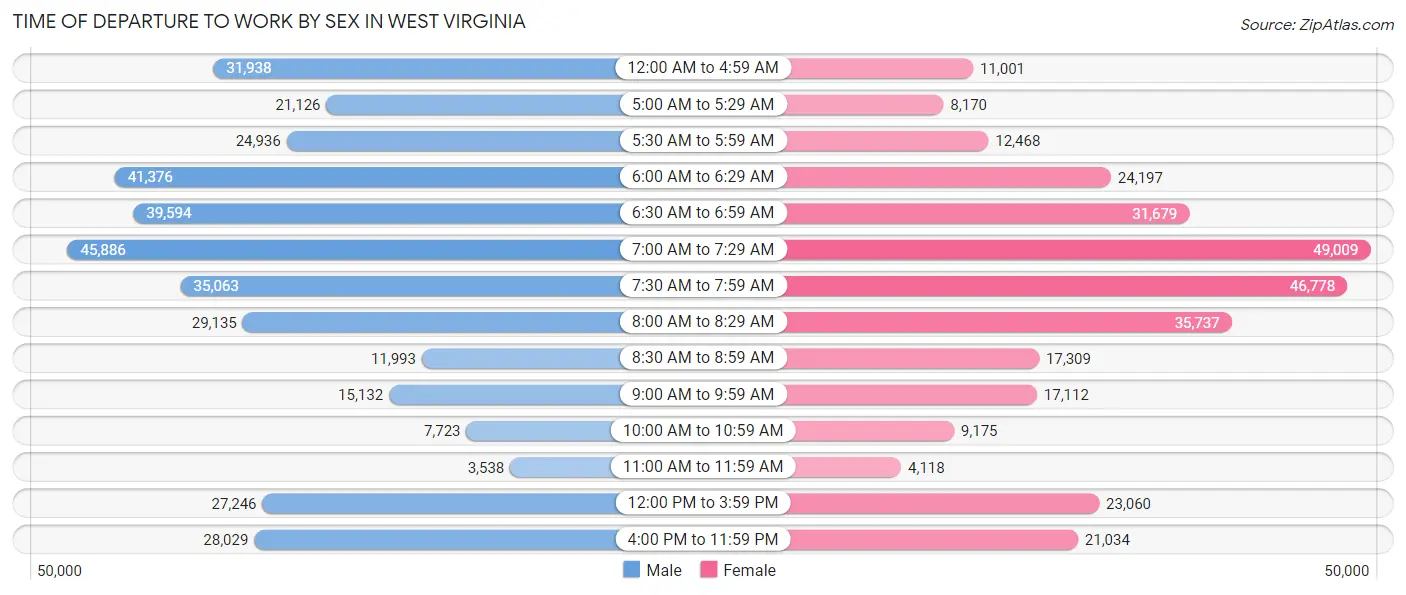
| Time of Departure | Male | Female |
| 12:00 AM to 4:59 AM | 31,938 (8.8%) | 11,001 (3.5%) |
| 5:00 AM to 5:29 AM | 21,126 (5.8%) | 8,170 (2.6%) |
| 5:30 AM to 5:59 AM | 24,936 (6.9%) | 12,468 (4.0%) |
| 6:00 AM to 6:29 AM | 41,376 (11.4%) | 24,197 (7.8%) |
| 6:30 AM to 6:59 AM | 39,594 (10.9%) | 31,679 (10.2%) |
| 7:00 AM to 7:29 AM | 45,886 (12.7%) | 49,009 (15.8%) |
| 7:30 AM to 7:59 AM | 35,063 (9.7%) | 46,778 (15.0%) |
| 8:00 AM to 8:29 AM | 29,135 (8.0%) | 35,737 (11.5%) |
| 8:30 AM to 8:59 AM | 11,993 (3.3%) | 17,309 (5.6%) |
| 9:00 AM to 9:59 AM | 15,132 (4.2%) | 17,112 (5.5%) |
| 10:00 AM to 10:59 AM | 7,723 (2.1%) | 9,175 (2.9%) |
| 11:00 AM to 11:59 AM | 3,538 (1.0%) | 4,118 (1.3%) |
| 12:00 PM to 3:59 PM | 27,246 (7.5%) | 23,060 (7.4%) |
| 4:00 PM to 11:59 PM | 28,029 (7.7%) | 21,034 (6.8%) |
| Total | 362,715 (100.0%) | 310,847 (100.0%) |
Housing Occupancy in West Virginia
Occupancy by Ownership in West Virginia
Of the total 716,040 dwellings in West Virginia, owner-occupied units account for 531,027 (74.2%), while renter-occupied units make up 185,013 (25.8%).
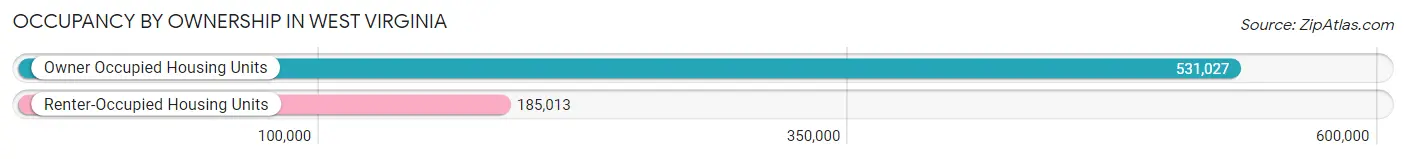
| Occupancy | # Housing Units | % Housing Units |
| Owner Occupied Housing Units | 531,027 | 74.2% |
| Renter-Occupied Housing Units | 185,013 | 25.8% |
| Total Occupied Housing Units | 716,040 | 100.0% |
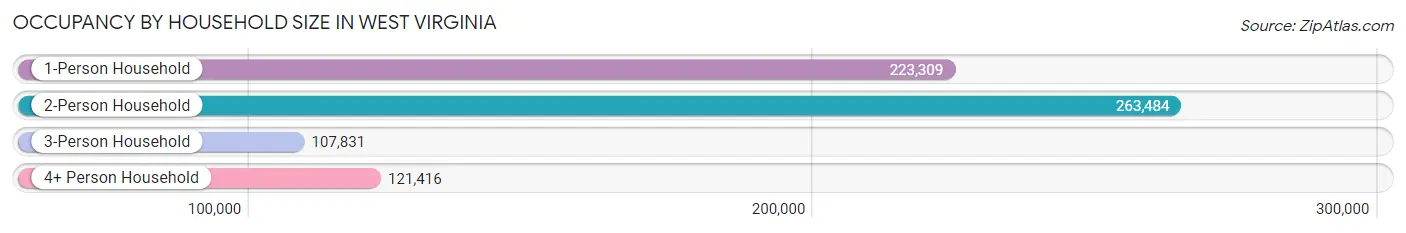
Occupancy by Household Size in West Virginia
| Household Size | # Housing Units | % Housing Units |
| 1-Person Household | 223,309 | 31.2% |
| 2-Person Household | 263,484 | 36.8% |
| 3-Person Household | 107,831 | 15.1% |
| 4+ Person Household | 121,416 | 17.0% |
| Total Housing Units | 716,040 | 100.0% |
Occupancy by Ownership by Household Size in West Virginia
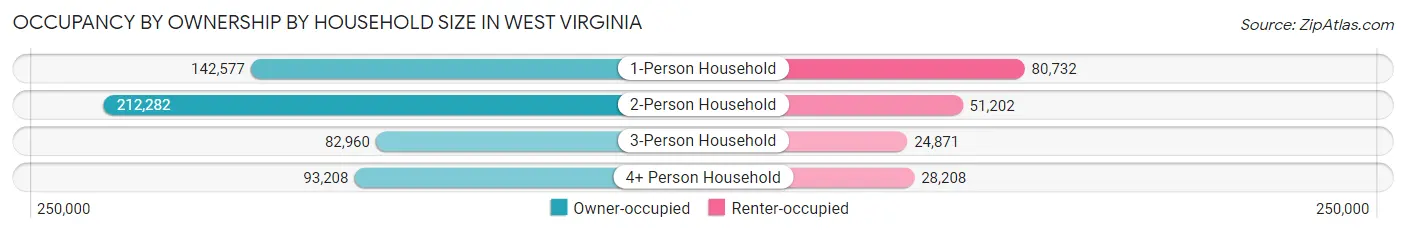
| Household Size | Owner-occupied | Renter-occupied |
| 1-Person Household | 142,577 (63.8%) | 80,732 (36.1%) |
| 2-Person Household | 212,282 (80.6%) | 51,202 (19.4%) |
| 3-Person Household | 82,960 (76.9%) | 24,871 (23.1%) |
| 4+ Person Household | 93,208 (76.8%) | 28,208 (23.2%) |
| Total Housing Units | 531,027 (74.2%) | 185,013 (25.8%) |
Occupancy by Educational Attainment in West Virginia
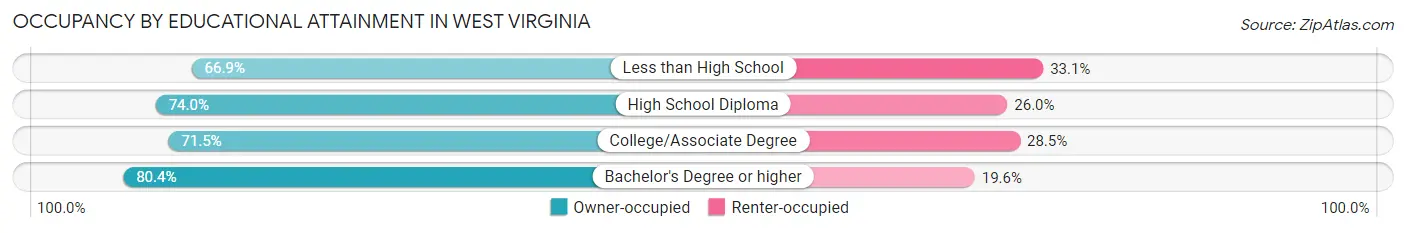
| Household Size | Owner-occupied | Renter-occupied |
| Less than High School | 48,647 (66.9%) | 24,090 (33.1%) |
| High School Diploma | 193,555 (74.0%) | 68,052 (26.0%) |
| College/Associate Degree | 145,260 (71.5%) | 57,962 (28.5%) |
| Bachelor's Degree or higher | 143,565 (80.4%) | 34,909 (19.6%) |
Occupancy by Age of Householder in West Virginia
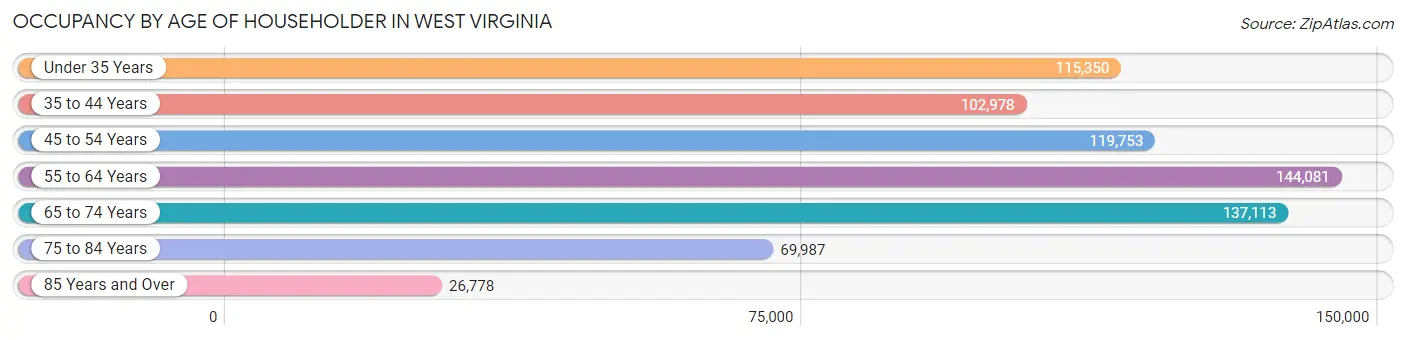
| Age Bracket | # Households | % Households |
| Under 35 Years | 115,350 | 16.1% |
| 35 to 44 Years | 102,978 | 14.4% |
| 45 to 54 Years | 119,753 | 16.7% |
| 55 to 64 Years | 144,081 | 20.1% |
| 65 to 74 Years | 137,113 | 19.2% |
| 75 to 84 Years | 69,987 | 9.8% |
| 85 Years and Over | 26,778 | 3.7% |
| Total | 716,040 | 100.0% |
Housing Finances in West Virginia
Median Income by Occupancy in West Virginia
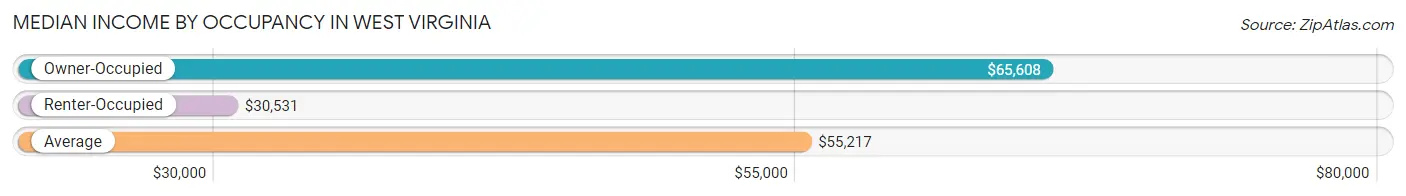
| Occupancy Type | # Households | Median Income |
| Owner-Occupied | 531,027 (74.2%) | $65,608 |
| Renter-Occupied | 185,013 (25.8%) | $30,531 |
| Average | 716,040 (100.0%) | $55,217 |
Occupancy by Householder Income Bracket in West Virginia
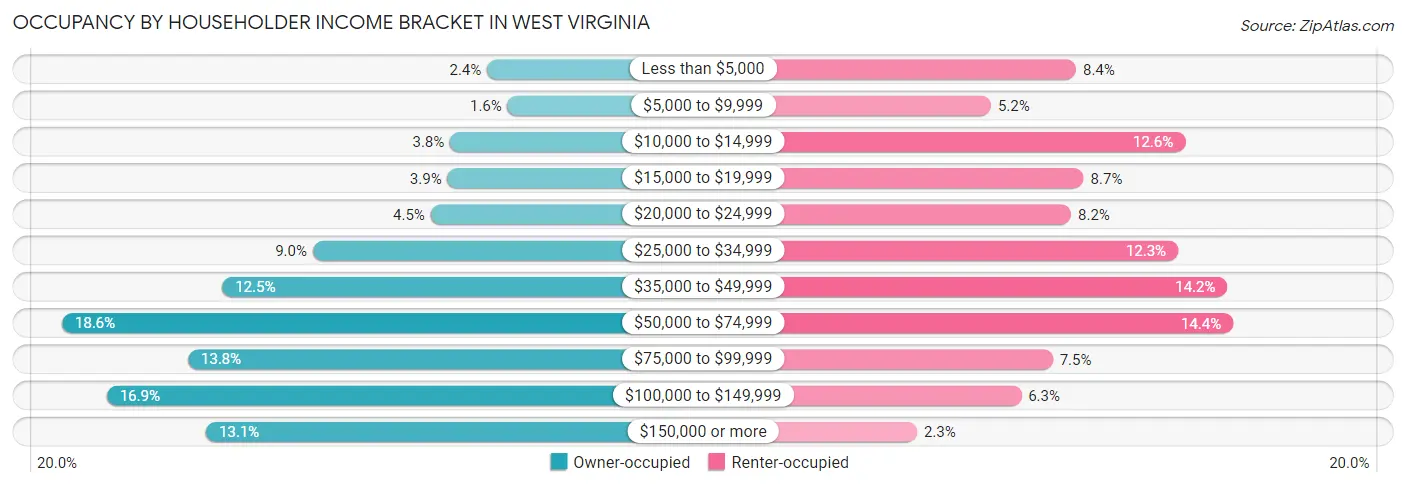
| Income Bracket | Owner-occupied | Renter-occupied |
| Less than $5,000 | 12,633 (2.4%) | 15,542 (8.4%) |
| $5,000 to $9,999 | 8,476 (1.6%) | 9,552 (5.2%) |
| $10,000 to $14,999 | 20,147 (3.8%) | 23,217 (12.6%) |
| $15,000 to $19,999 | 20,653 (3.9%) | 16,071 (8.7%) |
| $20,000 to $24,999 | 24,037 (4.5%) | 15,186 (8.2%) |
| $25,000 to $34,999 | 47,908 (9.0%) | 22,726 (12.3%) |
| $35,000 to $49,999 | 66,212 (12.5%) | 26,206 (14.2%) |
| $50,000 to $74,999 | 98,653 (18.6%) | 26,610 (14.4%) |
| $75,000 to $99,999 | 73,167 (13.8%) | 13,893 (7.5%) |
| $100,000 to $149,999 | 89,609 (16.9%) | 11,677 (6.3%) |
| $150,000 or more | 69,532 (13.1%) | 4,333 (2.3%) |
| Total | 531,027 (100.0%) | 185,013 (100.0%) |
Monthly Housing Cost Tiers in West Virginia
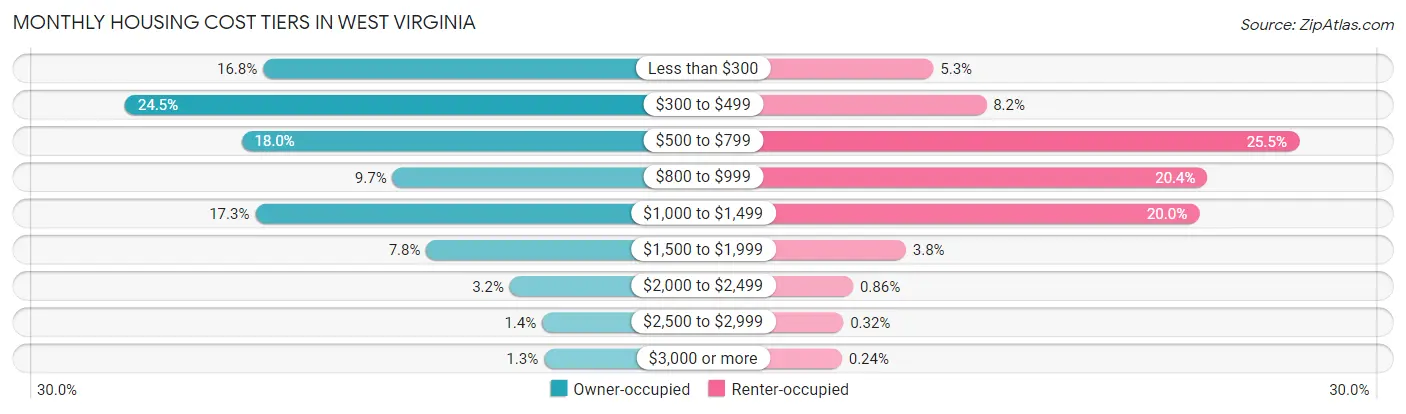
| Monthly Cost | Owner-occupied | Renter-occupied |
| Less than $300 | 89,386 (16.8%) | 9,802 (5.3%) |
| $300 to $499 | 129,866 (24.5%) | 15,204 (8.2%) |
| $500 to $799 | 95,683 (18.0%) | 47,133 (25.5%) |
| $800 to $999 | 51,428 (9.7%) | 37,803 (20.4%) |
| $1,000 to $1,499 | 91,677 (17.3%) | 36,939 (20.0%) |
| $1,500 to $1,999 | 41,481 (7.8%) | 6,988 (3.8%) |
| $2,000 to $2,499 | 16,968 (3.2%) | 1,599 (0.9%) |
| $2,500 to $2,999 | 7,567 (1.4%) | 600 (0.3%) |
| $3,000 or more | 6,971 (1.3%) | 435 (0.2%) |
| Total | 531,027 (100.0%) | 185,013 (100.0%) |
Physical Housing Characteristics in West Virginia
Housing Structures in West Virginia
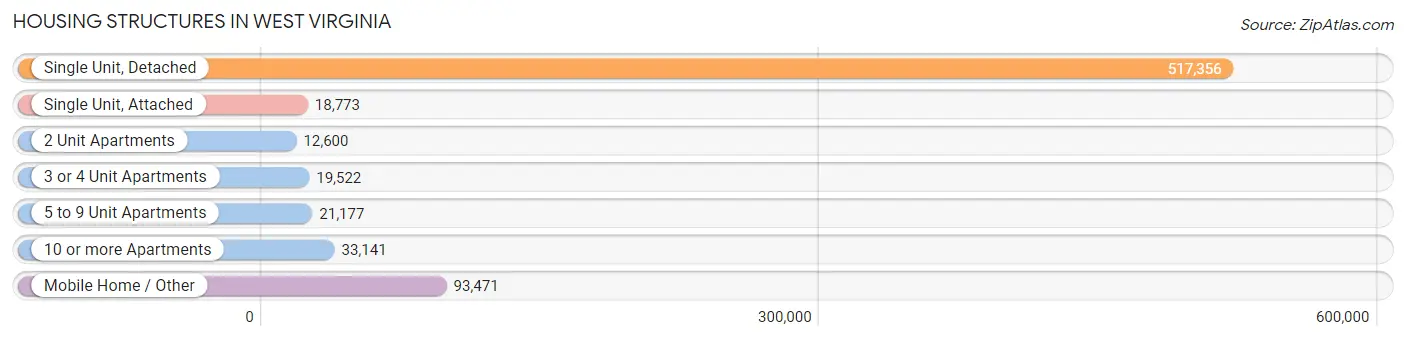
| Structure Type | # Housing Units | % Housing Units |
| Single Unit, Detached | 517,356 | 72.3% |
| Single Unit, Attached | 18,773 | 2.6% |
| 2 Unit Apartments | 12,600 | 1.8% |
| 3 or 4 Unit Apartments | 19,522 | 2.7% |
| 5 to 9 Unit Apartments | 21,177 | 3.0% |
| 10 or more Apartments | 33,141 | 4.6% |
| Mobile Home / Other | 93,471 | 13.1% |
| Total | 716,040 | 100.0% |
Housing Structures by Occupancy in West Virginia
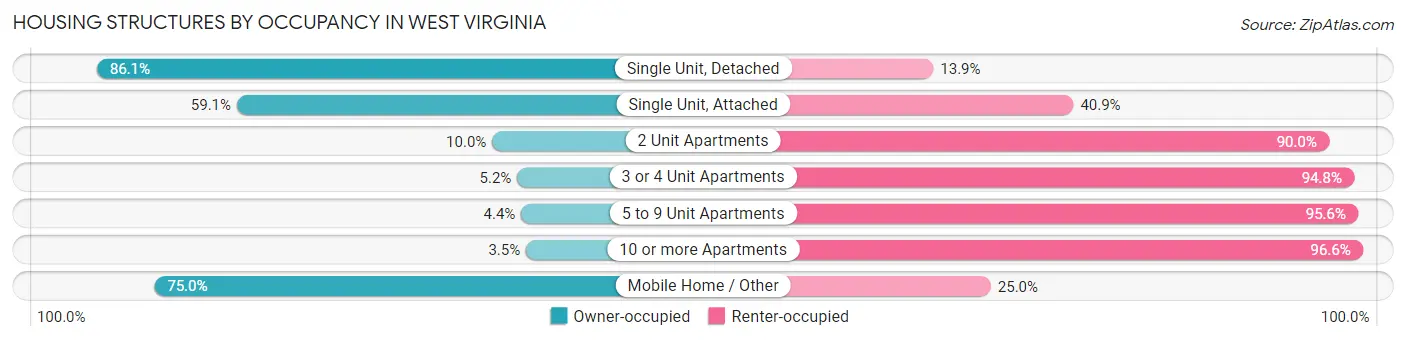
| Structure Type | Owner-occupied | Renter-occupied |
| Single Unit, Detached | 445,461 (86.1%) | 71,895 (13.9%) |
| Single Unit, Attached | 11,100 (59.1%) | 7,673 (40.9%) |
| 2 Unit Apartments | 1,257 (10.0%) | 11,343 (90.0%) |
| 3 or 4 Unit Apartments | 1,008 (5.2%) | 18,514 (94.8%) |
| 5 to 9 Unit Apartments | 929 (4.4%) | 20,248 (95.6%) |
| 10 or more Apartments | 1,145 (3.5%) | 31,996 (96.6%) |
| Mobile Home / Other | 70,127 (75.0%) | 23,344 (25.0%) |
| Total | 531,027 (74.2%) | 185,013 (25.8%) |
Housing Structures by Number of Rooms in West Virginia
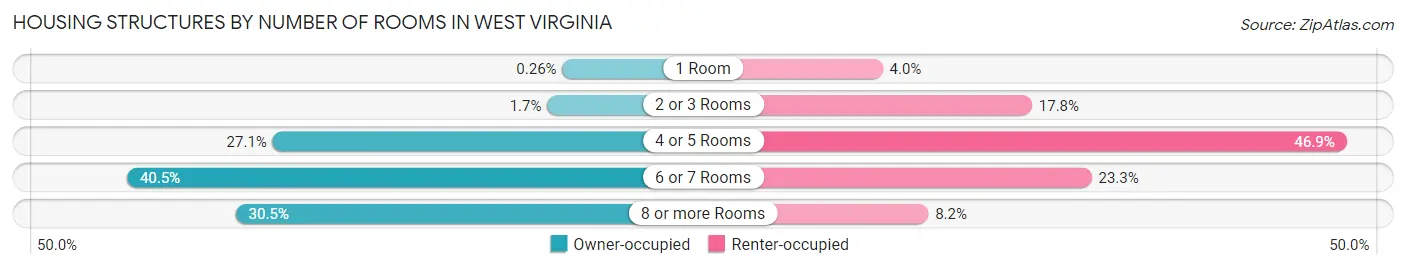
| Number of Rooms | Owner-occupied | Renter-occupied |
| 1 Room | 1,402 (0.3%) | 7,299 (4.0%) |
| 2 or 3 Rooms | 8,823 (1.7%) | 32,840 (17.7%) |
| 4 or 5 Rooms | 143,693 (27.1%) | 86,694 (46.9%) |
| 6 or 7 Rooms | 215,249 (40.5%) | 43,059 (23.3%) |
| 8 or more Rooms | 161,860 (30.5%) | 15,121 (8.2%) |
| Total | 531,027 (100.0%) | 185,013 (100.0%) |
Housing Structure by Heating Type in West Virginia
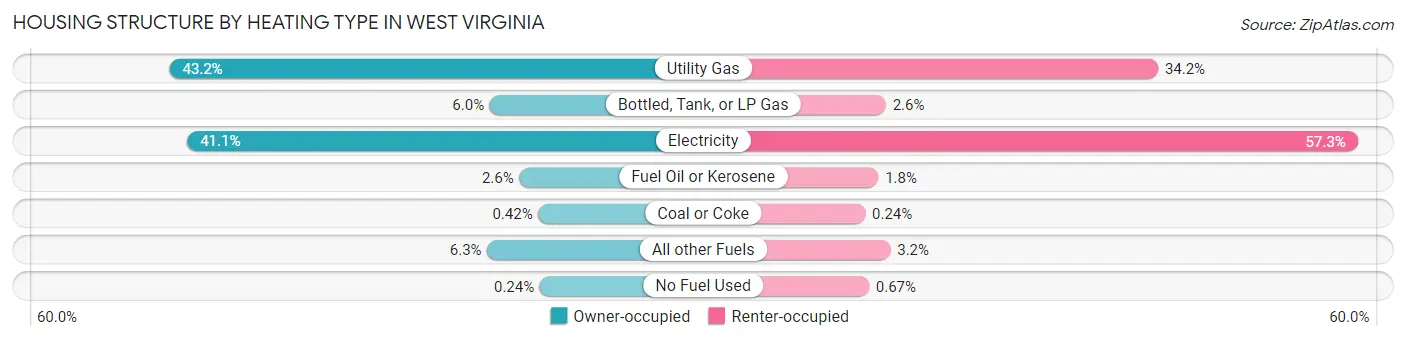
| Heating Type | Owner-occupied | Renter-occupied |
| Utility Gas | 229,392 (43.2%) | 63,254 (34.2%) |
| Bottled, Tank, or LP Gas | 32,074 (6.0%) | 4,875 (2.6%) |
| Electricity | 218,485 (41.1%) | 106,080 (57.3%) |
| Fuel Oil or Kerosene | 13,892 (2.6%) | 3,260 (1.8%) |
| Coal or Coke | 2,215 (0.4%) | 451 (0.2%) |
| All other Fuels | 33,691 (6.3%) | 5,854 (3.2%) |
| No Fuel Used | 1,278 (0.2%) | 1,239 (0.7%) |
| Total | 531,027 (100.0%) | 185,013 (100.0%) |
Household Vehicle Usage in West Virginia
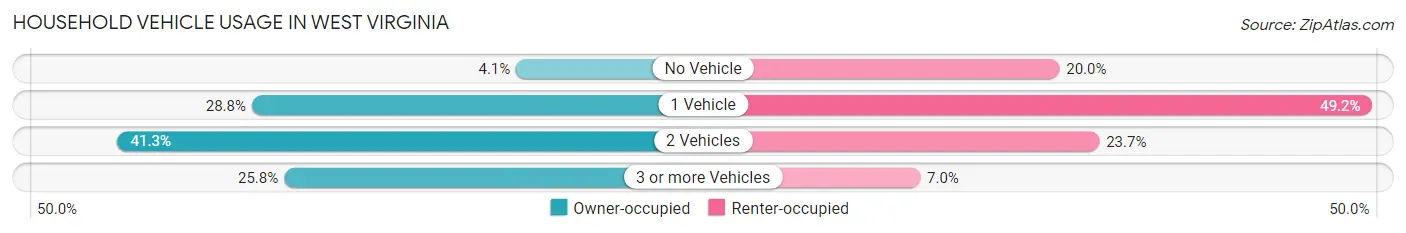
| Vehicles per Household | Owner-occupied | Renter-occupied |
| No Vehicle | 21,875 (4.1%) | 37,027 (20.0%) |
| 1 Vehicle | 152,866 (28.8%) | 91,083 (49.2%) |
| 2 Vehicles | 219,365 (41.3%) | 43,924 (23.7%) |
| 3 or more Vehicles | 136,921 (25.8%) | 12,979 (7.0%) |
| Total | 531,027 (100.0%) | 185,013 (100.0%) |
Real Estate & Mortgages in West Virginia
Real Estate and Mortgage Overview in West Virginia
| Characteristic | Without Mortgage | With Mortgage |
| Housing Units | 282,987 | 248,040 |
| Median Property Value | $114,400 | $174,400 |
| Median Household Income | $50,263 | $46,987 |
| Monthly Housing Costs | $371 | $6,729 |
| Real Estate Taxes | $647 | $7,359 |
Property Value by Mortgage Status in West Virginia
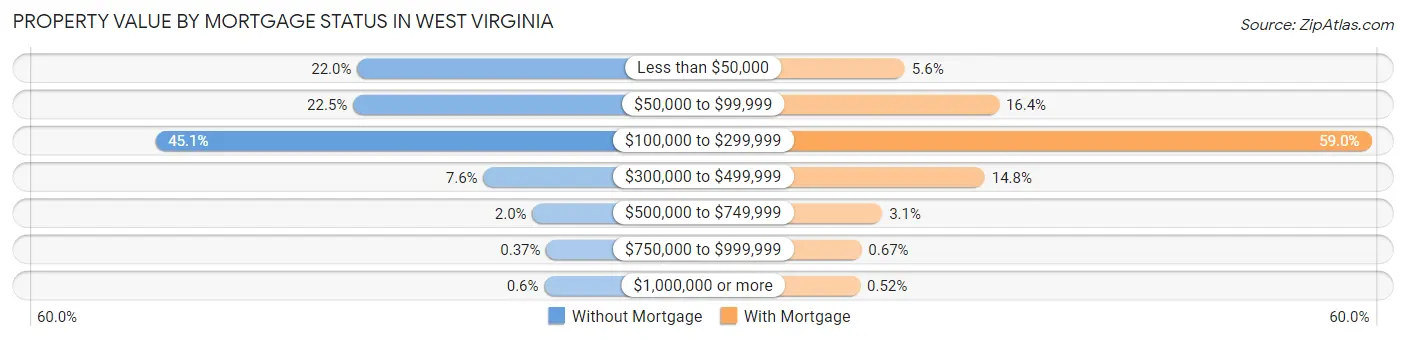
| Property Value | Without Mortgage | With Mortgage |
| Less than $50,000 | 62,204 (22.0%) | 13,989 (5.6%) |
| $50,000 to $99,999 | 63,533 (22.5%) | 40,660 (16.4%) |
| $100,000 to $299,999 | 127,534 (45.1%) | 146,227 (59.0%) |
| $300,000 to $499,999 | 21,398 (7.6%) | 36,639 (14.8%) |
| $500,000 to $749,999 | 5,555 (2.0%) | 7,558 (3.0%) |
| $750,000 to $999,999 | 1,054 (0.4%) | 1,666 (0.7%) |
| $1,000,000 or more | 1,709 (0.6%) | 1,301 (0.5%) |
| Total | 282,987 (100.0%) | 248,040 (100.0%) |
Household Income by Mortgage Status in West Virginia
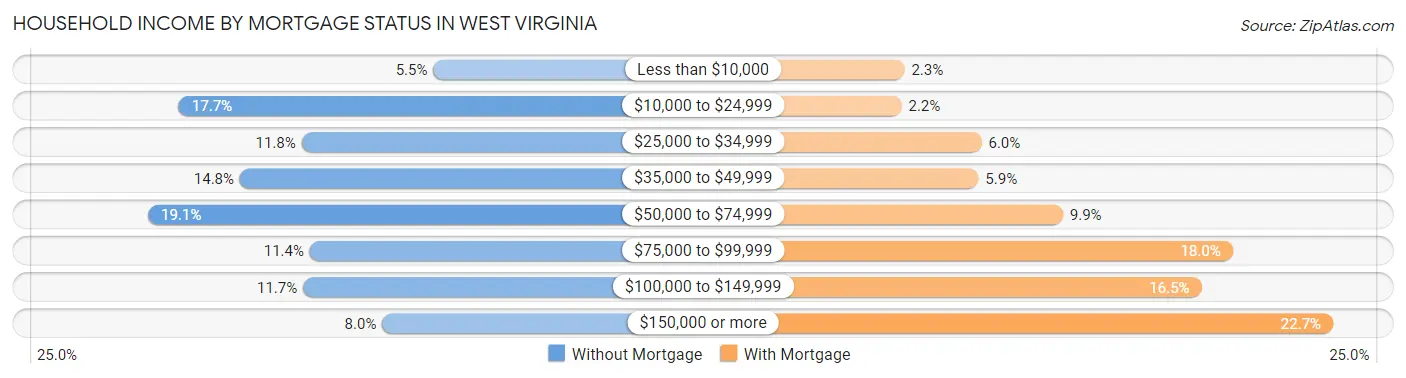
| Household Income | Without Mortgage | With Mortgage |
| Less than $10,000 | 15,671 (5.5%) | 5,776 (2.3%) |
| $10,000 to $24,999 | 49,959 (17.6%) | 5,438 (2.2%) |
| $25,000 to $34,999 | 33,408 (11.8%) | 14,878 (6.0%) |
| $35,000 to $49,999 | 41,734 (14.7%) | 14,500 (5.9%) |
| $50,000 to $74,999 | 54,108 (19.1%) | 24,478 (9.9%) |
| $75,000 to $99,999 | 32,326 (11.4%) | 44,545 (18.0%) |
| $100,000 to $149,999 | 33,236 (11.7%) | 40,841 (16.5%) |
| $150,000 or more | 22,545 (8.0%) | 56,373 (22.7%) |
| Total | 282,987 (100.0%) | 248,040 (100.0%) |
Property Value to Household Income Ratio in West Virginia
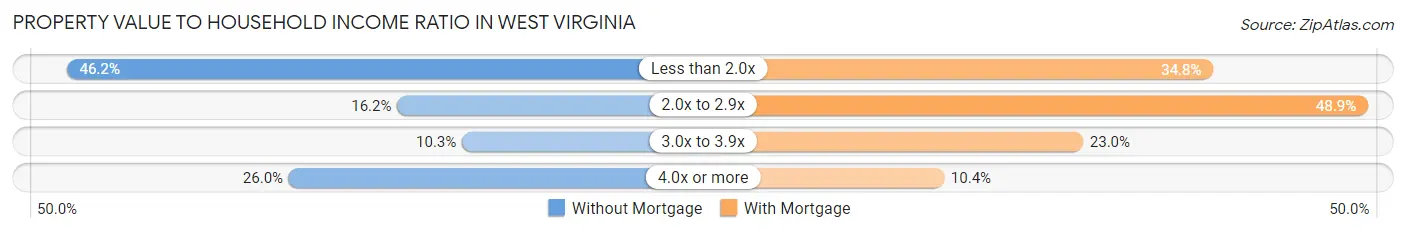
| Value-to-Income Ratio | Without Mortgage | With Mortgage |
| Less than 2.0x | 130,723 (46.2%) | 86,352 (34.8%) |
| 2.0x to 2.9x | 45,722 (16.2%) | 121,208 (48.9%) |
| 3.0x to 3.9x | 29,069 (10.3%) | 56,973 (23.0%) |
| 4.0x or more | 73,572 (26.0%) | 25,663 (10.3%) |
| Total | 282,987 (100.0%) | 248,040 (100.0%) |
Real Estate Taxes by Mortgage Status in West Virginia
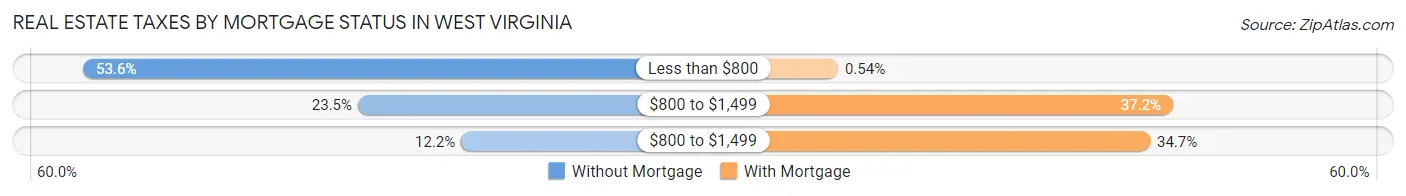
| Property Taxes | Without Mortgage | With Mortgage |
| Less than $800 | 151,638 (53.6%) | 1,329 (0.5%) |
| $800 to $1,499 | 66,453 (23.5%) | 92,368 (37.2%) |
| $800 to $1,499 | 34,424 (12.2%) | 86,159 (34.7%) |
| Total | 282,987 (100.0%) | 248,040 (100.0%) |
Health & Disability in West Virginia
Health Insurance Coverage by Age in West Virginia
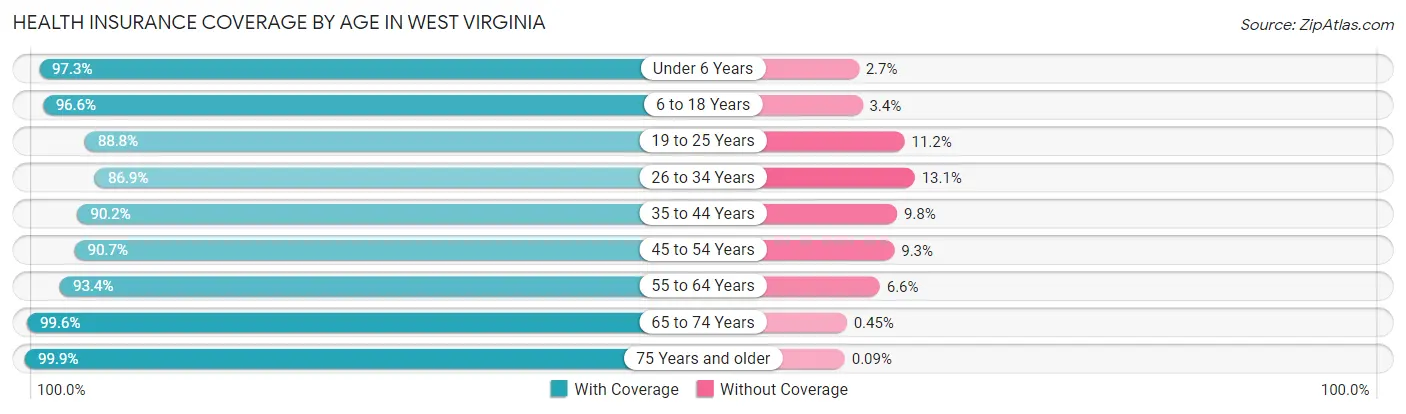
| Age Bracket | With Coverage | Without Coverage |
| Under 6 Years | 105,756 (97.3%) | 2,923 (2.7%) |
| 6 to 18 Years | 266,703 (96.6%) | 9,320 (3.4%) |
| 19 to 25 Years | 137,429 (88.8%) | 17,406 (11.2%) |
| 26 to 34 Years | 158,641 (86.9%) | 23,974 (13.1%) |
| 35 to 44 Years | 187,370 (90.2%) | 20,424 (9.8%) |
| 45 to 54 Years | 203,319 (90.7%) | 20,909 (9.3%) |
| 55 to 64 Years | 232,008 (93.4%) | 16,437 (6.6%) |
| 65 to 74 Years | 215,957 (99.6%) | 975 (0.4%) |
| 75 Years and older | 139,843 (99.9%) | 128 (0.1%) |
| Total | 1,647,026 (93.6%) | 112,496 (6.4%) |
Health Insurance Coverage by Citizenship Status in West Virginia
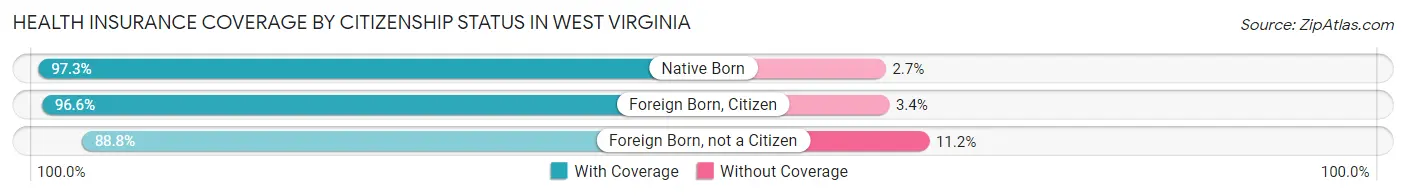
| Citizenship Status | With Coverage | Without Coverage |
| Native Born | 105,756 (97.3%) | 2,923 (2.7%) |
| Foreign Born, Citizen | 266,703 (96.6%) | 9,320 (3.4%) |
| Foreign Born, not a Citizen | 137,429 (88.8%) | 17,406 (11.2%) |
Health Insurance Coverage by Household Income in West Virginia
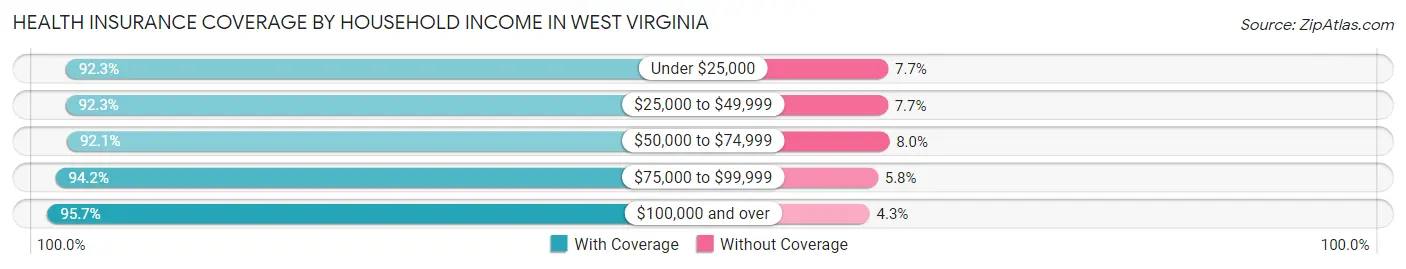
| Household Income | With Coverage | Without Coverage |
| Under $25,000 | 270,007 (92.3%) | 22,645 (7.7%) |
| $25,000 to $49,999 | 318,721 (92.3%) | 26,429 (7.7%) |
| $50,000 to $74,999 | 286,242 (92.0%) | 24,706 (8.0%) |
| $75,000 to $99,999 | 228,612 (94.2%) | 14,091 (5.8%) |
| $100,000 and over | 524,021 (95.7%) | 23,402 (4.3%) |
Public vs Private Health Insurance Coverage by Age in West Virginia
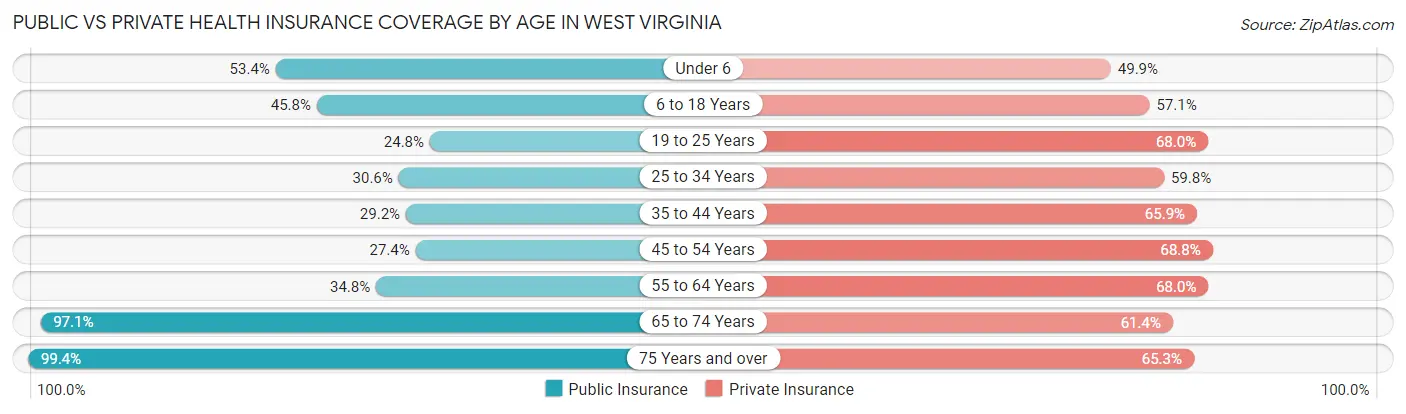
| Age Bracket | Public Insurance | Private Insurance |
| Under 6 | 58,031 (53.4%) | 54,271 (49.9%) |
| 6 to 18 Years | 126,329 (45.8%) | 157,632 (57.1%) |
| 19 to 25 Years | 38,366 (24.8%) | 105,231 (68.0%) |
| 25 to 34 Years | 55,841 (30.6%) | 109,211 (59.8%) |
| 35 to 44 Years | 60,715 (29.2%) | 136,960 (65.9%) |
| 45 to 54 Years | 61,531 (27.4%) | 154,294 (68.8%) |
| 55 to 64 Years | 86,348 (34.8%) | 168,978 (68.0%) |
| 65 to 74 Years | 210,612 (97.1%) | 133,246 (61.4%) |
| 75 Years and over | 139,117 (99.4%) | 91,443 (65.3%) |
| Total | 836,890 (47.6%) | 1,111,266 (63.2%) |
Disability Status by Sex by Age in West Virginia
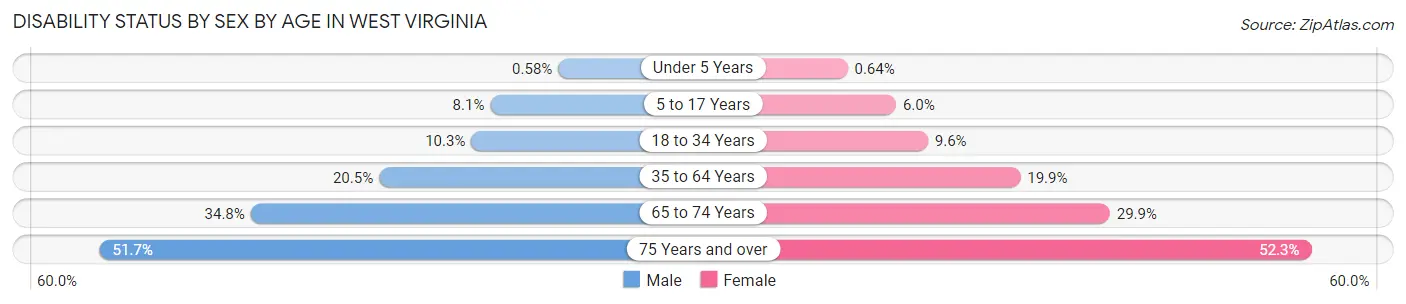
| Age Bracket | Male | Female |
| Under 5 Years | 266 (0.6%) | 281 (0.6%) |
| 5 to 17 Years | 11,257 (8.1%) | 7,861 (6.0%) |
| 18 to 34 Years | 19,022 (10.3%) | 17,030 (9.6%) |
| 35 to 64 Years | 69,367 (20.5%) | 68,097 (19.9%) |
| 65 to 74 Years | 36,242 (34.8%) | 33,702 (29.8%) |
| 75 Years and over | 30,923 (51.6%) | 41,888 (52.3%) |
Disability Class by Sex by Age in West Virginia
Disability Class: Hearing Difficulty
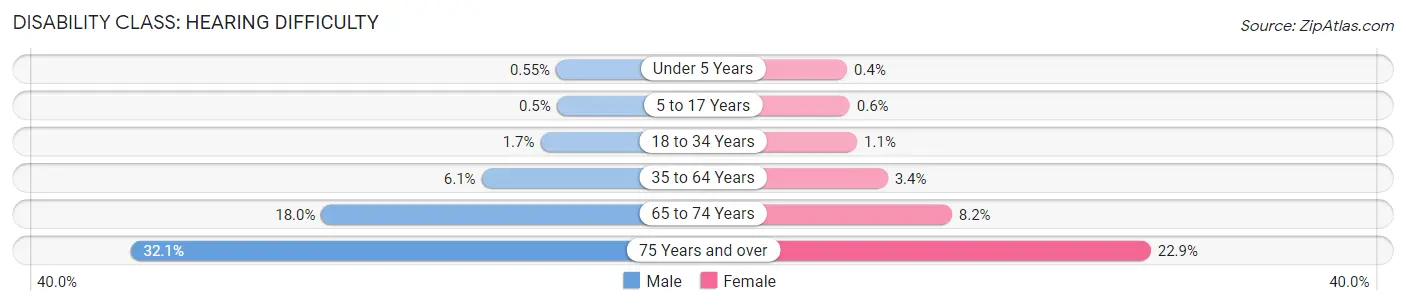
| Age Bracket | Male | Female |
| Under 5 Years | 256 (0.5%) | 176 (0.4%) |
| 5 to 17 Years | 697 (0.5%) | 777 (0.6%) |
| 18 to 34 Years | 3,172 (1.7%) | 2,028 (1.1%) |
| 35 to 64 Years | 20,541 (6.1%) | 11,693 (3.4%) |
| 65 to 74 Years | 18,693 (18.0%) | 9,225 (8.2%) |
| 75 Years and over | 19,236 (32.1%) | 18,371 (22.9%) |
Disability Class: Vision Difficulty
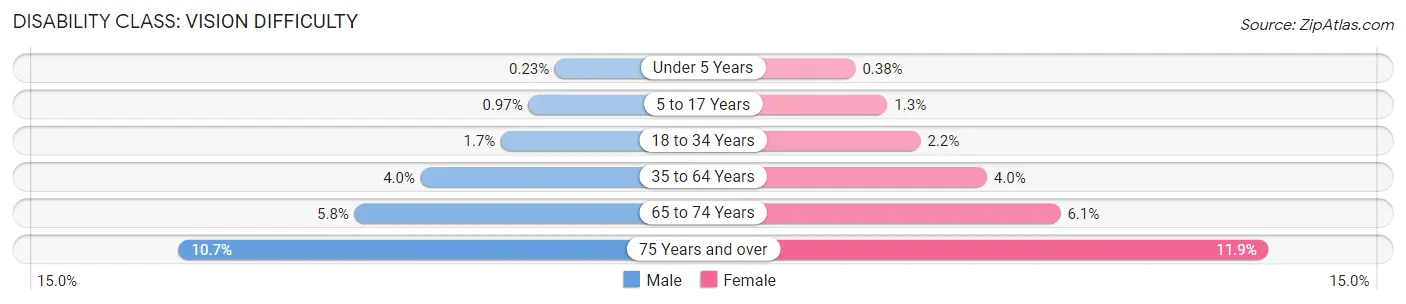
| Age Bracket | Male | Female |
| Under 5 Years | 108 (0.2%) | 167 (0.4%) |
| 5 to 17 Years | 1,338 (1.0%) | 1,651 (1.3%) |
| 18 to 34 Years | 3,201 (1.7%) | 3,887 (2.2%) |
| 35 to 64 Years | 13,418 (4.0%) | 13,836 (4.0%) |
| 65 to 74 Years | 6,041 (5.8%) | 6,874 (6.1%) |
| 75 Years and over | 6,415 (10.7%) | 9,517 (11.9%) |
Disability Class: Cognitive Difficulty
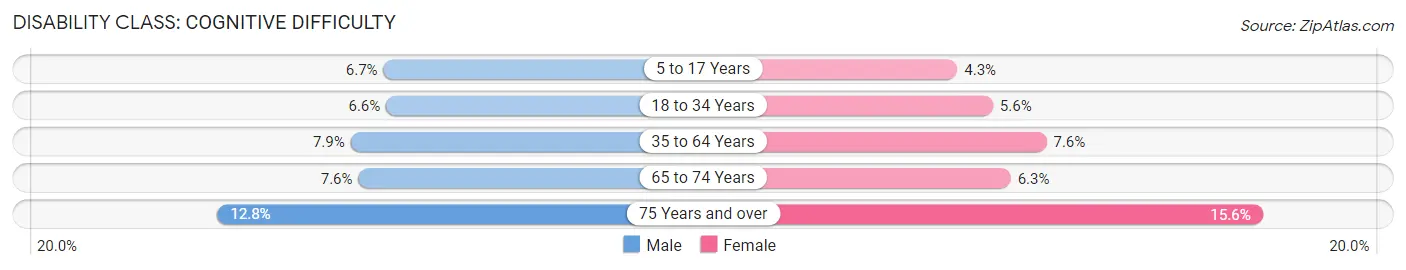
| Age Bracket | Male | Female |
| 5 to 17 Years | 9,238 (6.7%) | 5,591 (4.3%) |
| 18 to 34 Years | 12,196 (6.6%) | 9,979 (5.6%) |
| 35 to 64 Years | 26,696 (7.9%) | 26,020 (7.6%) |
| 65 to 74 Years | 7,915 (7.6%) | 7,076 (6.3%) |
| 75 Years and over | 7,689 (12.8%) | 12,514 (15.6%) |
Disability Class: Ambulatory Difficulty
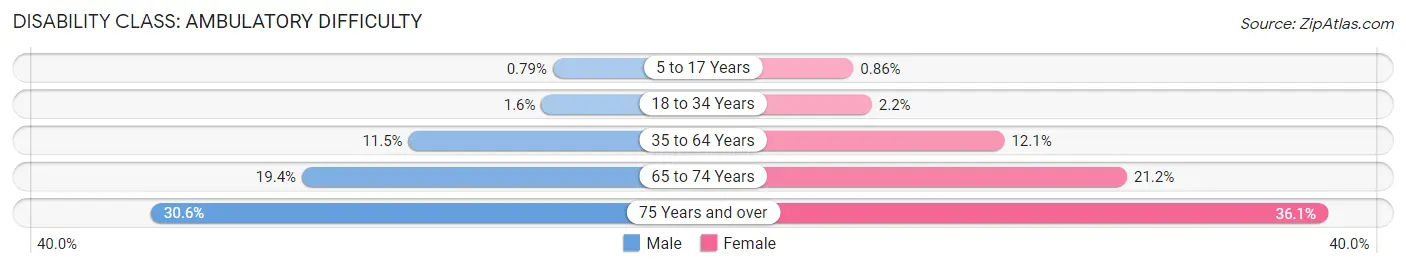
| Age Bracket | Male | Female |
| 5 to 17 Years | 1,089 (0.8%) | 1,122 (0.9%) |
| 18 to 34 Years | 3,022 (1.6%) | 3,965 (2.2%) |
| 35 to 64 Years | 38,866 (11.5%) | 41,393 (12.1%) |
| 65 to 74 Years | 20,192 (19.4%) | 23,915 (21.2%) |
| 75 Years and over | 18,331 (30.6%) | 28,900 (36.1%) |
Disability Class: Self-Care Difficulty
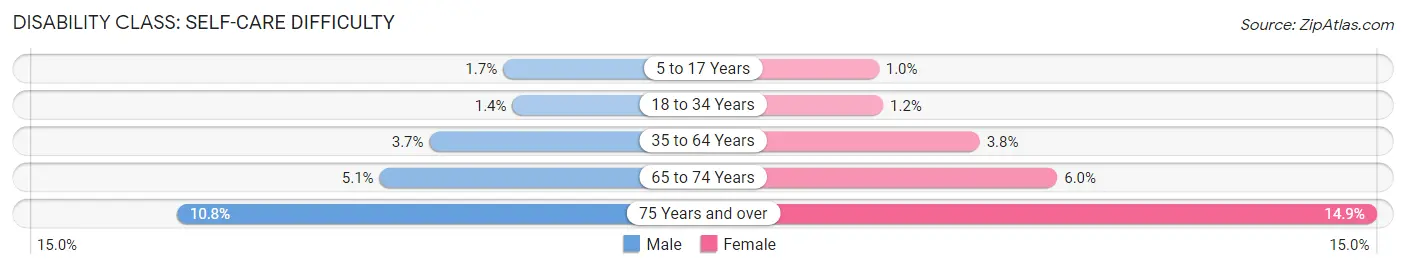
| Age Bracket | Male | Female |
| 5 to 17 Years | 2,319 (1.7%) | 1,346 (1.0%) |
| 18 to 34 Years | 2,641 (1.4%) | 2,037 (1.1%) |
| 35 to 64 Years | 12,588 (3.7%) | 13,161 (3.8%) |
| 65 to 74 Years | 5,331 (5.1%) | 6,771 (6.0%) |
| 75 Years and over | 6,440 (10.8%) | 11,923 (14.9%) |
Technology Access in West Virginia
Computing Device Access in West Virginia
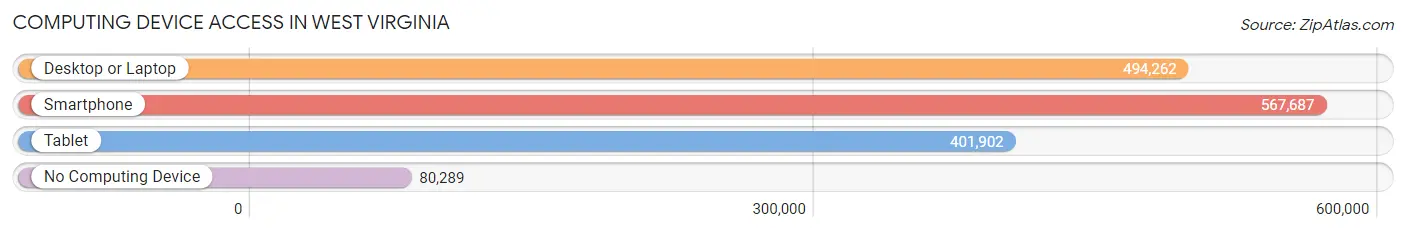
| Device Type | # Households | % Households |
| Desktop or Laptop | 494,262 | 69.0% |
| Smartphone | 567,687 | 79.3% |
| Tablet | 401,902 | 56.1% |
| No Computing Device | 80,289 | 11.2% |
| Total | 716,040 | 100.0% |
Internet Access in West Virginia
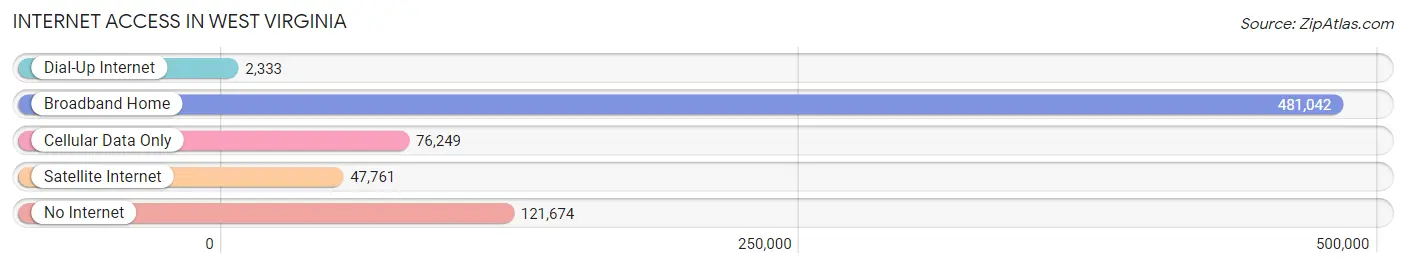
| Internet Type | # Households | % Households |
| Dial-Up Internet | 2,333 | 0.3% |
| Broadband Home | 481,042 | 67.2% |
| Cellular Data Only | 76,249 | 10.6% |
| Satellite Internet | 47,761 | 6.7% |
| No Internet | 121,674 | 17.0% |
| Total | 716,040 | 100.0% |
West Virginia Summary
West Virginia is a state located in the Appalachian region of the Southern United States. It is bordered by Virginia to the southeast, Kentucky to the southwest, Ohio to the northwest, and Pennsylvania and Maryland to the northeast. West Virginia is the 41st largest state by area and ranks 38th in population. The capital and largest city is Charleston.
History
West Virginia was originally part of the British colony of Virginia. In 1776, the western counties of Virginia declared their independence from Britain and formed the state of West Virginia. The state was admitted to the Union in 1863 as a result of the American Civil War.
West Virginia was a major battleground during the Civil War. The Battle of Gettysburg was fought in the state, and the Battle of Antietam was fought nearby. West Virginia was also the site of the Battle of Droop Mountain, the last major battle of the war.
Geography
West Virginia is located in the Appalachian region of the United States. It is bordered by Virginia to the southeast, Kentucky to the southwest, Ohio to the northwest, and Pennsylvania and Maryland to the northeast.
The state is divided into two distinct regions: the Allegheny Plateau in the west and the Appalachian Mountains in the east. The Allegheny Plateau is a plateau that is characterized by rolling hills and valleys. The Appalachian Mountains are a range of mountains that run through the eastern part of the state.
The highest point in the state is Spruce Knob, which is located in the Allegheny Plateau. The lowest point is Harpers Ferry, which is located in the Appalachian Mountains.
Economy
West Virginia has a diverse economy that is largely based on the extraction and processing of natural resources. The state is a major producer of coal, natural gas, and timber. It is also a major producer of chemicals, steel, and aluminum.
West Virginia is also home to a number of large companies, including Mylan Pharmaceuticals, FirstEnergy, and Frontier Communications. Tourism is also an important part of the state’s economy, with visitors coming to enjoy the state’s natural beauty and outdoor recreation opportunities.
Demographics
As of the 2010 census, West Virginia had a population of 1,852,994. The state is predominantly white, with 84.3% of the population identifying as white. African Americans make up 6.5% of the population, while Hispanics and Latinos make up 2.2%.
The median household income in West Virginia is $43,385, and the median home value is $117,400. The state has a poverty rate of 17.2%, which is higher than the national average.
West Virginia is a rural state, with only 17.3% of the population living in urban areas. The largest cities in the state are Charleston, Huntington, Parkersburg, Morgantown, and Wheeling.
Common Questions
When was West Virginia Incorporated?
West Virginia was Incorporated into the Union on Jun 20, 1863.
What is the Total Area of West Virginia?
Total Area of West Virginia is 24,230 Square Miles.
What is the Total Land Area of West Virginia?
Total Land Area of West Virginia is 24,038 Square Miles.
What is the Total Water Area of West Virginia?
Total Water Area of West Virginia is 192 Square Miles.
What is the Average Elevation in West Virginia?
Average Elevation in West Virginia is 1,500 Feet.
What is the Highest Elevation in West Virginia?
Highest Elevation in West Virginia is 4,863 Feet.
What is the Lowest Elevation in West Virginia?
Lowest Elevation in West Virginia is 240 Feet.
What is the Population Density in West Virginia?
Population Density in West Virginia is 74.6 People per Square Mile.
What is Per Capita Income in West Virginia?
Per Capita income in West Virginia is $31,462.
What is the Median Family Income in West Virginia?
Median Family Income in West Virginia is $71,678.
What is the Median Household income in West Virginia?
Median Household Income in West Virginia is $55,217.
What is Income or Wage Gap in West Virginia?
Income or Wage Gap in West Virginia is 31.9%.
Women in West Virginia earn 68.1 cents for every dollar earned by a man.
What is Family Income Deficit in West Virginia?
Family Income Deficit in West Virginia is $10,702.
Families that are below poverty line in West Virginia earn $10,702 less on average than the poverty threshold level.
What is Inequality or Gini Index in West Virginia?
Inequality or Gini Index in West Virginia is 0.47.
What is the Total Population of West Virginia?
Total Population of West Virginia is 1,792,967.
What is the Total Male Population of West Virginia?
Total Male Population of West Virginia is 894,772.
What is the Total Female Population of West Virginia?
Total Female Population of West Virginia is 898,195.
What is the Ratio of Males per 100 Females in West Virginia?
There are 99.62 Males per 100 Females in West Virginia.
What is the Ratio of Females per 100 Males in West Virginia?
There are 100.38 Females per 100 Males in West Virginia.
What is the Median Population Age in West Virginia?
Median Population Age in West Virginia is 42.6 Years.
What is the Average Family Size in West Virginia
Average Family Size in West Virginia is 3.0 People.
What is the Average Household Size in West Virginia
Average Household Size in West Virginia is 2.4 People.
How Large is the Labor Force in West Virginia?
There are 785,678 People in the Labor Forcein in West Virginia.
What is the Percentage of People in the Labor Force in West Virginia?
53.2% of People are in the Labor Force in West Virginia.
What is the Unemployment Rate in West Virginia?
Unemployment Rate in West Virginia is 6.1%.