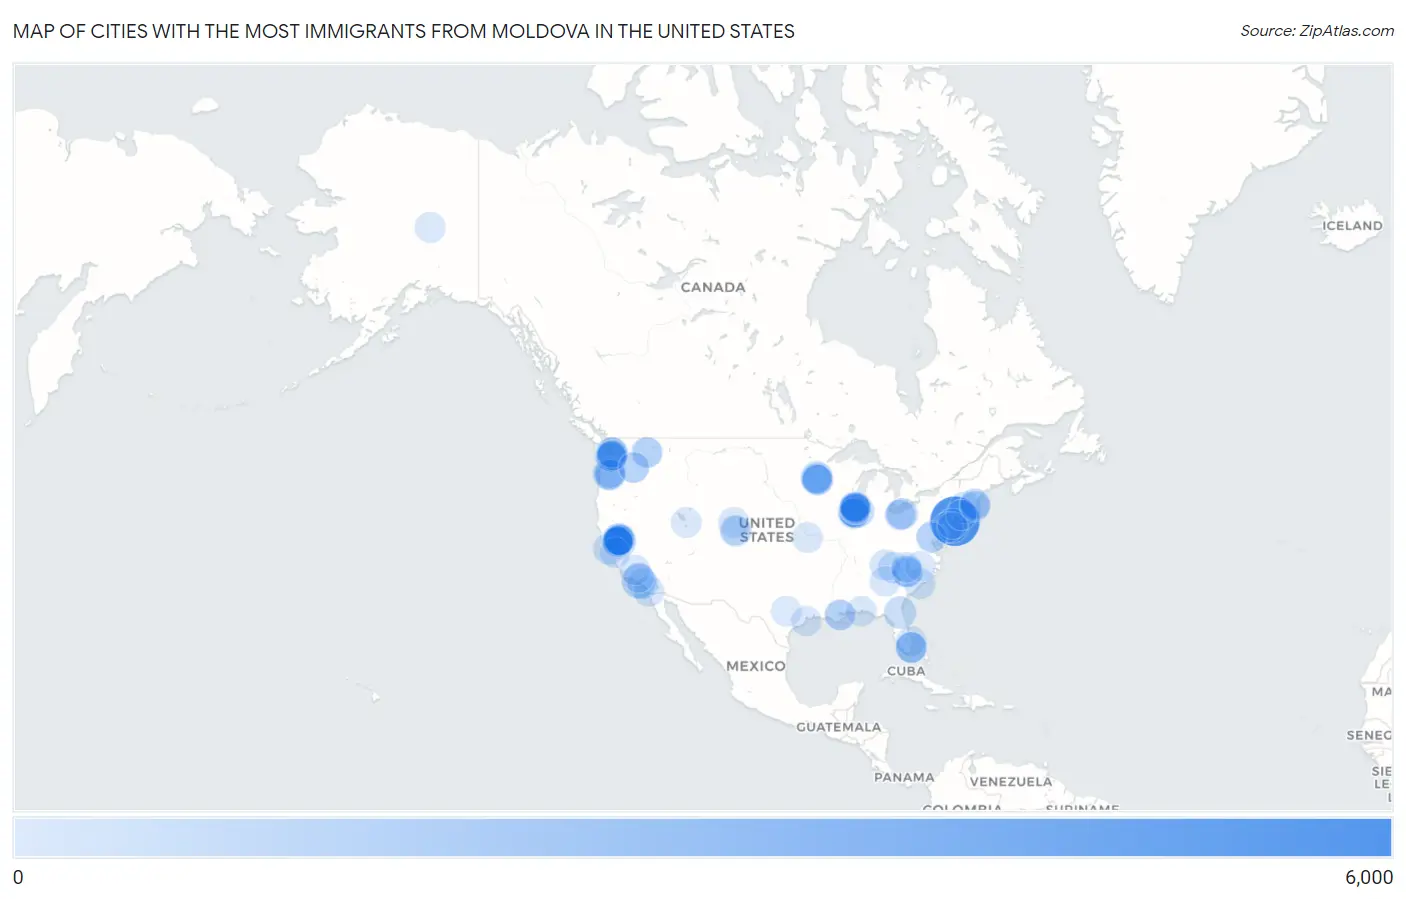
Cities with the Most Immigrants from Moldova in the United States
RELATED REPORTS & OPTIONS
Moldova
United States
Compare Cities
Map of Cities with the Most Immigrants from Moldova in the United States
0
6,000
Cities with the Most Immigrants from Moldova in the United States
| City | Moldova | vs State | vs National | |
| 1. | New York | 5,079 | 6,415(79.17%)#1 | 53,673(9.46%)#1 |
| 2. | Rancho Cordova | 1,254 | 10,171(12.33%)#1 | 53,673(2.34%)#2 |
| 3. | Los Angeles | 1,095 | 10,171(10.77%)#2 | 53,673(2.04%)#3 |
| 4. | Chicago | 829 | 4,938(16.79%)#1 | 53,673(1.54%)#4 |
| 5. | Portland | 707 | 1,379(51.27%)#1 | 53,673(1.32%)#5 |
| 6. | Jacksonville | 615 | 4,361(14.10%)#1 | 53,673(1.15%)#6 |
| 7. | North Highlands | 607 | 10,171(5.97%)#3 | 53,673(1.13%)#7 |
| 8. | Woodridge | 516 | 4,938(10.45%)#2 | 53,673(0.96%)#8 |
| 9. | Carmichael | 515 | 10,171(5.06%)#4 | 53,673(0.96%)#9 |
| 10. | Antelope | 475 | 10,171(4.67%)#5 | 53,673(0.88%)#10 |
| 11. | Sacramento | 453 | 10,171(4.45%)#6 | 53,673(0.84%)#11 |
| 12. | West Springfield Town | 444 | 2,537(17.50%)#1 | 53,673(0.83%)#12 |
| 13. | Aurora | 396 | 4,938(8.02%)#3 | 53,673(0.74%)#13 |
| 14. | San Francisco | 395 | 10,171(3.88%)#7 | 53,673(0.74%)#14 |
| 15. | Hallandale Beach | 336 | 4,361(7.70%)#2 | 53,673(0.63%)#15 |
| 16. | Matthews | 321 | 1,824(17.60%)#1 | 53,673(0.60%)#16 |
| 17. | Mayfield Heights | 318 | 1,047(30.37%)#1 | 53,673(0.59%)#17 |
| 18. | Asheville | 315 | 1,824(17.27%)#2 | 53,673(0.59%)#18 |
| 19. | Renton | 296 | 4,536(6.53%)#1 | 53,673(0.55%)#19 |
| 20. | South Hill | 281 | 4,536(6.19%)#2 | 53,673(0.52%)#20 |
| 21. | Tacoma | 279 | 4,536(6.15%)#3 | 53,673(0.52%)#21 |
| 22. | Huntington Beach | 279 | 10,171(2.74%)#8 | 53,673(0.52%)#22 |
| 23. | Federal Way | 272 | 4,536(6.00%)#4 | 53,673(0.51%)#23 |
| 24. | Citrus Heights | 252 | 10,171(2.48%)#9 | 53,673(0.47%)#24 |
| 25. | Orangevale | 250 | 10,171(2.46%)#10 | 53,673(0.47%)#25 |
| 26. | Rocklin | 249 | 10,171(2.45%)#11 | 53,673(0.46%)#26 |
| 27. | Rosemont | 242 | 10,171(2.38%)#12 | 53,673(0.45%)#27 |
| 28. | Fairwood Cdp King County | 240 | 4,536(5.29%)#5 | 53,673(0.45%)#28 |
| 29. | Spokane | 239 | 4,536(5.27%)#6 | 53,673(0.45%)#29 |
| 30. | Socastee | 235 | 770(30.52%)#1 | 53,673(0.44%)#30 |
| 31. | San Diego | 233 | 10,171(2.29%)#13 | 53,673(0.43%)#31 |
| 32. | North Bethesda | 232 | 767(30.25%)#1 | 53,673(0.43%)#32 |
| 33. | Arlington Heights | 230 | 4,938(4.66%)#4 | 53,673(0.43%)#33 |
| 34. | Charlotte | 229 | 1,824(12.55%)#3 | 53,673(0.43%)#34 |
| 35. | Elk River | 222 | 1,779(12.48%)#1 | 53,673(0.41%)#35 |
| 36. | Naperville | 216 | 4,938(4.37%)#5 | 53,673(0.40%)#36 |
| 37. | Parkland | 215 | 4,536(4.74%)#7 | 53,673(0.40%)#37 |
| 38. | Greenfield | 213 | 2,537(8.40%)#2 | 53,673(0.40%)#38 |
| 39. | Sunny Isles Beach | 212 | 4,361(4.86%)#3 | 53,673(0.39%)#39 |
| 40. | Bolingbrook | 211 | 4,938(4.27%)#6 | 53,673(0.39%)#40 |
| 41. | Fort Collins | 204 | 782(26.09%)#1 | 53,673(0.38%)#41 |
| 42. | Schaumburg | 204 | 4,938(4.13%)#7 | 53,673(0.38%)#42 |
| 43. | Sully Square | 204 | 1,041(19.60%)#1 | 53,673(0.38%)#43 |
| 44. | Philadelphia | 201 | 1,138(17.66%)#1 | 53,673(0.37%)#44 |
| 45. | Vancouver | 197 | 4,536(4.34%)#8 | 53,673(0.37%)#45 |
| 46. | Brooklyn Park | 195 | 1,779(10.96%)#2 | 53,673(0.36%)#46 |
| 47. | Aurora | 194 | 782(24.81%)#2 | 53,673(0.36%)#47 |
| 48. | Five Corners | 191 | 4,536(4.21%)#9 | 53,673(0.36%)#48 |
| 49. | Overland Park | 188 | 335(56.12%)#1 | 53,673(0.35%)#49 |
| 50. | Lemon Hill | 187 | 10,171(1.84%)#14 | 53,673(0.35%)#50 |
| 51. | Mount Prospect | 186 | 4,938(3.77%)#8 | 53,673(0.35%)#51 |
| 52. | Cedar Glen West | 185 | 2,316(7.99%)#1 | 53,673(0.34%)#52 |
| 53. | Folsom | 184 | 10,171(1.81%)#15 | 53,673(0.34%)#53 |
| 54. | Beachwood | 183 | 1,047(17.48%)#2 | 53,673(0.34%)#54 |
| 55. | College | 175 | 368(47.55%)#1 | 53,673(0.33%)#55 |
| 56. | Pasco | 174 | 4,536(3.84%)#10 | 53,673(0.32%)#56 |
| 57. | Denver | 173 | 782(22.12%)#3 | 53,673(0.32%)#57 |
| 58. | Wheeling | 172 | 4,938(3.48%)#9 | 53,673(0.32%)#58 |
| 59. | Champlin | 171 | 1,779(9.61%)#3 | 53,673(0.32%)#59 |
| 60. | Knoxville | 164 | 696(23.56%)#1 | 53,673(0.31%)#60 |
| 61. | Metairie | 157 | 267(58.80%)#1 | 53,673(0.29%)#61 |
| 62. | Dacula | 151 | 1,029(14.67%)#1 | 53,673(0.28%)#62 |
| 63. | Brent | 150 | 4,361(3.44%)#4 | 53,673(0.28%)#63 |
| 64. | Sandy | 146 | 263(55.51%)#1 | 53,673(0.27%)#64 |
| 65. | Edgewater Borough | 144 | 2,316(6.22%)#2 | 53,673(0.27%)#65 |
| 66. | Hoffman Estates | 140 | 4,938(2.84%)#10 | 53,673(0.26%)#66 |
| 67. | San Jose | 138 | 10,171(1.36%)#16 | 53,673(0.26%)#67 |
| 68. | Seattle | 138 | 4,536(3.04%)#11 | 53,673(0.26%)#68 |
| 69. | St Louis Park | 135 | 1,779(7.59%)#4 | 53,673(0.25%)#69 |
| 70. | Riviera Beach | 135 | 4,361(3.10%)#5 | 53,673(0.25%)#70 |
| 71. | Bakersfield | 131 | 10,171(1.29%)#17 | 53,673(0.24%)#71 |
| 72. | Golden Valley | 128 | 1,779(7.20%)#5 | 53,673(0.24%)#72 |
| 73. | Bellevue | 127 | 4,536(2.80%)#12 | 53,673(0.24%)#73 |
| 74. | Gresham | 127 | 1,379(9.21%)#2 | 53,673(0.24%)#74 |
| 75. | Medford | 127 | 2,537(5.01%)#3 | 53,673(0.24%)#75 |
| 76. | Lakeland South | 127 | 4,536(2.80%)#13 | 53,673(0.24%)#76 |
| 77. | Joliet | 125 | 4,938(2.53%)#11 | 53,673(0.23%)#77 |
| 78. | Round Lake | 125 | 4,938(2.53%)#12 | 53,673(0.23%)#78 |
| 79. | Indian Trail | 120 | 1,824(6.58%)#4 | 53,673(0.22%)#79 |
| 80. | Arden Arcade | 119 | 10,171(1.17%)#18 | 53,673(0.22%)#80 |
| 81. | Cedar Park | 119 | 996(11.95%)#1 | 53,673(0.22%)#81 |
| 82. | Old Bridge | 119 | 2,316(5.14%)#3 | 53,673(0.22%)#82 |
| 83. | Woburn | 118 | 2,537(4.65%)#4 | 53,673(0.22%)#83 |
| 84. | Newton | 117 | 2,537(4.61%)#5 | 53,673(0.22%)#84 |
| 85. | Florin | 117 | 10,171(1.15%)#19 | 53,673(0.22%)#85 |
| 86. | Aventura | 117 | 4,361(2.68%)#6 | 53,673(0.22%)#86 |
| 87. | Kent | 113 | 4,536(2.49%)#14 | 53,673(0.21%)#87 |
| 88. | Parma | 113 | 1,047(10.79%)#3 | 53,673(0.21%)#88 |
| 89. | Reston | 113 | 1,041(10.85%)#2 | 53,673(0.21%)#89 |
| 90. | Kenner | 110 | 267(41.20%)#2 | 53,673(0.20%)#90 |
| 91. | Galveston | 108 | 996(10.84%)#2 | 53,673(0.20%)#91 |
| 92. | Maple Grove | 104 | 1,779(5.85%)#6 | 53,673(0.19%)#92 |
| 93. | Cary | 102 | 1,824(5.59%)#5 | 53,673(0.19%)#93 |
| 94. | Foothill Farms | 102 | 10,171(1.00%)#20 | 53,673(0.19%)#94 |
| 95. | Santa Clarita | 100 | 10,171(0.98%)#21 | 53,673(0.19%)#95 |
| 96. | Kennewick | 100 | 4,536(2.20%)#15 | 53,673(0.19%)#96 |
| 97. | Palatine | 98 | 4,938(1.98%)#13 | 53,673(0.18%)#97 |
| 98. | Shelton | 98 | 452(21.68%)#1 | 53,673(0.18%)#98 |
| 99. | Mooresville | 97 | 1,824(5.32%)#6 | 53,673(0.18%)#99 |
| 100. | Spokane Valley | 94 | 4,536(2.07%)#16 | 53,673(0.18%)#100 |
Common Questions
What are the Top 10 Cities with the Most Immigrants from Moldova in the United States?
Top 10 Cities with the Most Immigrants from Moldova in the United States are:
#1
5,079
#2
1,254
#3
1,095
#4
829
#5
707
#6
615
#7
607
#8
516
#9
515
#10
475
What city has the Most Immigrants from Moldova in the United States?
New York has the Most Immigrants from Moldova in the United States with 5,079.
What is the Total Immigrants from Moldova in the United States?
Total Immigrants from Moldova in the United States is 53,673.