Cities with the Highest Percentage of Indonesian Population in the United States
RELATED REPORTS & OPTIONS
Indonesian
United States
Compare Cities
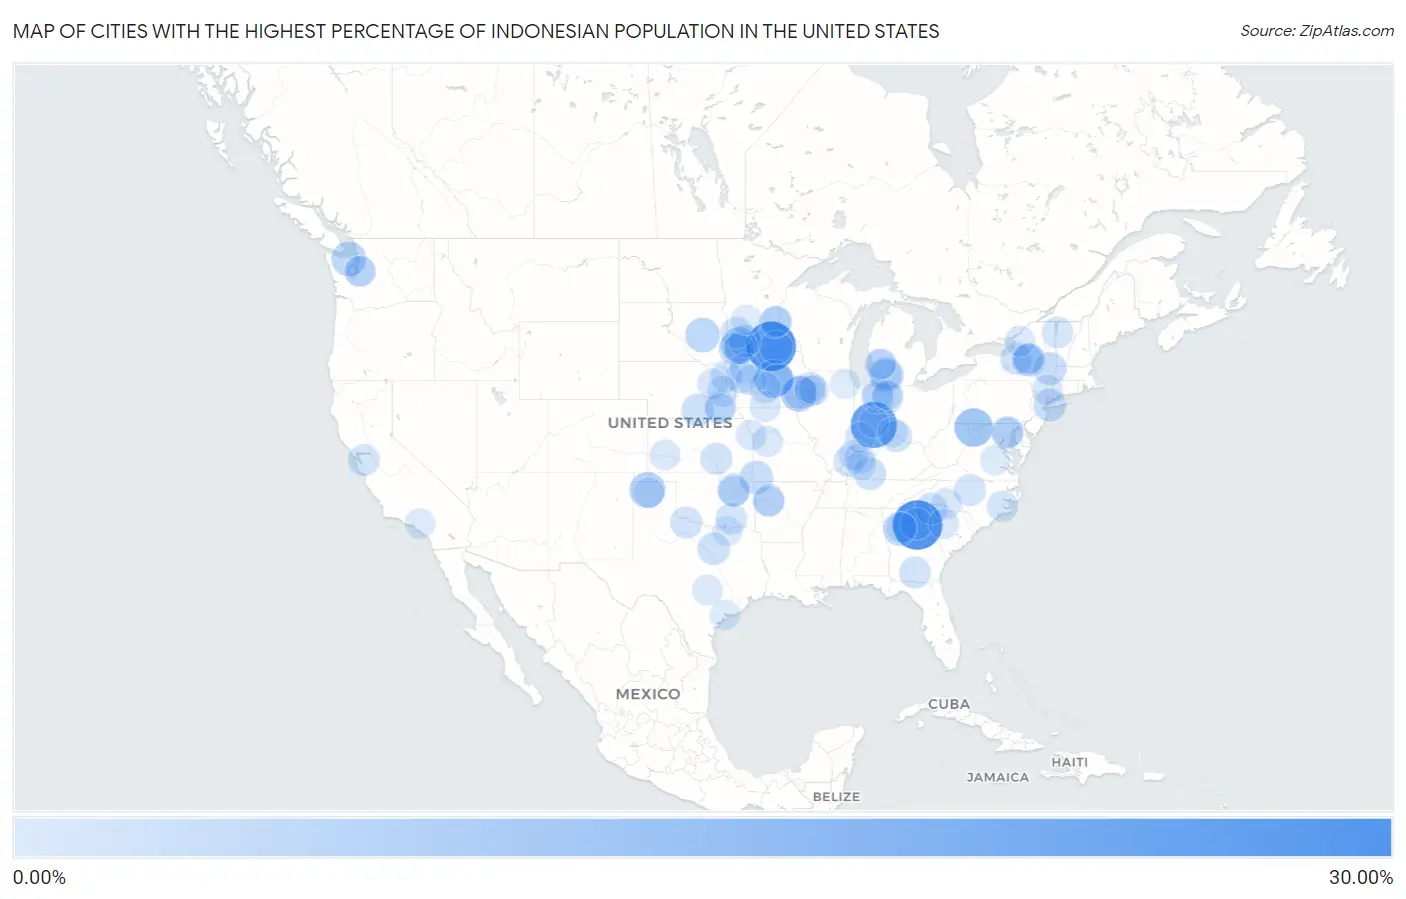
Map of Cities with the Highest Percentage of Indonesian Population in the United States
0.00%
30.00%
Cities with the Highest Percentage of Indonesian Population in the United States
| City | Indonesian | vs State | vs National | |
| 1. | Carlton | 28.78% | 0.066%(+28.7)#1 | 0.066%(+28.7)#1 |
| 2. | Clarks Grove | 28.59% | 0.27%(+28.3)#1 | 0.066%(+28.5)#2 |
| 3. | Southport | 23.75% | 0.41%(+23.3)#1 | 0.066%(+23.7)#3 |
| 4. | Bloomington | 12.78% | 0.10%(+12.7)#1 | 0.066%(+12.7)#4 |
| 5. | St Anthony | 12.50% | 0.23%(+12.3)#1 | 0.066%(+12.4)#5 |
| 6. | Greenehaven | 9.95% | 0.052%(+9.90)#1 | 0.066%(+9.88)#6 |
| 7. | Cactus | 8.97% | 0.060%(+8.91)#1 | 0.066%(+8.90)#7 |
| 8. | Columbus Junction | 8.87% | 0.23%(+8.64)#2 | 0.066%(+8.81)#8 |
| 9. | Fulda | 8.71% | 0.27%(+8.45)#2 | 0.066%(+8.65)#9 |
| 10. | Bell Hill | 7.44% | 0.068%(+7.38)#1 | 0.066%(+7.38)#10 |
| 11. | Huron | 7.29% | 0.17%(+7.12)#1 | 0.066%(+7.22)#11 |
| 12. | Springfield | 7.25% | 0.052%(+7.20)#1 | 0.066%(+7.19)#12 |
| 13. | Clarkston | 6.47% | 0.066%(+6.41)#2 | 0.066%(+6.41)#13 |
| 14. | Austin | 5.85% | 0.27%(+5.58)#3 | 0.066%(+5.78)#14 |
| 15. | Goodman | 5.72% | 0.029%(+5.69)#1 | 0.066%(+5.65)#15 |
| 16. | Utica | 5.65% | 0.11%(+5.54)#1 | 0.066%(+5.58)#16 |
| 17. | Conesville | 5.35% | 0.23%(+5.13)#3 | 0.066%(+5.29)#17 |
| 18. | Rensselaer | 5.24% | 0.11%(+5.14)#2 | 0.066%(+5.18)#18 |
| 19. | Bellerose Terrace | 5.01% | 0.11%(+4.91)#3 | 0.066%(+4.95)#19 |
| 20. | Jenks | 4.64% | 0.15%(+4.50)#1 | 0.066%(+4.58)#20 |
| 21. | Arbutus | 4.51% | 0.10%(+4.41)#2 | 0.066%(+4.44)#21 |
| 22. | Brewster | 4.48% | 0.27%(+4.21)#4 | 0.066%(+4.41)#22 |
| 23. | Adrian | 4.38% | 0.27%(+4.12)#5 | 0.066%(+4.32)#23 |
| 24. | Marshalltown | 4.37% | 0.23%(+4.15)#4 | 0.066%(+4.31)#24 |
| 25. | Edgecliff Village | 4.33% | 0.060%(+4.27)#2 | 0.066%(+4.27)#25 |
| 26. | Jeffers | 4.32% | 0.27%(+4.05)#6 | 0.066%(+4.26)#26 |
| 27. | Roseland | 4.26% | 0.36%(+3.91)#1 | 0.066%(+4.20)#27 |
| 28. | Bowling Green | 4.25% | 0.14%(+4.11)#1 | 0.066%(+4.18)#28 |
| 29. | Lyman | 3.95% | 0.019%(+3.93)#1 | 0.066%(+3.89)#29 |
| 30. | Vernon | 3.81% | 0.060%(+3.75)#3 | 0.066%(+3.75)#30 |
| 31. | Comer | 3.81% | 0.066%(+3.75)#3 | 0.066%(+3.75)#31 |
| 32. | Mattydale | 3.73% | 0.11%(+3.62)#4 | 0.066%(+3.66)#32 |
| 33. | Bel Aire | 3.63% | 0.15%(+3.48)#1 | 0.066%(+3.57)#33 |
| 34. | Nashville | 3.57% | 0.066%(+3.50)#4 | 0.066%(+3.50)#34 |
| 35. | Clarksville | 3.54% | 0.018%(+3.53)#1 | 0.066%(+3.48)#35 |
| 36. | Crescent Springs | 3.54% | 0.14%(+3.40)#2 | 0.066%(+3.47)#36 |
| 37. | Claypool | 3.44% | 0.41%(+3.03)#2 | 0.066%(+3.37)#37 |
| 38. | Schleswig | 3.43% | 0.23%(+3.20)#5 | 0.066%(+3.36)#38 |
| 39. | Fort Wayne | 3.29% | 0.41%(+2.88)#3 | 0.066%(+3.23)#39 |
| 40. | St Paul | 3.26% | 0.27%(+2.99)#7 | 0.066%(+3.19)#40 |
| 41. | Ranson Corporation | 3.26% | 0.013%(+3.24)#1 | 0.066%(+3.19)#41 |
| 42. | Norris Canyon | 3.25% | 0.060%(+3.19)#1 | 0.066%(+3.18)#42 |
| 43. | Swepsonville | 3.25% | 0.059%(+3.19)#1 | 0.066%(+3.18)#43 |
| 44. | Winnebago | 3.22% | 0.36%(+2.86)#2 | 0.066%(+3.16)#44 |
| 45. | Atoka | 3.16% | 0.15%(+3.02)#2 | 0.066%(+3.10)#45 |
| 46. | Marshall | 3.03% | 0.27%(+2.76)#8 | 0.066%(+2.96)#46 |
| 47. | Clive | 2.86% | 0.23%(+2.63)#6 | 0.066%(+2.79)#47 |
| 48. | Winooski | 2.82% | 0.092%(+2.73)#1 | 0.066%(+2.75)#48 |
| 49. | Sully Square | 2.73% | 0.025%(+2.71)#1 | 0.066%(+2.67)#49 |
| 50. | New Bern | 2.72% | 0.059%(+2.66)#2 | 0.066%(+2.65)#50 |
| 51. | Crete | 2.71% | 0.36%(+2.35)#3 | 0.066%(+2.64)#51 |
| 52. | North St Paul | 2.68% | 0.27%(+2.41)#9 | 0.066%(+2.61)#52 |
| 53. | Storm Lake | 2.67% | 0.23%(+2.44)#7 | 0.066%(+2.61)#53 |
| 54. | Eldridge | 2.61% | 0.23%(+2.39)#8 | 0.066%(+2.55)#54 |
| 55. | Battle Creek | 2.60% | 0.052%(+2.55)#2 | 0.066%(+2.54)#55 |
| 56. | Tukwila | 2.60% | 0.068%(+2.53)#2 | 0.066%(+2.53)#56 |
| 57. | New Hartford | 2.49% | 0.11%(+2.38)#5 | 0.066%(+2.42)#57 |
| 58. | Scranton | 2.45% | 0.018%(+2.43)#2 | 0.066%(+2.38)#58 |
| 59. | Leesburg | 2.44% | 0.41%(+2.03)#4 | 0.066%(+2.38)#59 |
| 60. | Rock Island | 2.42% | 0.060%(+2.36)#1 | 0.066%(+2.35)#60 |
| 61. | Knob Noster | 2.40% | 0.029%(+2.37)#2 | 0.066%(+2.33)#61 |
| 62. | Davis City | 2.31% | 0.23%(+2.09)#9 | 0.066%(+2.25)#62 |
| 63. | Byron Center | 2.30% | 0.052%(+2.25)#3 | 0.066%(+2.24)#63 |
| 64. | Worthington | 2.30% | 0.27%(+2.03)#10 | 0.066%(+2.23)#64 |
| 65. | Madison | 2.29% | 0.36%(+1.93)#4 | 0.066%(+2.22)#65 |
| 66. | Mcleod | 2.27% | 0.060%(+2.21)#4 | 0.066%(+2.20)#66 |
| 67. | Glenpool | 2.24% | 0.15%(+2.10)#3 | 0.066%(+2.18)#67 |
| 68. | North Bend | 2.24% | 0.36%(+1.88)#5 | 0.066%(+2.17)#68 |
| 69. | Wilber | 2.24% | 0.36%(+1.88)#6 | 0.066%(+2.17)#69 |
| 70. | Breckinridge Center | 2.20% | 0.14%(+2.06)#3 | 0.066%(+2.14)#70 |
| 71. | Glidden | 2.18% | 0.23%(+1.95)#10 | 0.066%(+2.11)#71 |
| 72. | Cramerton | 2.15% | 0.059%(+2.09)#3 | 0.066%(+2.09)#72 |
| 73. | Merritt Park | 2.13% | 0.11%(+2.02)#6 | 0.066%(+2.06)#73 |
| 74. | Owensboro | 2.06% | 0.14%(+1.92)#4 | 0.066%(+2.00)#74 |
| 75. | Yorkville | 1.97% | 0.11%(+1.87)#7 | 0.066%(+1.91)#75 |
| 76. | Kansas City | 1.96% | 0.15%(+1.81)#2 | 0.066%(+1.90)#76 |
| 77. | Irmo | 1.95% | 0.019%(+1.93)#2 | 0.066%(+1.89)#77 |
| 78. | Kentwood | 1.94% | 0.052%(+1.89)#4 | 0.066%(+1.87)#78 |
| 79. | Dumas | 1.92% | 0.060%(+1.86)#5 | 0.066%(+1.86)#79 |
| 80. | Seatac | 1.88% | 0.068%(+1.81)#3 | 0.066%(+1.82)#80 |
| 81. | Lyons | 1.87% | 0.41%(+1.46)#5 | 0.066%(+1.80)#81 |
| 82. | Shady Hollow | 1.87% | 0.060%(+1.81)#6 | 0.066%(+1.80)#82 |
| 83. | Tucker | 1.85% | 0.066%(+1.78)#5 | 0.066%(+1.78)#83 |
| 84. | Litchfield Borough | 1.85% | 0.014%(+1.83)#1 | 0.066%(+1.78)#84 |
| 85. | Woodlawn Cdp Baltimore County | 1.79% | 0.10%(+1.68)#3 | 0.066%(+1.72)#85 |
| 86. | Calcium | 1.77% | 0.11%(+1.66)#8 | 0.066%(+1.70)#86 |
| 87. | East Moline | 1.75% | 0.060%(+1.69)#2 | 0.066%(+1.69)#87 |
| 88. | Garden City | 1.75% | 0.15%(+1.60)#3 | 0.066%(+1.68)#88 |
| 89. | Melody Hill | 1.74% | 0.41%(+1.33)#6 | 0.066%(+1.67)#89 |
| 90. | Indianapolis | 1.72% | 0.41%(+1.31)#7 | 0.066%(+1.66)#90 |
| 91. | Catonsville | 1.70% | 0.10%(+1.60)#4 | 0.066%(+1.63)#91 |
| 92. | Port Lavaca | 1.65% | 0.060%(+1.59)#7 | 0.066%(+1.59)#92 |
| 93. | North El Monte | 1.63% | 0.060%(+1.57)#2 | 0.066%(+1.57)#93 |
| 94. | Centertown | 1.61% | 0.14%(+1.47)#5 | 0.066%(+1.54)#94 |
| 95. | Wyndham | 1.60% | 0.025%(+1.58)#2 | 0.066%(+1.54)#95 |
| 96. | Bells | 1.60% | 0.060%(+1.54)#8 | 0.066%(+1.53)#96 |
| 97. | West Harrison | 1.55% | 0.41%(+1.14)#8 | 0.066%(+1.49)#97 |
| 98. | Wheaton | 1.51% | 0.060%(+1.45)#3 | 0.066%(+1.45)#98 |
| 99. | Huntertown | 1.51% | 0.41%(+1.10)#9 | 0.066%(+1.44)#99 |
| 100. | Willmar | 1.50% | 0.27%(+1.24)#11 | 0.066%(+1.44)#100 |
Common Questions
What are the Top 10 Cities with the Highest Percentage of Indonesian Population in the United States?
Top 10 Cities with the Highest Percentage of Indonesian Population in the United States are:
#1
28.78%
#2
28.59%
#3
23.75%
#4
12.78%
#5
12.50%
#6
8.97%
#7
8.87%
#8
8.71%
#9
7.44%
#10
7.29%
What city has the Highest Percentage of Indonesian Population in the United States?
Carlton has the Highest Percentage of Indonesian Population in the United States with 28.78%.
What is the Percentage of Indonesian Population in the United States?
Percentage of Indonesian Population in the United States is 0.066%.