Lexington County, SC Map & Demographics
Lexington County Map
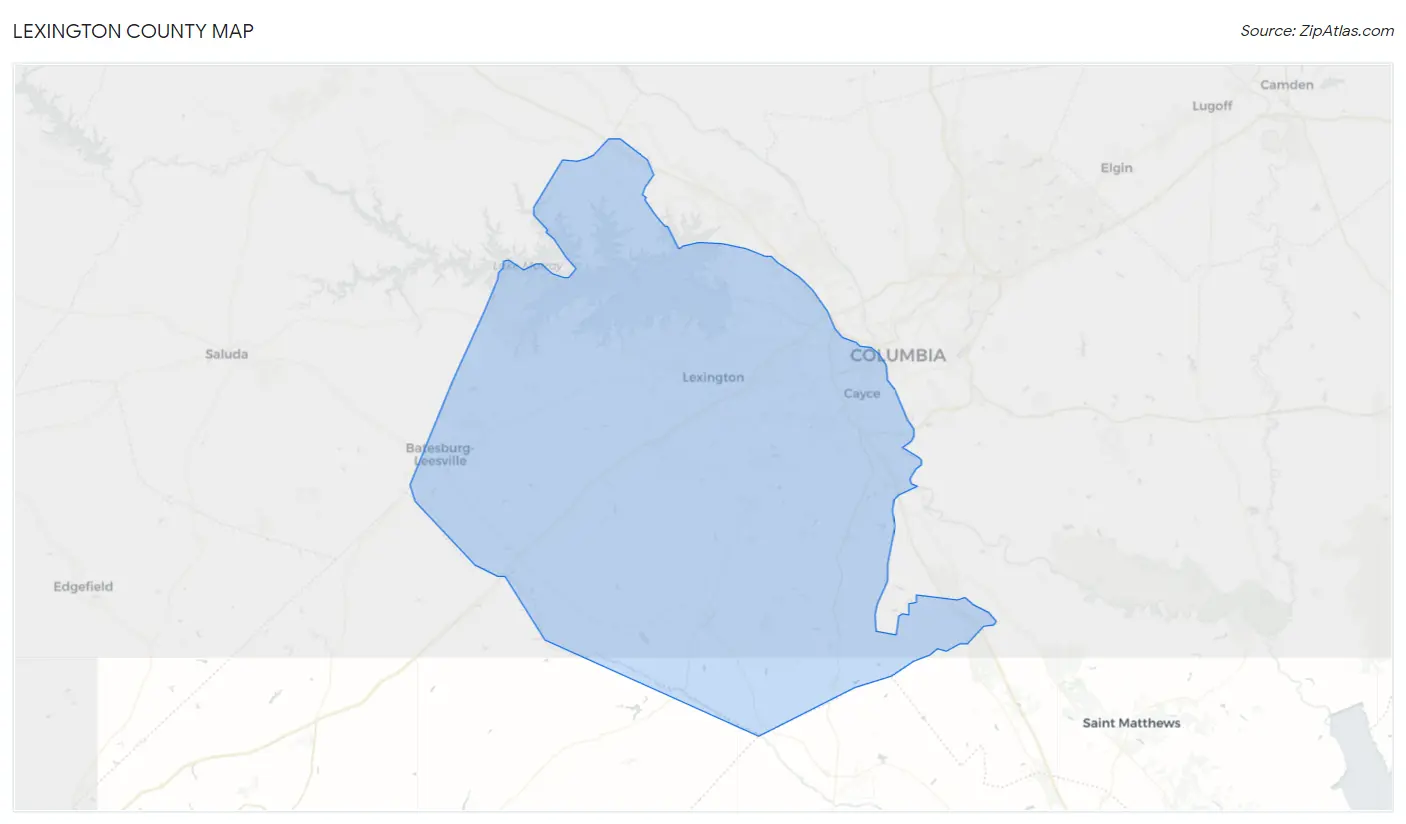
Lexington County Overview
$37,209
PER CAPITA INCOME
$85,806
AVG FAMILY INCOME
$71,280
AVG HOUSEHOLD INCOME
26.2%
WAGE / INCOME GAP [ % ]
73.8¢/ $1
WAGE / INCOME GAP [ $ ]
$10,180
FAMILY INCOME DEFICIT
0.43
INEQUALITY / GINI INDEX
295,934
TOTAL POPULATION
144,763
MALE POPULATION
151,171
FEMALE POPULATION
95.76
MALES / 100 FEMALES
104.43
FEMALES / 100 MALES
39.4
MEDIAN AGE
3.0
AVG FAMILY SIZE
2.5
AVG HOUSEHOLD SIZE
151,728
LABOR FORCE [ PEOPLE ]
64.3%
PERCENT IN LABOR FORCE
4.4%
UNEMPLOYMENT RATE
Lexington County Area Codes
Income in Lexington County
Income Overview in Lexington County
Per Capita Income in Lexington County is $37,209, while median incomes of families and households are $85,806 and $71,280 respectively.
| Characteristic | Number | Measure |
| Per Capita Income | 295,934 | $37,209 |
| Median Family Income | 79,936 | $85,806 |
| Mean Family Income | 79,936 | $105,349 |
| Median Household Income | 118,673 | $71,280 |
| Mean Household Income | 118,673 | $91,269 |
| Income Deficit | 79,936 | $10,180 |
| Wage / Income Gap (%) | 295,934 | 26.19% |
| Wage / Income Gap ($) | 295,934 | 73.81¢ per $1 |
| Gini / Inequality Index | 295,934 | 0.43 |
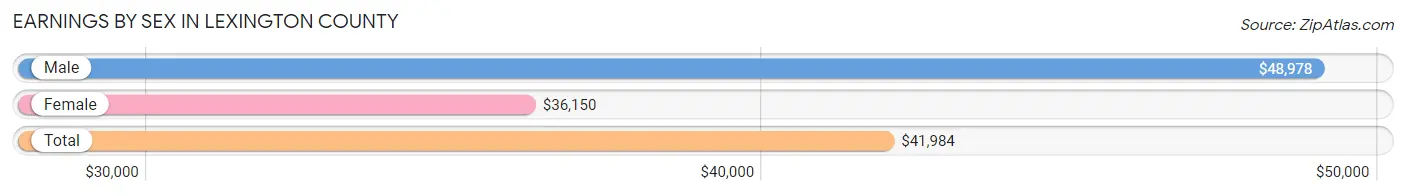
Earnings by Sex in Lexington County
Average Earnings in Lexington County are $41,984, $48,978 for men and $36,150 for women, a difference of 26.2%.
| Sex | Number | Average Earnings |
| Male | 82,246 (52.7%) | $48,978 |
| Female | 73,765 (47.3%) | $36,150 |
| Total | 156,011 (100.0%) | $41,984 |
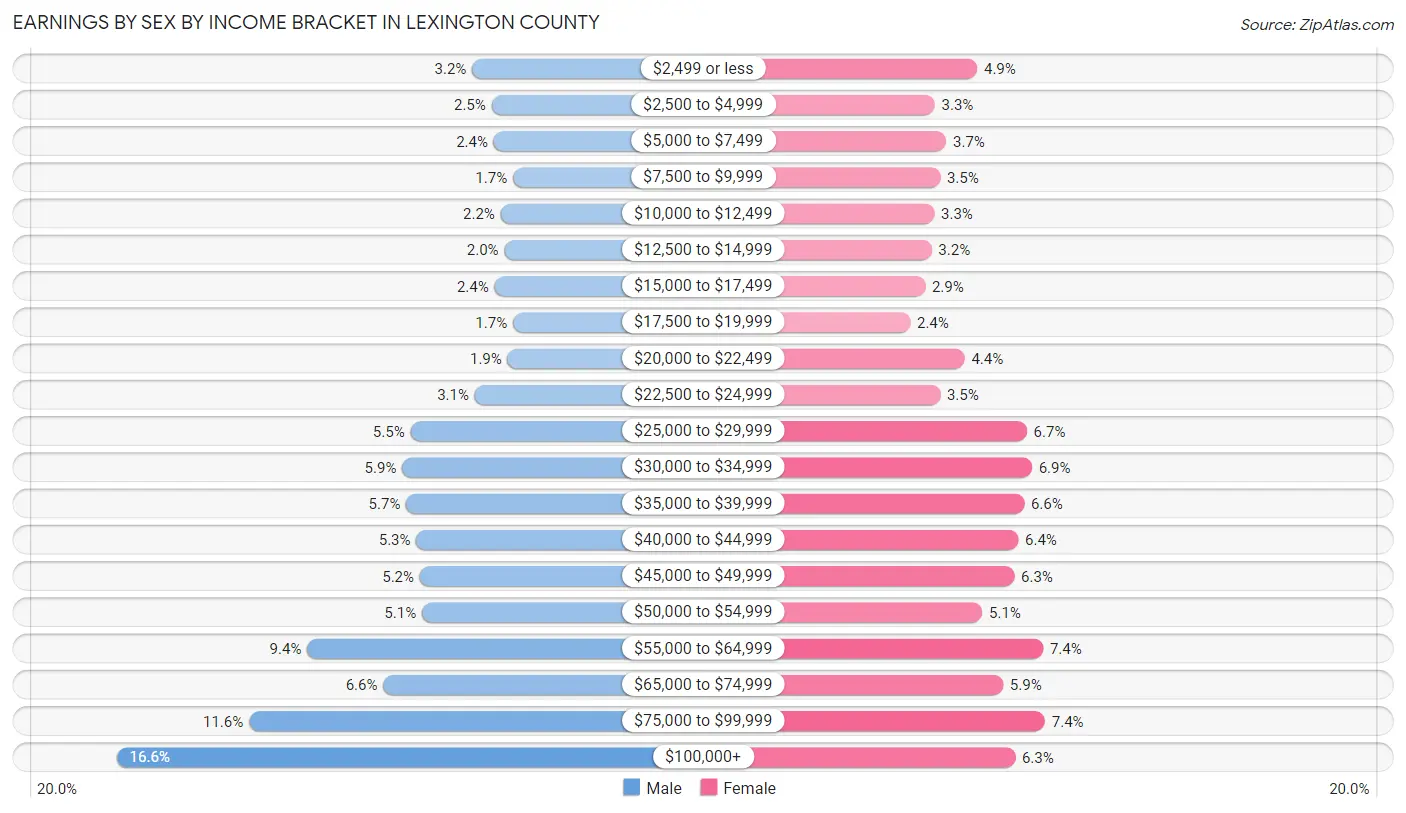
Earnings by Sex by Income Bracket in Lexington County
The most common earnings brackets in Lexington County are $100,000+ for men (13,614 | 16.6%) and $75,000 to $99,999 for women (5,472 | 7.4%).
| Income | Male | Female |
| $2,499 or less | 2,659 (3.2%) | 3,599 (4.9%) |
| $2,500 to $4,999 | 2,058 (2.5%) | 2,425 (3.3%) |
| $5,000 to $7,499 | 1,994 (2.4%) | 2,743 (3.7%) |
| $7,500 to $9,999 | 1,398 (1.7%) | 2,572 (3.5%) |
| $10,000 to $12,499 | 1,775 (2.2%) | 2,411 (3.3%) |
| $12,500 to $14,999 | 1,664 (2.0%) | 2,341 (3.2%) |
| $15,000 to $17,499 | 1,963 (2.4%) | 2,163 (2.9%) |
| $17,500 to $19,999 | 1,402 (1.7%) | 1,748 (2.4%) |
| $20,000 to $22,499 | 1,561 (1.9%) | 3,250 (4.4%) |
| $22,500 to $24,999 | 2,574 (3.1%) | 2,577 (3.5%) |
| $25,000 to $29,999 | 4,556 (5.5%) | 4,969 (6.7%) |
| $30,000 to $34,999 | 4,815 (5.9%) | 5,112 (6.9%) |
| $35,000 to $39,999 | 4,691 (5.7%) | 4,897 (6.6%) |
| $40,000 to $44,999 | 4,378 (5.3%) | 4,733 (6.4%) |
| $45,000 to $49,999 | 4,270 (5.2%) | 4,628 (6.3%) |
| $50,000 to $54,999 | 4,205 (5.1%) | 3,740 (5.1%) |
| $55,000 to $64,999 | 7,739 (9.4%) | 5,424 (7.3%) |
| $65,000 to $74,999 | 5,394 (6.6%) | 4,315 (5.9%) |
| $75,000 to $99,999 | 9,536 (11.6%) | 5,472 (7.4%) |
| $100,000+ | 13,614 (16.6%) | 4,646 (6.3%) |
| Total | 82,246 (100.0%) | 73,765 (100.0%) |
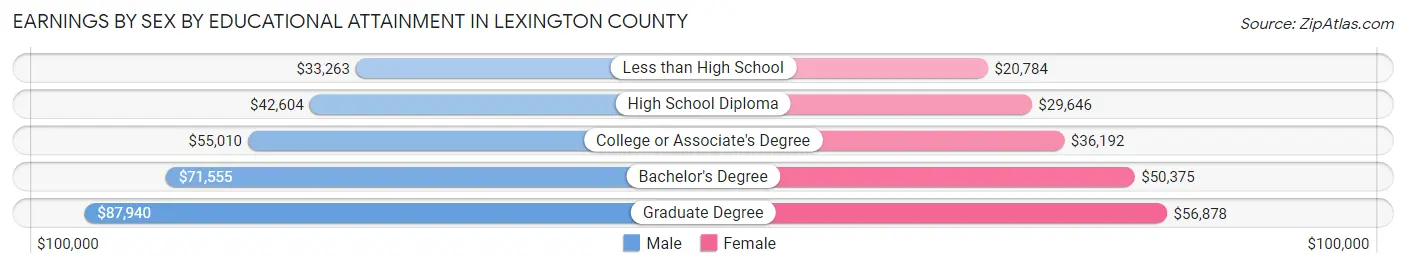
Earnings by Sex by Educational Attainment in Lexington County
Average earnings in Lexington County are $54,663 for men and $40,310 for women, a difference of 26.3%. Men with an educational attainment of graduate degree enjoy the highest average annual earnings of $87,940, while those with less than high school education earn the least with $33,263. Women with an educational attainment of graduate degree earn the most with the average annual earnings of $56,878, while those with less than high school education have the smallest earnings of $20,784.
| Educational Attainment | Male Income | Female Income |
| Less than High School | $33,263 | $20,784 |
| High School Diploma | $42,604 | $29,646 |
| College or Associate's Degree | $55,010 | $36,192 |
| Bachelor's Degree | $71,555 | $50,375 |
| Graduate Degree | $87,940 | $56,878 |
| Total | $54,663 | $40,310 |
Family Income in Lexington County
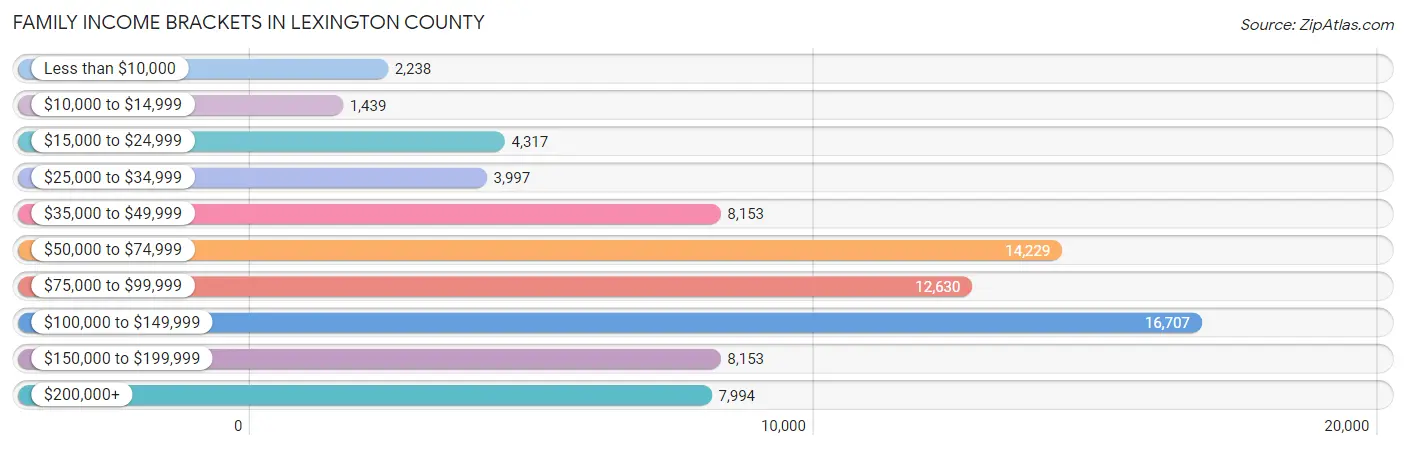
Family Income Brackets in Lexington County
According to the Lexington County family income data, there are 16,707 families falling into the $100,000 to $149,999 income range, which is the most common income bracket and makes up 20.9% of all families. Conversely, the $10,000 to $14,999 income bracket is the least frequent group with only 1,439 families (1.8%) belonging to this category.
| Income Bracket | # Families | % Families |
| Less than $10,000 | 2,238 | 2.8% |
| $10,000 to $14,999 | 1,439 | 1.8% |
| $15,000 to $24,999 | 4,317 | 5.4% |
| $25,000 to $34,999 | 3,997 | 5.0% |
| $35,000 to $49,999 | 8,153 | 10.2% |
| $50,000 to $74,999 | 14,229 | 17.8% |
| $75,000 to $99,999 | 12,630 | 15.8% |
| $100,000 to $149,999 | 16,707 | 20.9% |
| $150,000 to $199,999 | 8,153 | 10.2% |
| $200,000+ | 7,994 | 10.0% |
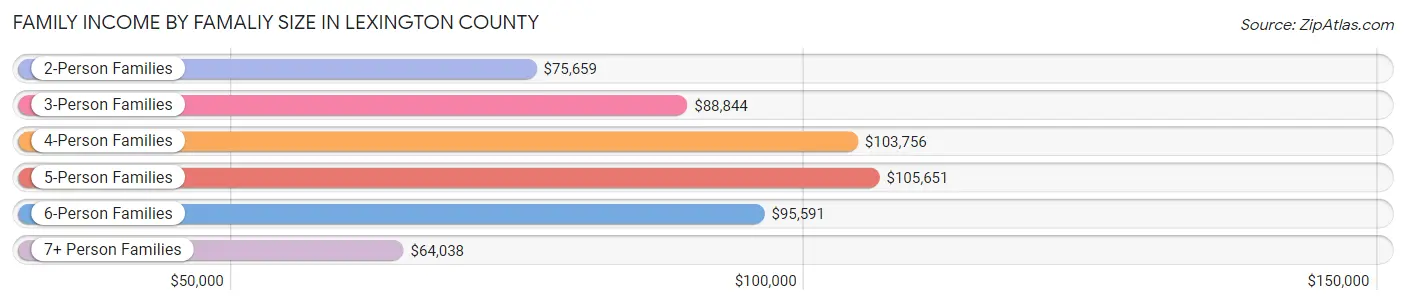
Family Income by Famaliy Size in Lexington County
5-person families (6,085 | 7.6%) account for the highest median family income in Lexington County with $105,651 per family, while 2-person families (38,051 | 47.6%) have the highest median income of $37,830 per family member.
| Income Bracket | # Families | Median Income |
| 2-Person Families | 38,051 (47.6%) | $75,659 |
| 3-Person Families | 17,865 (22.4%) | $88,844 |
| 4-Person Families | 14,552 (18.2%) | $103,756 |
| 5-Person Families | 6,085 (7.6%) | $105,651 |
| 6-Person Families | 2,535 (3.2%) | $95,591 |
| 7+ Person Families | 848 (1.1%) | $64,038 |
| Total | 79,936 (100.0%) | $85,806 |
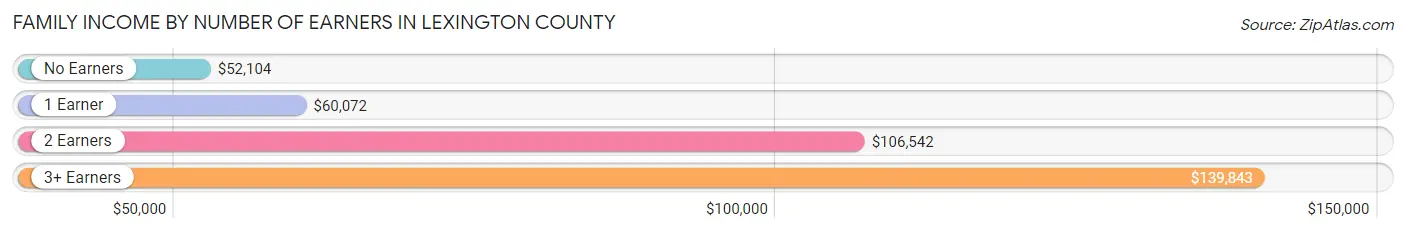
Family Income by Number of Earners in Lexington County
The median family income in Lexington County is $85,806, with families comprising 3+ earners (8,186) having the highest median family income of $139,843, while families with no earners (12,261) have the lowest median family income of $52,104, accounting for 10.2% and 15.3% of families, respectively.
| Number of Earners | # Families | Median Income |
| No Earners | 12,261 (15.3%) | $52,104 |
| 1 Earner | 26,149 (32.7%) | $60,072 |
| 2 Earners | 33,340 (41.7%) | $106,542 |
| 3+ Earners | 8,186 (10.2%) | $139,843 |
| Total | 79,936 (100.0%) | $85,806 |
Household Income in Lexington County
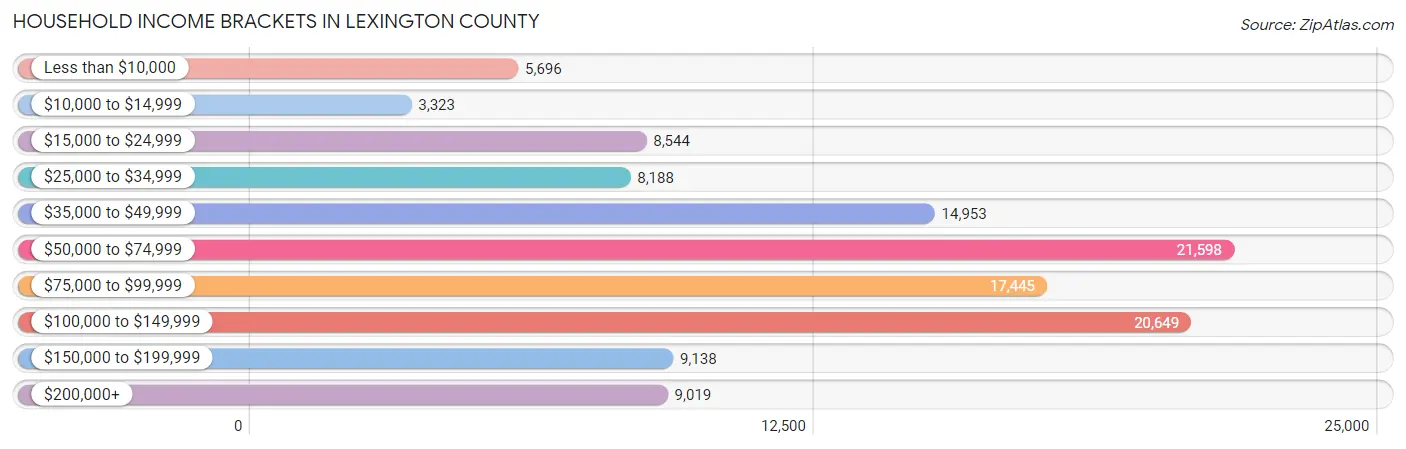
Household Income Brackets in Lexington County
With 21,598 households falling in the category, the $50,000 to $74,999 income range is the most frequent in Lexington County, accounting for 18.2% of all households. In contrast, only 3,323 households (2.8%) fall into the $10,000 to $14,999 income bracket, making it the least populous group.
| Income Bracket | # Households | % Households |
| Less than $10,000 | 5,696 | 4.8% |
| $10,000 to $14,999 | 3,323 | 2.8% |
| $15,000 to $24,999 | 8,544 | 7.2% |
| $25,000 to $34,999 | 8,188 | 6.9% |
| $35,000 to $49,999 | 14,953 | 12.6% |
| $50,000 to $74,999 | 21,598 | 18.2% |
| $75,000 to $99,999 | 17,445 | 14.7% |
| $100,000 to $149,999 | 20,649 | 17.4% |
| $150,000 to $199,999 | 9,138 | 7.7% |
| $200,000+ | 9,019 | 7.6% |
Household Income by Householder Age in Lexington County
The median household income in Lexington County is $71,280, with the highest median household income of $86,544 found in the 45 to 64 years age bracket for the primary householder. A total of 45,195 households (38.1%) fall into this category. Meanwhile, the 15 to 24 years age bracket for the primary householder has the lowest median household income of $36,049, with 3,663 households (3.1%) in this group.
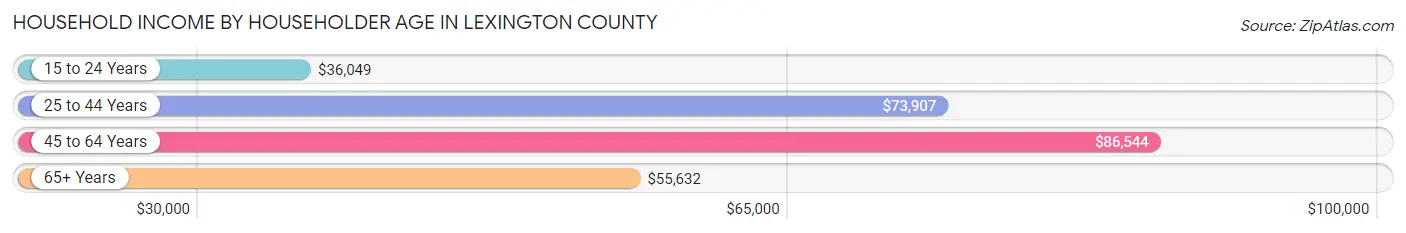
| Income Bracket | # Households | Median Income |
| 15 to 24 Years | 3,663 (3.1%) | $36,049 |
| 25 to 44 Years | 38,566 (32.5%) | $73,907 |
| 45 to 64 Years | 45,195 (38.1%) | $86,544 |
| 65+ Years | 31,249 (26.3%) | $55,632 |
| Total | 118,673 (100.0%) | $71,280 |
Poverty in Lexington County
Income Below Poverty by Sex and Age in Lexington County
With 10.0% poverty level for males and 13.2% for females among the residents of Lexington County, 5 year old males and 18 to 24 year old females are the most vulnerable to poverty, with 503 males (26.7%) and 2,671 females (23.9%) in their respective age groups living below the poverty level.
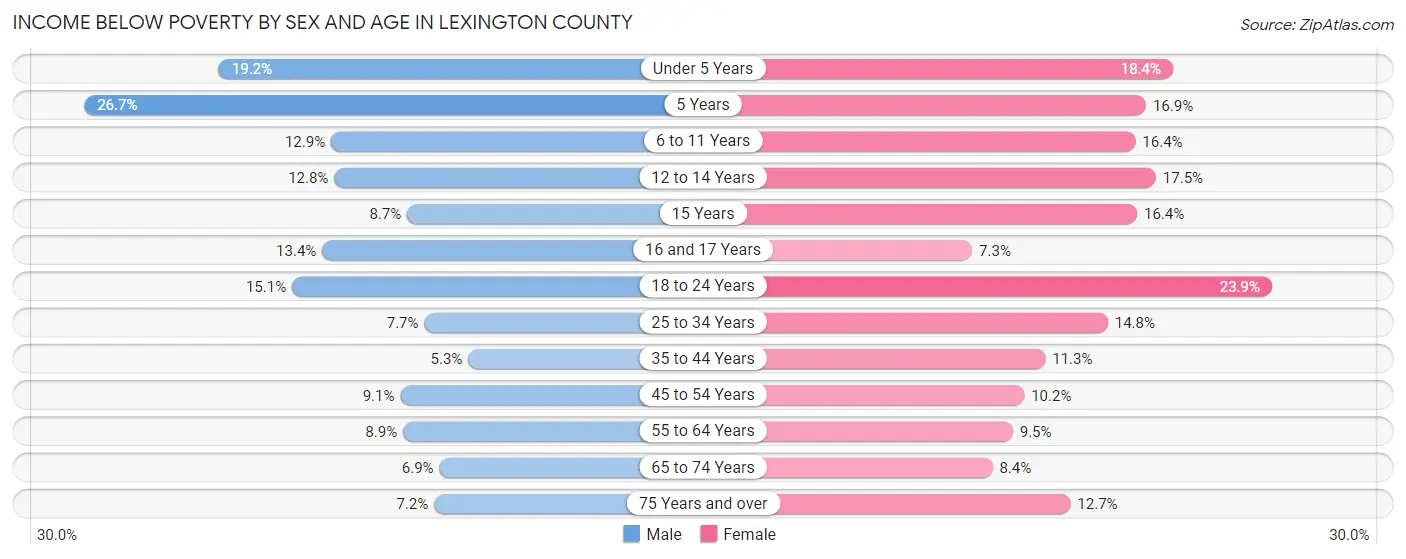
| Age Bracket | Male | Female |
| Under 5 Years | 1,577 (19.2%) | 1,471 (18.4%) |
| 5 Years | 503 (26.7%) | 316 (16.9%) |
| 6 to 11 Years | 1,460 (12.9%) | 1,792 (16.4%) |
| 12 to 14 Years | 819 (12.8%) | 1,016 (17.5%) |
| 15 Years | 195 (8.7%) | 378 (16.4%) |
| 16 and 17 Years | 535 (13.4%) | 270 (7.3%) |
| 18 to 24 Years | 1,761 (15.1%) | 2,671 (23.9%) |
| 25 to 34 Years | 1,461 (7.7%) | 2,920 (14.8%) |
| 35 to 44 Years | 992 (5.3%) | 2,249 (11.3%) |
| 45 to 54 Years | 1,757 (9.1%) | 1,996 (10.2%) |
| 55 to 64 Years | 1,705 (8.9%) | 1,927 (9.5%) |
| 65 to 74 Years | 943 (6.9%) | 1,324 (8.4%) |
| 75 Years and over | 548 (7.2%) | 1,381 (12.7%) |
| Total | 14,256 (10.0%) | 19,711 (13.2%) |
Income Above Poverty by Sex and Age in Lexington County
According to the poverty statistics in Lexington County, males aged 35 to 44 years and females aged 16 and 17 years are the age groups that are most secure financially, with 94.7% of males and 92.7% of females in these age groups living above the poverty line.
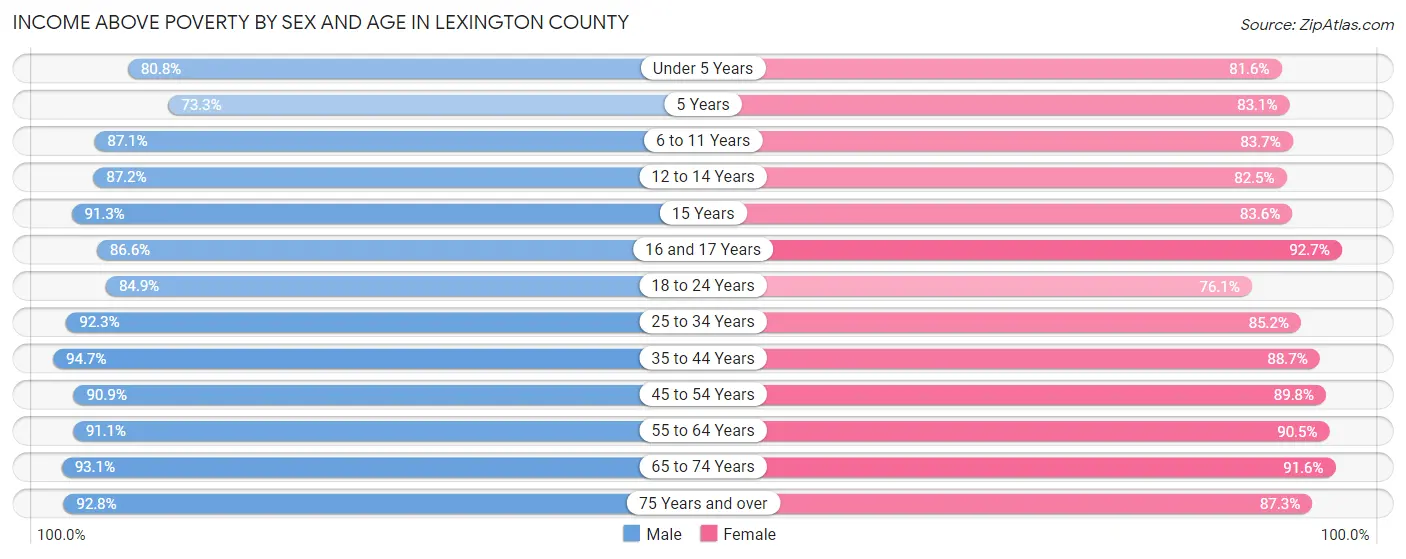
| Age Bracket | Male | Female |
| Under 5 Years | 6,643 (80.8%) | 6,509 (81.6%) |
| 5 Years | 1,382 (73.3%) | 1,549 (83.1%) |
| 6 to 11 Years | 9,822 (87.1%) | 9,170 (83.7%) |
| 12 to 14 Years | 5,598 (87.2%) | 4,792 (82.5%) |
| 15 Years | 2,047 (91.3%) | 1,921 (83.6%) |
| 16 and 17 Years | 3,449 (86.6%) | 3,451 (92.7%) |
| 18 to 24 Years | 9,896 (84.9%) | 8,485 (76.1%) |
| 25 to 34 Years | 17,414 (92.3%) | 16,796 (85.2%) |
| 35 to 44 Years | 17,729 (94.7%) | 17,601 (88.7%) |
| 45 to 54 Years | 17,587 (90.9%) | 17,644 (89.8%) |
| 55 to 64 Years | 17,396 (91.1%) | 18,305 (90.5%) |
| 65 to 74 Years | 12,719 (93.1%) | 14,466 (91.6%) |
| 75 Years and over | 7,058 (92.8%) | 9,466 (87.3%) |
| Total | 128,740 (90.0%) | 130,155 (86.9%) |
Income Below Poverty Among Married-Couple Families in Lexington County
The poverty statistics for married-couple families in Lexington County show that 3.8% or 2,271 of the total 59,134 families live below the poverty line. Families with 3 or 4 children have the highest poverty rate of 7.3%, comprising of 349 families. On the other hand, families with no children have the lowest poverty rate of 3.4%, which includes 1,161 families.
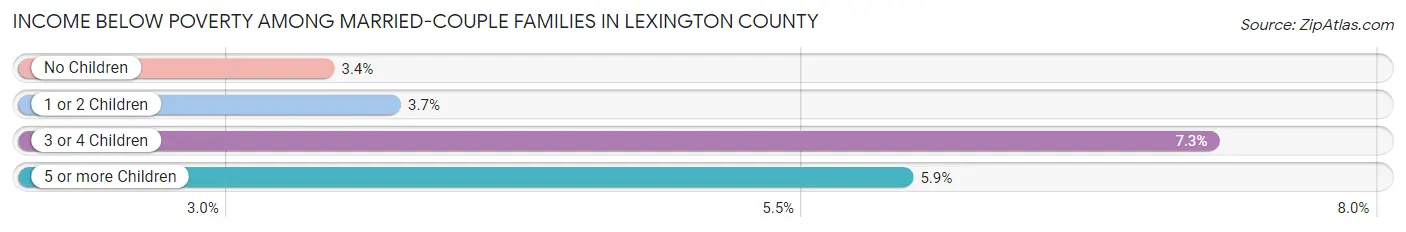
| Children | Above Poverty | Below Poverty |
| No Children | 32,833 (96.6%) | 1,161 (3.4%) |
| 1 or 2 Children | 19,292 (96.3%) | 743 (3.7%) |
| 3 or 4 Children | 4,453 (92.7%) | 349 (7.3%) |
| 5 or more Children | 285 (94.1%) | 18 (5.9%) |
| Total | 56,863 (96.2%) | 2,271 (3.8%) |
Income Below Poverty Among Single-Parent Households in Lexington County
According to the poverty data in Lexington County, 16.6% or 960 single-father households and 25.1% or 3,770 single-mother households are living below the poverty line. Among single-father households, those with 3 or 4 children have the highest poverty rate, with 141 households (31.5%) experiencing poverty. Likewise, among single-mother households, those with 5 or more children have the highest poverty rate, with 153 households (65.7%) falling below the poverty line.
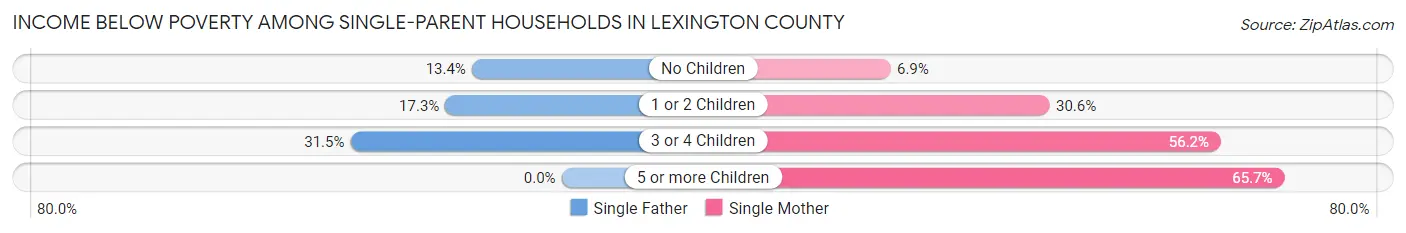
| Children | Single Father | Single Mother |
| No Children | 334 (13.4%) | 372 (6.9%) |
| 1 or 2 Children | 485 (17.3%) | 2,443 (30.6%) |
| 3 or 4 Children | 141 (31.5%) | 802 (56.2%) |
| 5 or more Children | 0 (0.0%) | 153 (65.7%) |
| Total | 960 (16.6%) | 3,770 (25.1%) |
Income Below Poverty Among Married-Couple vs Single-Parent Households in Lexington County
The poverty data for Lexington County shows that 2,271 of the married-couple family households (3.8%) and 4,730 of the single-parent households (22.7%) are living below the poverty level. Within the married-couple family households, those with 3 or 4 children have the highest poverty rate, with 349 households (7.3%) falling below the poverty line. Among the single-parent households, those with 5 or more children have the highest poverty rate, with 153 household (57.3%) living below poverty.
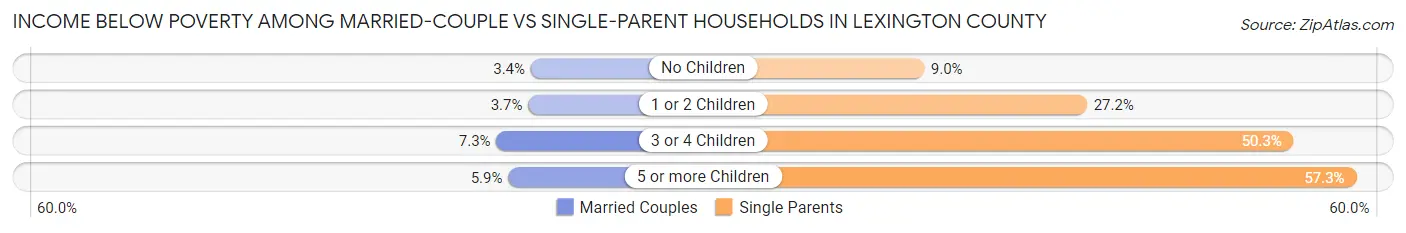
| Children | Married-Couple Families | Single-Parent Households |
| No Children | 1,161 (3.4%) | 706 (9.0%) |
| 1 or 2 Children | 743 (3.7%) | 2,928 (27.2%) |
| 3 or 4 Children | 349 (7.3%) | 943 (50.3%) |
| 5 or more Children | 18 (5.9%) | 153 (57.3%) |
| Total | 2,271 (3.8%) | 4,730 (22.7%) |
Race in Lexington County
The most populous races in Lexington County are White / Caucasian (222,068 | 75.0%), Black / African American (44,550 | 15.0%), and Hispanic or Latino (19,189 | 6.5%).
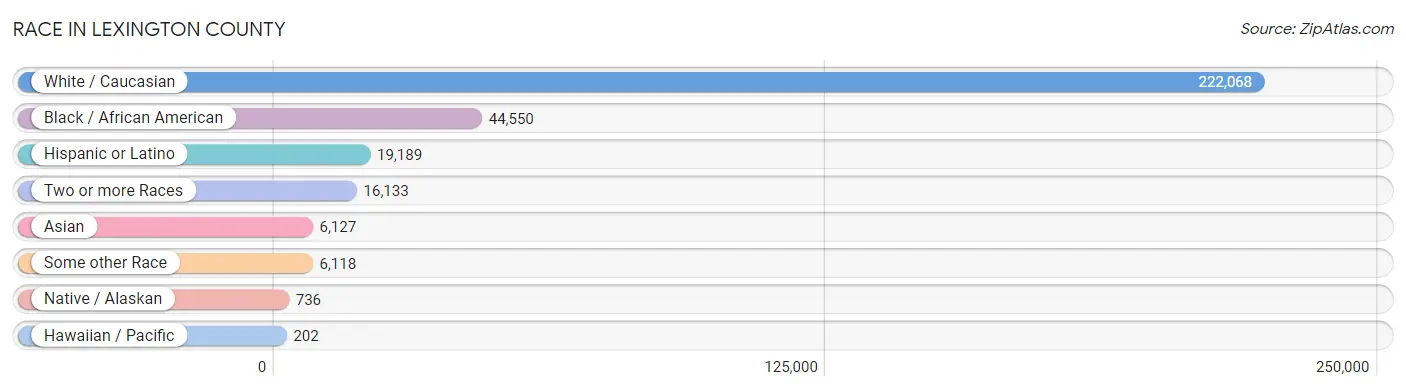
| Race | # Population | % Population |
| Asian | 6,127 | 2.1% |
| Black / African American | 44,550 | 15.0% |
| Hawaiian / Pacific | 202 | 0.1% |
| Hispanic or Latino | 19,189 | 6.5% |
| Native / Alaskan | 736 | 0.3% |
| White / Caucasian | 222,068 | 75.0% |
| Two or more Races | 16,133 | 5.4% |
| Some other Race | 6,118 | 2.1% |
| Total | 295,934 | 100.0% |
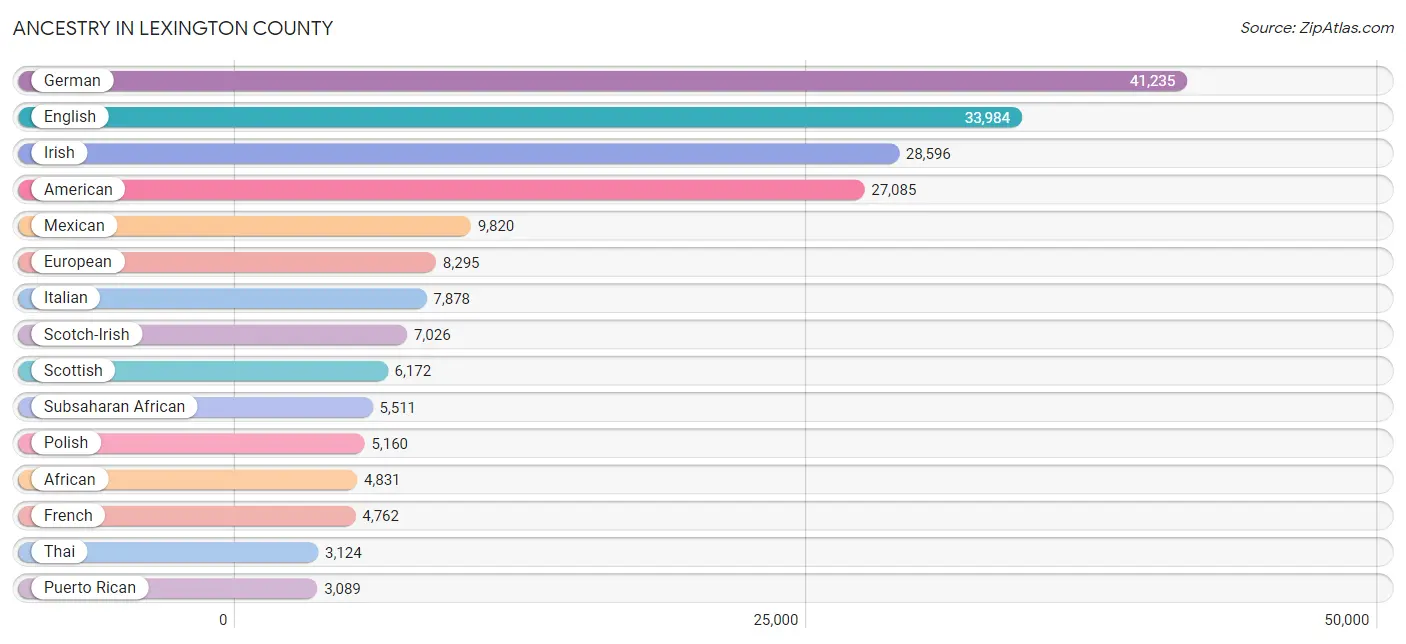
Ancestry in Lexington County
The most populous ancestries reported in Lexington County are German (41,235 | 13.9%), English (33,984 | 11.5%), Irish (28,596 | 9.7%), American (27,085 | 9.1%), and Mexican (9,820 | 3.3%), together accounting for 47.5% of all Lexington County residents.
| Ancestry | # Population | % Population |
| African | 4,831 | 1.6% |
| American | 27,085 | 9.1% |
| Apache | 63 | 0.0% |
| Arab | 1,800 | 0.6% |
| Argentinean | 105 | 0.0% |
| Armenian | 57 | 0.0% |
| Australian | 70 | 0.0% |
| Austrian | 714 | 0.2% |
| Bangladeshi | 63 | 0.0% |
| Belgian | 136 | 0.1% |
| Bhutanese | 329 | 0.1% |
| Blackfeet | 53 | 0.0% |
| Bolivian | 86 | 0.0% |
| Brazilian | 61 | 0.0% |
| British | 1,741 | 0.6% |
| British West Indian | 9 | 0.0% |
| Bulgarian | 29 | 0.0% |
| Burmese | 541 | 0.2% |
| Canadian | 478 | 0.2% |
| Cape Verdean | 11 | 0.0% |
| Celtic | 54 | 0.0% |
| Central American | 2,506 | 0.9% |
| Central American Indian | 78 | 0.0% |
| Cherokee | 885 | 0.3% |
| Chickasaw | 25 | 0.0% |
| Chilean | 48 | 0.0% |
| Chippewa | 35 | 0.0% |
| Choctaw | 100 | 0.0% |
| Colombian | 970 | 0.3% |
| Comanche | 12 | 0.0% |
| Costa Rican | 101 | 0.0% |
| Cree | 3 | 0.0% |
| Creek | 26 | 0.0% |
| Croatian | 82 | 0.0% |
| Crow | 17 | 0.0% |
| Cuban | 895 | 0.3% |
| Czech | 324 | 0.1% |
| Czechoslovakian | 65 | 0.0% |
| Danish | 1,168 | 0.4% |
| Dominican | 124 | 0.0% |
| Dutch | 2,618 | 0.9% |
| Eastern European | 555 | 0.2% |
| Ecuadorian | 68 | 0.0% |
| Egyptian | 83 | 0.0% |
| English | 33,984 | 11.5% |
| Estonian | 14 | 0.0% |
| Ethiopian | 261 | 0.1% |
| European | 8,295 | 2.8% |
| Filipino | 73 | 0.0% |
| Finnish | 183 | 0.1% |
| French | 4,762 | 1.6% |
| French American Indian | 1 | 0.0% |
| French Canadian | 823 | 0.3% |
| German | 41,235 | 13.9% |
| Greek | 692 | 0.2% |
| Guamanian / Chamorro | 27 | 0.0% |
| Guatemalan | 857 | 0.3% |
| Guyanese | 74 | 0.0% |
| Haitian | 143 | 0.1% |
| Honduran | 939 | 0.3% |
| Hungarian | 832 | 0.3% |
| Icelander | 11 | 0.0% |
| Indian (Asian) | 1,120 | 0.4% |
| Indonesian | 35 | 0.0% |
| Iranian | 159 | 0.1% |
| Iraqi | 671 | 0.2% |
| Irish | 28,596 | 9.7% |
| Iroquois | 14 | 0.0% |
| Israeli | 59 | 0.0% |
| Italian | 7,878 | 2.7% |
| Jamaican | 210 | 0.1% |
| Japanese | 40 | 0.0% |
| Jordanian | 107 | 0.0% |
| Korean | 1,082 | 0.4% |
| Laotian | 19 | 0.0% |
| Latvian | 117 | 0.0% |
| Lebanese | 610 | 0.2% |
| Lithuanian | 259 | 0.1% |
| Lumbee | 267 | 0.1% |
| Luxembourger | 21 | 0.0% |
| Macedonian | 12 | 0.0% |
| Malaysian | 215 | 0.1% |
| Mexican | 9,820 | 3.3% |
| Mexican American Indian | 122 | 0.0% |
| Mongolian | 5 | 0.0% |
| Moroccan | 5 | 0.0% |
| Native Hawaiian | 312 | 0.1% |
| Navajo | 29 | 0.0% |
| Nicaraguan | 122 | 0.0% |
| Nigerian | 193 | 0.1% |
| Northern European | 1,040 | 0.4% |
| Norwegian | 1,442 | 0.5% |
| Okinawan | 78 | 0.0% |
| Pakistani | 480 | 0.2% |
| Palestinian | 40 | 0.0% |
| Panamanian | 121 | 0.0% |
| Pennsylvania German | 45 | 0.0% |
| Peruvian | 151 | 0.1% |
| Polish | 5,160 | 1.7% |
| Portuguese | 319 | 0.1% |
| Potawatomi | 5 | 0.0% |
| Pueblo | 16 | 0.0% |
| Puerto Rican | 3,089 | 1.0% |
| Romanian | 351 | 0.1% |
| Russian | 726 | 0.3% |
| Salvadoran | 366 | 0.1% |
| Samoan | 60 | 0.0% |
| Scandinavian | 659 | 0.2% |
| Scotch-Irish | 7,026 | 2.4% |
| Scottish | 6,172 | 2.1% |
| Serbian | 339 | 0.1% |
| Sioux | 75 | 0.0% |
| Slavic | 164 | 0.1% |
| Slovak | 199 | 0.1% |
| Slovene | 100 | 0.0% |
| South African | 83 | 0.0% |
| South American | 1,774 | 0.6% |
| South American Indian | 19 | 0.0% |
| Spaniard | 214 | 0.1% |
| Spanish | 338 | 0.1% |
| Spanish American | 161 | 0.1% |
| Sri Lankan | 484 | 0.2% |
| Subsaharan African | 5,511 | 1.9% |
| Swedish | 1,753 | 0.6% |
| Swiss | 874 | 0.3% |
| Syrian | 108 | 0.0% |
| Taiwanese | 14 | 0.0% |
| Thai | 3,124 | 1.1% |
| Trinidadian and Tobagonian | 41 | 0.0% |
| Turkish | 80 | 0.0% |
| Ukrainian | 674 | 0.2% |
| Uruguayan | 14 | 0.0% |
| Venezuelan | 332 | 0.1% |
| Vietnamese | 54 | 0.0% |
| Welsh | 1,486 | 0.5% |
| West Indian | 229 | 0.1% |
| Yugoslavian | 142 | 0.1% | View All 137 Rows |
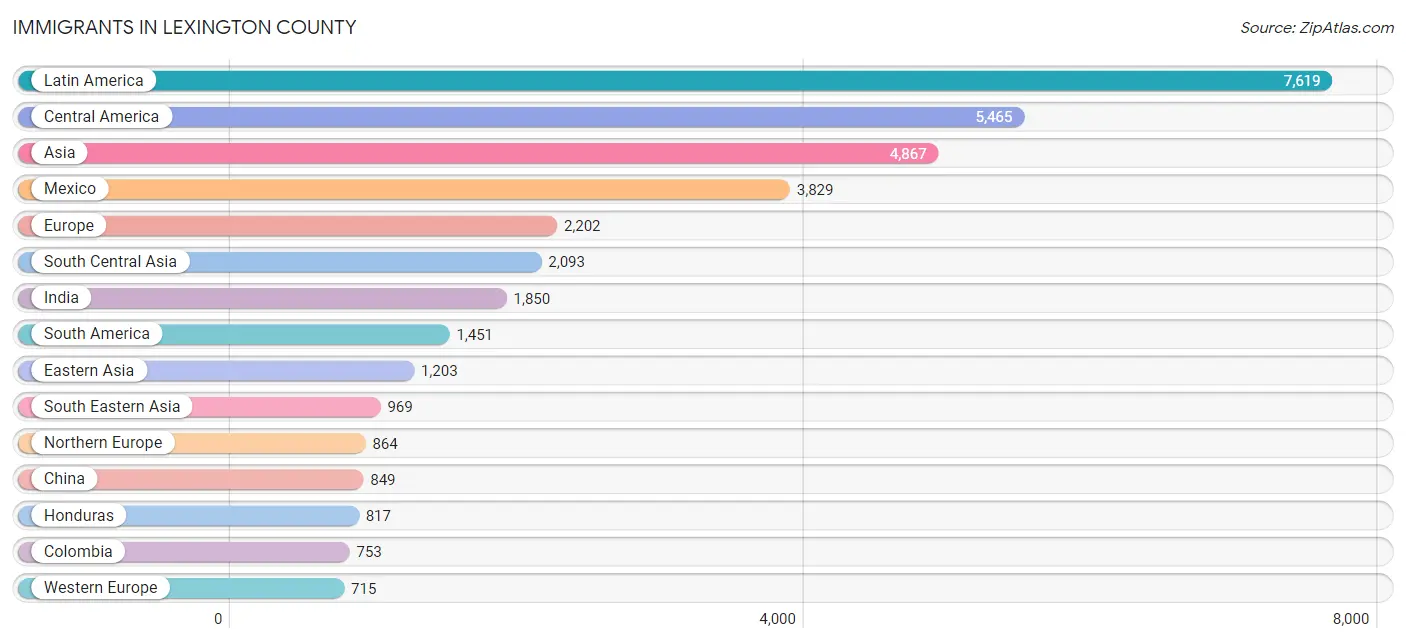
Immigrants in Lexington County
The most numerous immigrant groups reported in Lexington County came from Latin America (7,619 | 2.6%), Central America (5,465 | 1.8%), Asia (4,867 | 1.6%), Mexico (3,829 | 1.3%), and Europe (2,202 | 0.7%), together accounting for 8.1% of all Lexington County residents.
| Immigration Origin | # Population | % Population |
| Africa | 550 | 0.2% |
| Argentina | 95 | 0.0% |
| Asia | 4,867 | 1.6% |
| Australia | 32 | 0.0% |
| Austria | 54 | 0.0% |
| Bahamas | 15 | 0.0% |
| Bangladesh | 99 | 0.0% |
| Belarus | 31 | 0.0% |
| Belgium | 10 | 0.0% |
| Bolivia | 48 | 0.0% |
| Bosnia and Herzegovina | 34 | 0.0% |
| Brazil | 121 | 0.0% |
| Bulgaria | 13 | 0.0% |
| Canada | 387 | 0.1% |
| Caribbean | 703 | 0.2% |
| Central America | 5,465 | 1.8% |
| Chile | 48 | 0.0% |
| China | 849 | 0.3% |
| Colombia | 753 | 0.3% |
| Costa Rica | 96 | 0.0% |
| Cuba | 337 | 0.1% |
| Czechoslovakia | 10 | 0.0% |
| Denmark | 48 | 0.0% |
| Dominican Republic | 38 | 0.0% |
| Eastern Africa | 272 | 0.1% |
| Eastern Asia | 1,203 | 0.4% |
| Eastern Europe | 511 | 0.2% |
| Egypt | 24 | 0.0% |
| El Salvador | 154 | 0.1% |
| England | 445 | 0.2% |
| Eritrea | 42 | 0.0% |
| Ethiopia | 150 | 0.1% |
| Europe | 2,202 | 0.7% |
| Fiji | 19 | 0.0% |
| France | 139 | 0.1% |
| Germany | 471 | 0.2% |
| Greece | 29 | 0.0% |
| Grenada | 21 | 0.0% |
| Guatemala | 492 | 0.2% |
| Haiti | 75 | 0.0% |
| Honduras | 817 | 0.3% |
| Hong Kong | 53 | 0.0% |
| Hungary | 92 | 0.0% |
| India | 1,850 | 0.6% |
| Indonesia | 6 | 0.0% |
| Iran | 44 | 0.0% |
| Iraq | 424 | 0.1% |
| Ireland | 85 | 0.0% |
| Italy | 56 | 0.0% |
| Jamaica | 167 | 0.1% |
| Japan | 134 | 0.1% |
| Kazakhstan | 72 | 0.0% |
| Kenya | 20 | 0.0% |
| Korea | 220 | 0.1% |
| Laos | 77 | 0.0% |
| Latin America | 7,619 | 2.6% |
| Latvia | 11 | 0.0% |
| Lebanon | 33 | 0.0% |
| Liberia | 54 | 0.0% |
| Mexico | 3,829 | 1.3% |
| Micronesia | 109 | 0.0% |
| Middle Africa | 34 | 0.0% |
| Moldova | 18 | 0.0% |
| Morocco | 11 | 0.0% |
| Netherlands | 29 | 0.0% |
| Nicaragua | 60 | 0.0% |
| Nigeria | 31 | 0.0% |
| North Macedonia | 12 | 0.0% |
| Northern Africa | 51 | 0.0% |
| Northern Europe | 864 | 0.3% |
| Oceania | 160 | 0.1% |
| Panama | 17 | 0.0% |
| Peru | 100 | 0.0% |
| Philippines | 446 | 0.2% |
| Poland | 81 | 0.0% |
| Portugal | 18 | 0.0% |
| Romania | 68 | 0.0% |
| Russia | 59 | 0.0% |
| Scotland | 82 | 0.0% |
| Singapore | 32 | 0.0% |
| South Africa | 28 | 0.0% |
| South America | 1,451 | 0.5% |
| South Central Asia | 2,093 | 0.7% |
| South Eastern Asia | 969 | 0.3% |
| Southern Europe | 112 | 0.0% |
| Spain | 9 | 0.0% |
| Sri Lanka | 28 | 0.0% |
| Sweden | 94 | 0.0% |
| Switzerland | 12 | 0.0% |
| Taiwan | 36 | 0.0% |
| Thailand | 212 | 0.1% |
| Trinidad and Tobago | 41 | 0.0% |
| Turkey | 19 | 0.0% |
| Uganda | 7 | 0.0% |
| Ukraine | 69 | 0.0% |
| Uruguay | 14 | 0.0% |
| Venezuela | 272 | 0.1% |
| Vietnam | 184 | 0.1% |
| Western Africa | 146 | 0.1% |
| Western Asia | 599 | 0.2% |
| Western Europe | 715 | 0.2% |
| Yemen | 112 | 0.0% |
| Zaire | 34 | 0.0% | View All 103 Rows |
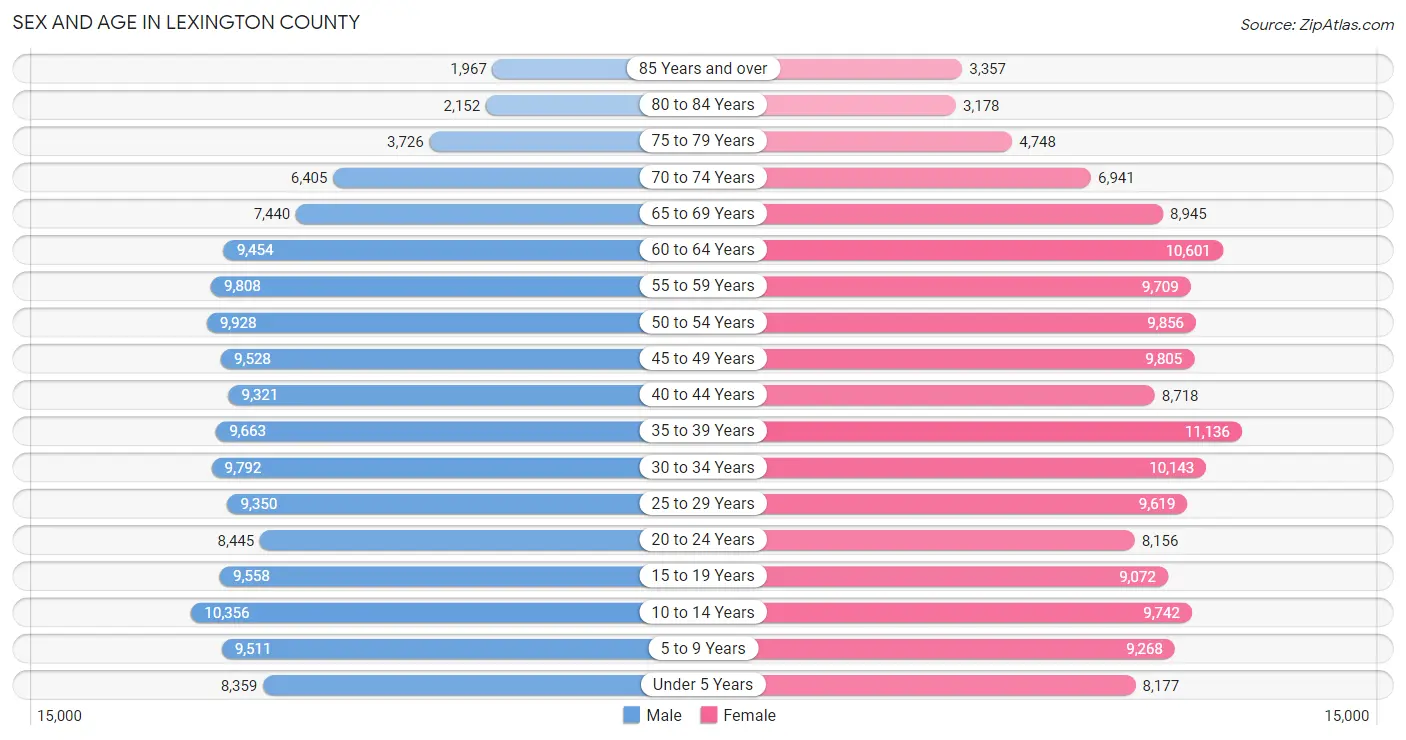
Sex and Age in Lexington County
Sex and Age in Lexington County
The most populous age groups in Lexington County are 10 to 14 Years (10,356 | 7.1%) for men and 35 to 39 Years (11,136 | 7.4%) for women.
| Age Bracket | Male | Female |
| Under 5 Years | 8,359 (5.8%) | 8,177 (5.4%) |
| 5 to 9 Years | 9,511 (6.6%) | 9,268 (6.1%) |
| 10 to 14 Years | 10,356 (7.1%) | 9,742 (6.4%) |
| 15 to 19 Years | 9,558 (6.6%) | 9,072 (6.0%) |
| 20 to 24 Years | 8,445 (5.8%) | 8,156 (5.4%) |
| 25 to 29 Years | 9,350 (6.5%) | 9,619 (6.4%) |
| 30 to 34 Years | 9,792 (6.8%) | 10,143 (6.7%) |
| 35 to 39 Years | 9,663 (6.7%) | 11,136 (7.4%) |
| 40 to 44 Years | 9,321 (6.4%) | 8,718 (5.8%) |
| 45 to 49 Years | 9,528 (6.6%) | 9,805 (6.5%) |
| 50 to 54 Years | 9,928 (6.9%) | 9,856 (6.5%) |
| 55 to 59 Years | 9,808 (6.8%) | 9,709 (6.4%) |
| 60 to 64 Years | 9,454 (6.5%) | 10,601 (7.0%) |
| 65 to 69 Years | 7,440 (5.1%) | 8,945 (5.9%) |
| 70 to 74 Years | 6,405 (4.4%) | 6,941 (4.6%) |
| 75 to 79 Years | 3,726 (2.6%) | 4,748 (3.1%) |
| 80 to 84 Years | 2,152 (1.5%) | 3,178 (2.1%) |
| 85 Years and over | 1,967 (1.4%) | 3,357 (2.2%) |
| Total | 144,763 (100.0%) | 151,171 (100.0%) |
Families and Households in Lexington County
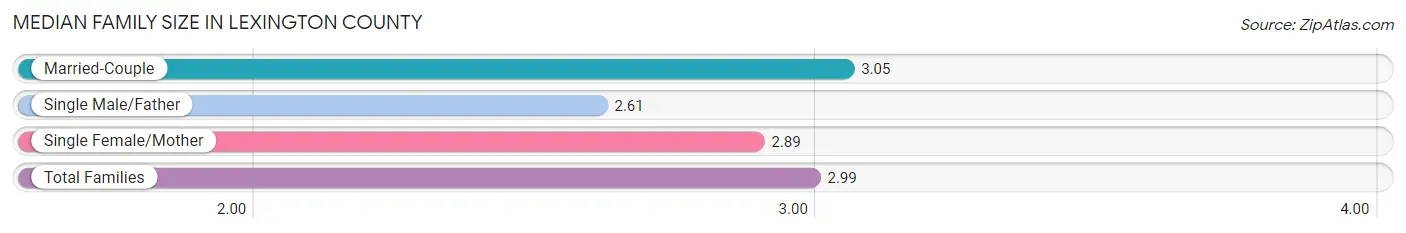
Median Family Size in Lexington County
The median family size in Lexington County is 2.99 persons per family, with married-couple families (59,134 | 74.0%) accounting for the largest median family size of 3.05 persons per family. On the other hand, single male/father families (5,776 | 7.2%) represent the smallest median family size with 2.61 persons per family.
| Family Type | # Families | Family Size |
| Married-Couple | 59,134 (74.0%) | 3.05 |
| Single Male/Father | 5,776 (7.2%) | 2.61 |
| Single Female/Mother | 15,026 (18.8%) | 2.89 |
| Total Families | 79,936 (100.0%) | 2.99 |
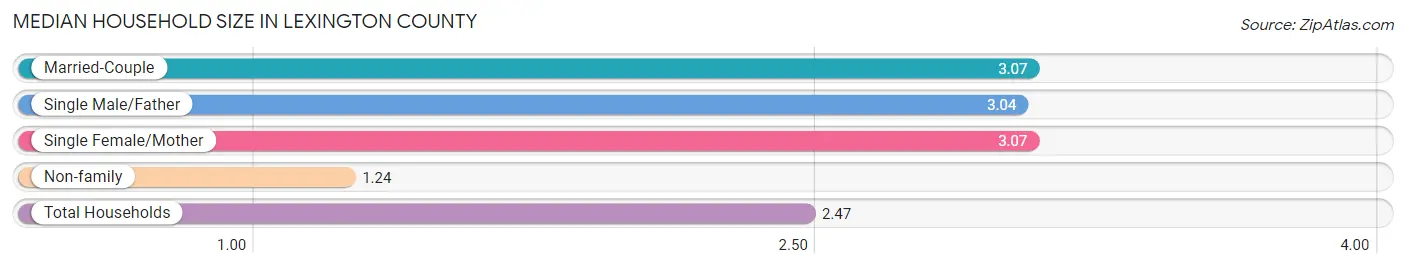
Median Household Size in Lexington County
The median household size in Lexington County is 2.47 persons per household, with married-couple households (59,134 | 49.8%) accounting for the largest median household size of 3.07 persons per household. non-family households (38,737 | 32.6%) represent the smallest median household size with 1.24 persons per household.
| Household Type | # Households | Household Size |
| Married-Couple | 59,134 (49.8%) | 3.07 |
| Single Male/Father | 5,776 (4.9%) | 3.04 |
| Single Female/Mother | 15,026 (12.7%) | 3.07 |
| Non-family | 38,737 (32.6%) | 1.24 |
| Total Households | 118,673 (100.0%) | 2.47 |
Household Size by Marriage Status in Lexington County
Out of a total of 118,673 households in Lexington County, 79,936 (67.4%) are family households, while 38,737 (32.6%) are nonfamily households. The most numerous type of family households are 2-person households, comprising 35,801, and the most common type of nonfamily households are 1-person households, comprising 31,680.
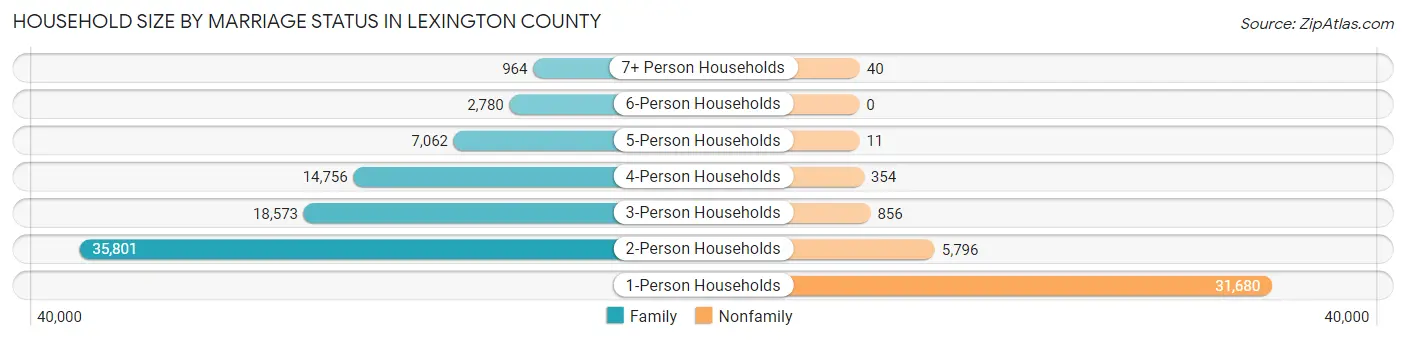
| Household Size | Family Households | Nonfamily Households |
| 1-Person Households | - | 31,680 (26.7%) |
| 2-Person Households | 35,801 (30.2%) | 5,796 (4.9%) |
| 3-Person Households | 18,573 (15.7%) | 856 (0.7%) |
| 4-Person Households | 14,756 (12.4%) | 354 (0.3%) |
| 5-Person Households | 7,062 (5.9%) | 11 (0.0%) |
| 6-Person Households | 2,780 (2.3%) | 0 (0.0%) |
| 7+ Person Households | 964 (0.8%) | 40 (0.0%) |
| Total | 79,936 (67.4%) | 38,737 (32.6%) |
Female Fertility in Lexington County
Fertility by Age in Lexington County
Average fertility rate in Lexington County is 61.0 births per 1,000 women. Women in the age bracket of 20 to 34 years have the highest fertility rate with 115.0 births per 1,000 women. Women in the age bracket of 20 to 34 years acount for 76.5% of all women with births.
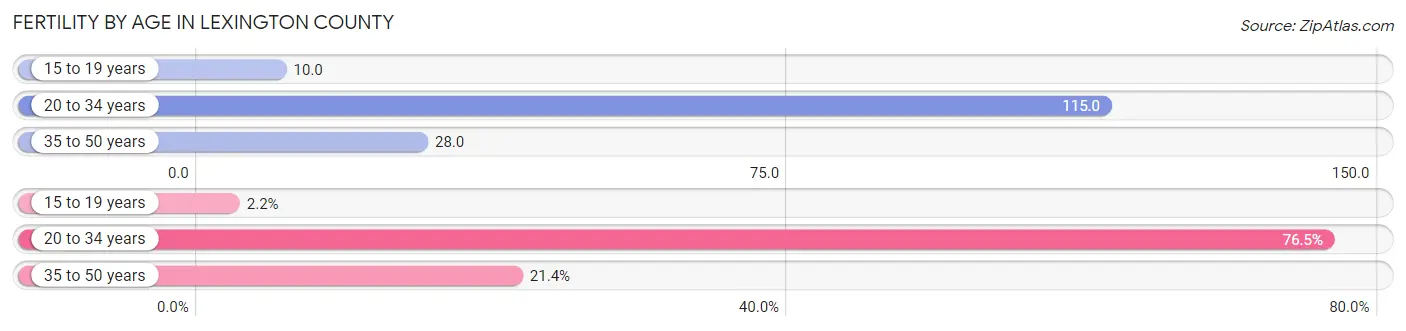
| Age Bracket | Women with Births | Births / 1,000 Women |
| 15 to 19 years | 91 (2.2%) | 10.0 |
| 20 to 34 years | 3,224 (76.5%) | 115.0 |
| 35 to 50 years | 901 (21.4%) | 28.0 |
| Total | 4,216 (100.0%) | 61.0 |
Fertility by Age by Marriage Status in Lexington County
56.6% of women with births (4,216) in Lexington County are married. The highest percentage of unmarried women with births falls into 15 to 19 years age bracket with 70.3% of them unmarried at the time of birth, while the lowest percentage of unmarried women with births belong to 35 to 50 years age bracket with 26.9% of them unmarried.
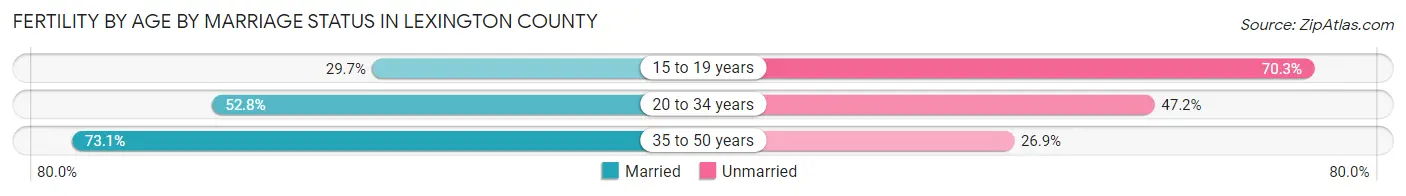
| Age Bracket | Married | Unmarried |
| 15 to 19 years | 27 (29.7%) | 64 (70.3%) |
| 20 to 34 years | 1,702 (52.8%) | 1,522 (47.2%) |
| 35 to 50 years | 659 (73.1%) | 242 (26.9%) |
| Total | 2,386 (56.6%) | 1,830 (43.4%) |
Fertility by Education in Lexington County
Average fertility rate in Lexington County is 61.0 births per 1,000 women. Women with the education attainment of less than high school have the highest fertility rate of 65.0 births per 1,000 women, while women with the education attainment of graduate degree have the lowest fertility at 56.0 births per 1,000 women. Women with the education attainment of college or associate's degree represent 33.4% of all women with births.
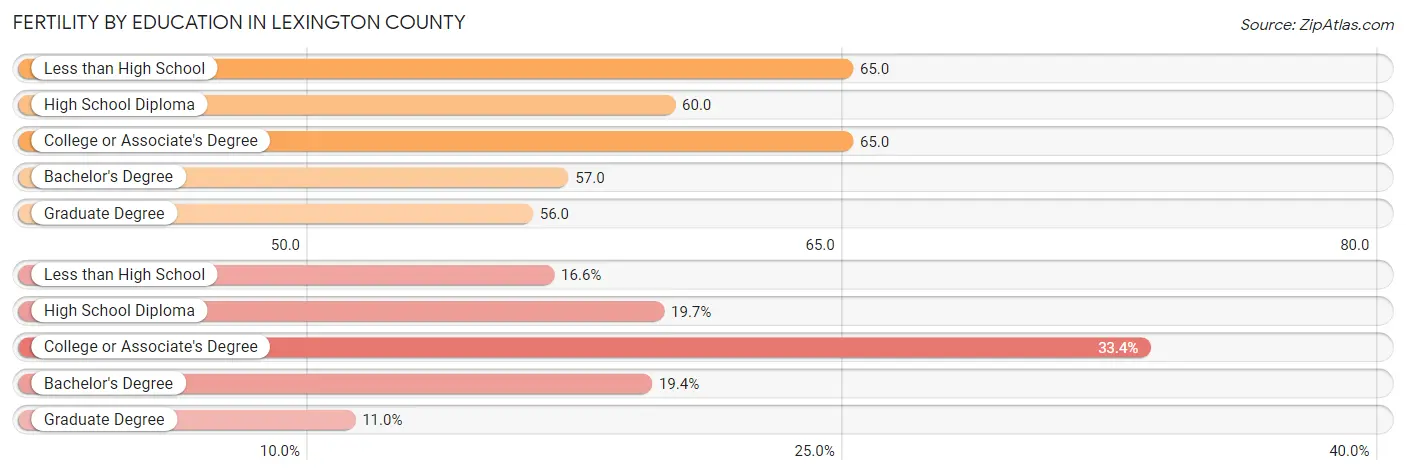
| Educational Attainment | Women with Births | Births / 1,000 Women |
| Less than High School | 700 (16.6%) | 65.0 |
| High School Diploma | 830 (19.7%) | 60.0 |
| College or Associate's Degree | 1,406 (33.4%) | 65.0 |
| Bachelor's Degree | 816 (19.4%) | 57.0 |
| Graduate Degree | 464 (11.0%) | 56.0 |
| Total | 4,216 (100.0%) | 61.0 |
Fertility by Education by Marriage Status in Lexington County
43.4% of women with births in Lexington County are unmarried. Women with the educational attainment of graduate degree are most likely to be married with 89.9% of them married at childbirth, while women with the educational attainment of less than high school are least likely to be married with 70.4% of them unmarried at childbirth.
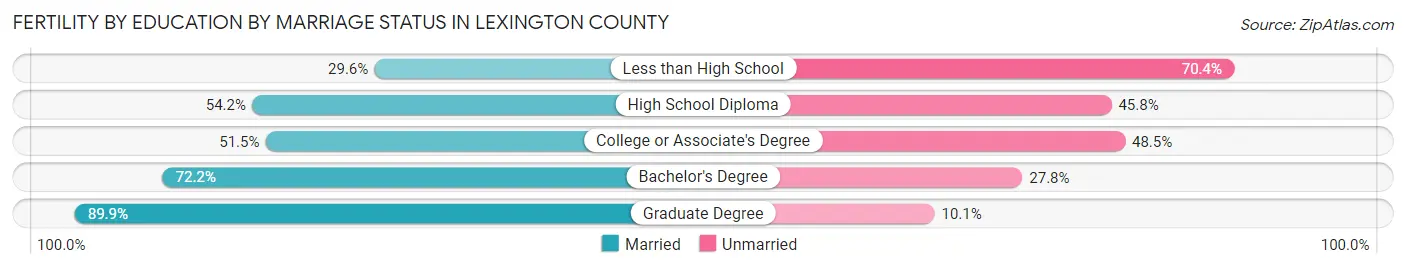
| Educational Attainment | Married | Unmarried |
| Less than High School | 207 (29.6%) | 493 (70.4%) |
| High School Diploma | 450 (54.2%) | 380 (45.8%) |
| College or Associate's Degree | 724 (51.5%) | 682 (48.5%) |
| Bachelor's Degree | 589 (72.2%) | 227 (27.8%) |
| Graduate Degree | 417 (89.9%) | 47 (10.1%) |
| Total | 2,386 (56.6%) | 1,830 (43.4%) |
Employment Characteristics in Lexington County
Employment by Class of Employer in Lexington County
Among the 142,954 employed individuals in Lexington County, private company employees (94,527 | 66.1%), state government employees (12,083 | 8.5%), and local government employees (10,251 | 7.2%) make up the most common classes of employment.
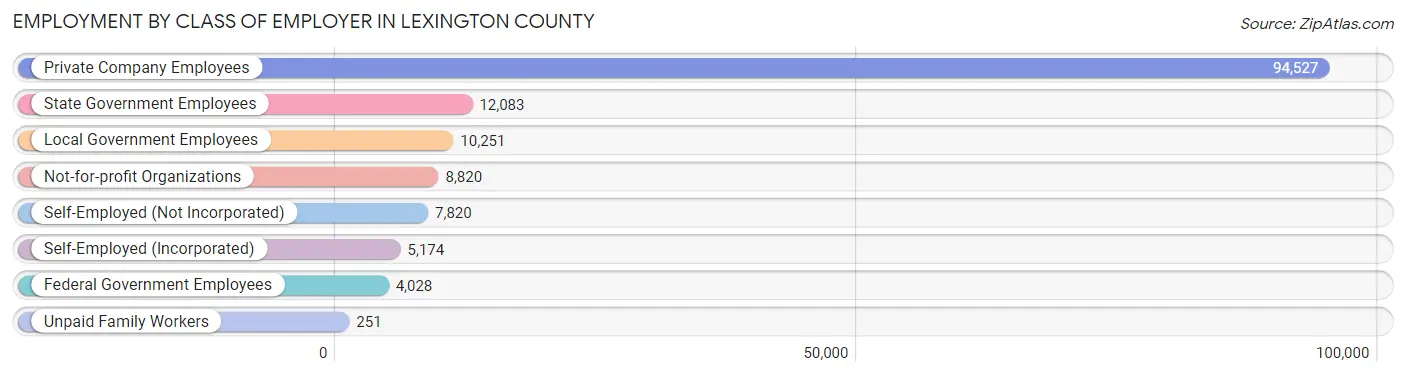
| Employer Class | # Employees | % Employees |
| Private Company Employees | 94,527 | 66.1% |
| Self-Employed (Incorporated) | 5,174 | 3.6% |
| Self-Employed (Not Incorporated) | 7,820 | 5.5% |
| Not-for-profit Organizations | 8,820 | 6.2% |
| Local Government Employees | 10,251 | 7.2% |
| State Government Employees | 12,083 | 8.5% |
| Federal Government Employees | 4,028 | 2.8% |
| Unpaid Family Workers | 251 | 0.2% |
| Total | 142,954 | 100.0% |
Employment Status by Age in Lexington County
According to the labor force statistics for Lexington County, out of the total population over 16 years of age (235,969), 64.3% or 151,728 individuals are in the labor force, with 4.4% or 6,676 of them unemployed. The age group with the highest labor force participation rate is 35 to 44 years, with 85.4% or 33,168 individuals in the labor force. Within the labor force, the 16 to 19 years age range has the highest percentage of unemployed individuals, with 11.2% or 642 of them being unemployed.
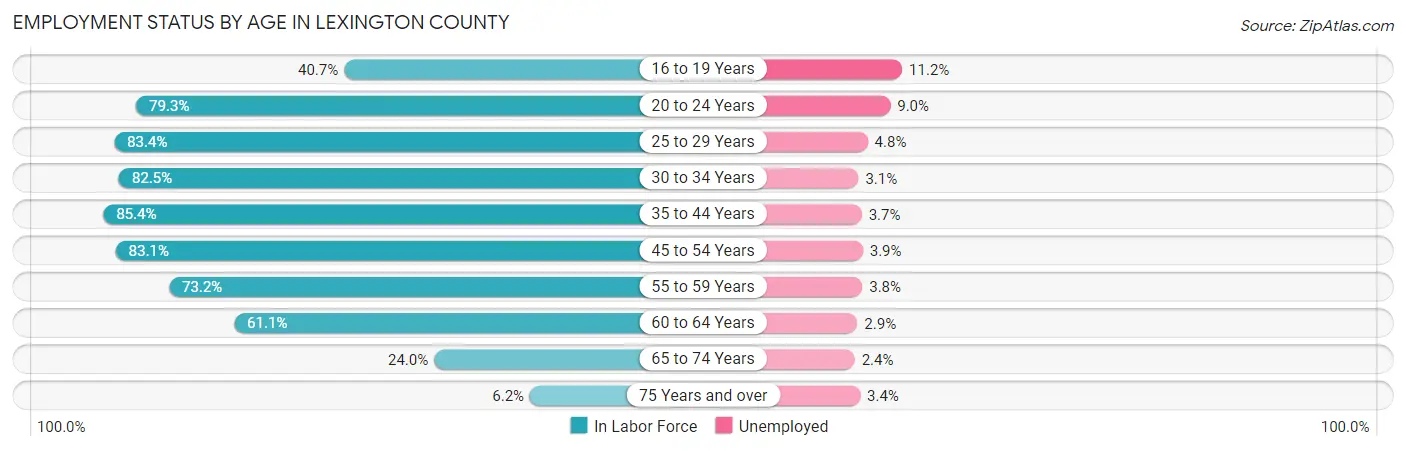
| Age Bracket | In Labor Force | Unemployed |
| 16 to 19 Years | 5,730 (40.7%) | 642 (11.2%) |
| 20 to 24 Years | 13,165 (79.3%) | 1,185 (9.0%) |
| 25 to 29 Years | 15,820 (83.4%) | 759 (4.8%) |
| 30 to 34 Years | 16,446 (82.5%) | 510 (3.1%) |
| 35 to 44 Years | 33,168 (85.4%) | 1,227 (3.7%) |
| 45 to 54 Years | 32,506 (83.1%) | 1,268 (3.9%) |
| 55 to 59 Years | 14,286 (73.2%) | 543 (3.8%) |
| 60 to 64 Years | 12,254 (61.1%) | 355 (2.9%) |
| 65 to 74 Years | 7,135 (24.0%) | 171 (2.4%) |
| 75 Years and over | 1,186 (6.2%) | 40 (3.4%) |
| Total | 151,728 (64.3%) | 6,676 (4.4%) |
Employment Status by Educational Attainment in Lexington County
According to labor force statistics for Lexington County, 79.6% of individuals (124,519) out of the total population between 25 and 64 years of age (156,431) are in the labor force, with 3.7% or 4,607 of them being unemployed. The group with the highest labor force participation rate are those with the educational attainment of bachelor's degree or higher, with 87.5% or 46,910 individuals in the labor force. Within the labor force, individuals with less than high school education have the highest percentage of unemployment, with 7.0% or 497 of them being unemployed.
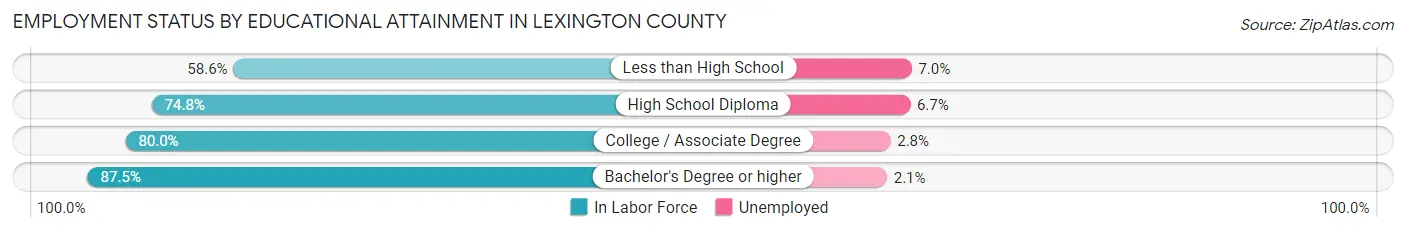
| Educational Attainment | In Labor Force | Unemployed |
| Less than High School | 7,096 (58.6%) | 848 (7.0%) |
| High School Diploma | 29,684 (74.8%) | 2,659 (6.7%) |
| College / Associate Degree | 40,821 (80.0%) | 1,429 (2.8%) |
| Bachelor's Degree or higher | 46,910 (87.5%) | 1,126 (2.1%) |
| Total | 124,519 (79.6%) | 5,788 (3.7%) |
Employment Occupations by Sex in Lexington County
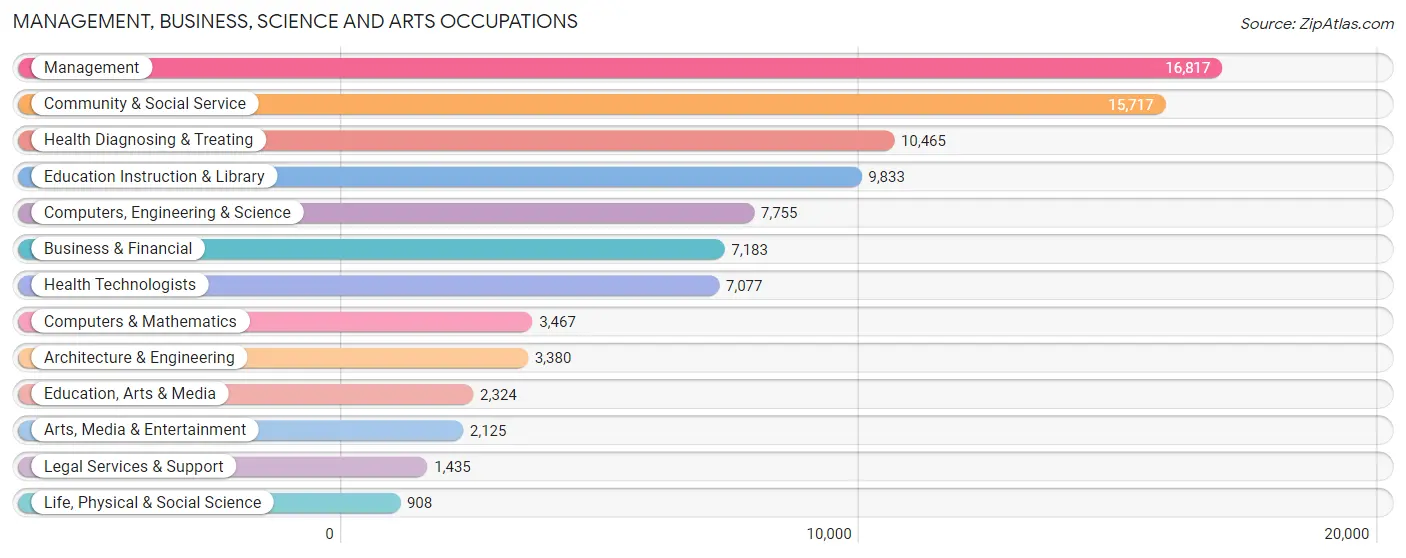
Management, Business, Science and Arts Occupations
The most common Management, Business, Science and Arts occupations in Lexington County are Management (16,817 | 11.7%), Community & Social Service (15,717 | 10.9%), Health Diagnosing & Treating (10,465 | 7.2%), Education Instruction & Library (9,833 | 6.8%), and Computers, Engineering & Science (7,755 | 5.4%).
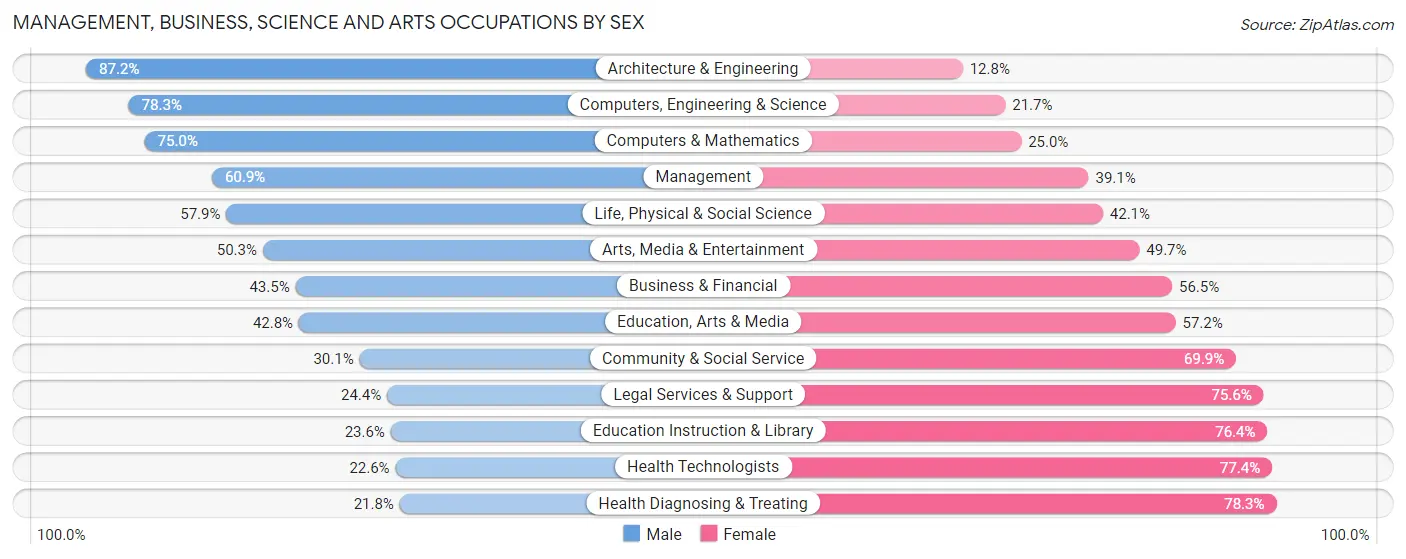
Management, Business, Science and Arts Occupations by Sex
Within the Management, Business, Science and Arts occupations in Lexington County, the most male-oriented occupations are Architecture & Engineering (87.2%), Computers, Engineering & Science (78.3%), and Computers & Mathematics (75.0%), while the most female-oriented occupations are Health Diagnosing & Treating (78.2%), Health Technologists (77.4%), and Education Instruction & Library (76.4%).
| Occupation | Male | Female |
| Management | 10,243 (60.9%) | 6,574 (39.1%) |
| Business & Financial | 3,124 (43.5%) | 4,059 (56.5%) |
| Computers, Engineering & Science | 6,071 (78.3%) | 1,684 (21.7%) |
| Computers & Mathematics | 2,599 (75.0%) | 868 (25.0%) |
| Architecture & Engineering | 2,946 (87.2%) | 434 (12.8%) |
| Life, Physical & Social Science | 526 (57.9%) | 382 (42.1%) |
| Community & Social Service | 4,737 (30.1%) | 10,980 (69.9%) |
| Education, Arts & Media | 994 (42.8%) | 1,330 (57.2%) |
| Legal Services & Support | 350 (24.4%) | 1,085 (75.6%) |
| Education Instruction & Library | 2,324 (23.6%) | 7,509 (76.4%) |
| Arts, Media & Entertainment | 1,069 (50.3%) | 1,056 (49.7%) |
| Health Diagnosing & Treating | 2,276 (21.7%) | 8,189 (78.2%) |
| Health Technologists | 1,602 (22.6%) | 5,475 (77.4%) |
| Total (Category) | 26,451 (45.7%) | 31,486 (54.3%) |
| Total (Overall) | 76,304 (52.9%) | 67,977 (47.1%) |
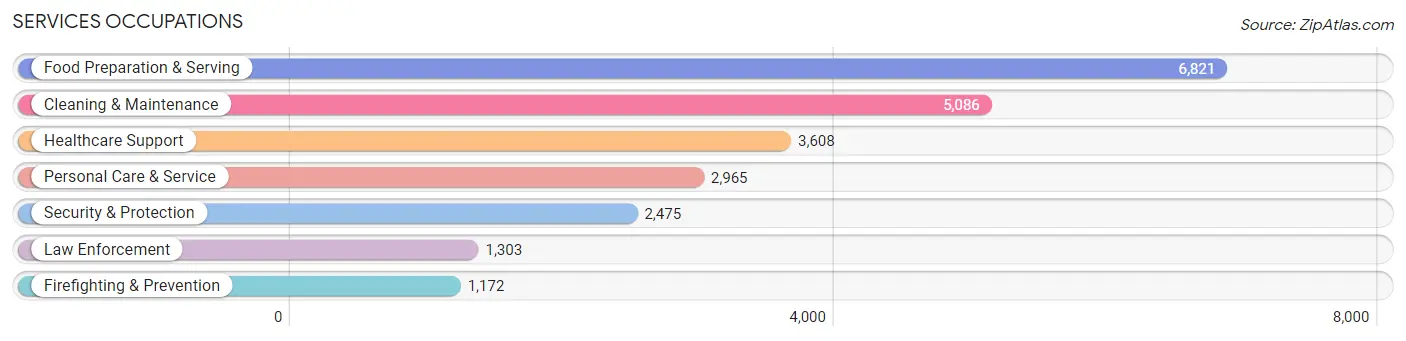
Services Occupations
The most common Services occupations in Lexington County are Food Preparation & Serving (6,821 | 4.7%), Cleaning & Maintenance (5,086 | 3.5%), Healthcare Support (3,608 | 2.5%), Personal Care & Service (2,965 | 2.1%), and Security & Protection (2,475 | 1.7%).
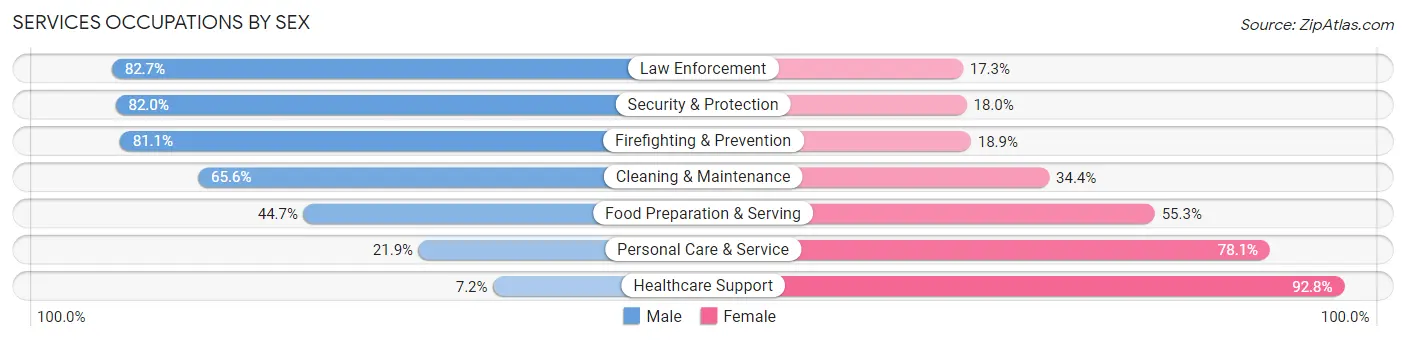
Services Occupations by Sex
Within the Services occupations in Lexington County, the most male-oriented occupations are Law Enforcement (82.7%), Security & Protection (82.0%), and Firefighting & Prevention (81.1%), while the most female-oriented occupations are Healthcare Support (92.8%), Personal Care & Service (78.1%), and Food Preparation & Serving (55.3%).
| Occupation | Male | Female |
| Healthcare Support | 259 (7.2%) | 3,349 (92.8%) |
| Security & Protection | 2,029 (82.0%) | 446 (18.0%) |
| Firefighting & Prevention | 951 (81.1%) | 221 (18.9%) |
| Law Enforcement | 1,078 (82.7%) | 225 (17.3%) |
| Food Preparation & Serving | 3,050 (44.7%) | 3,771 (55.3%) |
| Cleaning & Maintenance | 3,338 (65.6%) | 1,748 (34.4%) |
| Personal Care & Service | 650 (21.9%) | 2,315 (78.1%) |
| Total (Category) | 9,326 (44.5%) | 11,629 (55.5%) |
| Total (Overall) | 76,304 (52.9%) | 67,977 (47.1%) |
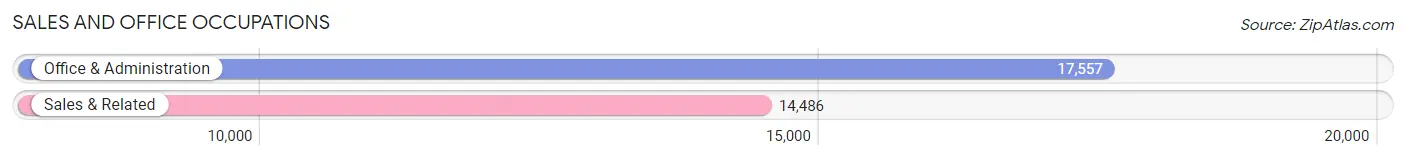
Sales and Office Occupations
The most common Sales and Office occupations in Lexington County are Office & Administration (17,557 | 12.2%), and Sales & Related (14,486 | 10.0%).
Sales and Office Occupations by Sex
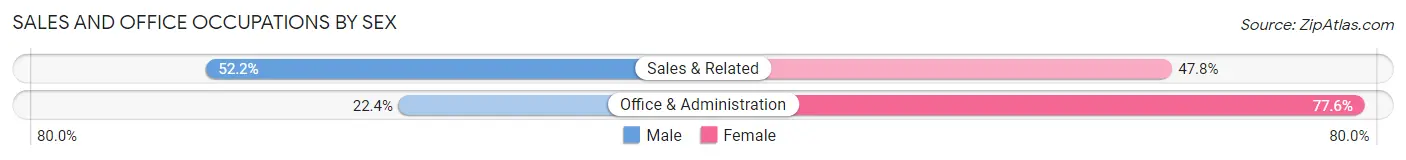
| Occupation | Male | Female |
| Sales & Related | 7,560 (52.2%) | 6,926 (47.8%) |
| Office & Administration | 3,938 (22.4%) | 13,619 (77.6%) |
| Total (Category) | 11,498 (35.9%) | 20,545 (64.1%) |
| Total (Overall) | 76,304 (52.9%) | 67,977 (47.1%) |
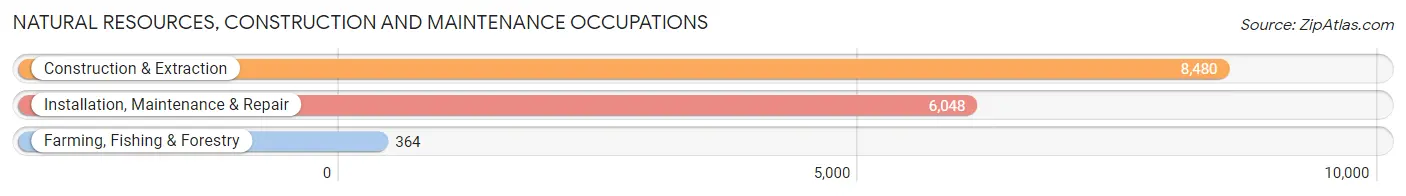
Natural Resources, Construction and Maintenance Occupations
The most common Natural Resources, Construction and Maintenance occupations in Lexington County are Construction & Extraction (8,480 | 5.9%), Installation, Maintenance & Repair (6,048 | 4.2%), and Farming, Fishing & Forestry (364 | 0.3%).
Natural Resources, Construction and Maintenance Occupations by Sex
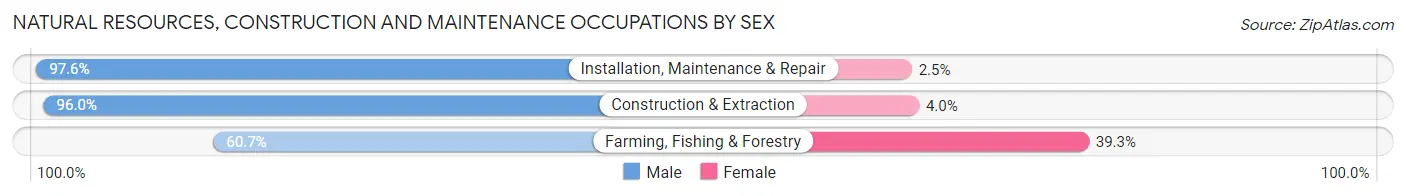
| Occupation | Male | Female |
| Farming, Fishing & Forestry | 221 (60.7%) | 143 (39.3%) |
| Construction & Extraction | 8,143 (96.0%) | 337 (4.0%) |
| Installation, Maintenance & Repair | 5,900 (97.6%) | 148 (2.5%) |
| Total (Category) | 14,264 (95.8%) | 628 (4.2%) |
| Total (Overall) | 76,304 (52.9%) | 67,977 (47.1%) |
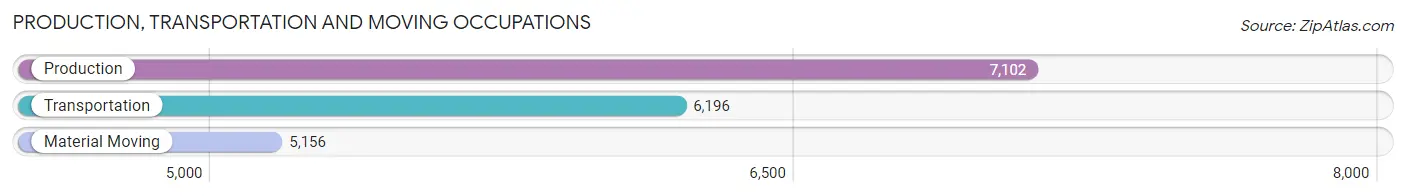
Production, Transportation and Moving Occupations
The most common Production, Transportation and Moving occupations in Lexington County are Production (7,102 | 4.9%), Transportation (6,196 | 4.3%), and Material Moving (5,156 | 3.6%).
Production, Transportation and Moving Occupations by Sex
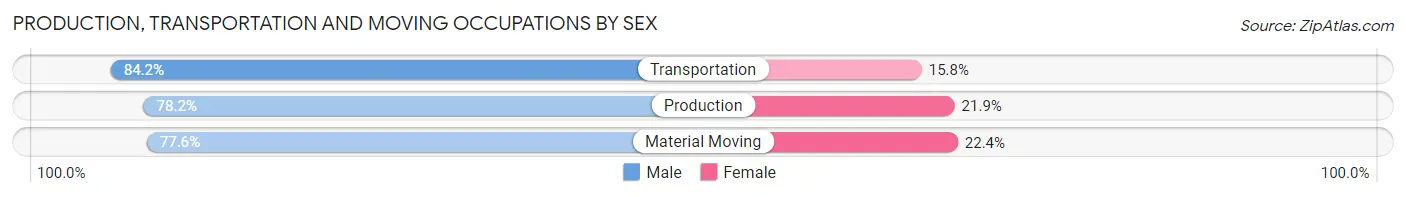
| Occupation | Male | Female |
| Production | 5,550 (78.1%) | 1,552 (21.8%) |
| Transportation | 5,216 (84.2%) | 980 (15.8%) |
| Material Moving | 3,999 (77.6%) | 1,157 (22.4%) |
| Total (Category) | 14,765 (80.0%) | 3,689 (20.0%) |
| Total (Overall) | 76,304 (52.9%) | 67,977 (47.1%) |
Employment Industries by Sex in Lexington County
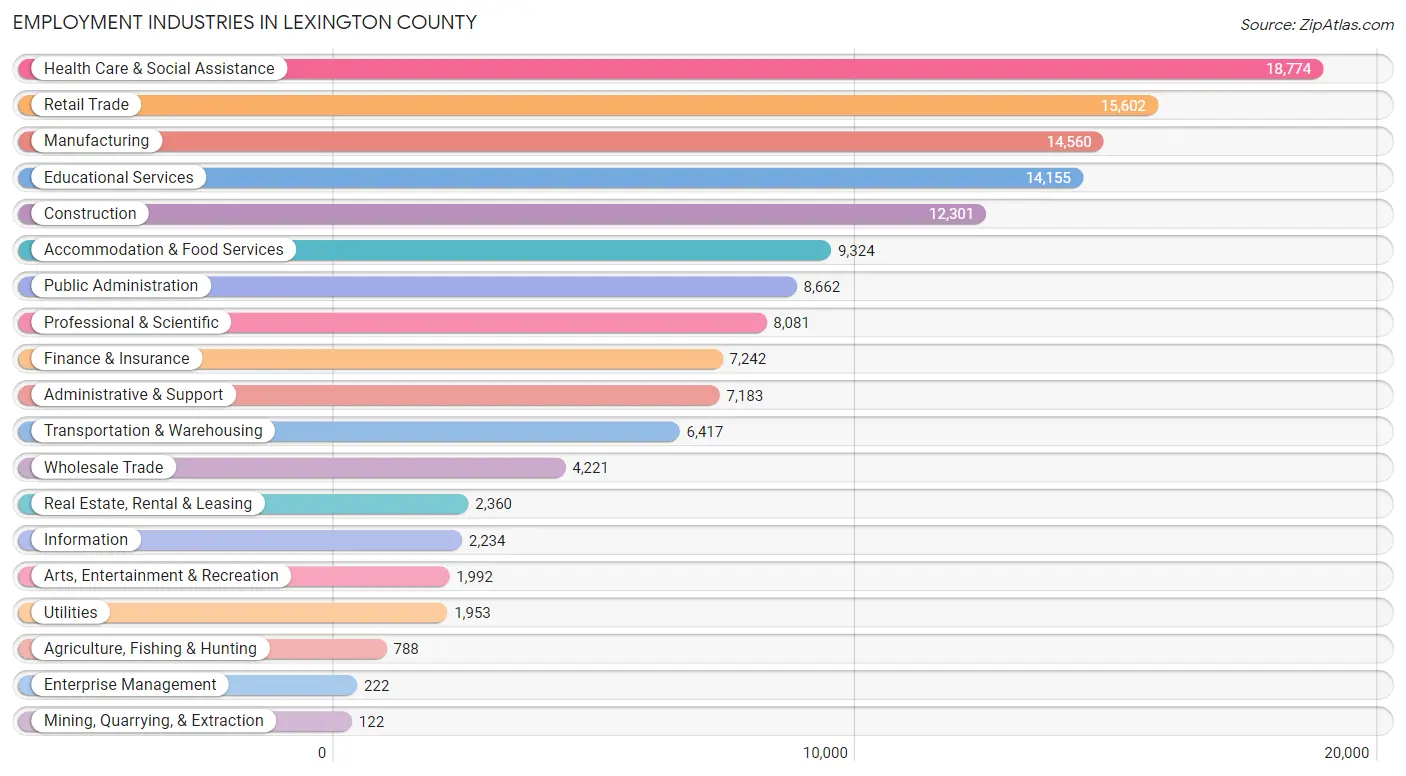
Employment Industries in Lexington County
The major employment industries in Lexington County include Health Care & Social Assistance (18,774 | 13.0%), Retail Trade (15,602 | 10.8%), Manufacturing (14,560 | 10.1%), Educational Services (14,155 | 9.8%), and Construction (12,301 | 8.5%).
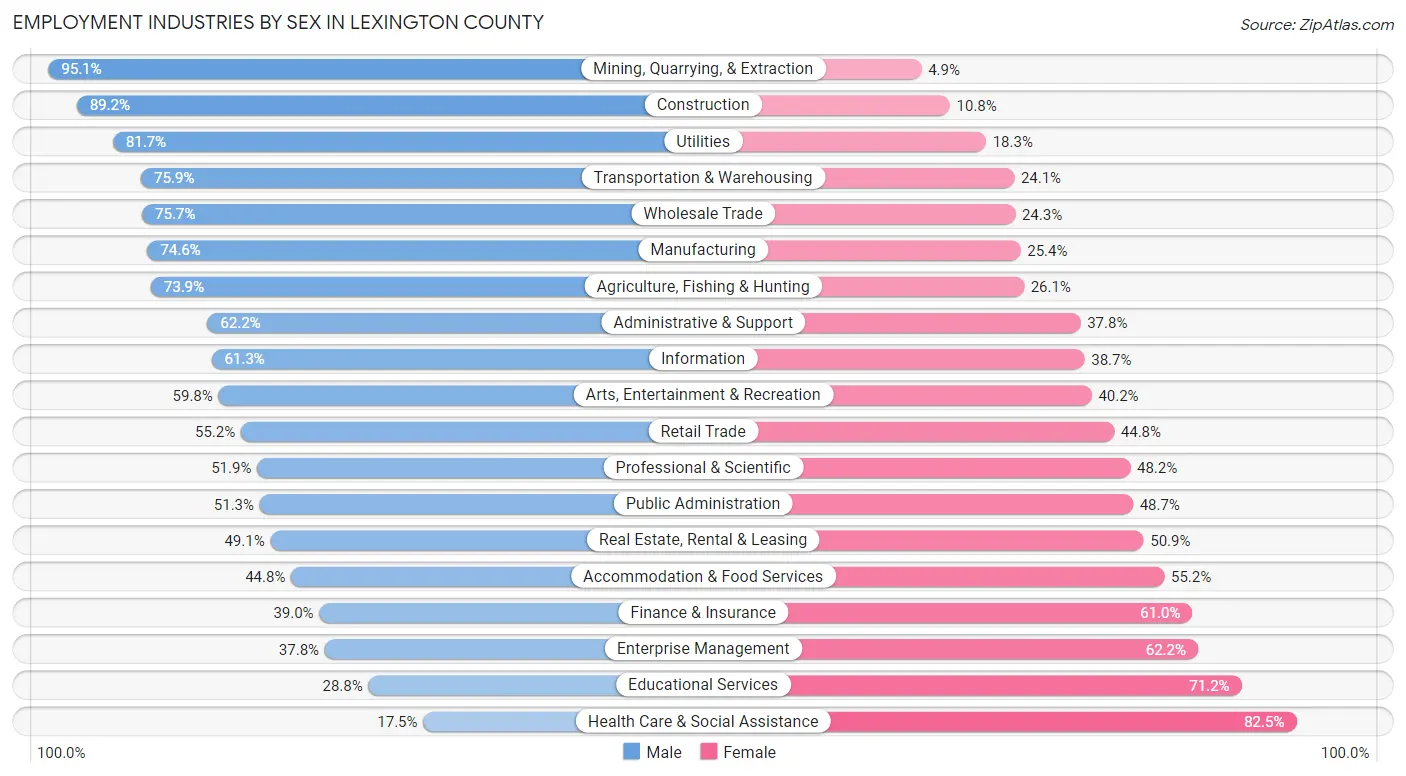
Employment Industries by Sex in Lexington County
The Lexington County industries that see more men than women are Mining, Quarrying, & Extraction (95.1%), Construction (89.2%), and Utilities (81.7%), whereas the industries that tend to have a higher number of women are Health Care & Social Assistance (82.5%), Educational Services (71.2%), and Enterprise Management (62.2%).
| Industry | Male | Female |
| Agriculture, Fishing & Hunting | 582 (73.9%) | 206 (26.1%) |
| Mining, Quarrying, & Extraction | 116 (95.1%) | 6 (4.9%) |
| Construction | 10,972 (89.2%) | 1,329 (10.8%) |
| Manufacturing | 10,857 (74.6%) | 3,703 (25.4%) |
| Wholesale Trade | 3,194 (75.7%) | 1,027 (24.3%) |
| Retail Trade | 8,613 (55.2%) | 6,989 (44.8%) |
| Transportation & Warehousing | 4,869 (75.9%) | 1,548 (24.1%) |
| Utilities | 1,596 (81.7%) | 357 (18.3%) |
| Information | 1,370 (61.3%) | 864 (38.7%) |
| Finance & Insurance | 2,822 (39.0%) | 4,420 (61.0%) |
| Real Estate, Rental & Leasing | 1,159 (49.1%) | 1,201 (50.9%) |
| Professional & Scientific | 4,190 (51.8%) | 3,891 (48.1%) |
| Enterprise Management | 84 (37.8%) | 138 (62.2%) |
| Administrative & Support | 4,465 (62.2%) | 2,718 (37.8%) |
| Educational Services | 4,078 (28.8%) | 10,077 (71.2%) |
| Health Care & Social Assistance | 3,278 (17.5%) | 15,496 (82.5%) |
| Arts, Entertainment & Recreation | 1,192 (59.8%) | 800 (40.2%) |
| Accommodation & Food Services | 4,178 (44.8%) | 5,146 (55.2%) |
| Public Administration | 4,444 (51.3%) | 4,218 (48.7%) |
| Total | 76,304 (52.9%) | 67,977 (47.1%) |
Education in Lexington County
School Enrollment in Lexington County
The most common levels of schooling among the 69,198 students in Lexington County are high school (16,162 | 23.4%), middle school (15,881 | 23.0%), and elementary school (14,673 | 21.2%).
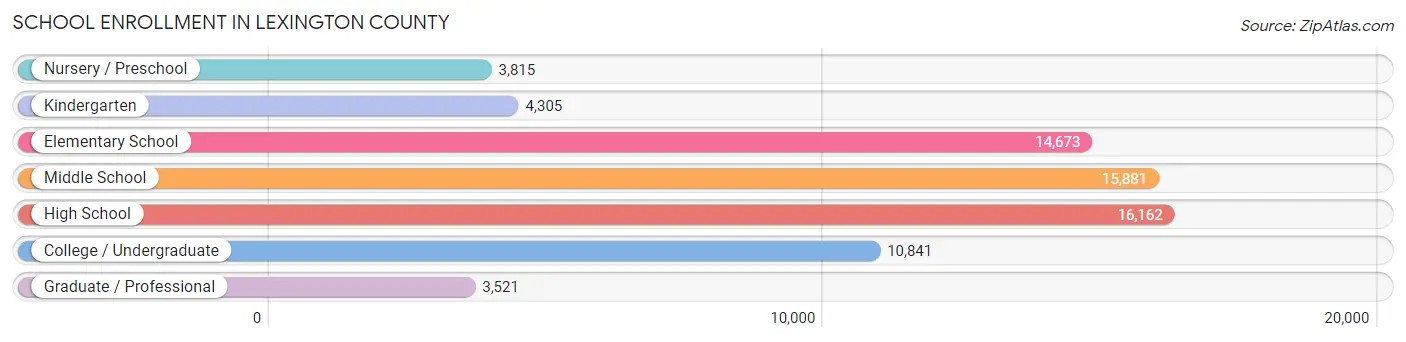
| School Level | # Students | % Students |
| Nursery / Preschool | 3,815 | 5.5% |
| Kindergarten | 4,305 | 6.2% |
| Elementary School | 14,673 | 21.2% |
| Middle School | 15,881 | 23.0% |
| High School | 16,162 | 23.4% |
| College / Undergraduate | 10,841 | 15.7% |
| Graduate / Professional | 3,521 | 5.1% |
| Total | 69,198 | 100.0% |
School Enrollment by Age by Funding Source in Lexington County
Out of a total of 69,198 students who are enrolled in schools in Lexington County, 8,235 (11.9%) attend a private institution, while the remaining 60,963 (88.1%) are enrolled in public schools. The age group of 3 to 4 year olds has the highest likelihood of being enrolled in private schools, with 1,396 (41.9% in the age bracket) enrolled. Conversely, the age group of 10 to 14 year olds has the lowest likelihood of being enrolled in a private school, with 18,388 (93.1% in the age bracket) attending a public institution.
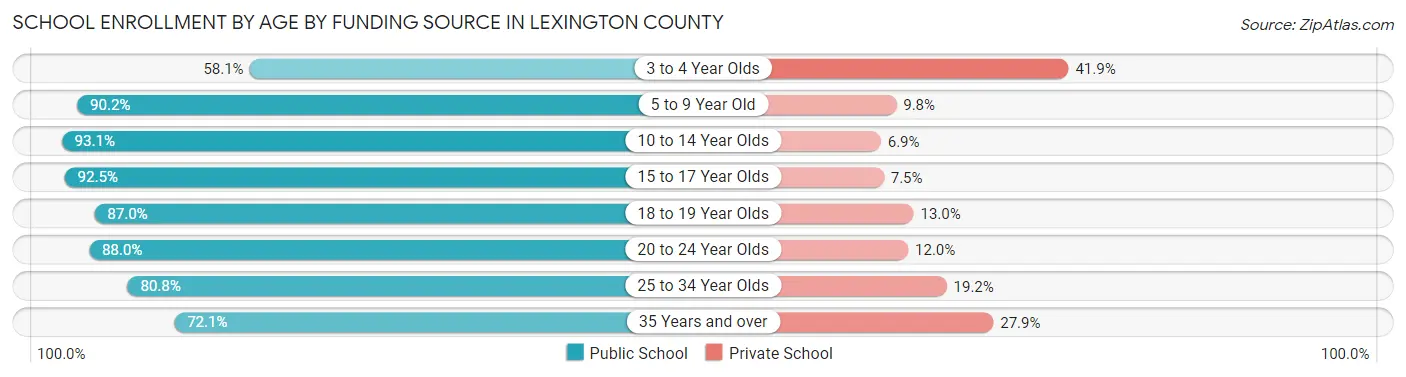
| Age Bracket | Public School | Private School |
| 3 to 4 Year Olds | 1,937 (58.1%) | 1,396 (41.9%) |
| 5 to 9 Year Old | 15,756 (90.2%) | 1,712 (9.8%) |
| 10 to 14 Year Olds | 18,388 (93.1%) | 1,365 (6.9%) |
| 15 to 17 Year Olds | 11,203 (92.5%) | 904 (7.5%) |
| 18 to 19 Year Olds | 3,491 (87.0%) | 522 (13.0%) |
| 20 to 24 Year Olds | 4,759 (88.0%) | 649 (12.0%) |
| 25 to 34 Year Olds | 2,875 (80.8%) | 682 (19.2%) |
| 35 Years and over | 2,567 (72.1%) | 992 (27.9%) |
| Total | 60,963 (88.1%) | 8,235 (11.9%) |
Educational Attainment by Field of Study in Lexington County
Business (15,572 | 21.6%), education (9,471 | 13.1%), science & technology (8,135 | 11.3%), engineering (5,104 | 7.1%), and arts & humanities (5,015 | 7.0%) are the most common fields of study among 72,180 individuals in Lexington County who have obtained a bachelor's degree or higher.
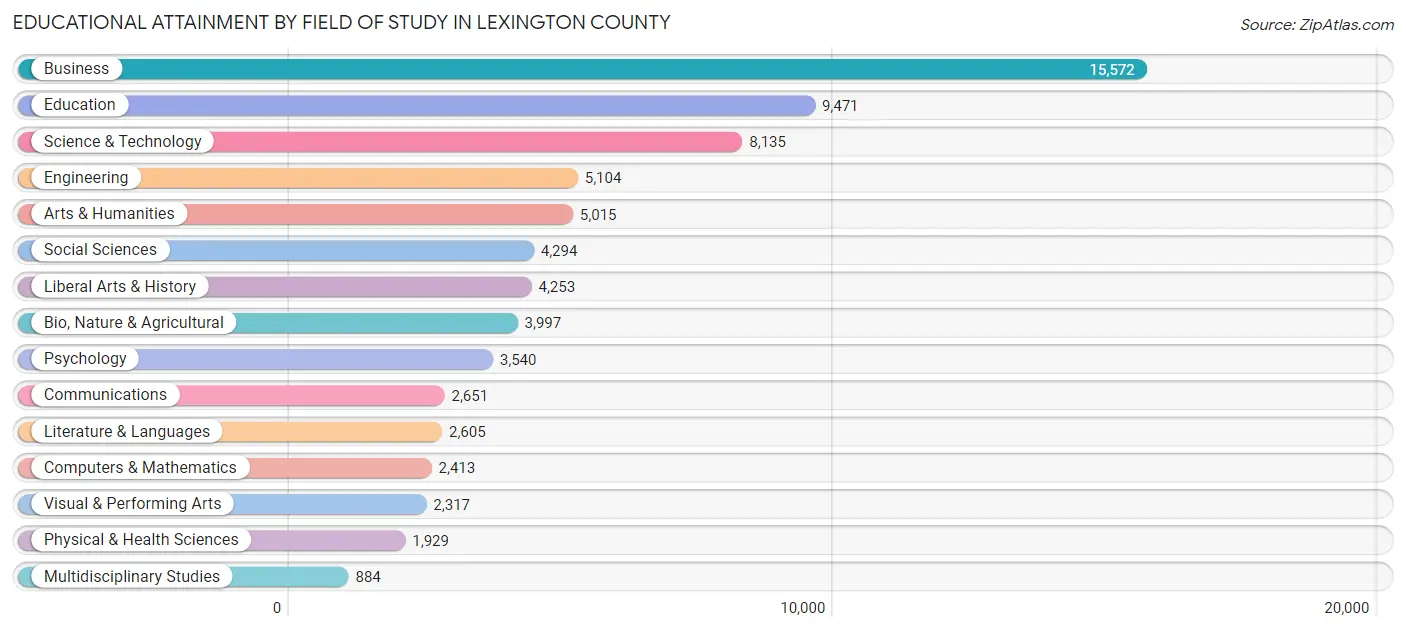
| Field of Study | # Graduates | % Graduates |
| Computers & Mathematics | 2,413 | 3.3% |
| Bio, Nature & Agricultural | 3,997 | 5.5% |
| Physical & Health Sciences | 1,929 | 2.7% |
| Psychology | 3,540 | 4.9% |
| Social Sciences | 4,294 | 5.9% |
| Engineering | 5,104 | 7.1% |
| Multidisciplinary Studies | 884 | 1.2% |
| Science & Technology | 8,135 | 11.3% |
| Business | 15,572 | 21.6% |
| Education | 9,471 | 13.1% |
| Literature & Languages | 2,605 | 3.6% |
| Liberal Arts & History | 4,253 | 5.9% |
| Visual & Performing Arts | 2,317 | 3.2% |
| Communications | 2,651 | 3.7% |
| Arts & Humanities | 5,015 | 7.0% |
| Total | 72,180 | 100.0% |
Transportation & Commute in Lexington County
Vehicle Availability by Sex in Lexington County
The most prevalent vehicle ownership categories in Lexington County are males with 2 vehicles (33,664, accounting for 44.3%) and females with 2 vehicles (29,299, making up 50.4%).
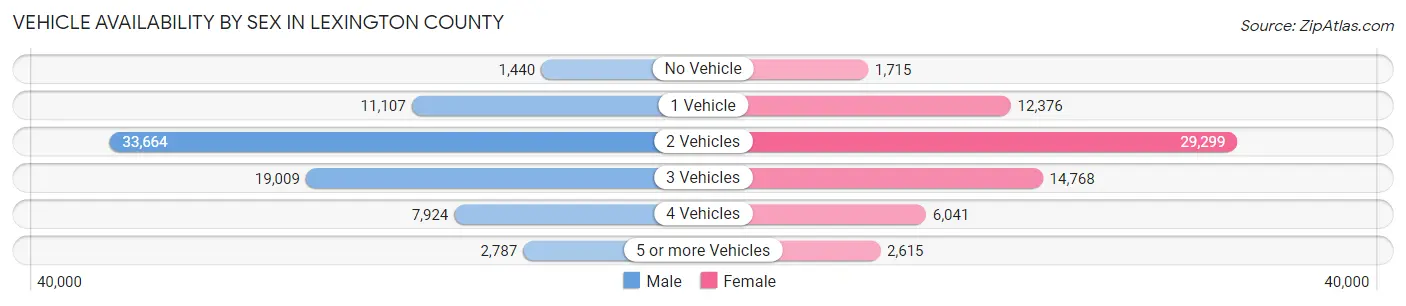
| Vehicles Available | Male | Female |
| No Vehicle | 1,440 (1.9%) | 1,715 (2.6%) |
| 1 Vehicle | 11,107 (14.6%) | 12,376 (18.5%) |
| 2 Vehicles | 33,664 (44.3%) | 29,299 (43.9%) |
| 3 Vehicles | 19,009 (25.0%) | 14,768 (22.1%) |
| 4 Vehicles | 7,924 (10.4%) | 6,041 (9.0%) |
| 5 or more Vehicles | 2,787 (3.7%) | 2,615 (3.9%) |
| Total | 75,931 (100.0%) | 66,814 (100.0%) |
Commute Time in Lexington County
The most frequently occuring commute durations in Lexington County are 20 to 24 minutes (23,841 commuters, 18.3%), 15 to 19 minutes (20,711 commuters, 15.9%), and 30 to 34 minutes (19,666 commuters, 15.1%).
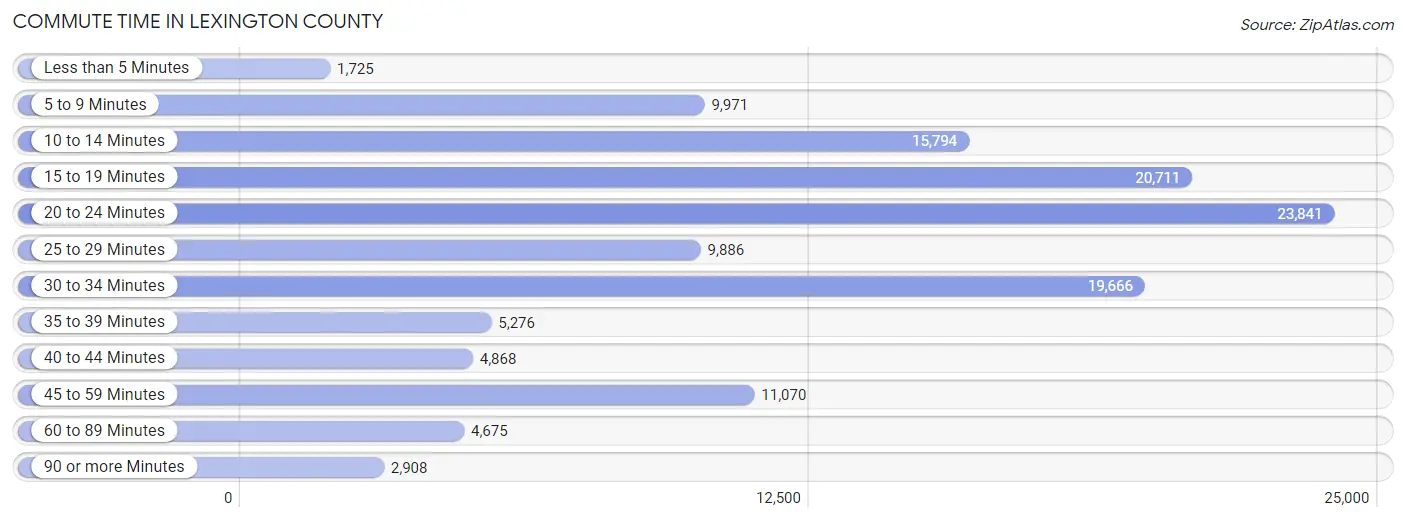
| Commute Time | # Commuters | % Commuters |
| Less than 5 Minutes | 1,725 | 1.3% |
| 5 to 9 Minutes | 9,971 | 7.6% |
| 10 to 14 Minutes | 15,794 | 12.1% |
| 15 to 19 Minutes | 20,711 | 15.9% |
| 20 to 24 Minutes | 23,841 | 18.3% |
| 25 to 29 Minutes | 9,886 | 7.6% |
| 30 to 34 Minutes | 19,666 | 15.1% |
| 35 to 39 Minutes | 5,276 | 4.1% |
| 40 to 44 Minutes | 4,868 | 3.7% |
| 45 to 59 Minutes | 11,070 | 8.5% |
| 60 to 89 Minutes | 4,675 | 3.6% |
| 90 or more Minutes | 2,908 | 2.2% |
Commute Time by Sex in Lexington County
The most common commute times in Lexington County are 20 to 24 minutes (12,445 commuters, 17.8%) for males and 20 to 24 minutes (11,396 commuters, 18.8%) for females.
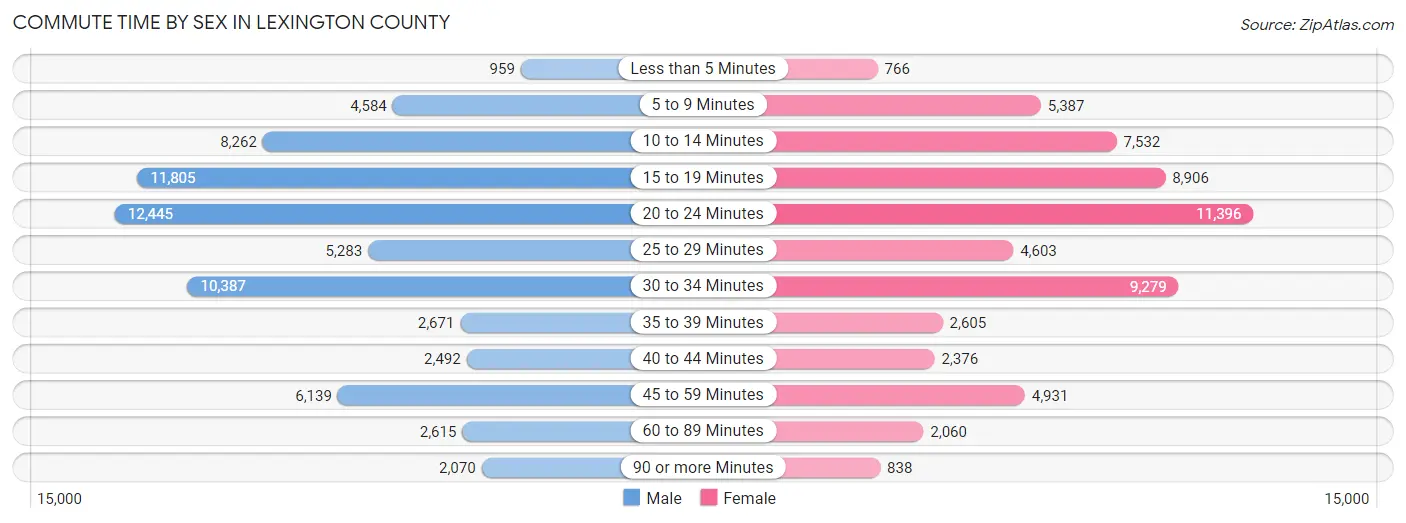
| Commute Time | Male | Female |
| Less than 5 Minutes | 959 (1.4%) | 766 (1.3%) |
| 5 to 9 Minutes | 4,584 (6.6%) | 5,387 (8.9%) |
| 10 to 14 Minutes | 8,262 (11.8%) | 7,532 (12.4%) |
| 15 to 19 Minutes | 11,805 (16.9%) | 8,906 (14.7%) |
| 20 to 24 Minutes | 12,445 (17.8%) | 11,396 (18.8%) |
| 25 to 29 Minutes | 5,283 (7.6%) | 4,603 (7.6%) |
| 30 to 34 Minutes | 10,387 (14.9%) | 9,279 (15.3%) |
| 35 to 39 Minutes | 2,671 (3.8%) | 2,605 (4.3%) |
| 40 to 44 Minutes | 2,492 (3.6%) | 2,376 (3.9%) |
| 45 to 59 Minutes | 6,139 (8.8%) | 4,931 (8.1%) |
| 60 to 89 Minutes | 2,615 (3.7%) | 2,060 (3.4%) |
| 90 or more Minutes | 2,070 (3.0%) | 838 (1.4%) |
Time of Departure to Work by Sex in Lexington County
The most frequent times of departure to work in Lexington County are 7:00 AM to 7:29 AM (13,691, 19.6%) for males and 7:30 AM to 7:59 AM (10,523, 17.3%) for females.
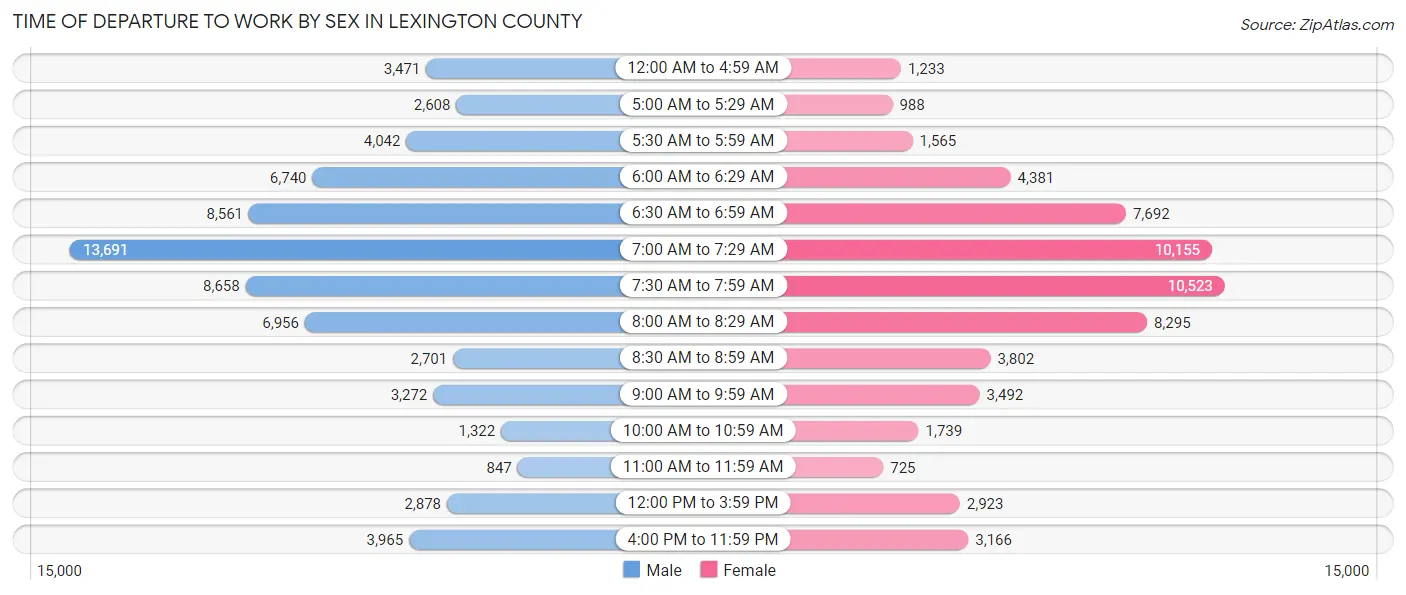
| Time of Departure | Male | Female |
| 12:00 AM to 4:59 AM | 3,471 (5.0%) | 1,233 (2.0%) |
| 5:00 AM to 5:29 AM | 2,608 (3.7%) | 988 (1.6%) |
| 5:30 AM to 5:59 AM | 4,042 (5.8%) | 1,565 (2.6%) |
| 6:00 AM to 6:29 AM | 6,740 (9.7%) | 4,381 (7.2%) |
| 6:30 AM to 6:59 AM | 8,561 (12.3%) | 7,692 (12.7%) |
| 7:00 AM to 7:29 AM | 13,691 (19.6%) | 10,155 (16.7%) |
| 7:30 AM to 7:59 AM | 8,658 (12.4%) | 10,523 (17.3%) |
| 8:00 AM to 8:29 AM | 6,956 (10.0%) | 8,295 (13.7%) |
| 8:30 AM to 8:59 AM | 2,701 (3.9%) | 3,802 (6.3%) |
| 9:00 AM to 9:59 AM | 3,272 (4.7%) | 3,492 (5.8%) |
| 10:00 AM to 10:59 AM | 1,322 (1.9%) | 1,739 (2.9%) |
| 11:00 AM to 11:59 AM | 847 (1.2%) | 725 (1.2%) |
| 12:00 PM to 3:59 PM | 2,878 (4.1%) | 2,923 (4.8%) |
| 4:00 PM to 11:59 PM | 3,965 (5.7%) | 3,166 (5.2%) |
| Total | 69,712 (100.0%) | 60,679 (100.0%) |
Housing Occupancy in Lexington County
Occupancy by Ownership in Lexington County
Of the total 118,673 dwellings in Lexington County, owner-occupied units account for 90,689 (76.4%), while renter-occupied units make up 27,984 (23.6%).
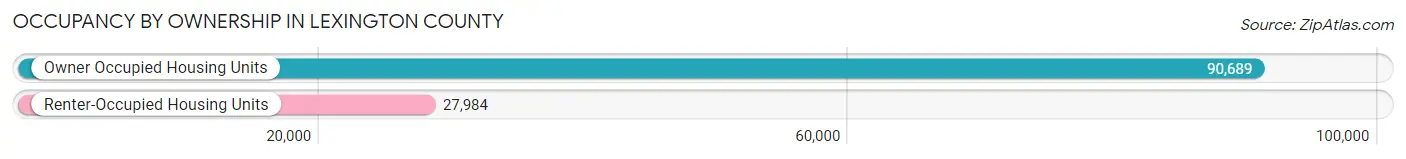
| Occupancy | # Housing Units | % Housing Units |
| Owner Occupied Housing Units | 90,689 | 76.4% |
| Renter-Occupied Housing Units | 27,984 | 23.6% |
| Total Occupied Housing Units | 118,673 | 100.0% |
Occupancy by Household Size in Lexington County
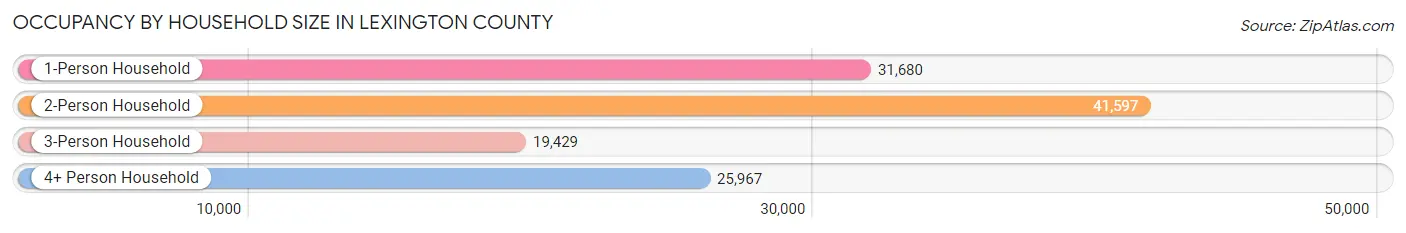
| Household Size | # Housing Units | % Housing Units |
| 1-Person Household | 31,680 | 26.7% |
| 2-Person Household | 41,597 | 35.0% |
| 3-Person Household | 19,429 | 16.4% |
| 4+ Person Household | 25,967 | 21.9% |
| Total Housing Units | 118,673 | 100.0% |
Occupancy by Ownership by Household Size in Lexington County
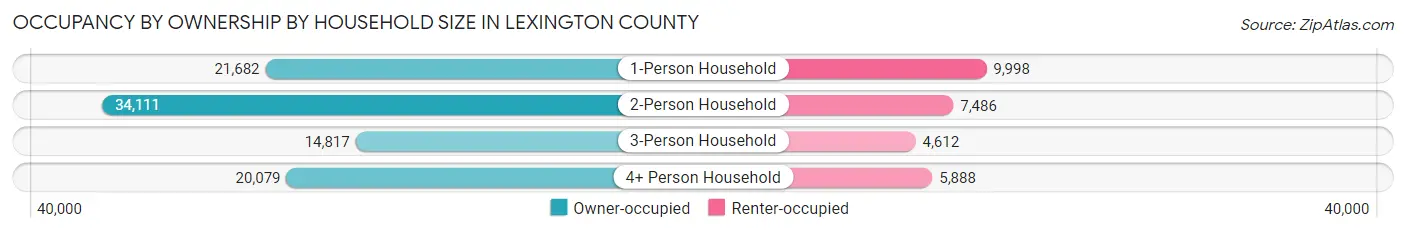
| Household Size | Owner-occupied | Renter-occupied |
| 1-Person Household | 21,682 (68.4%) | 9,998 (31.6%) |
| 2-Person Household | 34,111 (82.0%) | 7,486 (18.0%) |
| 3-Person Household | 14,817 (76.3%) | 4,612 (23.7%) |
| 4+ Person Household | 20,079 (77.3%) | 5,888 (22.7%) |
| Total Housing Units | 90,689 (76.4%) | 27,984 (23.6%) |
Occupancy by Educational Attainment in Lexington County
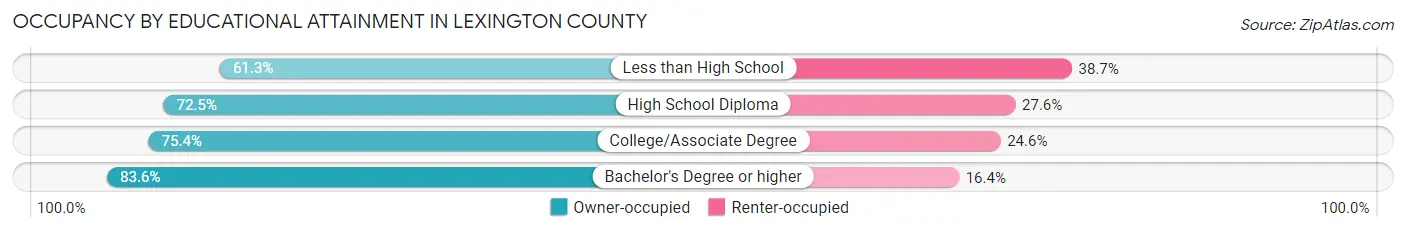
| Household Size | Owner-occupied | Renter-occupied |
| Less than High School | 5,670 (61.3%) | 3,586 (38.7%) |
| High School Diploma | 20,530 (72.5%) | 7,808 (27.6%) |
| College/Associate Degree | 30,407 (75.4%) | 9,918 (24.6%) |
| Bachelor's Degree or higher | 34,082 (83.6%) | 6,672 (16.4%) |
Occupancy by Age of Householder in Lexington County
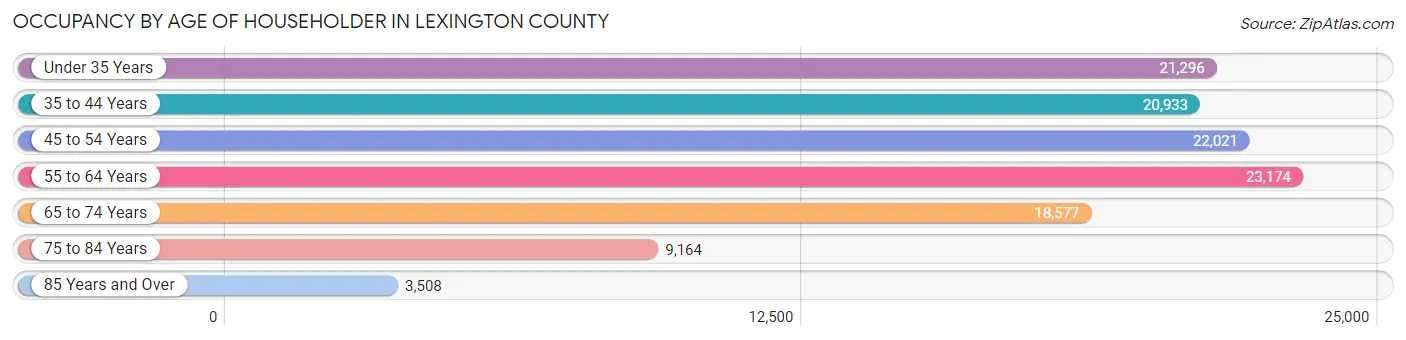
| Age Bracket | # Households | % Households |
| Under 35 Years | 21,296 | 17.9% |
| 35 to 44 Years | 20,933 | 17.6% |
| 45 to 54 Years | 22,021 | 18.6% |
| 55 to 64 Years | 23,174 | 19.5% |
| 65 to 74 Years | 18,577 | 15.7% |
| 75 to 84 Years | 9,164 | 7.7% |
| 85 Years and Over | 3,508 | 3.0% |
| Total | 118,673 | 100.0% |
Housing Finances in Lexington County
Median Income by Occupancy in Lexington County
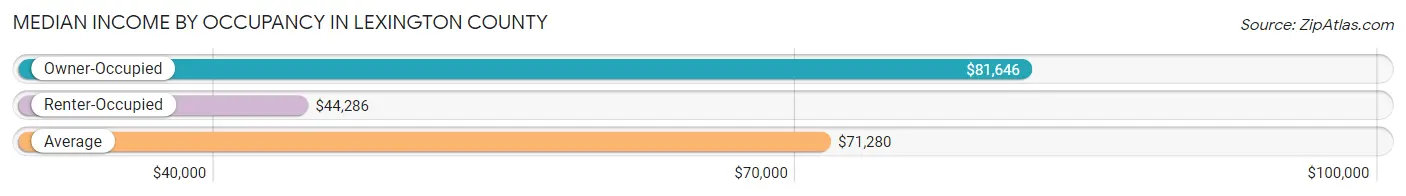
| Occupancy Type | # Households | Median Income |
| Owner-Occupied | 90,689 (76.4%) | $81,646 |
| Renter-Occupied | 27,984 (23.6%) | $44,286 |
| Average | 118,673 (100.0%) | $71,280 |
Occupancy by Householder Income Bracket in Lexington County
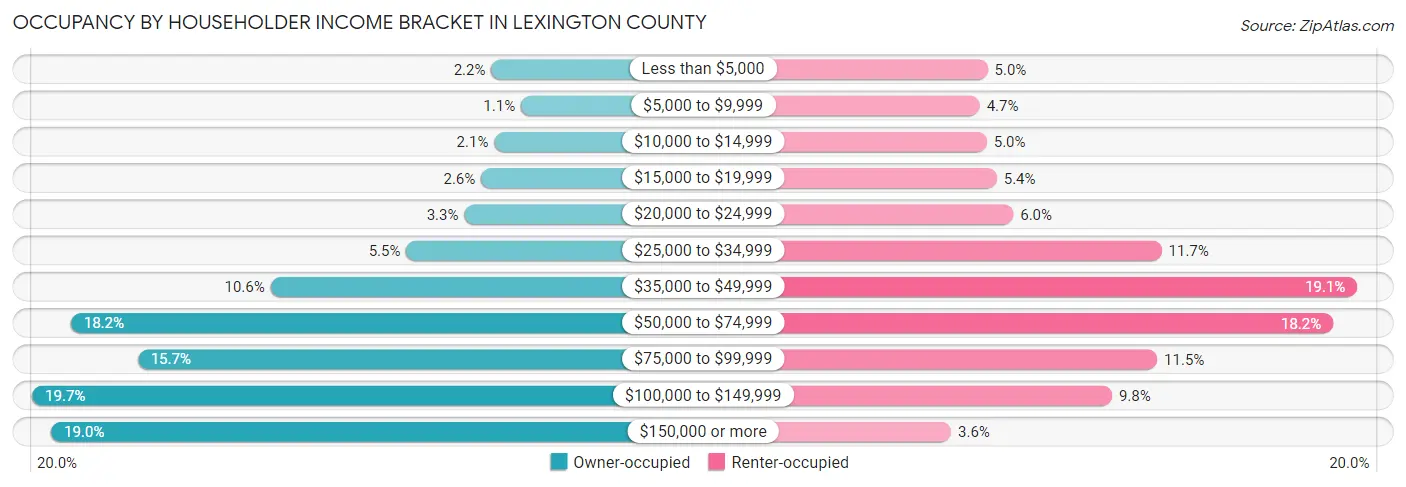
| Income Bracket | Owner-occupied | Renter-occupied |
| Less than $5,000 | 2,012 (2.2%) | 1,407 (5.0%) |
| $5,000 to $9,999 | 986 (1.1%) | 1,323 (4.7%) |
| $10,000 to $14,999 | 1,918 (2.1%) | 1,399 (5.0%) |
| $15,000 to $19,999 | 2,369 (2.6%) | 1,505 (5.4%) |
| $20,000 to $24,999 | 2,948 (3.3%) | 1,681 (6.0%) |
| $25,000 to $34,999 | 4,951 (5.5%) | 3,263 (11.7%) |
| $35,000 to $49,999 | 9,639 (10.6%) | 5,349 (19.1%) |
| $50,000 to $74,999 | 16,543 (18.2%) | 5,090 (18.2%) |
| $75,000 to $99,999 | 14,230 (15.7%) | 3,214 (11.5%) |
| $100,000 to $149,999 | 17,872 (19.7%) | 2,735 (9.8%) |
| $150,000 or more | 17,221 (19.0%) | 1,018 (3.6%) |
| Total | 90,689 (100.0%) | 27,984 (100.0%) |
Monthly Housing Cost Tiers in Lexington County
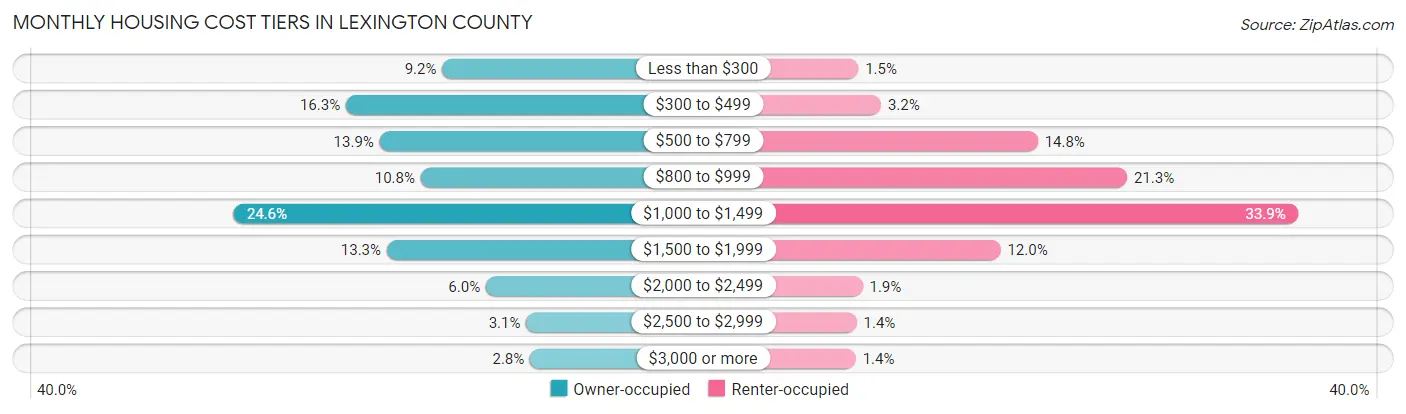
| Monthly Cost | Owner-occupied | Renter-occupied |
| Less than $300 | 8,382 (9.2%) | 429 (1.5%) |
| $300 to $499 | 14,813 (16.3%) | 897 (3.2%) |
| $500 to $799 | 12,557 (13.9%) | 4,127 (14.7%) |
| $800 to $999 | 9,811 (10.8%) | 5,968 (21.3%) |
| $1,000 to $1,499 | 22,304 (24.6%) | 9,483 (33.9%) |
| $1,500 to $1,999 | 12,077 (13.3%) | 3,362 (12.0%) |
| $2,000 to $2,499 | 5,461 (6.0%) | 517 (1.8%) |
| $2,500 to $2,999 | 2,770 (3.0%) | 395 (1.4%) |
| $3,000 or more | 2,514 (2.8%) | 378 (1.3%) |
| Total | 90,689 (100.0%) | 27,984 (100.0%) |
Physical Housing Characteristics in Lexington County
Housing Structures in Lexington County
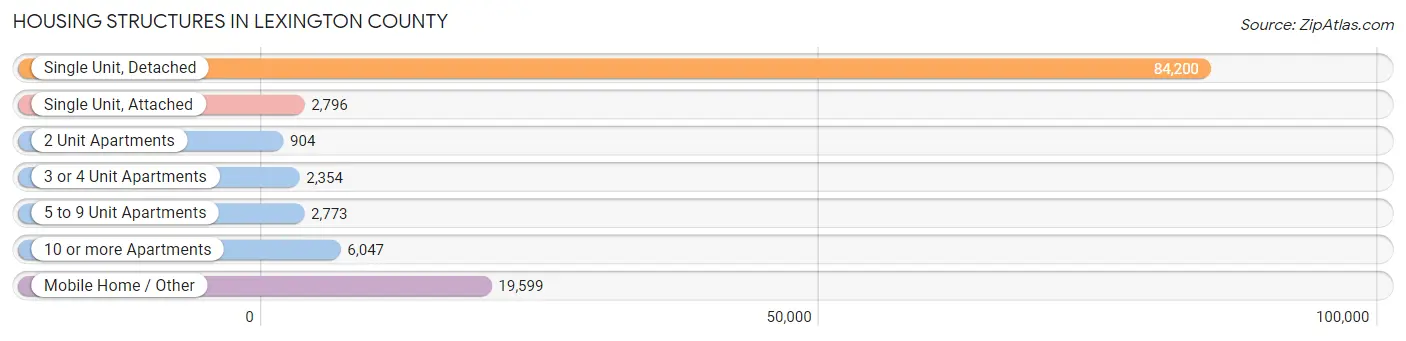
| Structure Type | # Housing Units | % Housing Units |
| Single Unit, Detached | 84,200 | 71.0% |
| Single Unit, Attached | 2,796 | 2.4% |
| 2 Unit Apartments | 904 | 0.8% |
| 3 or 4 Unit Apartments | 2,354 | 2.0% |
| 5 to 9 Unit Apartments | 2,773 | 2.3% |
| 10 or more Apartments | 6,047 | 5.1% |
| Mobile Home / Other | 19,599 | 16.5% |
| Total | 118,673 | 100.0% |
Housing Structures by Occupancy in Lexington County
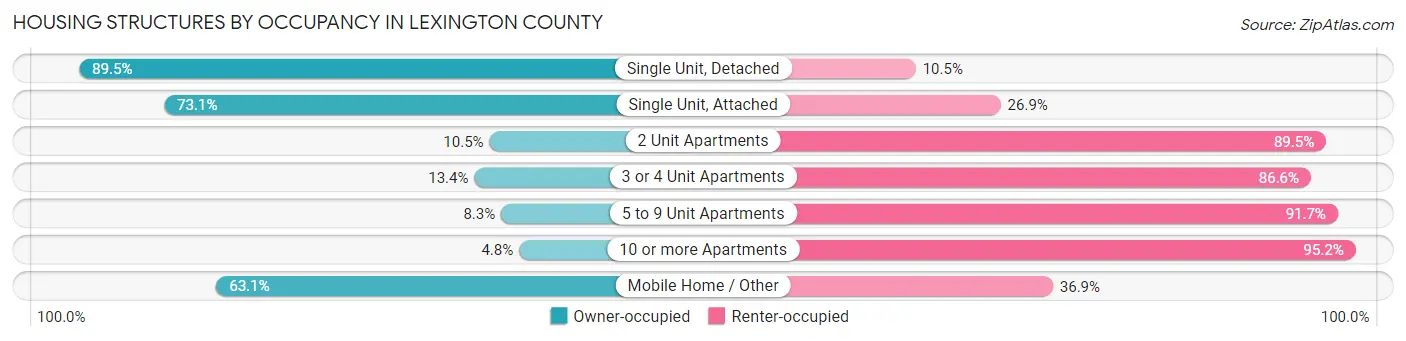
| Structure Type | Owner-occupied | Renter-occupied |
| Single Unit, Detached | 75,349 (89.5%) | 8,851 (10.5%) |
| Single Unit, Attached | 2,045 (73.1%) | 751 (26.9%) |
| 2 Unit Apartments | 95 (10.5%) | 809 (89.5%) |
| 3 or 4 Unit Apartments | 316 (13.4%) | 2,038 (86.6%) |
| 5 to 9 Unit Apartments | 229 (8.3%) | 2,544 (91.7%) |
| 10 or more Apartments | 290 (4.8%) | 5,757 (95.2%) |
| Mobile Home / Other | 12,365 (63.1%) | 7,234 (36.9%) |
| Total | 90,689 (76.4%) | 27,984 (23.6%) |
Housing Structures by Number of Rooms in Lexington County
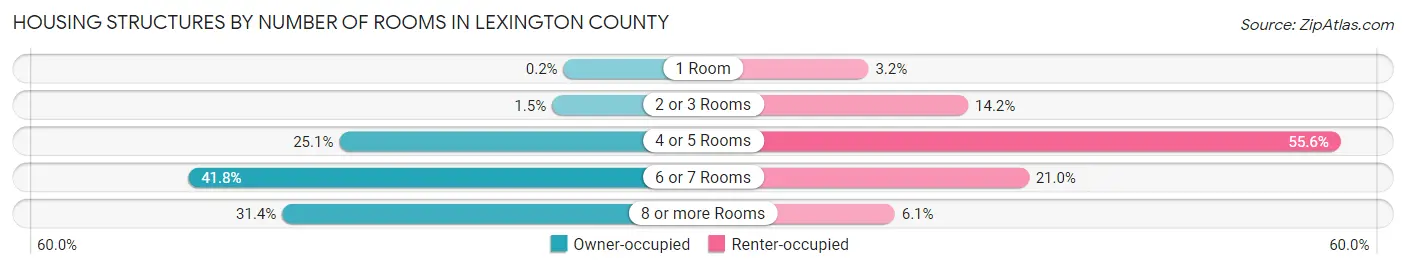
| Number of Rooms | Owner-occupied | Renter-occupied |
| 1 Room | 178 (0.2%) | 886 (3.2%) |
| 2 or 3 Rooms | 1,332 (1.5%) | 3,981 (14.2%) |
| 4 or 5 Rooms | 22,743 (25.1%) | 15,550 (55.6%) |
| 6 or 7 Rooms | 37,944 (41.8%) | 5,864 (20.9%) |
| 8 or more Rooms | 28,492 (31.4%) | 1,703 (6.1%) |
| Total | 90,689 (100.0%) | 27,984 (100.0%) |
Housing Structure by Heating Type in Lexington County
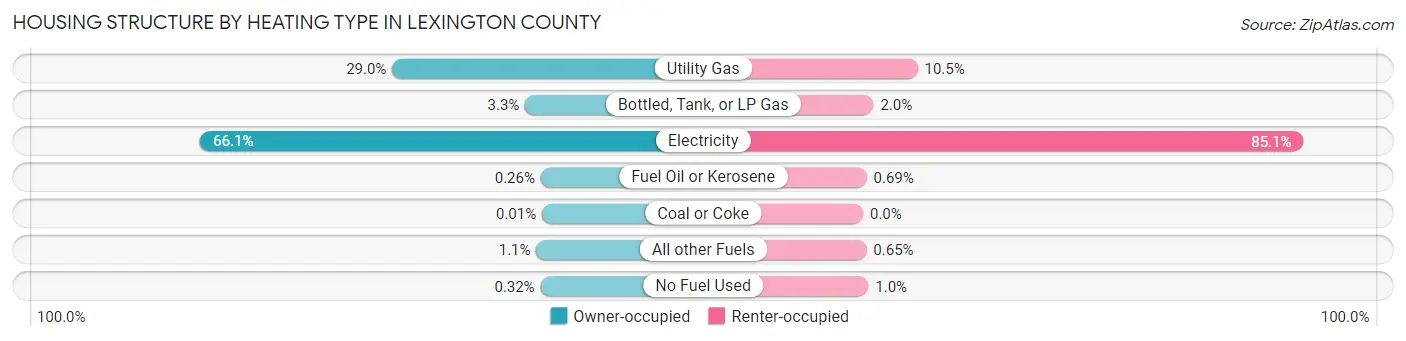
| Heating Type | Owner-occupied | Renter-occupied |
| Utility Gas | 26,269 (29.0%) | 2,947 (10.5%) |
| Bottled, Tank, or LP Gas | 2,969 (3.3%) | 567 (2.0%) |
| Electricity | 59,917 (66.1%) | 23,810 (85.1%) |
| Fuel Oil or Kerosene | 236 (0.3%) | 192 (0.7%) |
| Coal or Coke | 5 (0.0%) | 0 (0.0%) |
| All other Fuels | 1,006 (1.1%) | 183 (0.6%) |
| No Fuel Used | 287 (0.3%) | 285 (1.0%) |
| Total | 90,689 (100.0%) | 27,984 (100.0%) |
Household Vehicle Usage in Lexington County
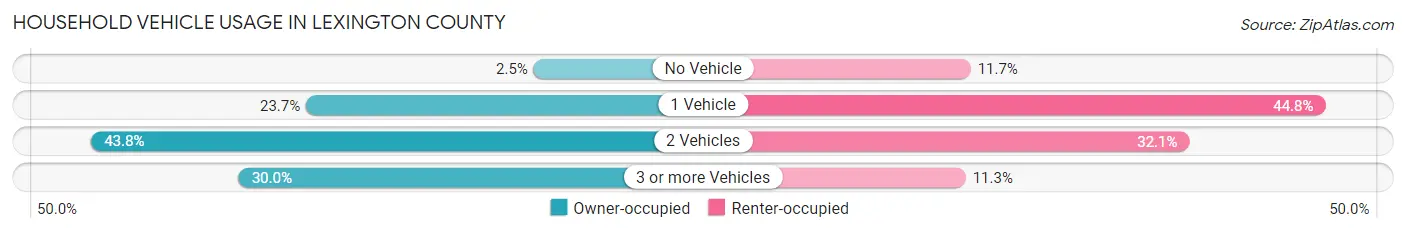
| Vehicles per Household | Owner-occupied | Renter-occupied |
| No Vehicle | 2,248 (2.5%) | 3,285 (11.7%) |
| 1 Vehicle | 21,519 (23.7%) | 12,549 (44.8%) |
| 2 Vehicles | 39,705 (43.8%) | 8,994 (32.1%) |
| 3 or more Vehicles | 27,217 (30.0%) | 3,156 (11.3%) |
| Total | 90,689 (100.0%) | 27,984 (100.0%) |
Real Estate & Mortgages in Lexington County
Real Estate and Mortgage Overview in Lexington County
| Characteristic | Without Mortgage | With Mortgage |
| Housing Units | 32,513 | 58,176 |
| Median Property Value | $177,300 | $208,000 |
| Median Household Income | $61,660 | $13,355 |
| Monthly Housing Costs | $403 | $2,402 |
| Real Estate Taxes | $862 | $2,595 |
Property Value by Mortgage Status in Lexington County
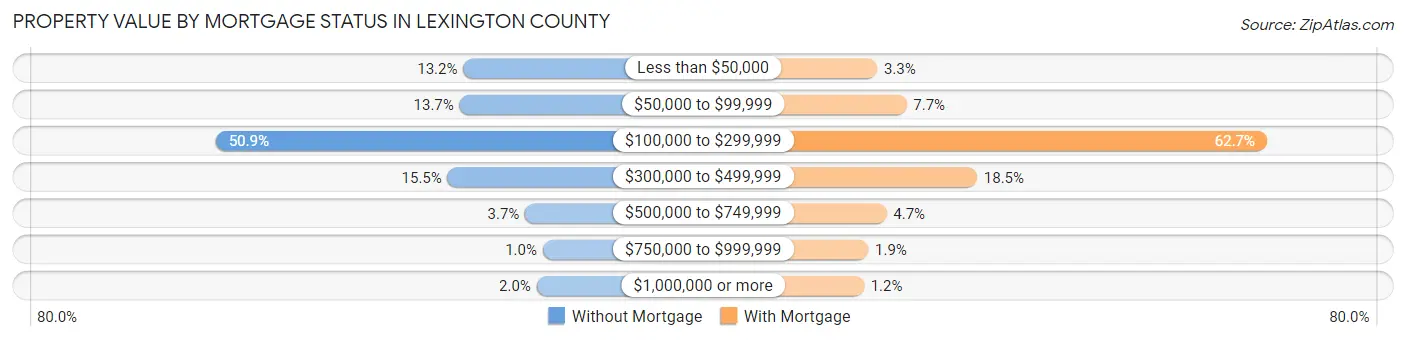
| Property Value | Without Mortgage | With Mortgage |
| Less than $50,000 | 4,274 (13.2%) | 1,903 (3.3%) |
| $50,000 to $99,999 | 4,456 (13.7%) | 4,500 (7.7%) |
| $100,000 to $299,999 | 16,539 (50.9%) | 36,461 (62.7%) |
| $300,000 to $499,999 | 5,054 (15.5%) | 10,758 (18.5%) |
| $500,000 to $749,999 | 1,210 (3.7%) | 2,726 (4.7%) |
| $750,000 to $999,999 | 339 (1.0%) | 1,109 (1.9%) |
| $1,000,000 or more | 641 (2.0%) | 719 (1.2%) |
| Total | 32,513 (100.0%) | 58,176 (100.0%) |
Household Income by Mortgage Status in Lexington County
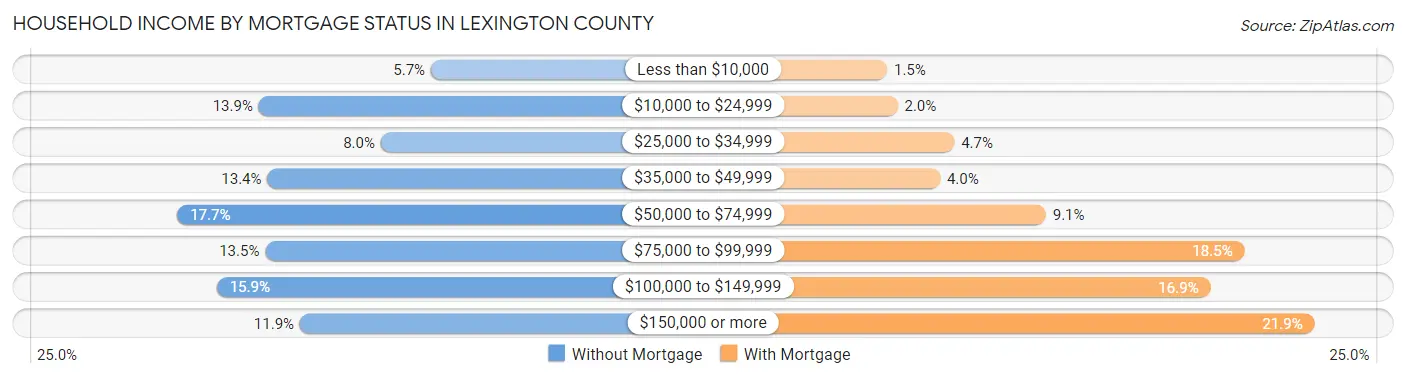
| Household Income | Without Mortgage | With Mortgage |
| Less than $10,000 | 1,837 (5.7%) | 872 (1.5%) |
| $10,000 to $24,999 | 4,503 (13.9%) | 1,161 (2.0%) |
| $25,000 to $34,999 | 2,615 (8.0%) | 2,732 (4.7%) |
| $35,000 to $49,999 | 4,371 (13.4%) | 2,336 (4.0%) |
| $50,000 to $74,999 | 5,766 (17.7%) | 5,268 (9.1%) |
| $75,000 to $99,999 | 4,401 (13.5%) | 10,777 (18.5%) |
| $100,000 to $149,999 | 5,154 (15.9%) | 9,829 (16.9%) |
| $150,000 or more | 3,866 (11.9%) | 12,718 (21.9%) |
| Total | 32,513 (100.0%) | 58,176 (100.0%) |
Property Value to Household Income Ratio in Lexington County
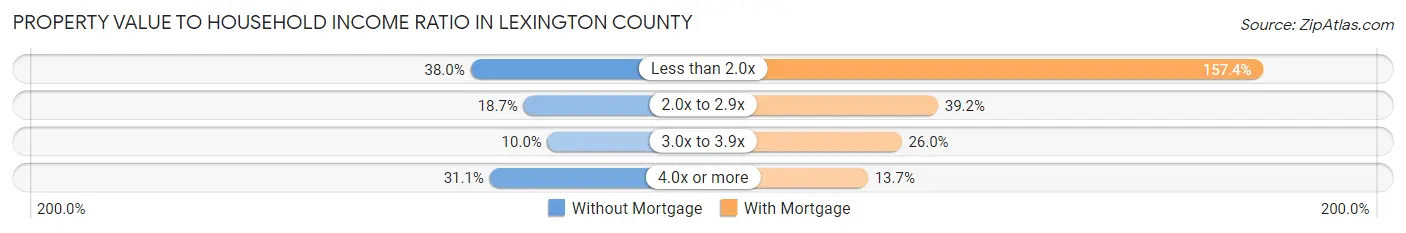
| Value-to-Income Ratio | Without Mortgage | With Mortgage |
| Less than 2.0x | 12,361 (38.0%) | 91,590 (157.4%) |
| 2.0x to 2.9x | 6,086 (18.7%) | 22,791 (39.2%) |
| 3.0x to 3.9x | 3,254 (10.0%) | 15,114 (26.0%) |
| 4.0x or more | 10,102 (31.1%) | 7,988 (13.7%) |
| Total | 32,513 (100.0%) | 58,176 (100.0%) |
Real Estate Taxes by Mortgage Status in Lexington County
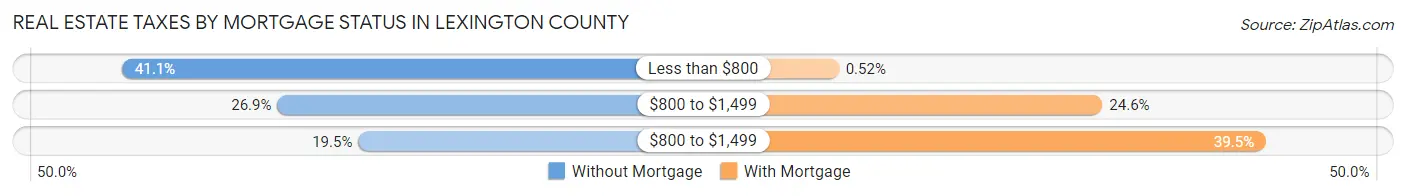
| Property Taxes | Without Mortgage | With Mortgage |
| Less than $800 | 13,366 (41.1%) | 304 (0.5%) |
| $800 to $1,499 | 8,751 (26.9%) | 14,309 (24.6%) |
| $800 to $1,499 | 6,351 (19.5%) | 23,002 (39.5%) |
| Total | 32,513 (100.0%) | 58,176 (100.0%) |
Health & Disability in Lexington County
Health Insurance Coverage by Age in Lexington County
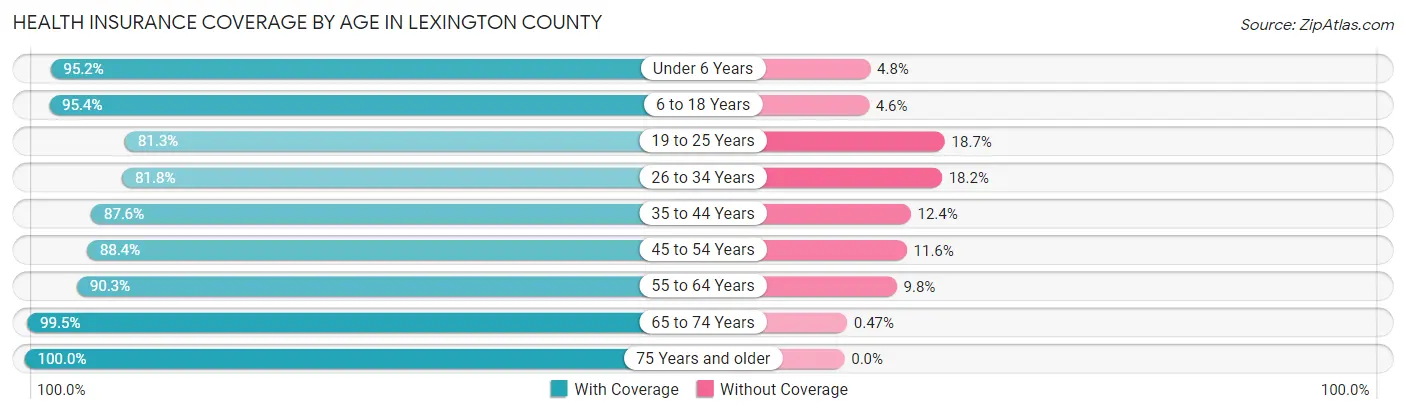
| Age Bracket | With Coverage | Without Coverage |
| Under 6 Years | 19,323 (95.2%) | 976 (4.8%) |
| 6 to 18 Years | 48,224 (95.4%) | 2,309 (4.6%) |
| 19 to 25 Years | 18,896 (81.3%) | 4,350 (18.7%) |
| 26 to 34 Years | 28,399 (81.8%) | 6,305 (18.2%) |
| 35 to 44 Years | 33,448 (87.6%) | 4,716 (12.4%) |
| 45 to 54 Years | 34,366 (88.4%) | 4,519 (11.6%) |
| 55 to 64 Years | 35,480 (90.2%) | 3,832 (9.8%) |
| 65 to 74 Years | 29,314 (99.5%) | 138 (0.5%) |
| 75 Years and older | 18,453 (100.0%) | 0 (0.0%) |
| Total | 265,903 (90.7%) | 27,145 (9.3%) |
Health Insurance Coverage by Citizenship Status in Lexington County
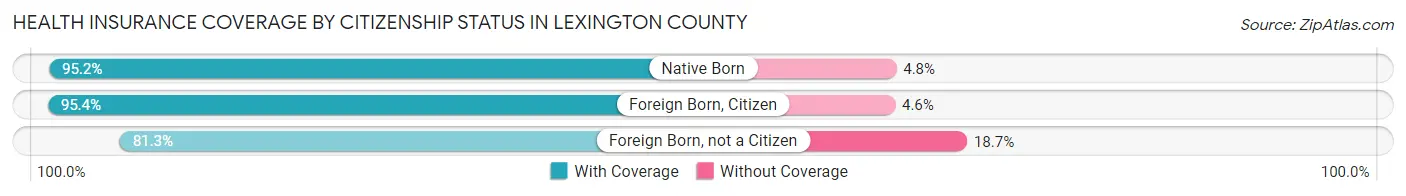
| Citizenship Status | With Coverage | Without Coverage |
| Native Born | 19,323 (95.2%) | 976 (4.8%) |
| Foreign Born, Citizen | 48,224 (95.4%) | 2,309 (4.6%) |
| Foreign Born, not a Citizen | 18,896 (81.3%) | 4,350 (18.7%) |
Health Insurance Coverage by Household Income in Lexington County
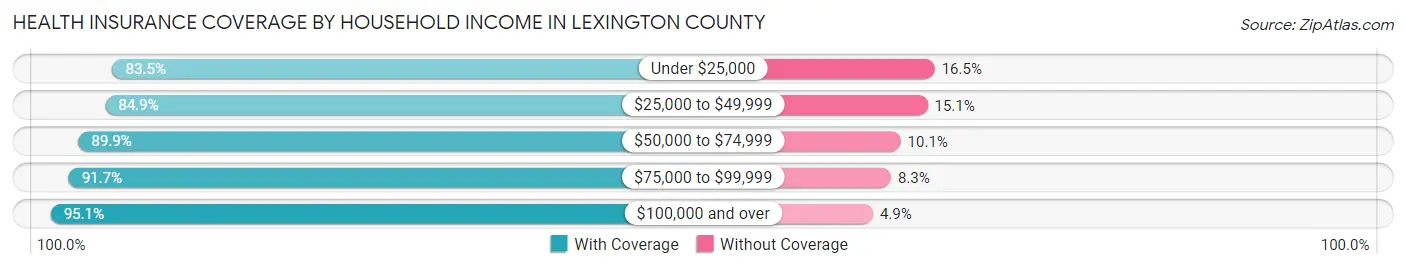
| Household Income | With Coverage | Without Coverage |
| Under $25,000 | 25,199 (83.5%) | 4,974 (16.5%) |
| $25,000 to $49,999 | 41,191 (84.9%) | 7,342 (15.1%) |
| $50,000 to $74,999 | 46,967 (89.9%) | 5,269 (10.1%) |
| $75,000 to $99,999 | 41,955 (91.7%) | 3,785 (8.3%) |
| $100,000 and over | 109,997 (95.1%) | 5,672 (4.9%) |
Public vs Private Health Insurance Coverage by Age in Lexington County
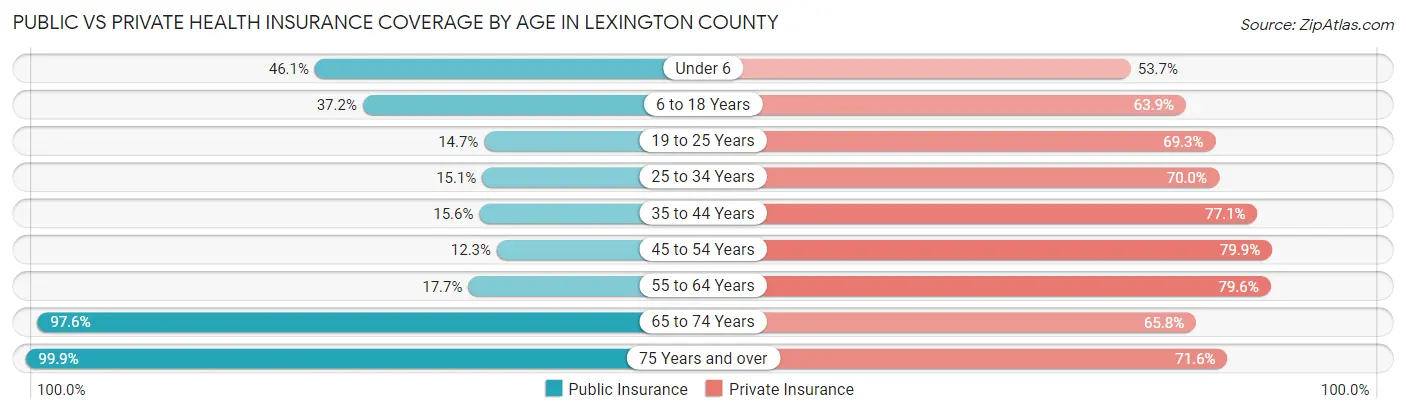
| Age Bracket | Public Insurance | Private Insurance |
| Under 6 | 9,363 (46.1%) | 10,890 (53.6%) |
| 6 to 18 Years | 18,817 (37.2%) | 32,275 (63.9%) |
| 19 to 25 Years | 3,415 (14.7%) | 16,115 (69.3%) |
| 25 to 34 Years | 5,226 (15.1%) | 24,281 (70.0%) |
| 35 to 44 Years | 5,953 (15.6%) | 29,438 (77.1%) |
| 45 to 54 Years | 4,798 (12.3%) | 31,055 (79.9%) |
| 55 to 64 Years | 6,940 (17.6%) | 31,290 (79.6%) |
| 65 to 74 Years | 28,755 (97.6%) | 19,364 (65.7%) |
| 75 Years and over | 18,425 (99.9%) | 13,206 (71.6%) |
| Total | 101,692 (34.7%) | 207,914 (71.0%) |
Disability Status by Sex by Age in Lexington County
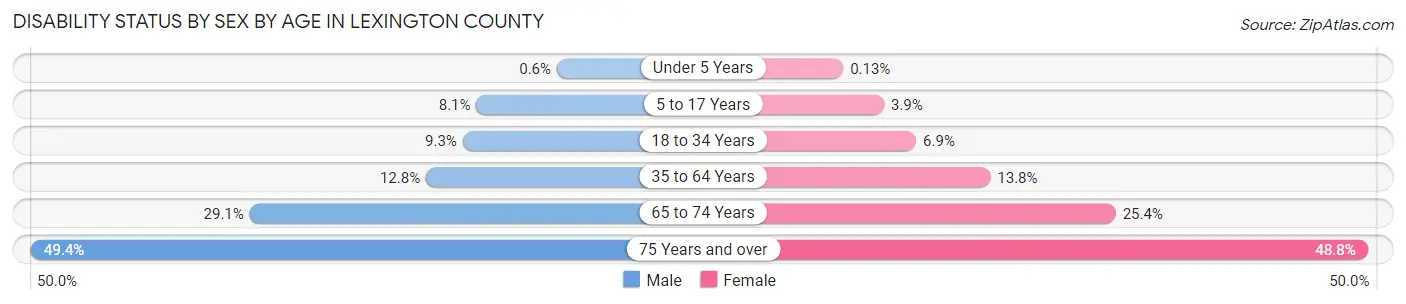
| Age Bracket | Male | Female |
| Under 5 Years | 50 (0.6%) | 11 (0.1%) |
| 5 to 17 Years | 2,105 (8.1%) | 979 (3.9%) |
| 18 to 34 Years | 2,826 (9.3%) | 2,130 (6.9%) |
| 35 to 64 Years | 7,242 (12.8%) | 8,218 (13.8%) |
| 65 to 74 Years | 3,979 (29.1%) | 4,014 (25.4%) |
| 75 Years and over | 3,758 (49.4%) | 5,292 (48.8%) |
Disability Class by Sex by Age in Lexington County
Disability Class: Hearing Difficulty
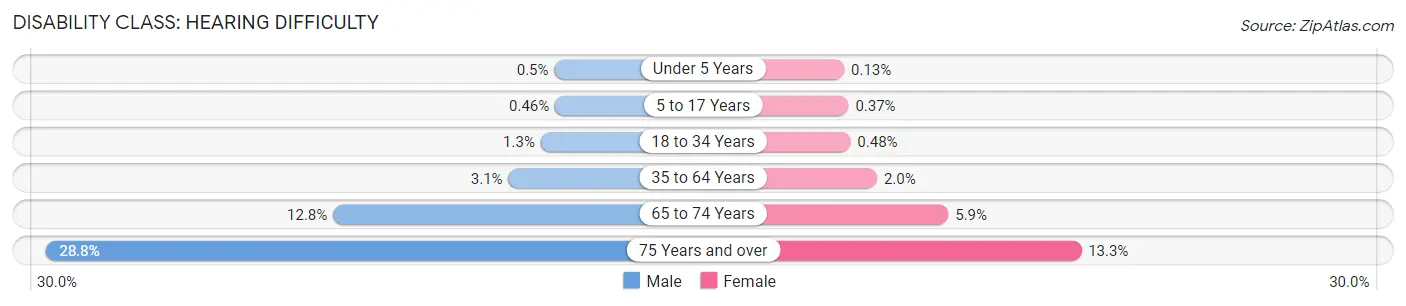
| Age Bracket | Male | Female |
| Under 5 Years | 42 (0.5%) | 11 (0.1%) |
| 5 to 17 Years | 121 (0.5%) | 93 (0.4%) |
| 18 to 34 Years | 380 (1.3%) | 147 (0.5%) |
| 35 to 64 Years | 1,740 (3.1%) | 1,168 (2.0%) |
| 65 to 74 Years | 1,751 (12.8%) | 937 (5.9%) |
| 75 Years and over | 2,190 (28.8%) | 1,446 (13.3%) |
Disability Class: Vision Difficulty
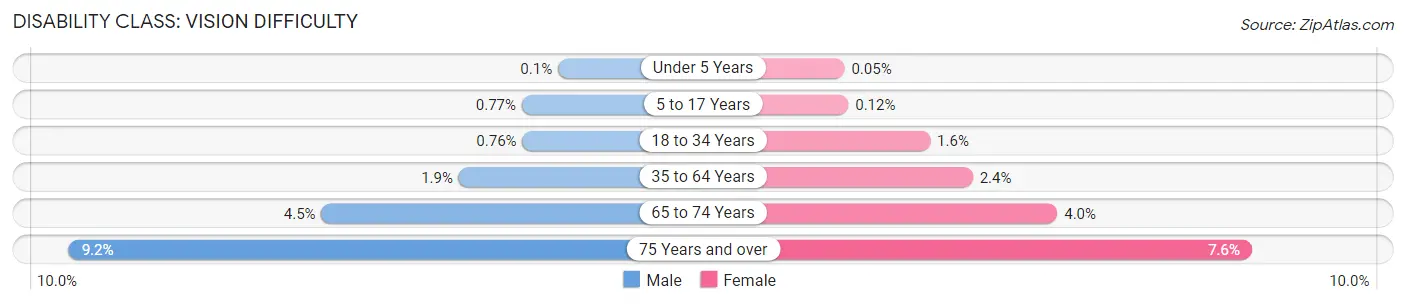
| Age Bracket | Male | Female |
| Under 5 Years | 8 (0.1%) | 4 (0.1%) |
| 5 to 17 Years | 200 (0.8%) | 29 (0.1%) |
| 18 to 34 Years | 231 (0.8%) | 506 (1.6%) |
| 35 to 64 Years | 1,103 (1.9%) | 1,445 (2.4%) |
| 65 to 74 Years | 614 (4.5%) | 632 (4.0%) |
| 75 Years and over | 698 (9.2%) | 825 (7.6%) |
Disability Class: Cognitive Difficulty
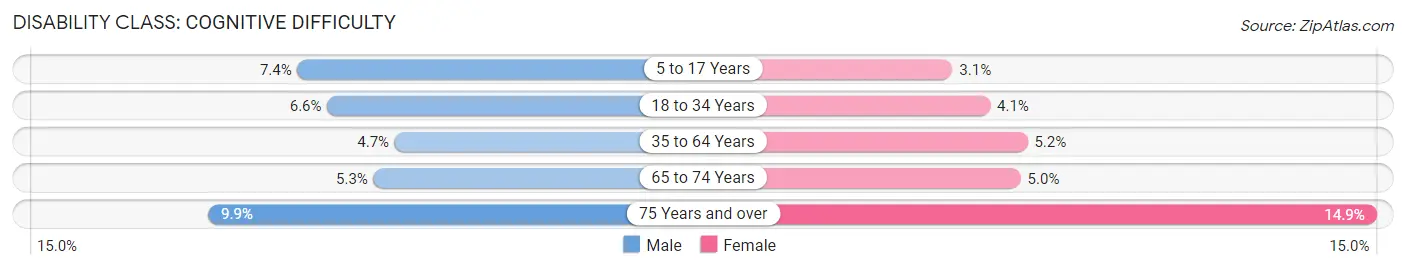
| Age Bracket | Male | Female |
| 5 to 17 Years | 1,930 (7.4%) | 772 (3.1%) |
| 18 to 34 Years | 1,988 (6.6%) | 1,276 (4.1%) |
| 35 to 64 Years | 2,661 (4.7%) | 3,081 (5.2%) |
| 65 to 74 Years | 721 (5.3%) | 787 (5.0%) |
| 75 Years and over | 752 (9.9%) | 1,615 (14.9%) |
Disability Class: Ambulatory Difficulty
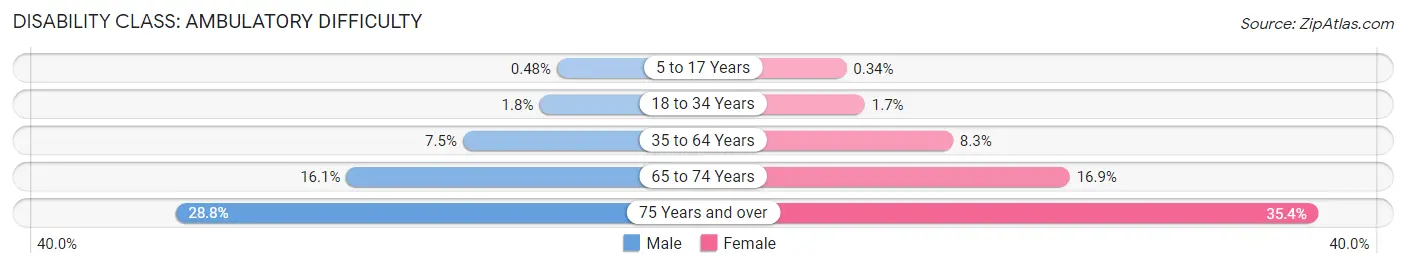
| Age Bracket | Male | Female |
| 5 to 17 Years | 126 (0.5%) | 85 (0.3%) |
| 18 to 34 Years | 542 (1.8%) | 528 (1.7%) |
| 35 to 64 Years | 4,243 (7.5%) | 4,913 (8.3%) |
| 65 to 74 Years | 2,202 (16.1%) | 2,671 (16.9%) |
| 75 Years and over | 2,191 (28.8%) | 3,840 (35.4%) |
Disability Class: Self-Care Difficulty
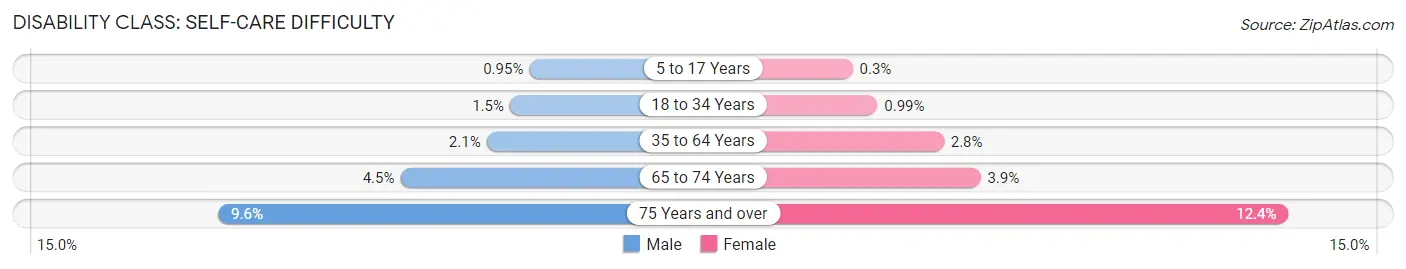
| Age Bracket | Male | Female |
| 5 to 17 Years | 248 (0.9%) | 75 (0.3%) |
| 18 to 34 Years | 451 (1.5%) | 305 (1.0%) |
| 35 to 64 Years | 1,216 (2.1%) | 1,690 (2.8%) |
| 65 to 74 Years | 620 (4.5%) | 609 (3.9%) |
| 75 Years and over | 731 (9.6%) | 1,348 (12.4%) |
Technology Access in Lexington County
Computing Device Access in Lexington County
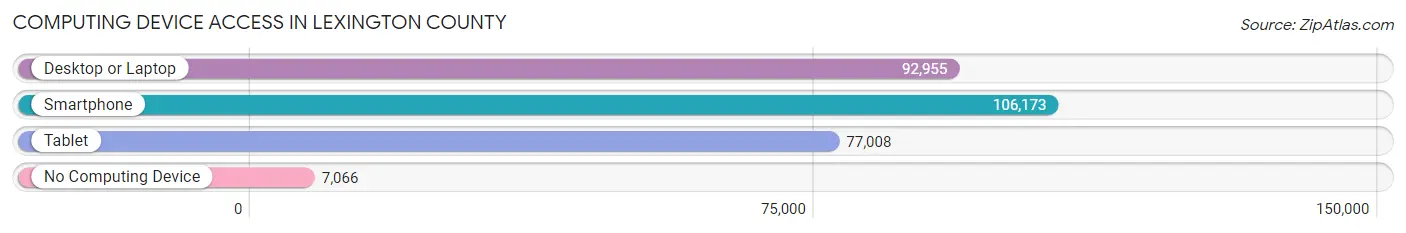
| Device Type | # Households | % Households |
| Desktop or Laptop | 92,955 | 78.3% |
| Smartphone | 106,173 | 89.5% |
| Tablet | 77,008 | 64.9% |
| No Computing Device | 7,066 | 5.9% |
| Total | 118,673 | 100.0% |
Internet Access in Lexington County
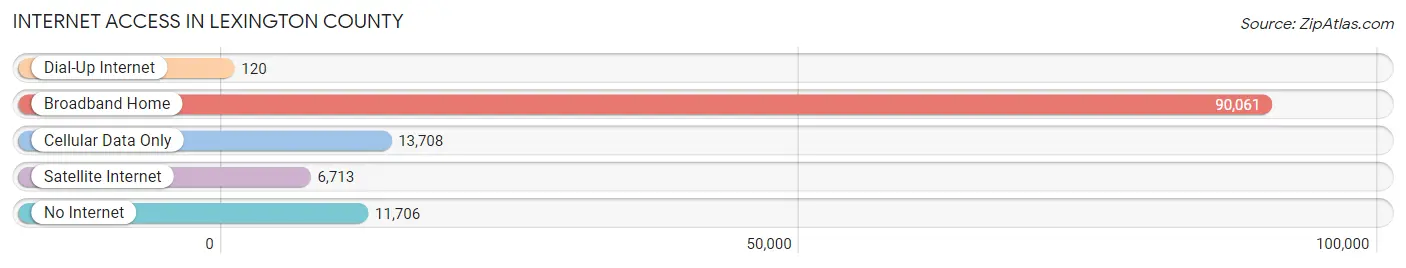
| Internet Type | # Households | % Households |
| Dial-Up Internet | 120 | 0.1% |
| Broadband Home | 90,061 | 75.9% |
| Cellular Data Only | 13,708 | 11.6% |
| Satellite Internet | 6,713 | 5.7% |
| No Internet | 11,706 | 9.9% |
| Total | 118,673 | 100.0% |
Lexington County Summary
Lexington County, South Carolina is located in the Midlands region of the state and is part of the Columbia Metropolitan Statistical Area. It is bordered by Richland County to the north, Saluda County to the east, Aiken County to the south, and Newberry County to the west. The county seat is Lexington, and the largest city is West Columbia. As of the 2010 census, the population of Lexington County was 262,391, making it the second-most populous county in South Carolina.
History
The area that is now Lexington County was originally part of the colonial Province of South Carolina. It was first settled by Europeans in the late 1730s, and the county was officially established in 1785. The county was named for the Battle of Lexington, which took place in Massachusetts during the American Revolutionary War.
In the 19th century, Lexington County was largely rural and agricultural. Cotton was the main crop, and the county was home to several large plantations. The county was also home to several small towns, including Lexington, West Columbia, and Swansea.
Geography
Lexington County covers an area of 758 square miles, making it the fourth-largest county in South Carolina. The county is located in the Midlands region of the state, and is bordered by Richland County to the north, Saluda County to the east, Aiken County to the south, and Newberry County to the west. The county is divided into two distinct regions: the uplands in the north and the lowlands in the south.
The northern part of the county is mostly rolling hills and is home to the Congaree National Park. The southern part of the county is mostly flat and is home to several large lakes, including Lake Murray and Lake Wateree. The Saluda River runs through the county, and the Broad River forms part of the county's western border.
Economy
The economy of Lexington County is largely based on manufacturing, agriculture, and tourism. The county is home to several large manufacturing companies, including Bridgestone, Continental Tire, and Michelin. Agriculture is also an important part of the county's economy, with cotton, soybeans, and corn being the main crops. Tourism is also an important part of the county's economy, with Lake Murray and Congaree National Park being popular destinations.
Demographics
As of the 2010 census, the population of Lexington County was 262,391, making it the second-most populous county in South Carolina. The population is spread out with a median age of 38.7 years. The racial makeup of the county is 79.2% White, 15.3% African American, 1.2% Asian, 0.4% Native American, and 3.9% from other races. The largest ancestry groups in the county are German (17.3%), English (14.2%), Irish (13.2%), and African (10.2%).
The median household income in the county is $50,945, and the median family income is $60,945. The per capita income is $25,945. The poverty rate is 11.3%, and the unemployment rate is 4.2%. The largest industries in the county are manufacturing (20.2%), retail trade (14.2%), and health care and social assistance (13.2%).
Common Questions
What is Per Capita Income in Lexington County?
Per Capita income in Lexington County is $37,209.
What is the Median Family Income in Lexington County?
Median Family Income in Lexington County is $85,806.
What is the Median Household income in Lexington County?
Median Household Income in Lexington County is $71,280.
What is Income or Wage Gap in Lexington County?
Income or Wage Gap in Lexington County is 26.2%.
Women in Lexington County earn 73.8 cents for every dollar earned by a man.
What is Family Income Deficit in Lexington County?
Family Income Deficit in Lexington County is $10,180.
Families that are below poverty line in Lexington County earn $10,180 less on average than the poverty threshold level.
What is Inequality or Gini Index in Lexington County?
Inequality or Gini Index in Lexington County is 0.43.
What is the Total Population of Lexington County?
Total Population of Lexington County is 295,934.
What is the Total Male Population of Lexington County?
Total Male Population of Lexington County is 144,763.
What is the Total Female Population of Lexington County?
Total Female Population of Lexington County is 151,171.
What is the Ratio of Males per 100 Females in Lexington County?
There are 95.76 Males per 100 Females in Lexington County.
What is the Ratio of Females per 100 Males in Lexington County?
There are 104.43 Females per 100 Males in Lexington County.
What is the Median Population Age in Lexington County?
Median Population Age in Lexington County is 39.4 Years.
What is the Average Family Size in Lexington County
Average Family Size in Lexington County is 3.0 People.
What is the Average Household Size in Lexington County
Average Household Size in Lexington County is 2.5 People.
How Large is the Labor Force in Lexington County?
There are 151,728 People in the Labor Forcein in Lexington County.
What is the Percentage of People in the Labor Force in Lexington County?
64.3% of People are in the Labor Force in Lexington County.
What is the Unemployment Rate in Lexington County?
Unemployment Rate in Lexington County is 4.4%.