Cities with the Most Immigrants from Costa Rica in the United States
RELATED REPORTS & OPTIONS
Costa Rica
United States
Compare Cities
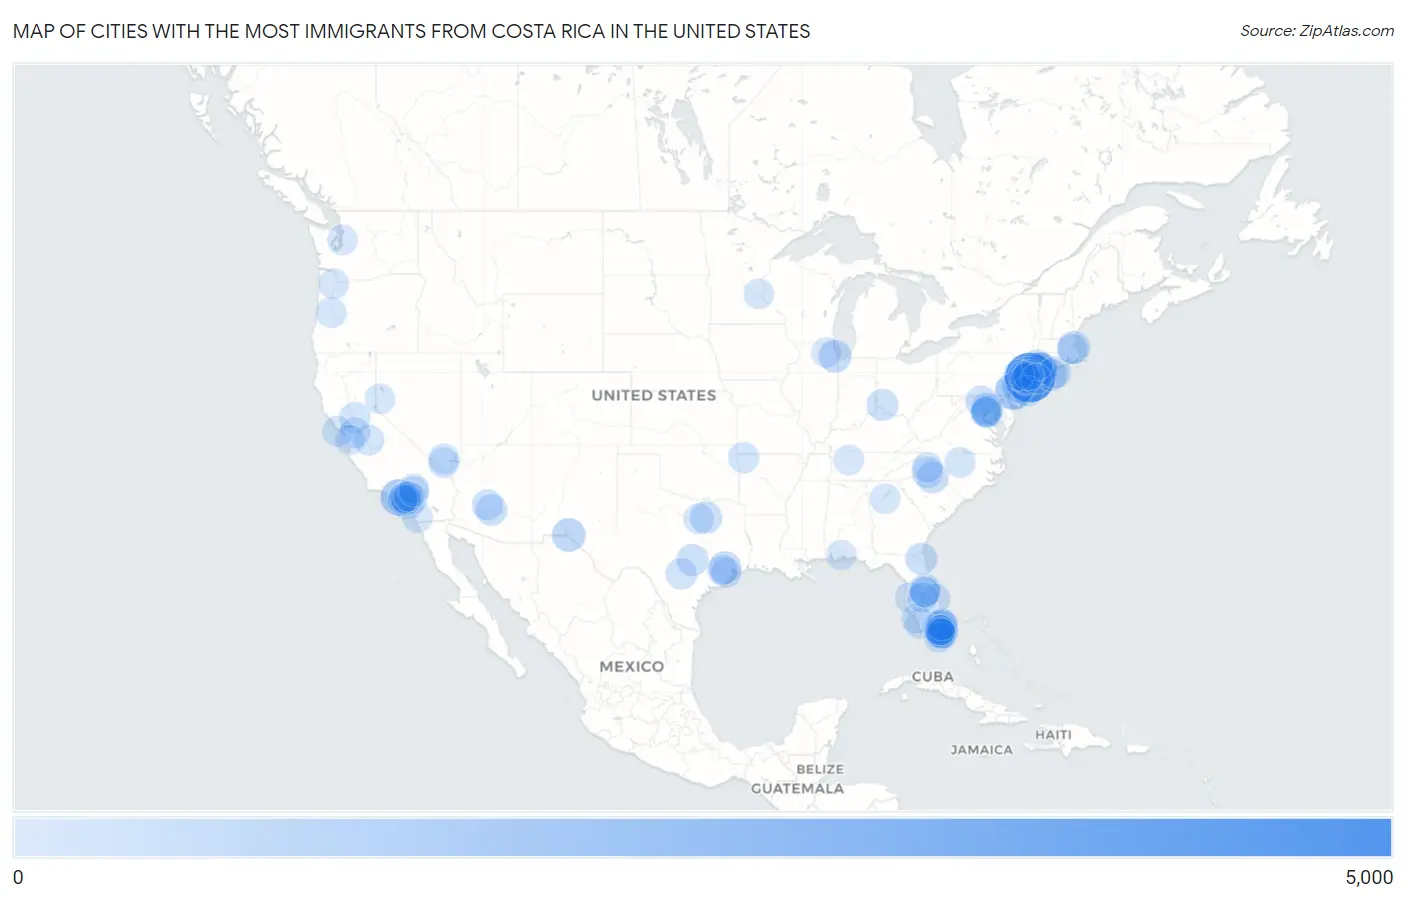
Map of Cities with the Most Immigrants from Costa Rica in the United States
0
5,000
Cities with the Most Immigrants from Costa Rica in the United States
| City | Costa Rica | vs State | vs National | |
| 1. | New York | 4,059 | 7,345(55.26%)#1 | 95,844(4.24%)#1 |
| 2. | Philadelphia | 1,514 | 3,132(48.34%)#1 | 95,844(1.58%)#2 |
| 3. | Los Angeles | 1,354 | 12,623(10.73%)#1 | 95,844(1.41%)#3 |
| 4. | Norwalk | 1,180 | 2,715(43.46%)#1 | 95,844(1.23%)#4 |
| 5. | Trenton | 848 | 14,848(5.71%)#1 | 95,844(0.88%)#5 |
| 6. | Paterson | 840 | 14,848(5.66%)#2 | 95,844(0.88%)#6 |
| 7. | Elizabeth | 822 | 14,848(5.54%)#3 | 95,844(0.86%)#7 |
| 8. | El Paso | 780 | 6,336(12.31%)#1 | 95,844(0.81%)#8 |
| 9. | Bound Brook Borough | 754 | 14,848(5.08%)#4 | 95,844(0.79%)#9 |
| 10. | Miami | 719 | 16,570(4.34%)#1 | 95,844(0.75%)#10 |
| 11. | Boston | 649 | 2,160(30.05%)#1 | 95,844(0.68%)#11 |
| 12. | Summit | 616 | 14,848(4.15%)#5 | 95,844(0.64%)#12 |
| 13. | Chicago | 602 | 1,305(46.13%)#1 | 95,844(0.63%)#13 |
| 14. | Houston | 565 | 6,336(8.92%)#2 | 95,844(0.59%)#14 |
| 15. | Bridgeport | 524 | 2,715(19.30%)#2 | 95,844(0.55%)#15 |
| 16. | Hampton Bays | 485 | 7,345(6.60%)#2 | 95,844(0.51%)#16 |
| 17. | Orlando | 484 | 16,570(2.92%)#2 | 95,844(0.50%)#17 |
| 18. | Pembroke Pines | 465 | 16,570(2.81%)#3 | 95,844(0.49%)#18 |
| 19. | Dallas | 458 | 6,336(7.23%)#3 | 95,844(0.48%)#19 |
| 20. | Washington | 458 | 458(100.00%)#1 | 95,844(0.48%)#20 |
| 21. | Northwest Harbor | 456 | 7,345(6.21%)#3 | 95,844(0.48%)#21 |
| 22. | Jacksonville | 442 | 16,570(2.67%)#4 | 95,844(0.46%)#22 |
| 23. | Charlotte | 437 | 3,066(14.25%)#1 | 95,844(0.46%)#23 |
| 24. | North Bethesda | 434 | 2,452(17.70%)#1 | 95,844(0.45%)#24 |
| 25. | Austin | 430 | 6,336(6.79%)#4 | 95,844(0.45%)#25 |
| 26. | Chandler | 409 | 1,454(28.13%)#1 | 95,844(0.43%)#26 |
| 27. | Kenwood | 395 | 1,360(29.04%)#1 | 95,844(0.41%)#27 |
| 28. | Lincolnton | 362 | 3,066(11.81%)#2 | 95,844(0.38%)#28 |
| 29. | Newark | 349 | 14,848(2.35%)#6 | 95,844(0.36%)#29 |
| 30. | Weston | 340 | 16,570(2.05%)#5 | 95,844(0.35%)#30 |
| 31. | Frederick | 334 | 2,452(13.62%)#2 | 95,844(0.35%)#31 |
| 32. | San Antonio | 319 | 6,336(5.03%)#5 | 95,844(0.33%)#32 |
| 33. | Phoenix | 307 | 1,454(21.11%)#2 | 95,844(0.32%)#33 |
| 34. | Irvine | 302 | 12,623(2.39%)#2 | 95,844(0.32%)#34 |
| 35. | Rogers | 300 | 664(45.18%)#1 | 95,844(0.31%)#35 |
| 36. | Sacramento | 292 | 12,623(2.31%)#3 | 95,844(0.30%)#36 |
| 37. | Arlington | 289 | 1,859(15.55%)#1 | 95,844(0.30%)#37 |
| 38. | Hacienda Heights | 283 | 12,623(2.24%)#4 | 95,844(0.30%)#38 |
| 39. | Morristown | 263 | 14,848(1.77%)#7 | 95,844(0.27%)#39 |
| 40. | Linden | 254 | 14,848(1.71%)#8 | 95,844(0.27%)#40 |
| 41. | Miami Beach | 252 | 16,570(1.52%)#6 | 95,844(0.26%)#41 |
| 42. | San Francisco | 249 | 12,623(1.97%)#5 | 95,844(0.26%)#42 |
| 43. | Boca Raton | 249 | 16,570(1.50%)#7 | 95,844(0.26%)#43 |
| 44. | Hollywood | 243 | 16,570(1.47%)#8 | 95,844(0.25%)#44 |
| 45. | Merced | 241 | 12,623(1.91%)#6 | 95,844(0.25%)#45 |
| 46. | Raritan Borough | 241 | 14,848(1.62%)#9 | 95,844(0.25%)#46 |
| 47. | Hialeah | 235 | 16,570(1.42%)#9 | 95,844(0.25%)#47 |
| 48. | Tampa | 234 | 16,570(1.41%)#10 | 95,844(0.24%)#48 |
| 49. | Tracy | 233 | 12,623(1.85%)#7 | 95,844(0.24%)#49 |
| 50. | Las Vegas | 229 | 1,328(17.24%)#1 | 95,844(0.24%)#50 |
| 51. | Fort Worth | 228 | 6,336(3.60%)#6 | 95,844(0.24%)#51 |
| 52. | Danbury | 224 | 2,715(8.25%)#3 | 95,844(0.23%)#52 |
| 53. | North Plainfield Borough | 224 | 14,848(1.51%)#10 | 95,844(0.23%)#53 |
| 54. | Durham | 222 | 3,066(7.24%)#3 | 95,844(0.23%)#54 |
| 55. | Enterprise | 218 | 1,328(16.42%)#2 | 95,844(0.23%)#55 |
| 56. | Pearland | 213 | 6,336(3.36%)#7 | 95,844(0.22%)#56 |
| 57. | Eugene | 212 | 927(22.87%)#1 | 95,844(0.22%)#57 |
| 58. | Toms River | 209 | 14,848(1.41%)#11 | 95,844(0.22%)#58 |
| 59. | Deerfield Beach | 209 | 16,570(1.26%)#11 | 95,844(0.22%)#59 |
| 60. | Hillsborough | 203 | 14,848(1.37%)#12 | 95,844(0.21%)#60 |
| 61. | Bonita Springs | 202 | 16,570(1.22%)#12 | 95,844(0.21%)#61 |
| 62. | Hackettstown | 201 | 14,848(1.35%)#13 | 95,844(0.21%)#62 |
| 63. | Conover | 201 | 3,066(6.56%)#4 | 95,844(0.21%)#63 |
| 64. | San Diego | 199 | 12,623(1.58%)#8 | 95,844(0.21%)#64 |
| 65. | Long Beach | 197 | 12,623(1.56%)#9 | 95,844(0.21%)#65 |
| 66. | Meadow Woods | 196 | 16,570(1.18%)#13 | 95,844(0.20%)#66 |
| 67. | Seattle | 194 | 1,357(14.30%)#1 | 95,844(0.20%)#67 |
| 68. | Palm Bay | 194 | 16,570(1.17%)#14 | 95,844(0.20%)#68 |
| 69. | Riverside | 193 | 12,623(1.53%)#10 | 95,844(0.20%)#69 |
| 70. | Nashville | 192 | 928(20.69%)#1 | 95,844(0.20%)#70 |
| 71. | Alexandria | 191 | 1,859(10.27%)#2 | 95,844(0.20%)#71 |
| 72. | Hillsboro | 186 | 927(20.06%)#2 | 95,844(0.19%)#72 |
| 73. | West Puente Valley | 186 | 12,623(1.47%)#11 | 95,844(0.19%)#73 |
| 74. | North Miami Beach | 179 | 16,570(1.08%)#15 | 95,844(0.19%)#74 |
| 75. | Peachtree Corners | 178 | 3,088(5.76%)#1 | 95,844(0.19%)#75 |
| 76. | Dundee | 177 | 16,570(1.07%)#16 | 95,844(0.18%)#76 |
| 77. | Victorville | 175 | 12,623(1.39%)#12 | 95,844(0.18%)#77 |
| 78. | Leisure City | 175 | 16,570(1.06%)#17 | 95,844(0.18%)#78 |
| 79. | Vadnais Heights | 174 | 652(26.69%)#1 | 95,844(0.18%)#79 |
| 80. | Miramar | 172 | 16,570(1.04%)#18 | 95,844(0.18%)#80 |
| 81. | Anaheim | 171 | 12,623(1.35%)#13 | 95,844(0.18%)#81 |
| 82. | Sparks | 171 | 1,328(12.88%)#3 | 95,844(0.18%)#82 |
| 83. | Downey | 168 | 12,623(1.33%)#14 | 95,844(0.18%)#83 |
| 84. | Margate | 165 | 16,570(1.00%)#19 | 95,844(0.17%)#84 |
| 85. | San Jose | 161 | 12,623(1.28%)#15 | 95,844(0.17%)#85 |
| 86. | Mission Bend | 161 | 6,336(2.54%)#8 | 95,844(0.17%)#86 |
| 87. | Belmar Borough | 160 | 14,848(1.08%)#14 | 95,844(0.17%)#87 |
| 88. | Cape Coral | 158 | 16,570(0.95%)#20 | 95,844(0.16%)#88 |
| 89. | Country Club | 157 | 16,570(0.95%)#21 | 95,844(0.16%)#89 |
| 90. | Buenaventura Lakes | 157 | 16,570(0.95%)#22 | 95,844(0.16%)#90 |
| 91. | Hesperia | 156 | 12,623(1.24%)#16 | 95,844(0.16%)#91 |
| 92. | Somerville Borough | 154 | 14,848(1.04%)#15 | 95,844(0.16%)#92 |
| 93. | Quincy | 153 | 2,160(7.08%)#2 | 95,844(0.16%)#93 |
| 94. | Elgin | 151 | 1,305(11.57%)#2 | 95,844(0.16%)#94 |
| 95. | Upland | 149 | 12,623(1.18%)#17 | 95,844(0.16%)#95 |
| 96. | Doral | 149 | 16,570(0.90%)#23 | 95,844(0.16%)#96 |
| 97. | Freeport | 147 | 7,345(2.00%)#4 | 95,844(0.15%)#97 |
| 98. | Garfield | 146 | 14,848(0.98%)#16 | 95,844(0.15%)#98 |
| 99. | Gonzalez | 145 | 16,570(0.88%)#24 | 95,844(0.15%)#99 |
| 100. | Coral Gables | 144 | 16,570(0.87%)#25 | 95,844(0.15%)#100 |
Common Questions
What are the Top 10 Cities with the Most Immigrants from Costa Rica in the United States?
Top 10 Cities with the Most Immigrants from Costa Rica in the United States are:
What city has the Most Immigrants from Costa Rica in the United States?
New York has the Most Immigrants from Costa Rica in the United States with 4,059.
What is the Total Immigrants from Costa Rica in the United States?
Total Immigrants from Costa Rica in the United States is 95,844.