Cities with the Highest Percentage of Mongolian Population in the United States
RELATED REPORTS & OPTIONS
Mongolian
United States
Compare Cities
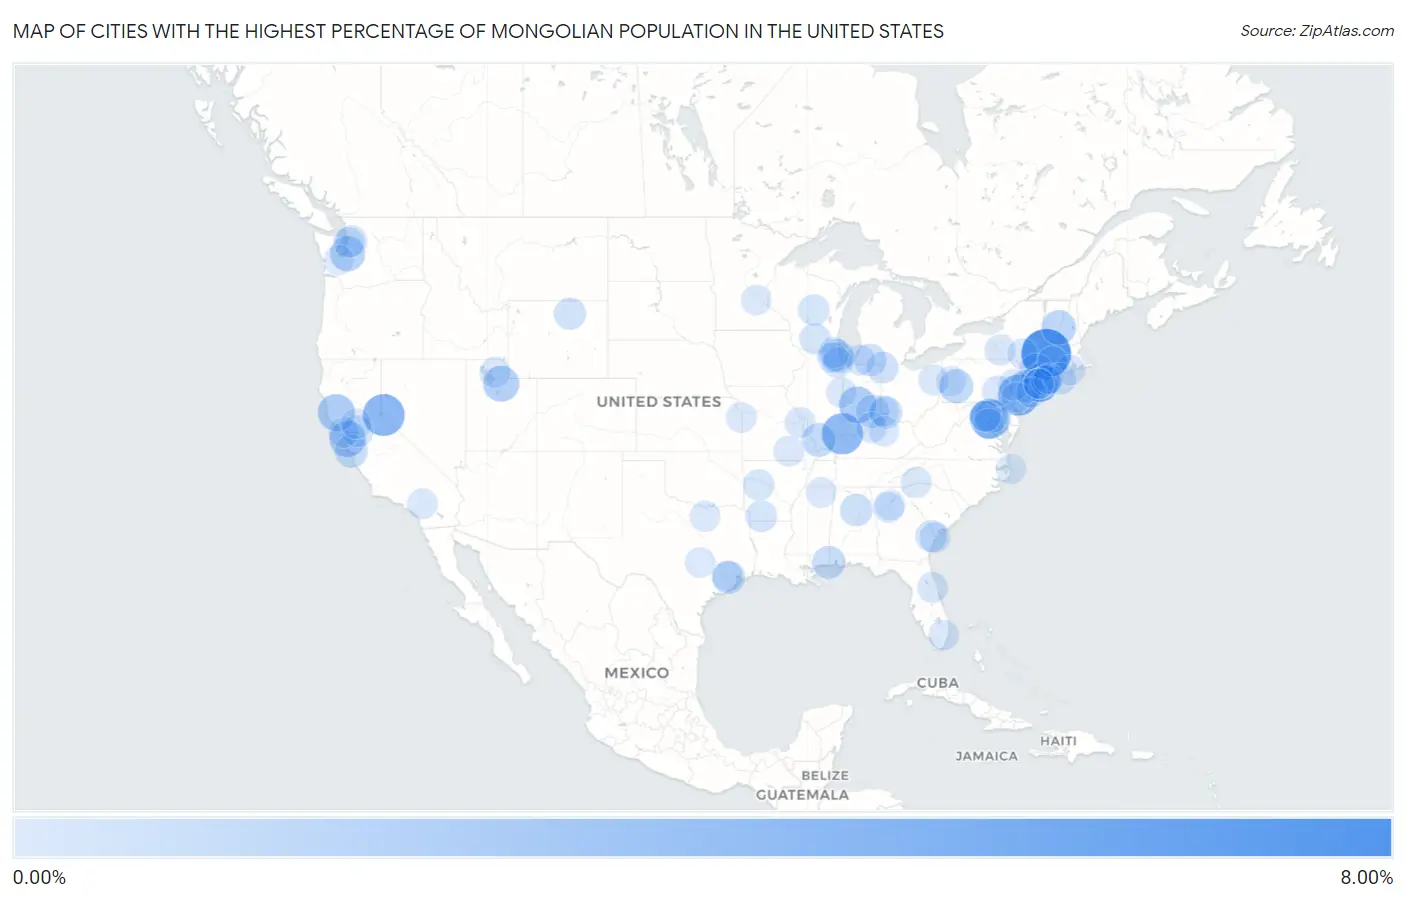
Map of Cities with the Highest Percentage of Mongolian Population in the United States
0.00%
8.00%
Cities with the Highest Percentage of Mongolian Population in the United States
| City | Mongolian | vs State | vs National | |
| 1. | Lee | 6.70% | 0.017%(+6.69)#1 | 0.012%(+6.69)#1 |
| 2. | Genoa | 4.05% | 0.010%(+4.04)#1 | 0.012%(+4.04)#2 |
| 3. | Arcadia University | 3.87% | 0.0090%(+3.86)#1 | 0.012%(+3.86)#3 |
| 4. | Melody Hill | 3.86% | 0.014%(+3.84)#1 | 0.012%(+3.85)#4 |
| 5. | North Springfield | 3.43% | 0.016%(+3.41)#1 | 0.012%(+3.42)#5 |
| 6. | Greenvale | 3.01% | 0.026%(+2.98)#1 | 0.012%(+3.00)#6 |
| 7. | Talmage | 2.42% | 0.017%(+2.41)#1 | 0.012%(+2.41)#7 |
| 8. | Monrovia | 2.41% | 0.014%(+2.40)#2 | 0.012%(+2.40)#8 |
| 9. | Brisbane | 2.25% | 0.017%(+2.23)#2 | 0.012%(+2.24)#9 |
| 10. | Silver Summit | 2.11% | 0.013%(+2.10)#1 | 0.012%(+2.10)#10 |
| 11. | Fife Heights | 1.84% | 0.018%(+1.83)#1 | 0.012%(+1.83)#11 |
| 12. | White River Junction | 1.66% | 0.0084%(+1.65)#1 | 0.012%(+1.65)#12 |
| 13. | Fox Chapel Borough | 1.60% | 0.0090%(+1.60)#2 | 0.012%(+1.59)#13 |
| 14. | Hewlett | 1.57% | 0.026%(+1.54)#2 | 0.012%(+1.56)#14 |
| 15. | North Vandergrift | 1.47% | 0.0090%(+1.46)#3 | 0.012%(+1.45)#15 |
| 16. | Makanda | 1.40% | 0.013%(+1.39)#1 | 0.012%(+1.39)#16 |
| 17. | Mineral Springs | 1.36% | 0.014%(+1.35)#3 | 0.012%(+1.35)#17 |
| 18. | Sienna | 1.29% | 0.014%(+1.28)#1 | 0.012%(+1.28)#18 |
| 19. | Friendship Heights Village | 1.27% | 0.012%(+1.26)#1 | 0.012%(+1.26)#19 |
| 20. | Nelsonville | 1.19% | 0.026%(+1.16)#3 | 0.012%(+1.18)#20 |
| 21. | Helena | 1.16% | 0.0065%(+1.15)#1 | 0.012%(+1.14)#21 |
| 22. | Green Knoll | 1.13% | 0.0087%(+1.12)#1 | 0.012%(+1.12)#22 |
| 23. | Stafford | 1.13% | 0.014%(+1.11)#2 | 0.012%(+1.11)#23 |
| 24. | Millhousen | 1.12% | 0.014%(+1.11)#4 | 0.012%(+1.11)#24 |
| 25. | Felton | 1.11% | 0.017%(+1.09)#3 | 0.012%(+1.10)#25 |
| 26. | Highlands | 0.99% | 0.017%(+0.972)#4 | 0.012%(+0.977)#26 |
| 27. | Three Rivers | 0.96% | 0.0068%(+0.952)#1 | 0.012%(+0.948)#27 |
| 28. | Trussville | 0.95% | 0.0087%(+0.940)#1 | 0.012%(+0.937)#28 |
| 29. | Lincolnshire | 0.90% | 0.013%(+0.885)#2 | 0.012%(+0.886)#29 |
| 30. | Golf Manor | 0.87% | 0.0071%(+0.865)#1 | 0.012%(+0.860)#30 |
| 31. | Buffalo | 0.83% | 0.014%(+0.812)#1 | 0.012%(+0.815)#31 |
| 32. | Edon | 0.78% | 0.0071%(+0.769)#2 | 0.012%(+0.764)#32 |
| 33. | Cathcart | 0.76% | 0.018%(+0.742)#2 | 0.012%(+0.748)#33 |
| 34. | Bloomingdale | 0.75% | 0.0089%(+0.741)#1 | 0.012%(+0.738)#34 |
| 35. | Isleton | 0.74% | 0.017%(+0.726)#5 | 0.012%(+0.732)#35 |
| 36. | Hamilton College | 0.73% | 0.026%(+0.708)#4 | 0.012%(+0.723)#36 |
| 37. | Northwest Harbor | 0.71% | 0.026%(+0.686)#5 | 0.012%(+0.701)#37 |
| 38. | Mcnair | 0.69% | 0.016%(+0.678)#2 | 0.012%(+0.682)#38 |
| 39. | Magnolia | 0.68% | 0.0058%(+0.673)#1 | 0.012%(+0.667)#39 |
| 40. | Goose Creek | 0.64% | 0.016%(+0.627)#3 | 0.012%(+0.632)#40 |
| 41. | Park Ridge | 0.63% | 0.019%(+0.607)#1 | 0.012%(+0.615)#41 |
| 42. | Shorewood Hills | 0.58% | 0.019%(+0.557)#2 | 0.012%(+0.564)#42 |
| 43. | Nazareth College | 0.57% | 0.026%(+0.543)#6 | 0.012%(+0.558)#43 |
| 44. | Northfield | 0.56% | 0.013%(+0.547)#3 | 0.012%(+0.549)#44 |
| 45. | Spout Springs | 0.56% | 0.0059%(+0.553)#1 | 0.012%(+0.547)#45 |
| 46. | Belleville | 0.55% | 0.0058%(+0.549)#2 | 0.012%(+0.543)#46 |
| 47. | Coldstream | 0.51% | 0.0047%(+0.505)#1 | 0.012%(+0.498)#47 |
| 48. | White Oak | 0.50% | 0.0071%(+0.490)#3 | 0.012%(+0.486)#48 |
| 49. | Cookstown | 0.49% | 0.0087%(+0.484)#2 | 0.012%(+0.481)#49 |
| 50. | Camp Pendleton Mainside | 0.49% | 0.017%(+0.473)#6 | 0.012%(+0.478)#50 |
| 51. | Saluda | 0.49% | 0.0059%(+0.480)#2 | 0.012%(+0.475)#51 |
| 52. | Whitemarsh Island | 0.49% | 0.0089%(+0.477)#2 | 0.012%(+0.474)#52 |
| 53. | Hershey | 0.48% | 0.0090%(+0.475)#4 | 0.012%(+0.472)#53 |
| 54. | Fullerton | 0.48% | 0.0090%(+0.468)#5 | 0.012%(+0.465)#54 |
| 55. | Round Lake | 0.48% | 0.013%(+0.463)#4 | 0.012%(+0.465)#55 |
| 56. | Manchester | 0.47% | 0.0085%(+0.463)#1 | 0.012%(+0.460)#56 |
| 57. | Cayuga Heights | 0.47% | 0.026%(+0.443)#7 | 0.012%(+0.458)#57 |
| 58. | Brier | 0.46% | 0.018%(+0.441)#3 | 0.012%(+0.447)#58 |
| 59. | Lake Helen | 0.46% | 0.0060%(+0.452)#1 | 0.012%(+0.447)#59 |
| 60. | Loudoun Valley Estates | 0.46% | 0.016%(+0.440)#4 | 0.012%(+0.445)#60 |
| 61. | North Ogden | 0.45% | 0.013%(+0.438)#2 | 0.012%(+0.439)#61 |
| 62. | Meadows Place | 0.45% | 0.014%(+0.431)#3 | 0.012%(+0.433)#62 |
| 63. | La Grange Park | 0.44% | 0.013%(+0.429)#5 | 0.012%(+0.431)#63 |
| 64. | Alliance | 0.42% | 0.0071%(+0.410)#4 | 0.012%(+0.405)#64 |
| 65. | Berrien Springs | 0.40% | 0.0068%(+0.389)#2 | 0.012%(+0.384)#65 |
| 66. | Lucas Valley Marinwood | 0.39% | 0.017%(+0.378)#7 | 0.012%(+0.383)#66 |
| 67. | Leawood | 0.39% | 0.017%(+0.370)#1 | 0.012%(+0.376)#67 |
| 68. | Yucaipa | 0.39% | 0.017%(+0.371)#8 | 0.012%(+0.376)#68 |
| 69. | Cedar Knolls | 0.38% | 0.0087%(+0.374)#3 | 0.012%(+0.371)#69 |
| 70. | East Dundee | 0.38% | 0.013%(+0.367)#6 | 0.012%(+0.368)#70 |
| 71. | Krum | 0.37% | 0.014%(+0.359)#4 | 0.012%(+0.361)#71 |
| 72. | North Decatur | 0.37% | 0.0089%(+0.364)#3 | 0.012%(+0.361)#72 |
| 73. | Winona | 0.37% | 0.0085%(+0.362)#2 | 0.012%(+0.359)#73 |
| 74. | Quantico | 0.37% | 0.016%(+0.352)#5 | 0.012%(+0.357)#74 |
| 75. | Kingston | 0.37% | 0.0094%(+0.356)#1 | 0.012%(+0.354)#75 |
| 76. | University Of California Davis | 0.36% | 0.017%(+0.348)#9 | 0.012%(+0.353)#76 |
| 77. | Blue Mountain | 0.36% | 0.0065%(+0.357)#2 | 0.012%(+0.352)#77 |
| 78. | Fort Lee Borough | 0.36% | 0.0087%(+0.348)#4 | 0.012%(+0.345)#78 |
| 79. | Southwest Ranches | 0.36% | 0.0060%(+0.350)#2 | 0.012%(+0.344)#79 |
| 80. | Delhi | 0.35% | 0.026%(+0.323)#8 | 0.012%(+0.338)#80 |
| 81. | Bala Cynwyd | 0.34% | 0.0090%(+0.335)#6 | 0.012%(+0.332)#81 |
| 82. | Midway | 0.34% | 0.0047%(+0.339)#2 | 0.012%(+0.332)#82 |
| 83. | Hutto | 0.34% | 0.014%(+0.328)#5 | 0.012%(+0.331)#83 |
| 84. | Haverford College | 0.34% | 0.0090%(+0.333)#7 | 0.012%(+0.330)#84 |
| 85. | Medina | 0.34% | 0.0098%(+0.331)#1 | 0.012%(+0.329)#85 |
| 86. | Bismarck | 0.34% | 0.013%(+0.325)#7 | 0.012%(+0.327)#86 |
| 87. | Hauppauge | 0.33% | 0.026%(+0.307)#9 | 0.012%(+0.322)#87 |
| 88. | Nissequogue | 0.33% | 0.026%(+0.302)#10 | 0.012%(+0.317)#88 |
| 89. | Trumbauersville Borough | 0.32% | 0.0090%(+0.316)#8 | 0.012%(+0.313)#89 |
| 90. | Butler | 0.31% | 0.0090%(+0.305)#9 | 0.012%(+0.302)#90 |
| 91. | Floral Park | 0.31% | 0.026%(+0.282)#11 | 0.012%(+0.297)#91 |
| 92. | Norcross | 0.31% | 0.0089%(+0.299)#4 | 0.012%(+0.296)#92 |
| 93. | Beachwood Borough | 0.30% | 0.0087%(+0.293)#5 | 0.012%(+0.290)#93 |
| 94. | Kill Devil Hills | 0.30% | 0.0059%(+0.294)#3 | 0.012%(+0.289)#94 |
| 95. | West Freehold | 0.30% | 0.0087%(+0.289)#6 | 0.012%(+0.286)#95 |
| 96. | Simsbury Center | 0.29% | 0.015%(+0.280)#1 | 0.012%(+0.283)#96 |
| 97. | Tumwater | 0.29% | 0.018%(+0.275)#4 | 0.012%(+0.281)#97 |
| 98. | North Valley Stream | 0.29% | 0.026%(+0.263)#12 | 0.012%(+0.278)#98 |
| 99. | Port Jefferson | 0.29% | 0.026%(+0.261)#13 | 0.012%(+0.276)#99 |
| 100. | Boswell Borough | 0.28% | 0.0090%(+0.274)#10 | 0.012%(+0.272)#100 |
Common Questions
What are the Top 10 Cities with the Highest Percentage of Mongolian Population in the United States?
Top 10 Cities with the Highest Percentage of Mongolian Population in the United States are:
#1
6.70%
#2
4.05%
#3
3.87%
#4
3.86%
#5
3.43%
#6
3.01%
#7
2.42%
#8
2.41%
#9
2.25%
#10
2.11%
What city has the Highest Percentage of Mongolian Population in the United States?
Lee has the Highest Percentage of Mongolian Population in the United States with 6.70%.
What is the Percentage of Mongolian Population in the United States?
Percentage of Mongolian Population in the United States is 0.012%.