Darlington County, SC Map & Demographics
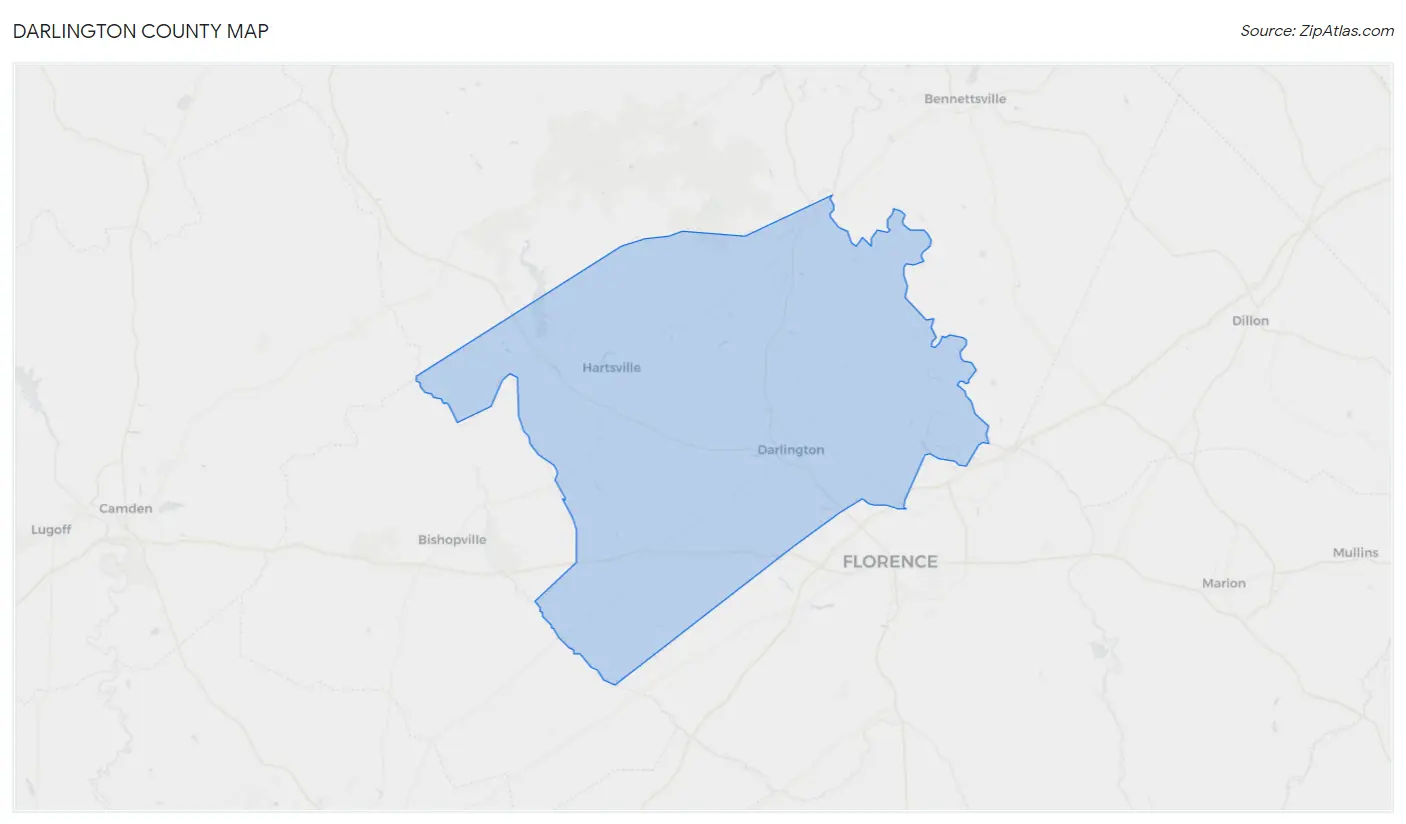
Darlington County Map
Darlington County Overview
$28,821
PER CAPITA INCOME
$59,939
AVG FAMILY INCOME
$44,317
AVG HOUSEHOLD INCOME
34.9%
WAGE / INCOME GAP [ % ]
65.1¢/ $1
WAGE / INCOME GAP [ $ ]
$11,051
FAMILY INCOME DEFICIT
0.50
INEQUALITY / GINI INDEX
63,025
TOTAL POPULATION
30,142
MALE POPULATION
32,883
FEMALE POPULATION
91.66
MALES / 100 FEMALES
109.09
FEMALES / 100 MALES
41.4
MEDIAN AGE
3.2
AVG FAMILY SIZE
2.5
AVG HOUSEHOLD SIZE
28,214
LABOR FORCE [ PEOPLE ]
55.6%
PERCENT IN LABOR FORCE
6.5%
UNEMPLOYMENT RATE
Darlington County Area Codes
Income in Darlington County
Income Overview in Darlington County
Per Capita Income in Darlington County is $28,821, while median incomes of families and households are $59,939 and $44,317 respectively.
| Characteristic | Number | Measure |
| Per Capita Income | 63,025 | $28,821 |
| Median Family Income | 15,712 | $59,939 |
| Mean Family Income | 15,712 | $85,868 |
| Median Household Income | 25,022 | $44,317 |
| Mean Household Income | 25,022 | $69,693 |
| Income Deficit | 15,712 | $11,051 |
| Wage / Income Gap (%) | 63,025 | 34.87% |
| Wage / Income Gap ($) | 63,025 | 65.13¢ per $1 |
| Gini / Inequality Index | 63,025 | 0.50 |
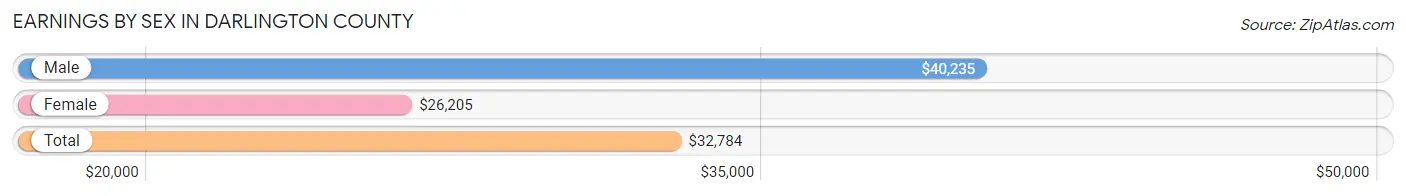
Earnings by Sex in Darlington County
Average Earnings in Darlington County are $32,784, $40,235 for men and $26,205 for women, a difference of 34.9%.
| Sex | Number | Average Earnings |
| Male | 13,876 (48.0%) | $40,235 |
| Female | 15,004 (51.9%) | $26,205 |
| Total | 28,880 (100.0%) | $32,784 |
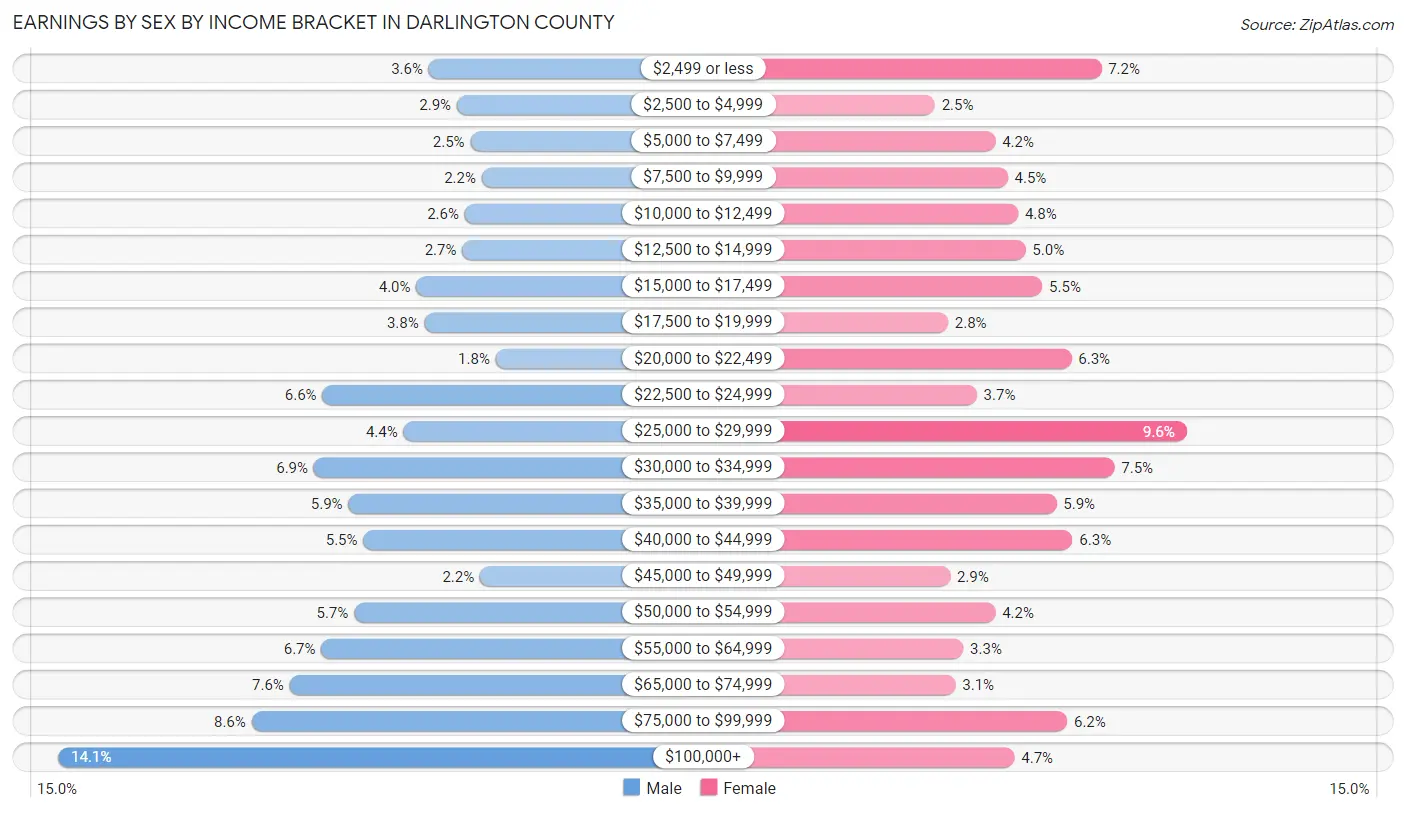
Earnings by Sex by Income Bracket in Darlington County
The most common earnings brackets in Darlington County are $100,000+ for men (1,951 | 14.1%) and $25,000 to $29,999 for women (1,433 | 9.6%).
| Income | Male | Female |
| $2,499 or less | 505 (3.6%) | 1,073 (7.1%) |
| $2,500 to $4,999 | 395 (2.9%) | 370 (2.5%) |
| $5,000 to $7,499 | 343 (2.5%) | 626 (4.2%) |
| $7,500 to $9,999 | 299 (2.1%) | 678 (4.5%) |
| $10,000 to $12,499 | 365 (2.6%) | 721 (4.8%) |
| $12,500 to $14,999 | 375 (2.7%) | 753 (5.0%) |
| $15,000 to $17,499 | 553 (4.0%) | 823 (5.5%) |
| $17,500 to $19,999 | 522 (3.8%) | 426 (2.8%) |
| $20,000 to $22,499 | 244 (1.8%) | 947 (6.3%) |
| $22,500 to $24,999 | 920 (6.6%) | 547 (3.6%) |
| $25,000 to $29,999 | 604 (4.3%) | 1,433 (9.6%) |
| $30,000 to $34,999 | 953 (6.9%) | 1,129 (7.5%) |
| $35,000 to $39,999 | 819 (5.9%) | 883 (5.9%) |
| $40,000 to $44,999 | 760 (5.5%) | 951 (6.3%) |
| $45,000 to $49,999 | 305 (2.2%) | 435 (2.9%) |
| $50,000 to $54,999 | 796 (5.7%) | 625 (4.2%) |
| $55,000 to $64,999 | 924 (6.7%) | 490 (3.3%) |
| $65,000 to $74,999 | 1,047 (7.5%) | 458 (3.0%) |
| $75,000 to $99,999 | 1,196 (8.6%) | 929 (6.2%) |
| $100,000+ | 1,951 (14.1%) | 707 (4.7%) |
| Total | 13,876 (100.0%) | 15,004 (100.0%) |
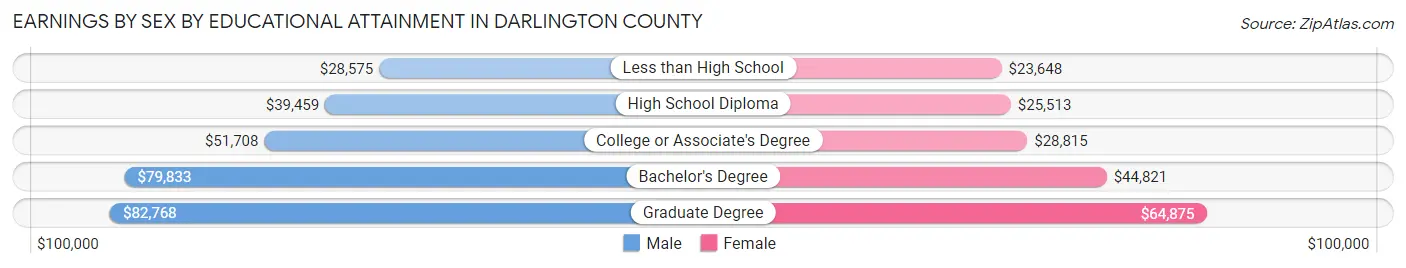
Earnings by Sex by Educational Attainment in Darlington County
Average earnings in Darlington County are $47,269 for men and $30,935 for women, a difference of 34.6%. Men with an educational attainment of graduate degree enjoy the highest average annual earnings of $82,768, while those with less than high school education earn the least with $28,575. Women with an educational attainment of graduate degree earn the most with the average annual earnings of $64,875, while those with less than high school education have the smallest earnings of $23,648.
| Educational Attainment | Male Income | Female Income |
| Less than High School | $28,575 | $23,648 |
| High School Diploma | $39,459 | $25,513 |
| College or Associate's Degree | $51,708 | $28,815 |
| Bachelor's Degree | $79,833 | $44,821 |
| Graduate Degree | $82,768 | $64,875 |
| Total | $47,269 | $30,935 |
Family Income in Darlington County
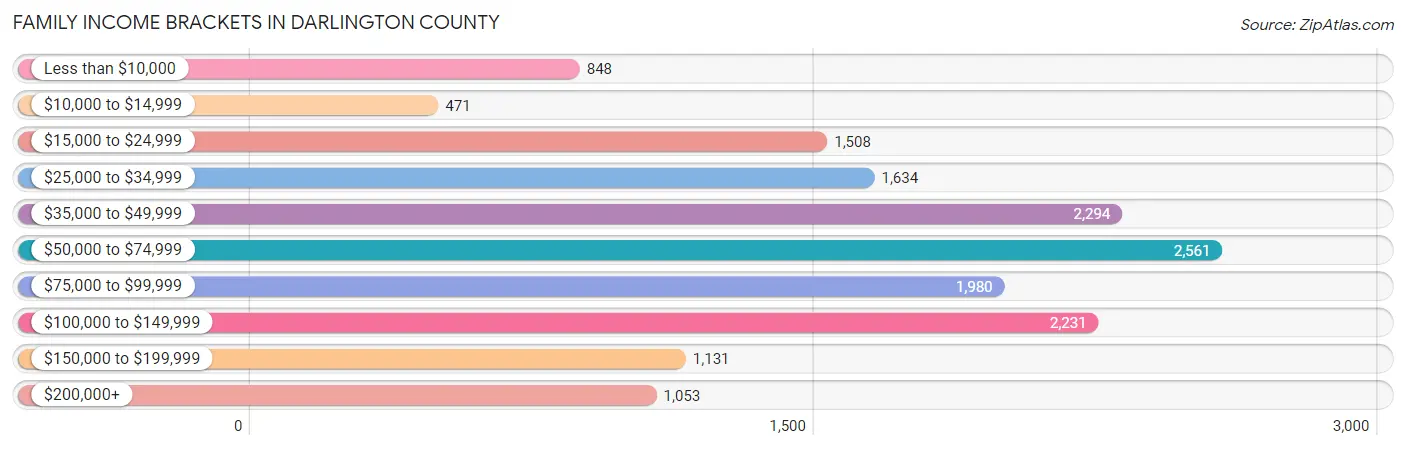
Family Income Brackets in Darlington County
According to the Darlington County family income data, there are 2,561 families falling into the $50,000 to $74,999 income range, which is the most common income bracket and makes up 16.3% of all families. Conversely, the $10,000 to $14,999 income bracket is the least frequent group with only 471 families (3.0%) belonging to this category.
| Income Bracket | # Families | % Families |
| Less than $10,000 | 848 | 5.4% |
| $10,000 to $14,999 | 471 | 3.0% |
| $15,000 to $24,999 | 1,508 | 9.6% |
| $25,000 to $34,999 | 1,634 | 10.4% |
| $35,000 to $49,999 | 2,294 | 14.6% |
| $50,000 to $74,999 | 2,561 | 16.3% |
| $75,000 to $99,999 | 1,980 | 12.6% |
| $100,000 to $149,999 | 2,231 | 14.2% |
| $150,000 to $199,999 | 1,131 | 7.2% |
| $200,000+ | 1,053 | 6.7% |
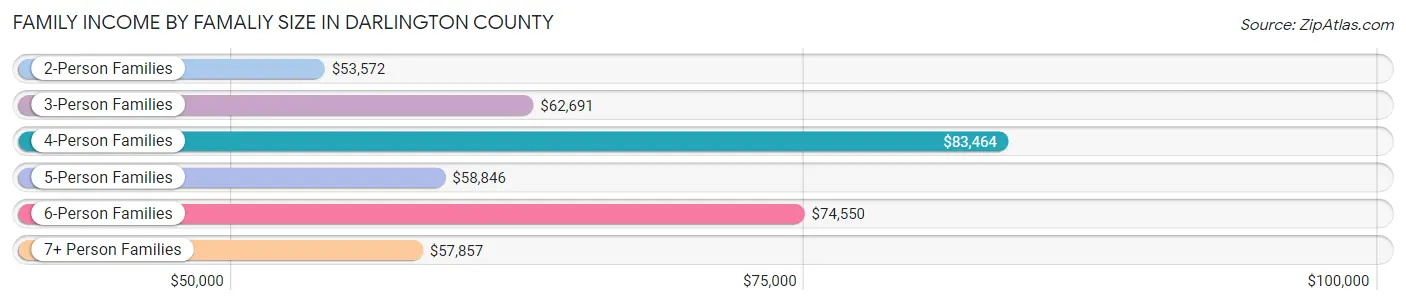
Family Income by Famaliy Size in Darlington County
4-person families (2,511 | 16.0%) account for the highest median family income in Darlington County with $83,464 per family, while 2-person families (7,771 | 49.5%) have the highest median income of $26,786 per family member.
| Income Bracket | # Families | Median Income |
| 2-Person Families | 7,771 (49.5%) | $53,572 |
| 3-Person Families | 3,785 (24.1%) | $62,691 |
| 4-Person Families | 2,511 (16.0%) | $83,464 |
| 5-Person Families | 826 (5.3%) | $58,846 |
| 6-Person Families | 553 (3.5%) | $74,550 |
| 7+ Person Families | 266 (1.7%) | $57,857 |
| Total | 15,712 (100.0%) | $59,939 |
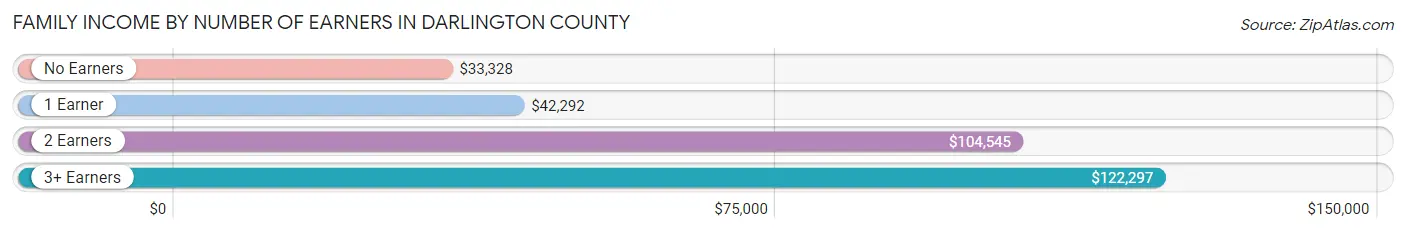
Family Income by Number of Earners in Darlington County
The median family income in Darlington County is $59,939, with families comprising 3+ earners (1,249) having the highest median family income of $122,297, while families with no earners (3,335) have the lowest median family income of $33,328, accounting for 8.0% and 21.2% of families, respectively.
| Number of Earners | # Families | Median Income |
| No Earners | 3,335 (21.2%) | $33,328 |
| 1 Earner | 5,830 (37.1%) | $42,292 |
| 2 Earners | 5,298 (33.7%) | $104,545 |
| 3+ Earners | 1,249 (8.0%) | $122,297 |
| Total | 15,712 (100.0%) | $59,939 |
Household Income in Darlington County
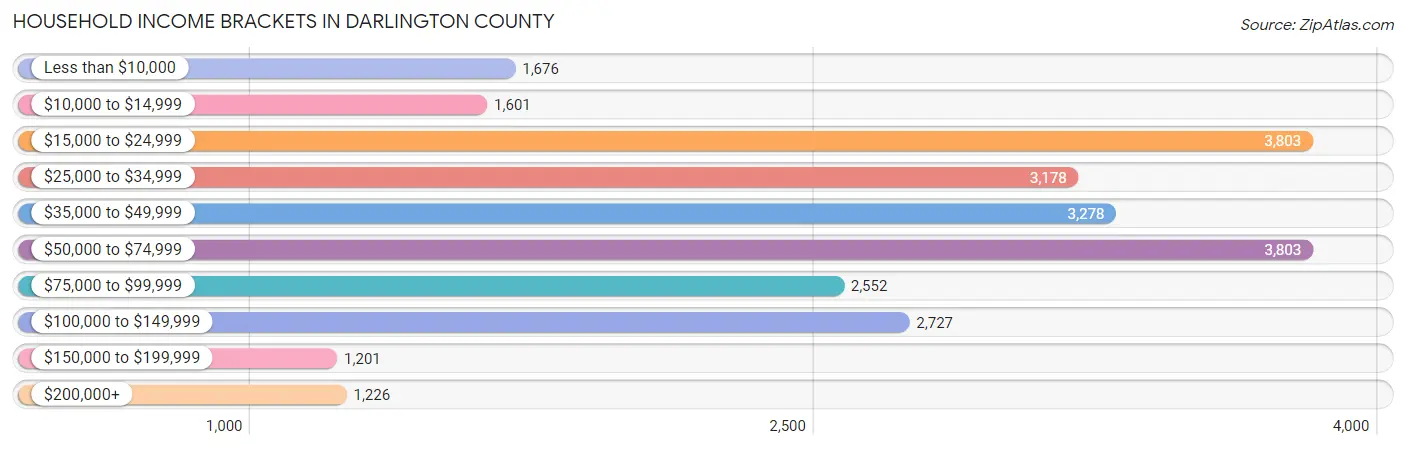
Household Income Brackets in Darlington County
With 3,803 households falling in the category, the $15,000 to $24,999 income range is the most frequent in Darlington County, accounting for 15.2% of all households. In contrast, only 1,201 households (4.8%) fall into the $150,000 to $199,999 income bracket, making it the least populous group.
| Income Bracket | # Households | % Households |
| Less than $10,000 | 1,676 | 6.7% |
| $10,000 to $14,999 | 1,601 | 6.4% |
| $15,000 to $24,999 | 3,803 | 15.2% |
| $25,000 to $34,999 | 3,178 | 12.7% |
| $35,000 to $49,999 | 3,278 | 13.1% |
| $50,000 to $74,999 | 3,803 | 15.2% |
| $75,000 to $99,999 | 2,552 | 10.2% |
| $100,000 to $149,999 | 2,727 | 10.9% |
| $150,000 to $199,999 | 1,201 | 4.8% |
| $200,000+ | 1,226 | 4.9% |
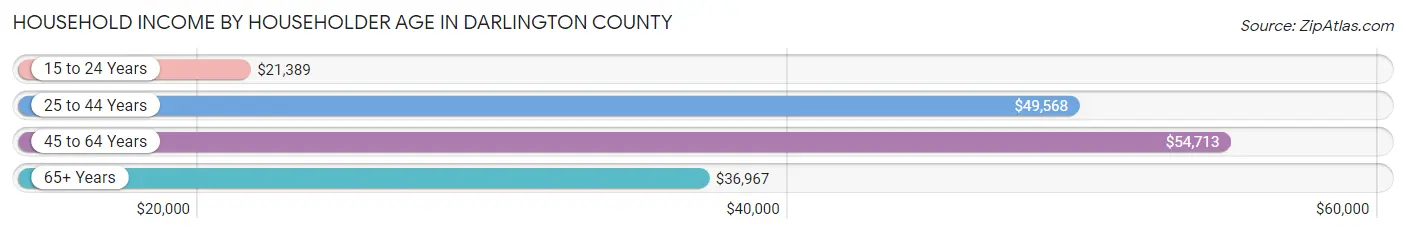
Household Income by Householder Age in Darlington County
The median household income in Darlington County is $44,317, with the highest median household income of $54,713 found in the 45 to 64 years age bracket for the primary householder. A total of 9,866 households (39.4%) fall into this category. Meanwhile, the 15 to 24 years age bracket for the primary householder has the lowest median household income of $21,389, with 480 households (1.9%) in this group.
| Income Bracket | # Households | Median Income |
| 15 to 24 Years | 480 (1.9%) | $21,389 |
| 25 to 44 Years | 6,716 (26.8%) | $49,568 |
| 45 to 64 Years | 9,866 (39.4%) | $54,713 |
| 65+ Years | 7,960 (31.8%) | $36,967 |
| Total | 25,022 (100.0%) | $44,317 |
Poverty in Darlington County
Income Below Poverty by Sex and Age in Darlington County
With 18.2% poverty level for males and 22.1% for females among the residents of Darlington County, 12 to 14 year old males and 5 year old females are the most vulnerable to poverty, with 450 males (37.3%) and 148 females (69.8%) in their respective age groups living below the poverty level.
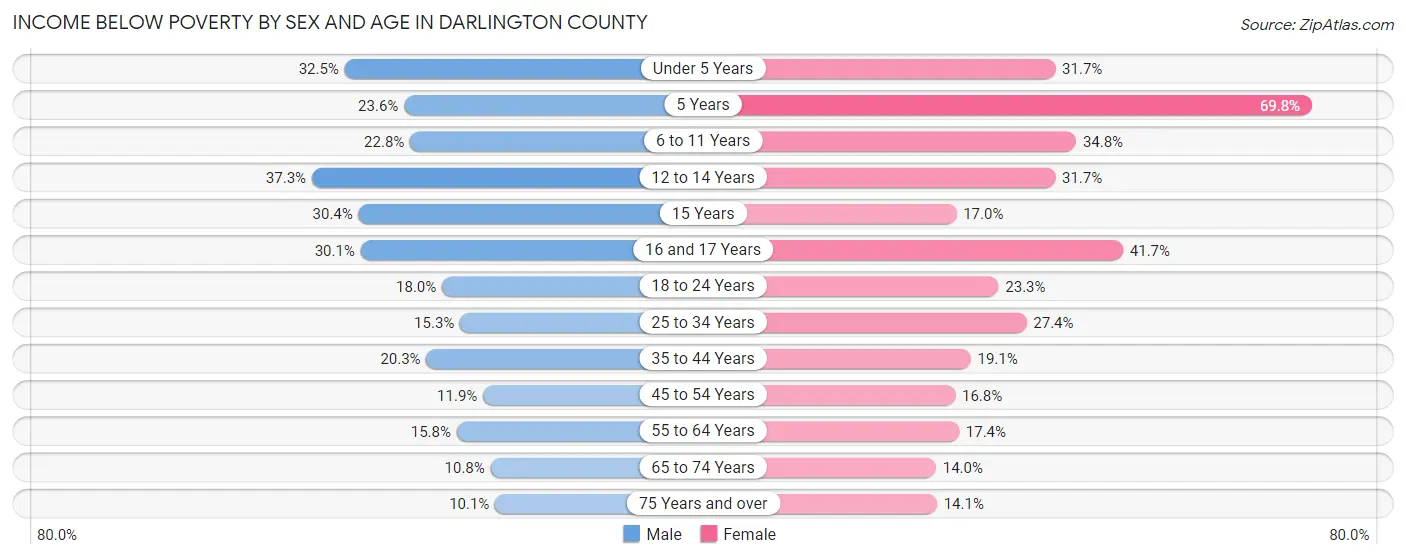
| Age Bracket | Male | Female |
| Under 5 Years | 589 (32.5%) | 525 (31.7%) |
| 5 Years | 78 (23.6%) | 148 (69.8%) |
| 6 to 11 Years | 570 (22.8%) | 878 (34.8%) |
| 12 to 14 Years | 450 (37.3%) | 324 (31.7%) |
| 15 Years | 145 (30.4%) | 70 (17.0%) |
| 16 and 17 Years | 244 (30.1%) | 369 (41.7%) |
| 18 to 24 Years | 472 (18.0%) | 603 (23.3%) |
| 25 to 34 Years | 559 (15.3%) | 1,073 (27.4%) |
| 35 to 44 Years | 640 (20.3%) | 706 (19.1%) |
| 45 to 54 Years | 456 (11.9%) | 693 (16.8%) |
| 55 to 64 Years | 633 (15.8%) | 807 (17.4%) |
| 65 to 74 Years | 366 (10.8%) | 557 (14.0%) |
| 75 Years and over | 179 (10.1%) | 360 (14.1%) |
| Total | 5,381 (18.2%) | 7,113 (22.1%) |
Income Above Poverty by Sex and Age in Darlington County
According to the poverty statistics in Darlington County, males aged 75 years and over and females aged 65 to 74 years are the age groups that are most secure financially, with 89.9% of males and 86.0% of females in these age groups living above the poverty line.
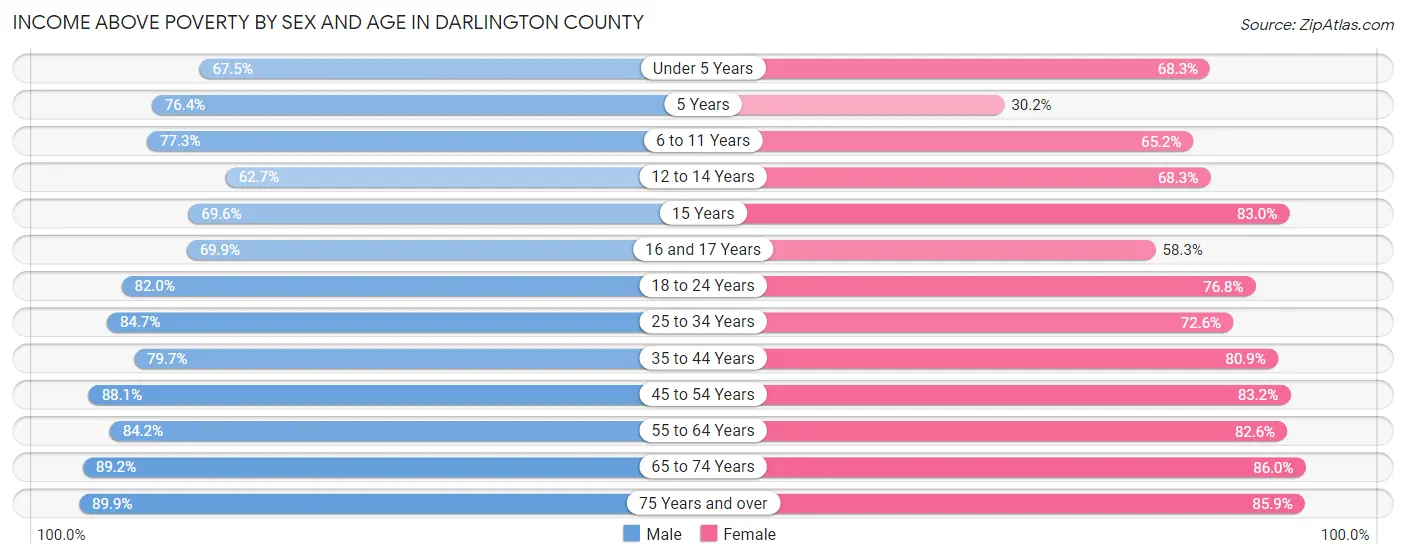
| Age Bracket | Male | Female |
| Under 5 Years | 1,225 (67.5%) | 1,132 (68.3%) |
| 5 Years | 252 (76.4%) | 64 (30.2%) |
| 6 to 11 Years | 1,935 (77.2%) | 1,647 (65.2%) |
| 12 to 14 Years | 755 (62.7%) | 699 (68.3%) |
| 15 Years | 332 (69.6%) | 342 (83.0%) |
| 16 and 17 Years | 567 (69.9%) | 515 (58.3%) |
| 18 to 24 Years | 2,150 (82.0%) | 1,990 (76.7%) |
| 25 to 34 Years | 3,091 (84.7%) | 2,841 (72.6%) |
| 35 to 44 Years | 2,508 (79.7%) | 2,987 (80.9%) |
| 45 to 54 Years | 3,374 (88.1%) | 3,426 (83.2%) |
| 55 to 64 Years | 3,368 (84.2%) | 3,835 (82.6%) |
| 65 to 74 Years | 3,023 (89.2%) | 3,432 (86.0%) |
| 75 Years and over | 1,589 (89.9%) | 2,194 (85.9%) |
| Total | 24,169 (81.8%) | 25,104 (77.9%) |
Income Below Poverty Among Married-Couple Families in Darlington County
The poverty statistics for married-couple families in Darlington County show that 5.4% or 531 of the total 9,762 families live below the poverty line. Families with 5 or more children have the highest poverty rate of 43.9%, comprising of 79 families. On the other hand, families with no children have the lowest poverty rate of 3.1%, which includes 199 families.
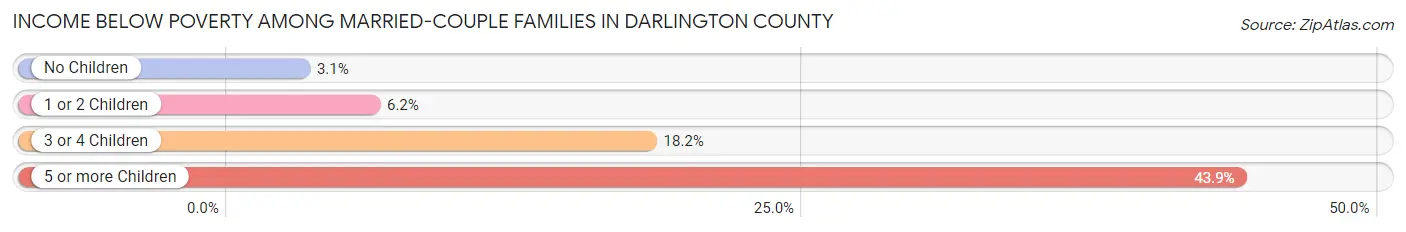
| Children | Above Poverty | Below Poverty |
| No Children | 6,168 (96.9%) | 199 (3.1%) |
| 1 or 2 Children | 2,594 (93.8%) | 171 (6.2%) |
| 3 or 4 Children | 368 (81.8%) | 82 (18.2%) |
| 5 or more Children | 101 (56.1%) | 79 (43.9%) |
| Total | 9,231 (94.6%) | 531 (5.4%) |
Income Below Poverty Among Single-Parent Households in Darlington County
According to the poverty data in Darlington County, 36.6% or 447 single-father households and 33.9% or 1,605 single-mother households are living below the poverty line. Among single-father households, those with 3 or 4 children have the highest poverty rate, with 58 households (56.9%) experiencing poverty. Likewise, among single-mother households, those with 5 or more children have the highest poverty rate, with 70 households (92.1%) falling below the poverty line.
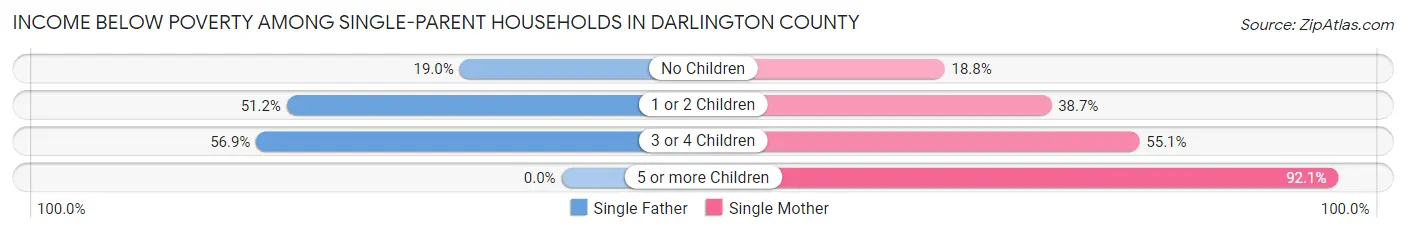
| Children | Single Father | Single Mother |
| No Children | 108 (19.0%) | 340 (18.8%) |
| 1 or 2 Children | 281 (51.2%) | 875 (38.7%) |
| 3 or 4 Children | 58 (56.9%) | 320 (55.1%) |
| 5 or more Children | 0 (0.0%) | 70 (92.1%) |
| Total | 447 (36.6%) | 1,605 (33.9%) |
Income Below Poverty Among Married-Couple vs Single-Parent Households in Darlington County
The poverty data for Darlington County shows that 531 of the married-couple family households (5.4%) and 2,052 of the single-parent households (34.5%) are living below the poverty level. Within the married-couple family households, those with 5 or more children have the highest poverty rate, with 79 households (43.9%) falling below the poverty line. Among the single-parent households, those with 5 or more children have the highest poverty rate, with 70 household (92.1%) living below poverty.
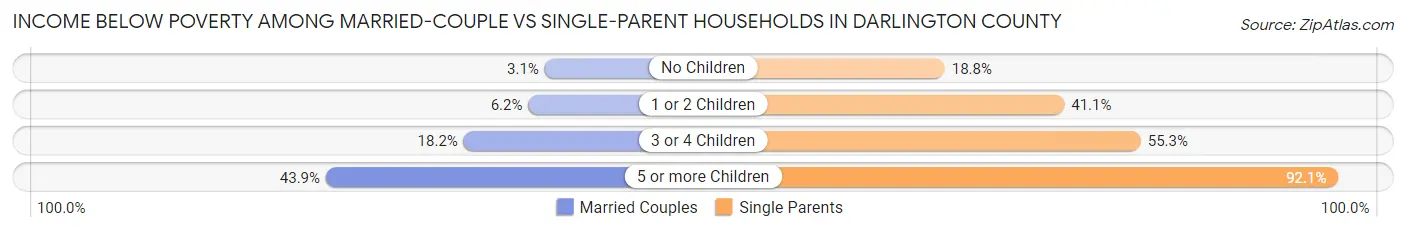
| Children | Married-Couple Families | Single-Parent Households |
| No Children | 199 (3.1%) | 448 (18.8%) |
| 1 or 2 Children | 171 (6.2%) | 1,156 (41.1%) |
| 3 or 4 Children | 82 (18.2%) | 378 (55.3%) |
| 5 or more Children | 79 (43.9%) | 70 (92.1%) |
| Total | 531 (5.4%) | 2,052 (34.5%) |
Race in Darlington County
The most populous races in Darlington County are White / Caucasian (34,609 | 54.9%), Black / African American (25,847 | 41.0%), and Two or more Races (1,557 | 2.5%).
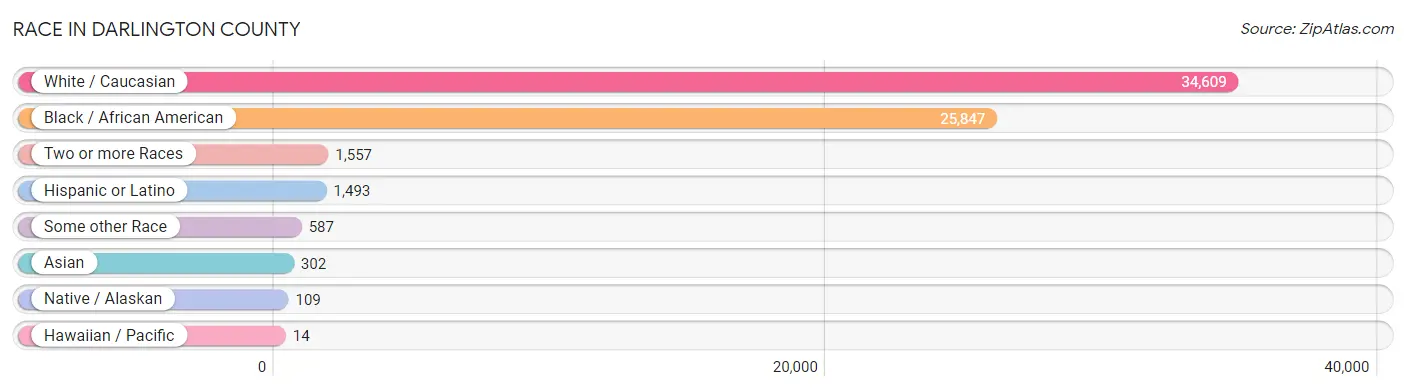
| Race | # Population | % Population |
| Asian | 302 | 0.5% |
| Black / African American | 25,847 | 41.0% |
| Hawaiian / Pacific | 14 | 0.0% |
| Hispanic or Latino | 1,493 | 2.4% |
| Native / Alaskan | 109 | 0.2% |
| White / Caucasian | 34,609 | 54.9% |
| Two or more Races | 1,557 | 2.5% |
| Some other Race | 587 | 0.9% |
| Total | 63,025 | 100.0% |
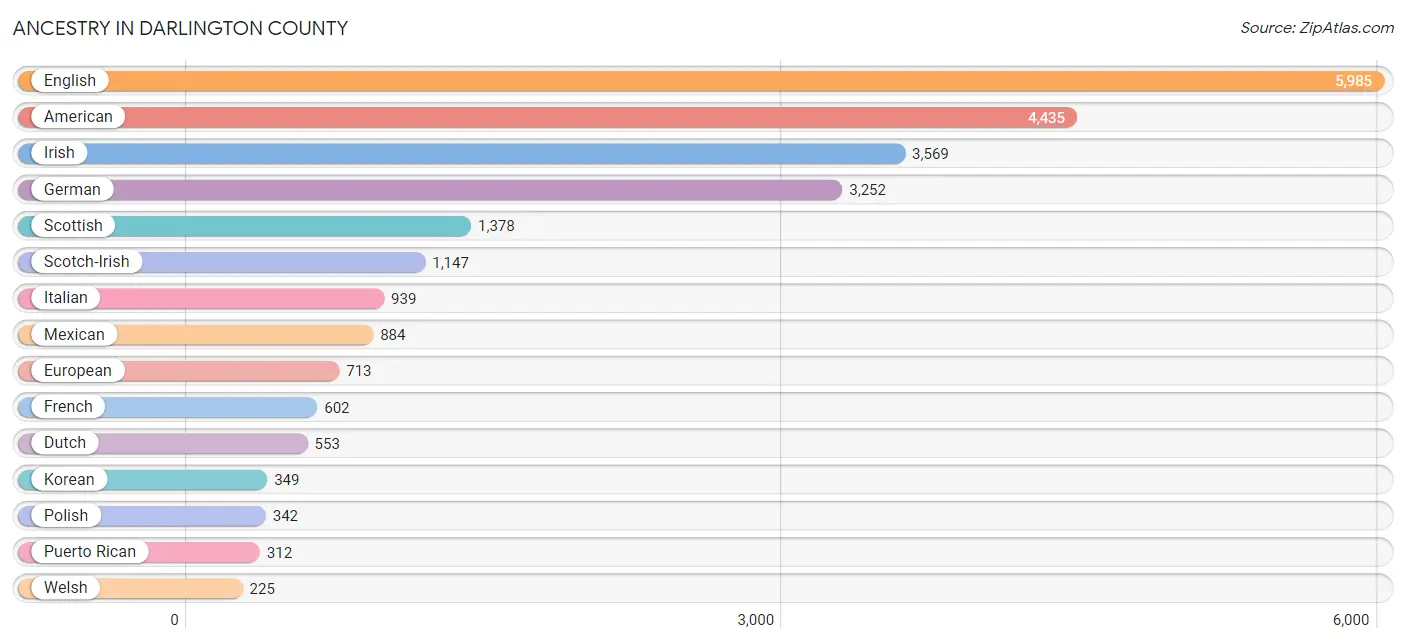
Ancestry in Darlington County
The most populous ancestries reported in Darlington County are English (5,985 | 9.5%), American (4,435 | 7.0%), Irish (3,569 | 5.7%), German (3,252 | 5.2%), and Scottish (1,378 | 2.2%), together accounting for 29.5% of all Darlington County residents.
| Ancestry | # Population | % Population |
| African | 129 | 0.2% |
| American | 4,435 | 7.0% |
| Arab | 23 | 0.0% |
| Armenian | 48 | 0.1% |
| Barbadian | 5 | 0.0% |
| Belgian | 42 | 0.1% |
| Blackfeet | 34 | 0.1% |
| Brazilian | 71 | 0.1% |
| British | 80 | 0.1% |
| Burmese | 5 | 0.0% |
| Canadian | 9 | 0.0% |
| Cape Verdean | 14 | 0.0% |
| Central American | 69 | 0.1% |
| Cherokee | 184 | 0.3% |
| Chippewa | 14 | 0.0% |
| Colombian | 71 | 0.1% |
| Cuban | 11 | 0.0% |
| Czech | 16 | 0.0% |
| Danish | 39 | 0.1% |
| Dominican | 69 | 0.1% |
| Dutch | 553 | 0.9% |
| Eastern European | 7 | 0.0% |
| English | 5,985 | 9.5% |
| European | 713 | 1.1% |
| Finnish | 37 | 0.1% |
| French | 602 | 1.0% |
| French Canadian | 87 | 0.1% |
| German | 3,252 | 5.2% |
| Greek | 39 | 0.1% |
| Haitian | 23 | 0.0% |
| Hungarian | 12 | 0.0% |
| Indian (Asian) | 19 | 0.0% |
| Irish | 3,569 | 5.7% |
| Iroquois | 29 | 0.1% |
| Israeli | 13 | 0.0% |
| Italian | 939 | 1.5% |
| Jamaican | 146 | 0.2% |
| Korean | 349 | 0.5% |
| Laotian | 11 | 0.0% |
| Lebanese | 23 | 0.0% |
| Lumbee | 15 | 0.0% |
| Mexican | 884 | 1.4% |
| Mongolian | 16 | 0.0% |
| Native Hawaiian | 6 | 0.0% |
| Northern European | 37 | 0.1% |
| Norwegian | 15 | 0.0% |
| Pakistani | 11 | 0.0% |
| Panamanian | 63 | 0.1% |
| Polish | 342 | 0.5% |
| Portuguese | 14 | 0.0% |
| Puerto Rican | 312 | 0.5% |
| Russian | 152 | 0.2% |
| Salvadoran | 6 | 0.0% |
| Scandinavian | 43 | 0.1% |
| Scotch-Irish | 1,147 | 1.8% |
| Scottish | 1,378 | 2.2% |
| Sioux | 8 | 0.0% |
| Slavic | 10 | 0.0% |
| South American | 71 | 0.1% |
| Spaniard | 11 | 0.0% |
| Spanish | 8 | 0.0% |
| Sri Lankan | 15 | 0.0% |
| Subsaharan African | 143 | 0.2% |
| Swedish | 196 | 0.3% |
| Swiss | 36 | 0.1% |
| Ukrainian | 14 | 0.0% |
| Welsh | 225 | 0.4% |
| West Indian | 3 | 0.0% | View All 68 Rows |
Immigrants in Darlington County
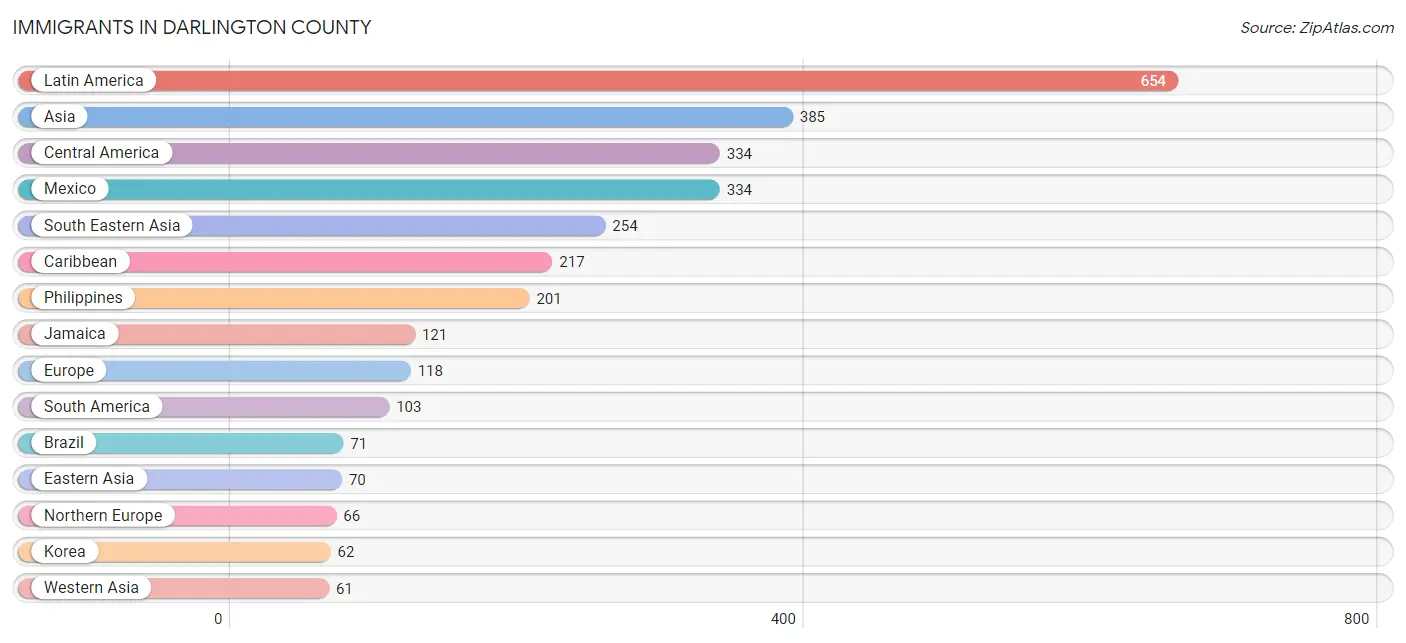
The most numerous immigrant groups reported in Darlington County came from Latin America (654 | 1.0%), Asia (385 | 0.6%), Central America (334 | 0.5%), Mexico (334 | 0.5%), and South Eastern Asia (254 | 0.4%), together accounting for 3.1% of all Darlington County residents.
| Immigration Origin | # Population | % Population |
| Africa | 45 | 0.1% |
| Asia | 385 | 0.6% |
| Austria | 2 | 0.0% |
| Barbados | 5 | 0.0% |
| Brazil | 71 | 0.1% |
| Canada | 18 | 0.0% |
| Caribbean | 217 | 0.3% |
| Central America | 334 | 0.5% |
| China | 8 | 0.0% |
| Colombia | 32 | 0.1% |
| Dominican Republic | 12 | 0.0% |
| Eastern Africa | 37 | 0.1% |
| Eastern Asia | 70 | 0.1% |
| Eastern Europe | 25 | 0.0% |
| England | 18 | 0.0% |
| Ethiopia | 37 | 0.1% |
| Europe | 118 | 0.2% |
| Haiti | 23 | 0.0% |
| Indonesia | 11 | 0.0% |
| Ireland | 28 | 0.0% |
| Israel | 13 | 0.0% |
| Italy | 12 | 0.0% |
| Jamaica | 121 | 0.2% |
| Korea | 62 | 0.1% |
| Latin America | 654 | 1.0% |
| Mexico | 334 | 0.5% |
| Middle Africa | 7 | 0.0% |
| Northern Europe | 66 | 0.1% |
| Philippines | 201 | 0.3% |
| Portugal | 13 | 0.0% |
| Russia | 25 | 0.0% |
| South America | 103 | 0.2% |
| South Eastern Asia | 254 | 0.4% |
| Southern Europe | 25 | 0.0% |
| St. Vincent and the Grenadines | 3 | 0.0% |
| Thailand | 11 | 0.0% |
| Trinidad and Tobago | 53 | 0.1% |
| Vietnam | 31 | 0.1% |
| Western Asia | 61 | 0.1% |
| Western Europe | 2 | 0.0% |
| Zaire | 7 | 0.0% | View All 41 Rows |
Sex and Age in Darlington County
Sex and Age in Darlington County
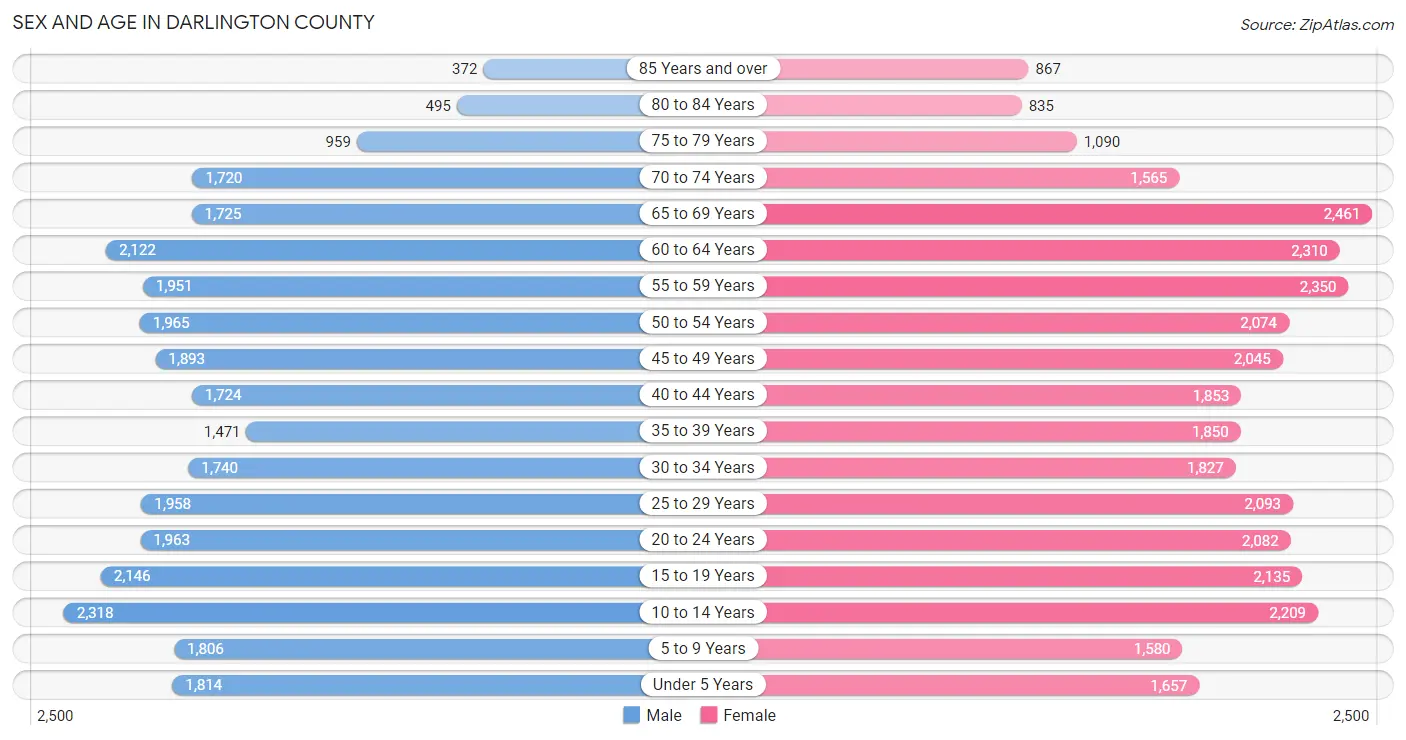
The most populous age groups in Darlington County are 10 to 14 Years (2,318 | 7.7%) for men and 65 to 69 Years (2,461 | 7.5%) for women.
| Age Bracket | Male | Female |
| Under 5 Years | 1,814 (6.0%) | 1,657 (5.0%) |
| 5 to 9 Years | 1,806 (6.0%) | 1,580 (4.8%) |
| 10 to 14 Years | 2,318 (7.7%) | 2,209 (6.7%) |
| 15 to 19 Years | 2,146 (7.1%) | 2,135 (6.5%) |
| 20 to 24 Years | 1,963 (6.5%) | 2,082 (6.3%) |
| 25 to 29 Years | 1,958 (6.5%) | 2,093 (6.4%) |
| 30 to 34 Years | 1,740 (5.8%) | 1,827 (5.6%) |
| 35 to 39 Years | 1,471 (4.9%) | 1,850 (5.6%) |
| 40 to 44 Years | 1,724 (5.7%) | 1,853 (5.6%) |
| 45 to 49 Years | 1,893 (6.3%) | 2,045 (6.2%) |
| 50 to 54 Years | 1,965 (6.5%) | 2,074 (6.3%) |
| 55 to 59 Years | 1,951 (6.5%) | 2,350 (7.1%) |
| 60 to 64 Years | 2,122 (7.0%) | 2,310 (7.0%) |
| 65 to 69 Years | 1,725 (5.7%) | 2,461 (7.5%) |
| 70 to 74 Years | 1,720 (5.7%) | 1,565 (4.8%) |
| 75 to 79 Years | 959 (3.2%) | 1,090 (3.3%) |
| 80 to 84 Years | 495 (1.6%) | 835 (2.5%) |
| 85 Years and over | 372 (1.2%) | 867 (2.6%) |
| Total | 30,142 (100.0%) | 32,883 (100.0%) |
Families and Households in Darlington County
Median Family Size in Darlington County
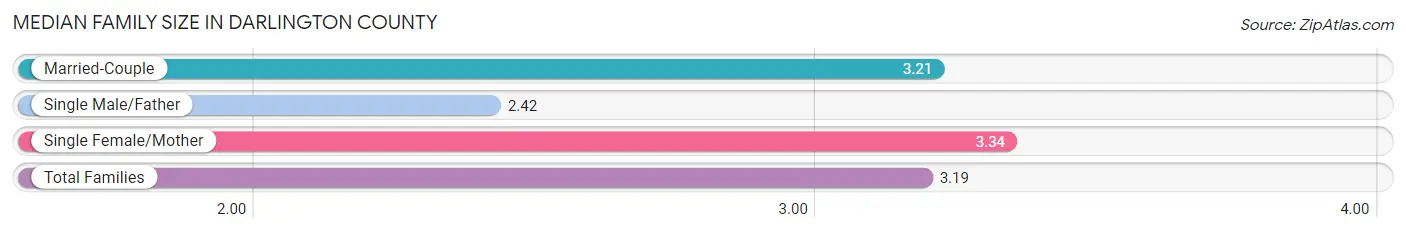
The median family size in Darlington County is 3.19 persons per family, with single female/mother families (4,730 | 30.1%) accounting for the largest median family size of 3.34 persons per family. On the other hand, single male/father families (1,220 | 7.8%) represent the smallest median family size with 2.42 persons per family.
| Family Type | # Families | Family Size |
| Married-Couple | 9,762 (62.1%) | 3.21 |
| Single Male/Father | 1,220 (7.8%) | 2.42 |
| Single Female/Mother | 4,730 (30.1%) | 3.34 |
| Total Families | 15,712 (100.0%) | 3.19 |
Median Household Size in Darlington County
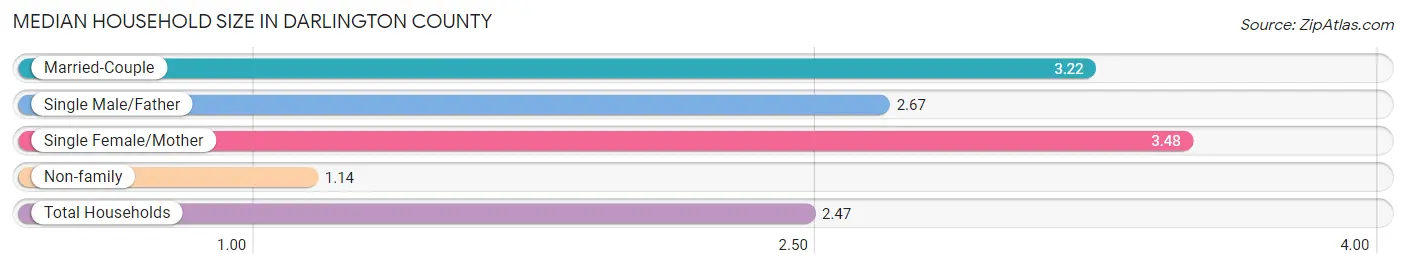
The median household size in Darlington County is 2.47 persons per household, with single female/mother households (4,730 | 18.9%) accounting for the largest median household size of 3.48 persons per household. non-family households (9,310 | 37.2%) represent the smallest median household size with 1.14 persons per household.
| Household Type | # Households | Household Size |
| Married-Couple | 9,762 (39.0%) | 3.22 |
| Single Male/Father | 1,220 (4.9%) | 2.67 |
| Single Female/Mother | 4,730 (18.9%) | 3.48 |
| Non-family | 9,310 (37.2%) | 1.14 |
| Total Households | 25,022 (100.0%) | 2.47 |
Household Size by Marriage Status in Darlington County
Out of a total of 25,022 households in Darlington County, 15,712 (62.8%) are family households, while 9,310 (37.2%) are nonfamily households. The most numerous type of family households are 2-person households, comprising 7,279, and the most common type of nonfamily households are 1-person households, comprising 8,443.
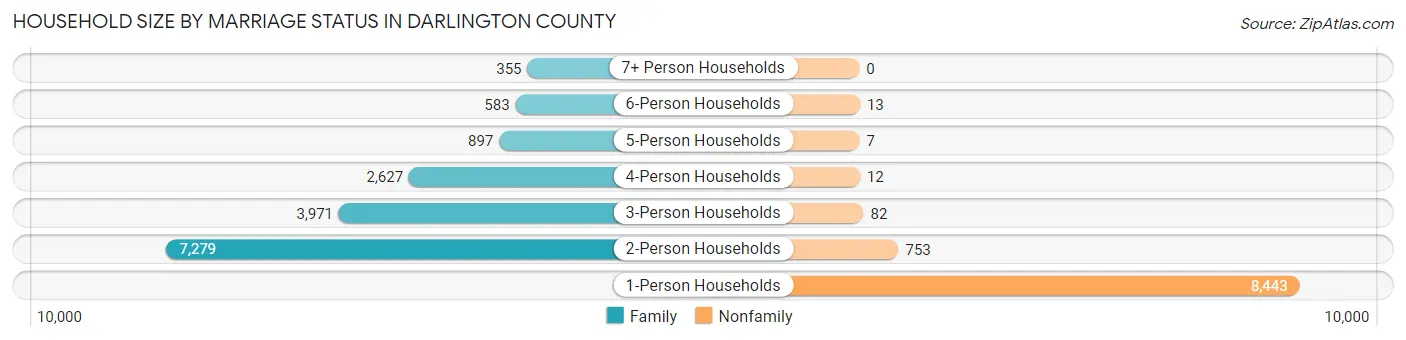
| Household Size | Family Households | Nonfamily Households |
| 1-Person Households | - | 8,443 (33.7%) |
| 2-Person Households | 7,279 (29.1%) | 753 (3.0%) |
| 3-Person Households | 3,971 (15.9%) | 82 (0.3%) |
| 4-Person Households | 2,627 (10.5%) | 12 (0.1%) |
| 5-Person Households | 897 (3.6%) | 7 (0.0%) |
| 6-Person Households | 583 (2.3%) | 13 (0.1%) |
| 7+ Person Households | 355 (1.4%) | 0 (0.0%) |
| Total | 15,712 (62.8%) | 9,310 (37.2%) |
Female Fertility in Darlington County
Fertility by Age in Darlington County
Average fertility rate in Darlington County is 48.0 births per 1,000 women. Women in the age bracket of 20 to 34 years have the highest fertility rate with 73.0 births per 1,000 women. Women in the age bracket of 20 to 34 years acount for 64.2% of all women with births.
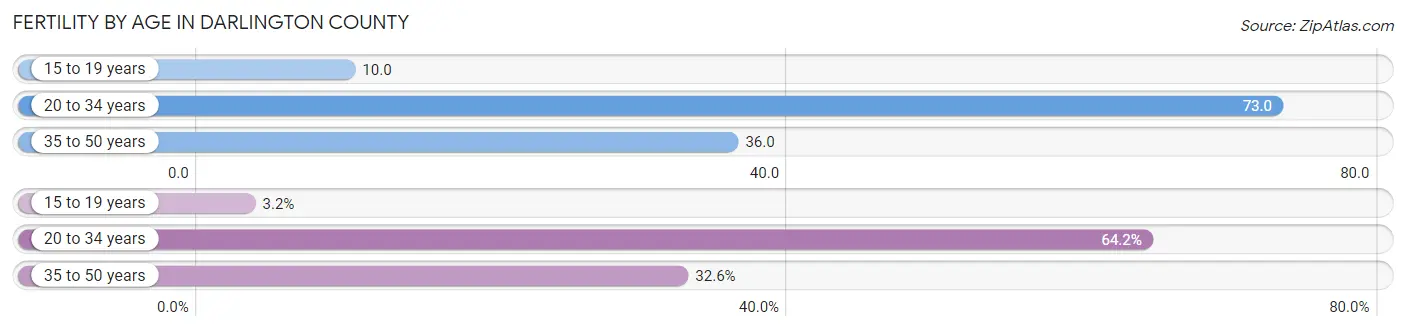
| Age Bracket | Women with Births | Births / 1,000 Women |
| 15 to 19 years | 22 (3.2%) | 10.0 |
| 20 to 34 years | 437 (64.2%) | 73.0 |
| 35 to 50 years | 222 (32.6%) | 36.0 |
| Total | 681 (100.0%) | 48.0 |
Fertility by Age by Marriage Status in Darlington County
25.0% of women with births (681) in Darlington County are married. The highest percentage of unmarried women with births falls into 15 to 19 years age bracket with 100.0% of them unmarried at the time of birth, while the lowest percentage of unmarried women with births belong to 20 to 34 years age bracket with 67.0% of them unmarried.
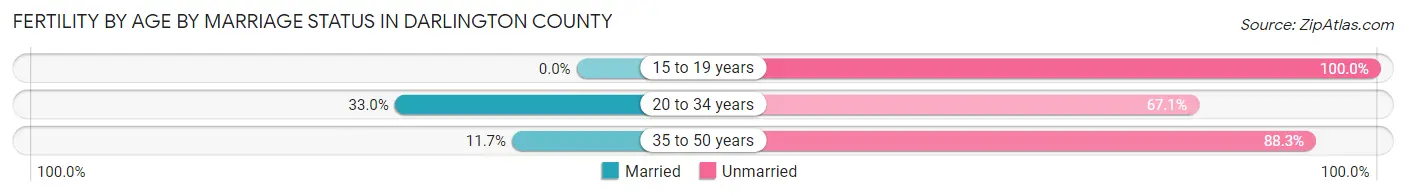
| Age Bracket | Married | Unmarried |
| 15 to 19 years | 0 (0.0%) | 22 (100.0%) |
| 20 to 34 years | 144 (33.0%) | 293 (67.0%) |
| 35 to 50 years | 26 (11.7%) | 196 (88.3%) |
| Total | 170 (25.0%) | 511 (75.0%) |
Fertility by Education in Darlington County
Average fertility rate in Darlington County is 48.0 births per 1,000 women. Women with the education attainment of bachelor's degree have the highest fertility rate of 78.0 births per 1,000 women, while women with the education attainment of college or associate's degree have the lowest fertility at 32.0 births per 1,000 women. Women with the education attainment of less than high school represent 29.5% of all women with births.
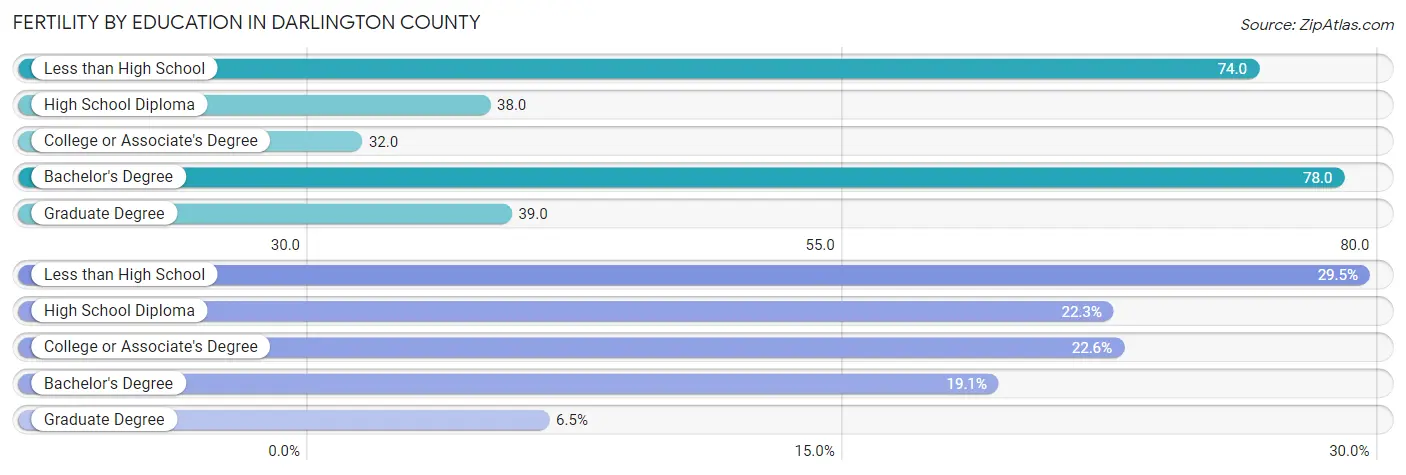
| Educational Attainment | Women with Births | Births / 1,000 Women |
| Less than High School | 201 (29.5%) | 74.0 |
| High School Diploma | 152 (22.3%) | 38.0 |
| College or Associate's Degree | 154 (22.6%) | 32.0 |
| Bachelor's Degree | 130 (19.1%) | 78.0 |
| Graduate Degree | 44 (6.5%) | 39.0 |
| Total | 681 (100.0%) | 48.0 |
Fertility by Education by Marriage Status in Darlington County
75.0% of women with births in Darlington County are unmarried. Women with the educational attainment of graduate degree are most likely to be married with 100.0% of them married at childbirth, while women with the educational attainment of less than high school are least likely to be married with 100.0% of them unmarried at childbirth.
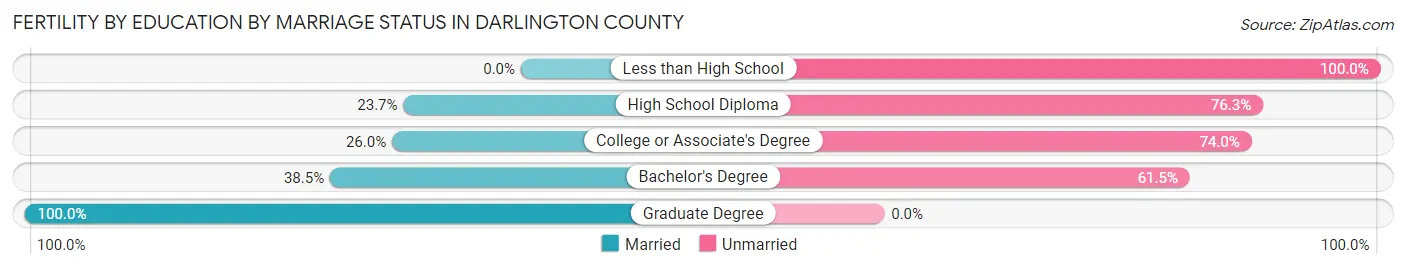
| Educational Attainment | Married | Unmarried |
| Less than High School | 0 (0.0%) | 201 (100.0%) |
| High School Diploma | 36 (23.7%) | 116 (76.3%) |
| College or Associate's Degree | 40 (26.0%) | 114 (74.0%) |
| Bachelor's Degree | 50 (38.5%) | 80 (61.5%) |
| Graduate Degree | 44 (100.0%) | 0 (0.0%) |
| Total | 170 (25.0%) | 511 (75.0%) |
Employment Characteristics in Darlington County
Employment by Class of Employer in Darlington County
Among the 25,776 employed individuals in Darlington County, private company employees (18,433 | 71.5%), not-for-profit organizations (1,830 | 7.1%), and local government employees (1,805 | 7.0%) make up the most common classes of employment.
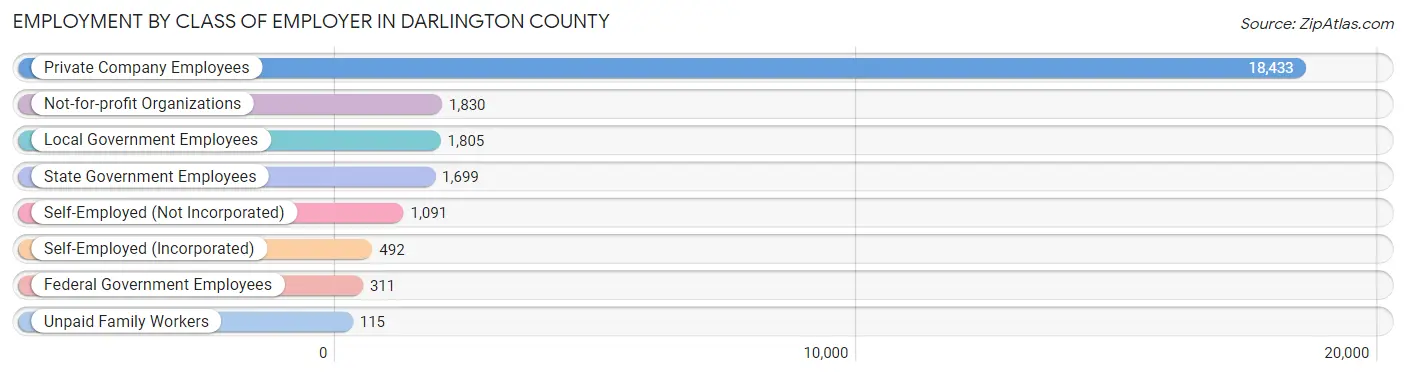
| Employer Class | # Employees | % Employees |
| Private Company Employees | 18,433 | 71.5% |
| Self-Employed (Incorporated) | 492 | 1.9% |
| Self-Employed (Not Incorporated) | 1,091 | 4.2% |
| Not-for-profit Organizations | 1,830 | 7.1% |
| Local Government Employees | 1,805 | 7.0% |
| State Government Employees | 1,699 | 6.6% |
| Federal Government Employees | 311 | 1.2% |
| Unpaid Family Workers | 115 | 0.4% |
| Total | 25,776 | 100.0% |
Employment Status by Age in Darlington County
According to the labor force statistics for Darlington County, out of the total population over 16 years of age (50,745), 55.6% or 28,214 individuals are in the labor force, with 6.5% or 1,834 of them unemployed. The age group with the highest labor force participation rate is 30 to 34 years, with 82.6% or 2,946 individuals in the labor force. Within the labor force, the 16 to 19 years age range has the highest percentage of unemployed individuals, with 24.7% or 267 of them being unemployed.
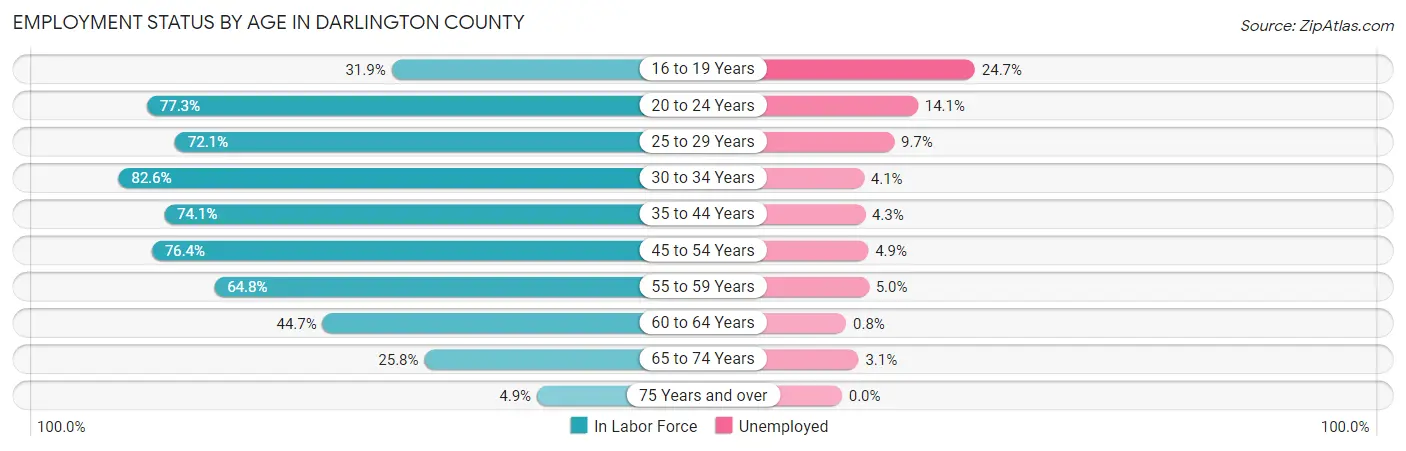
| Age Bracket | In Labor Force | Unemployed |
| 16 to 19 Years | 1,080 (31.9%) | 267 (24.7%) |
| 20 to 24 Years | 3,127 (77.3%) | 441 (14.1%) |
| 25 to 29 Years | 2,921 (72.1%) | 283 (9.7%) |
| 30 to 34 Years | 2,946 (82.6%) | 121 (4.1%) |
| 35 to 44 Years | 5,111 (74.1%) | 220 (4.3%) |
| 45 to 54 Years | 6,094 (76.4%) | 299 (4.9%) |
| 55 to 59 Years | 2,787 (64.8%) | 139 (5.0%) |
| 60 to 64 Years | 1,981 (44.7%) | 16 (0.8%) |
| 65 to 74 Years | 1,928 (25.8%) | 60 (3.1%) |
| 75 Years and over | 226 (4.9%) | 0 (0.0%) |
| Total | 28,214 (55.6%) | 1,834 (6.5%) |
Employment Status by Educational Attainment in Darlington County
According to labor force statistics for Darlington County, 70.0% of individuals (21,858) out of the total population between 25 and 64 years of age (31,226) are in the labor force, with 4.9% or 1,071 of them being unemployed. The group with the highest labor force participation rate are those with the educational attainment of bachelor's degree or higher, with 88.4% or 5,792 individuals in the labor force. Within the labor force, individuals with less than high school education have the highest percentage of unemployment, with 9.0% or 135 of them being unemployed.
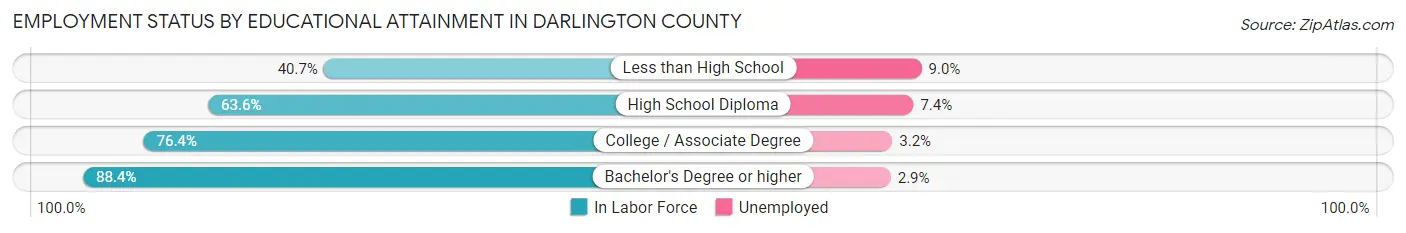
| Educational Attainment | In Labor Force | Unemployed |
| Less than High School | 1,495 (40.7%) | 330 (9.0%) |
| High School Diploma | 7,397 (63.6%) | 861 (7.4%) |
| College / Associate Degree | 7,160 (76.4%) | 300 (3.2%) |
| Bachelor's Degree or higher | 5,792 (88.4%) | 190 (2.9%) |
| Total | 21,858 (70.0%) | 1,530 (4.9%) |
Employment Occupations by Sex in Darlington County
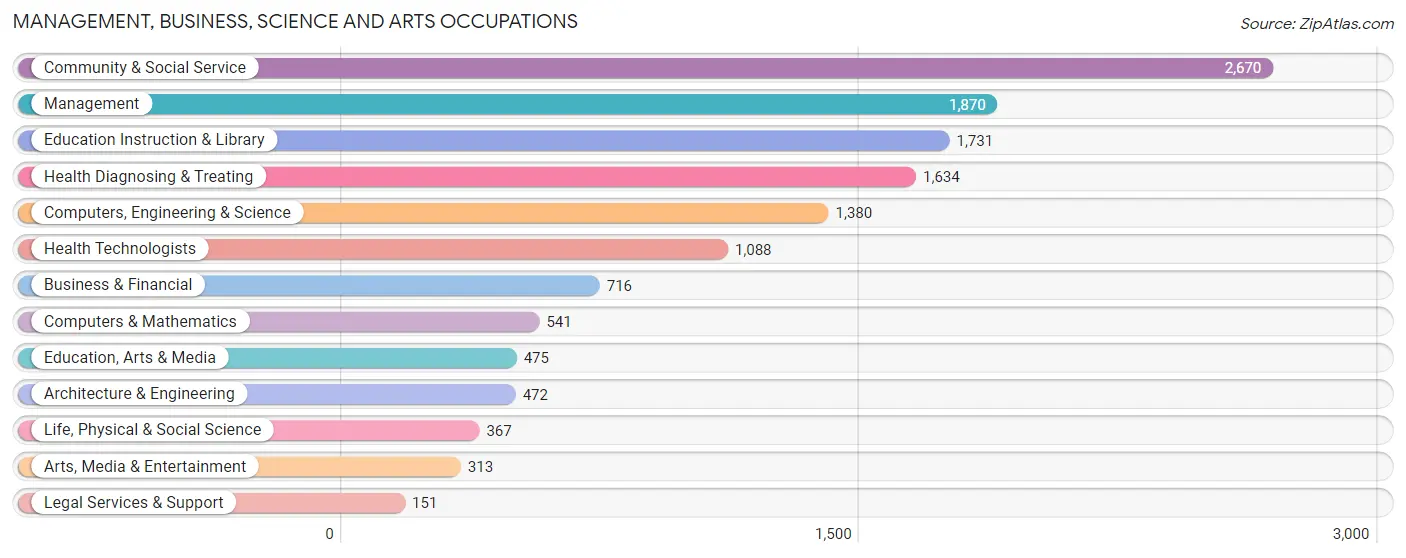
Management, Business, Science and Arts Occupations
The most common Management, Business, Science and Arts occupations in Darlington County are Community & Social Service (2,670 | 10.2%), Management (1,870 | 7.1%), Education Instruction & Library (1,731 | 6.6%), Health Diagnosing & Treating (1,634 | 6.2%), and Computers, Engineering & Science (1,380 | 5.2%).
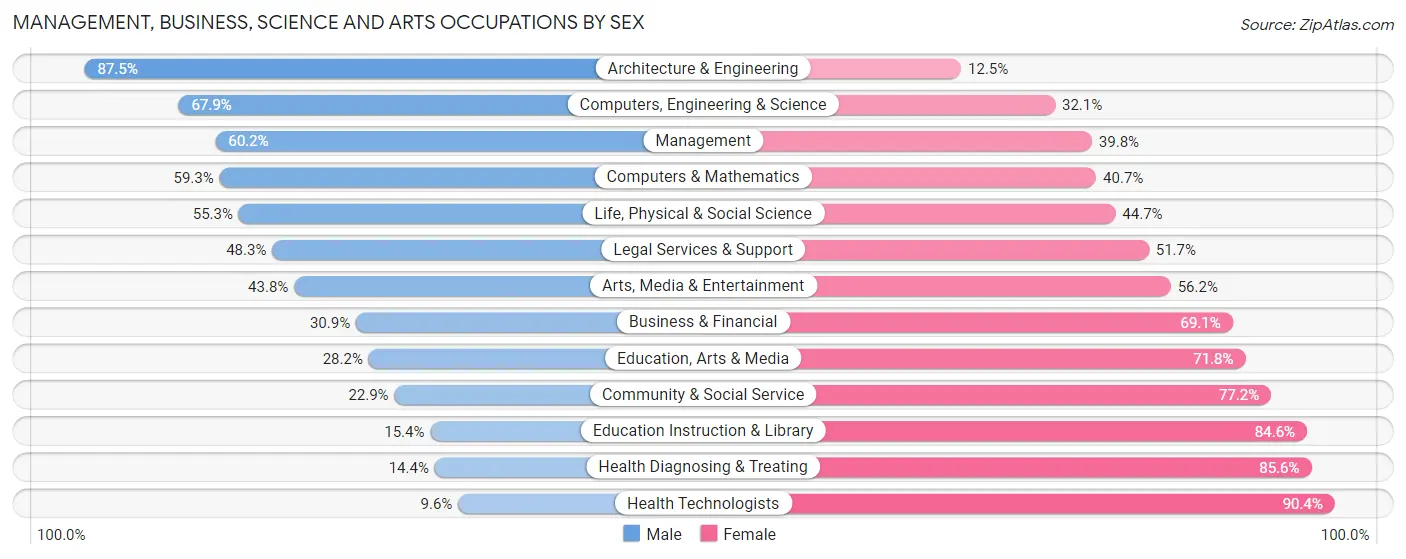
Management, Business, Science and Arts Occupations by Sex
Within the Management, Business, Science and Arts occupations in Darlington County, the most male-oriented occupations are Architecture & Engineering (87.5%), Computers, Engineering & Science (67.9%), and Management (60.2%), while the most female-oriented occupations are Health Technologists (90.4%), Health Diagnosing & Treating (85.6%), and Education Instruction & Library (84.6%).
| Occupation | Male | Female |
| Management | 1,126 (60.2%) | 744 (39.8%) |
| Business & Financial | 221 (30.9%) | 495 (69.1%) |
| Computers, Engineering & Science | 937 (67.9%) | 443 (32.1%) |
| Computers & Mathematics | 321 (59.3%) | 220 (40.7%) |
| Architecture & Engineering | 413 (87.5%) | 59 (12.5%) |
| Life, Physical & Social Science | 203 (55.3%) | 164 (44.7%) |
| Community & Social Service | 610 (22.9%) | 2,060 (77.1%) |
| Education, Arts & Media | 134 (28.2%) | 341 (71.8%) |
| Legal Services & Support | 73 (48.3%) | 78 (51.7%) |
| Education Instruction & Library | 266 (15.4%) | 1,465 (84.6%) |
| Arts, Media & Entertainment | 137 (43.8%) | 176 (56.2%) |
| Health Diagnosing & Treating | 236 (14.4%) | 1,398 (85.6%) |
| Health Technologists | 104 (9.6%) | 984 (90.4%) |
| Total (Category) | 3,130 (37.9%) | 5,140 (62.2%) |
| Total (Overall) | 12,595 (47.9%) | 13,710 (52.1%) |
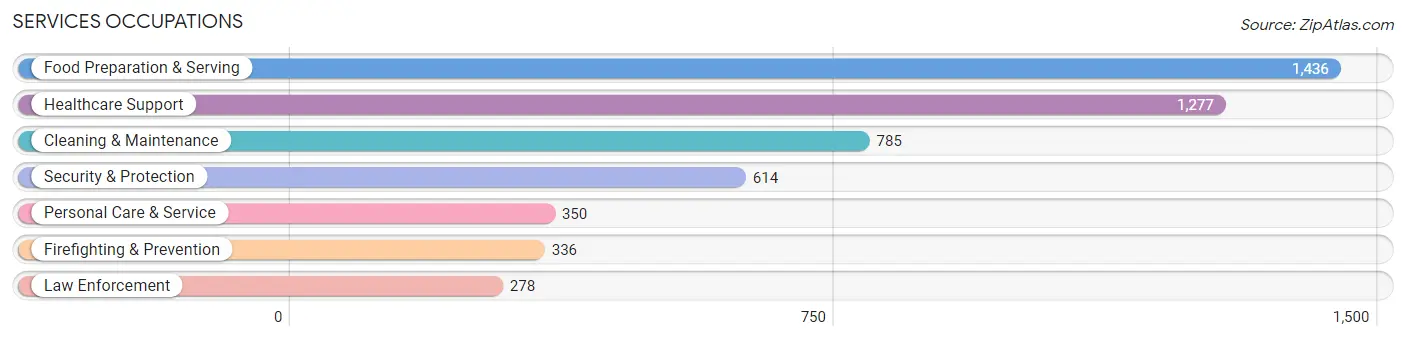
Services Occupations
The most common Services occupations in Darlington County are Food Preparation & Serving (1,436 | 5.5%), Healthcare Support (1,277 | 4.9%), Cleaning & Maintenance (785 | 3.0%), Security & Protection (614 | 2.3%), and Personal Care & Service (350 | 1.3%).
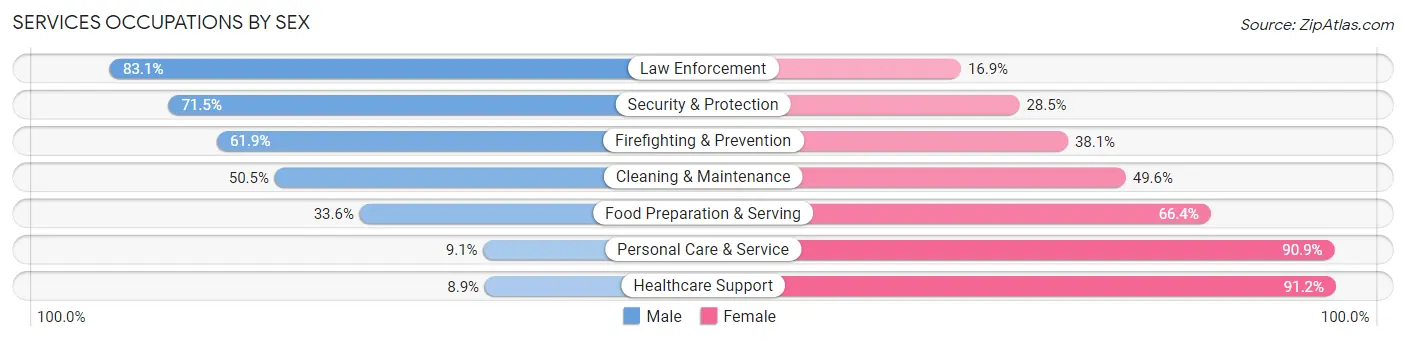
Services Occupations by Sex
Within the Services occupations in Darlington County, the most male-oriented occupations are Law Enforcement (83.1%), Security & Protection (71.5%), and Firefighting & Prevention (61.9%), while the most female-oriented occupations are Healthcare Support (91.1%), Personal Care & Service (90.9%), and Food Preparation & Serving (66.4%).
| Occupation | Male | Female |
| Healthcare Support | 113 (8.8%) | 1,164 (91.1%) |
| Security & Protection | 439 (71.5%) | 175 (28.5%) |
| Firefighting & Prevention | 208 (61.9%) | 128 (38.1%) |
| Law Enforcement | 231 (83.1%) | 47 (16.9%) |
| Food Preparation & Serving | 483 (33.6%) | 953 (66.4%) |
| Cleaning & Maintenance | 396 (50.4%) | 389 (49.5%) |
| Personal Care & Service | 32 (9.1%) | 318 (90.9%) |
| Total (Category) | 1,463 (32.8%) | 2,999 (67.2%) |
| Total (Overall) | 12,595 (47.9%) | 13,710 (52.1%) |
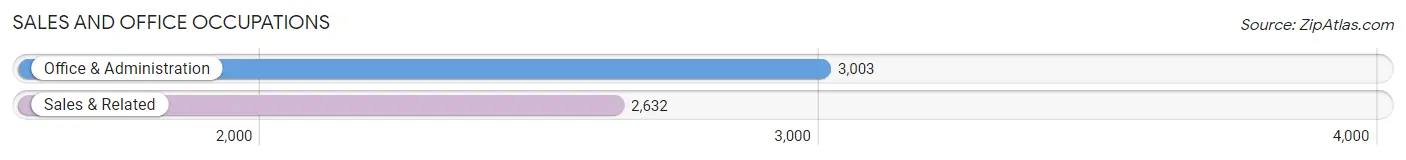
Sales and Office Occupations
The most common Sales and Office occupations in Darlington County are Office & Administration (3,003 | 11.4%), and Sales & Related (2,632 | 10.0%).
Sales and Office Occupations by Sex
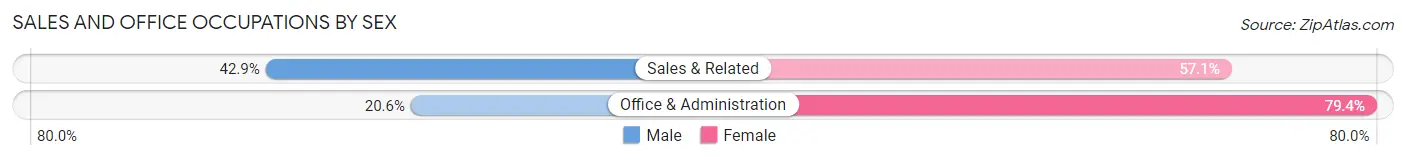
| Occupation | Male | Female |
| Sales & Related | 1,130 (42.9%) | 1,502 (57.1%) |
| Office & Administration | 618 (20.6%) | 2,385 (79.4%) |
| Total (Category) | 1,748 (31.0%) | 3,887 (69.0%) |
| Total (Overall) | 12,595 (47.9%) | 13,710 (52.1%) |
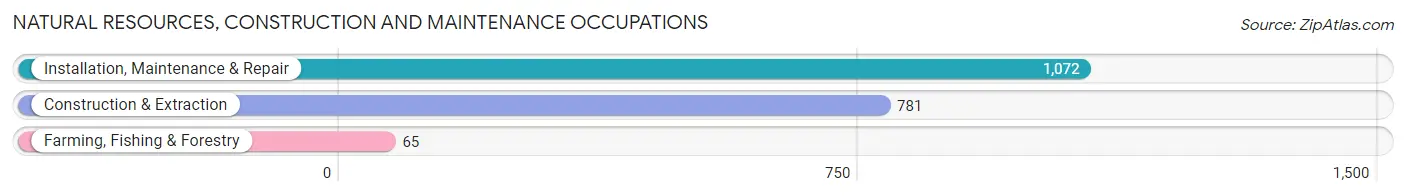
Natural Resources, Construction and Maintenance Occupations
The most common Natural Resources, Construction and Maintenance occupations in Darlington County are Installation, Maintenance & Repair (1,072 | 4.1%), Construction & Extraction (781 | 3.0%), and Farming, Fishing & Forestry (65 | 0.3%).
Natural Resources, Construction and Maintenance Occupations by Sex
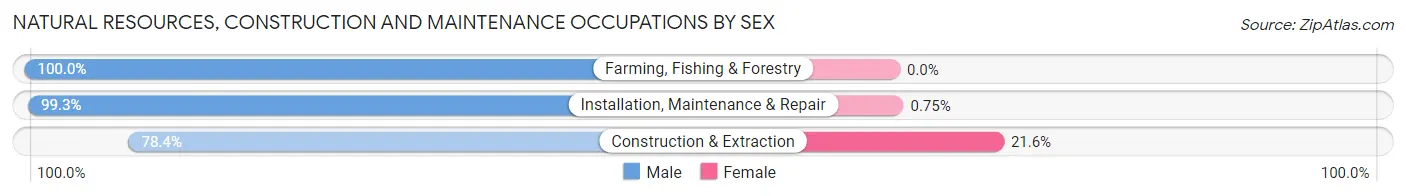
| Occupation | Male | Female |
| Farming, Fishing & Forestry | 65 (100.0%) | 0 (0.0%) |
| Construction & Extraction | 612 (78.4%) | 169 (21.6%) |
| Installation, Maintenance & Repair | 1,064 (99.3%) | 8 (0.7%) |
| Total (Category) | 1,741 (90.8%) | 177 (9.2%) |
| Total (Overall) | 12,595 (47.9%) | 13,710 (52.1%) |
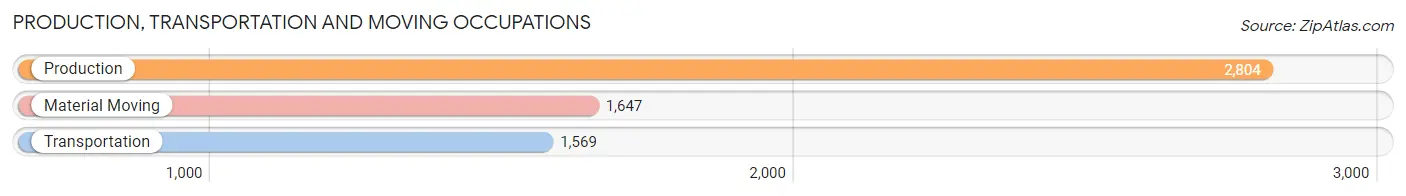
Production, Transportation and Moving Occupations
The most common Production, Transportation and Moving occupations in Darlington County are Production (2,804 | 10.7%), Material Moving (1,647 | 6.3%), and Transportation (1,569 | 6.0%).
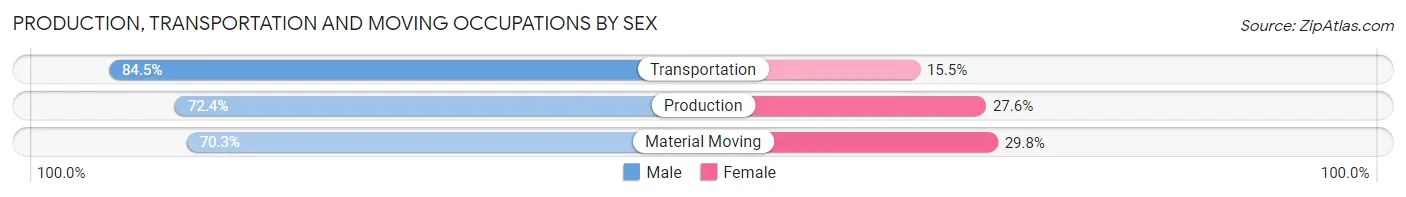
Production, Transportation and Moving Occupations by Sex
| Occupation | Male | Female |
| Production | 2,030 (72.4%) | 774 (27.6%) |
| Transportation | 1,326 (84.5%) | 243 (15.5%) |
| Material Moving | 1,157 (70.3%) | 490 (29.7%) |
| Total (Category) | 4,513 (75.0%) | 1,507 (25.0%) |
| Total (Overall) | 12,595 (47.9%) | 13,710 (52.1%) |
Employment Industries by Sex in Darlington County
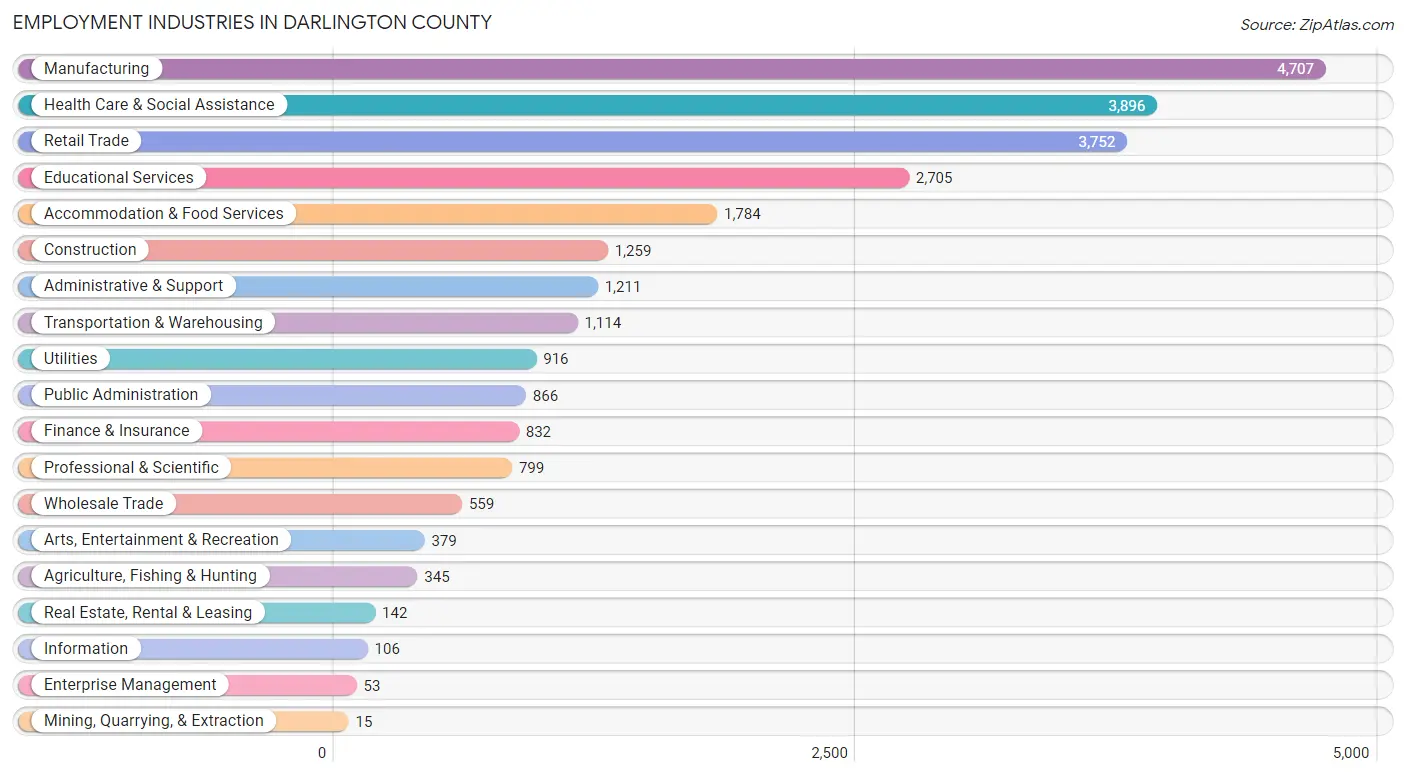
Employment Industries in Darlington County
The major employment industries in Darlington County include Manufacturing (4,707 | 17.9%), Health Care & Social Assistance (3,896 | 14.8%), Retail Trade (3,752 | 14.3%), Educational Services (2,705 | 10.3%), and Accommodation & Food Services (1,784 | 6.8%).
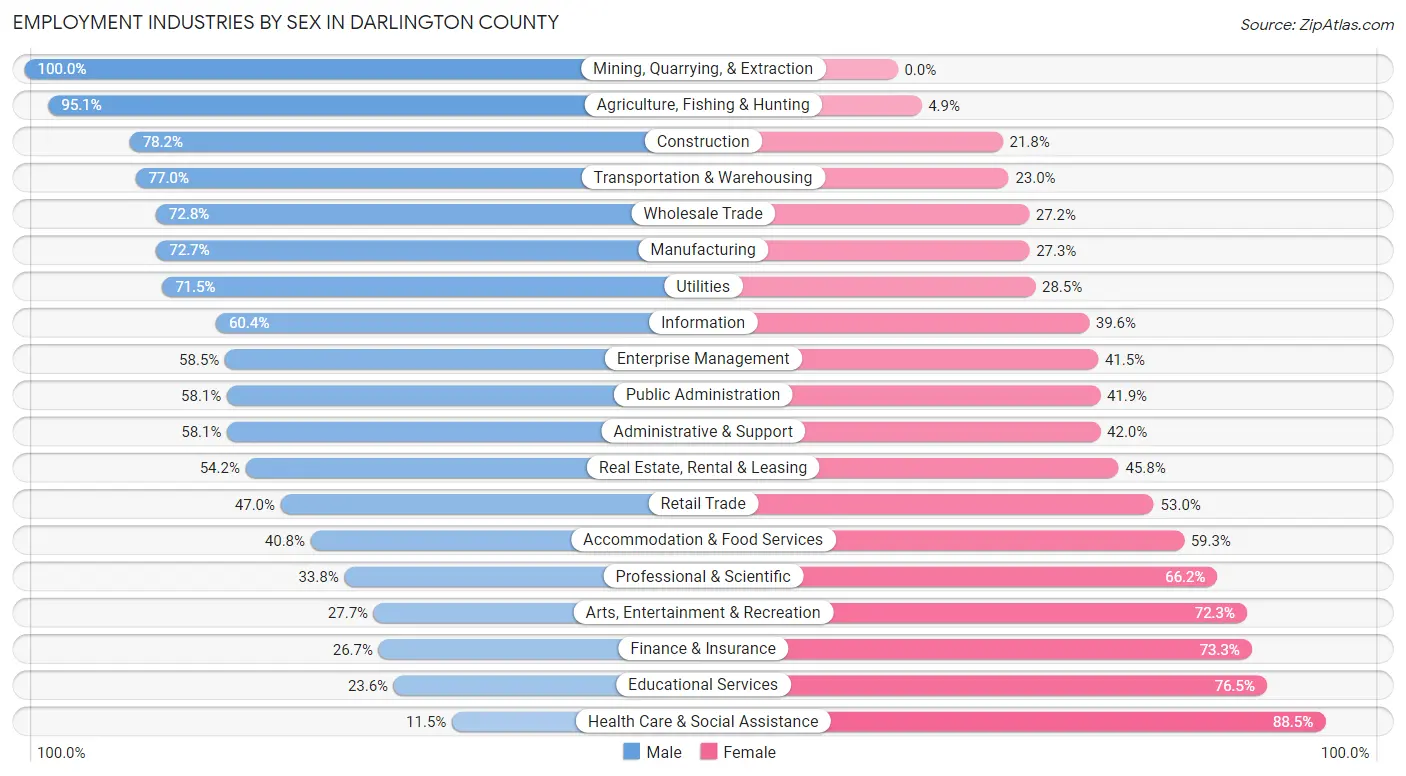
Employment Industries by Sex in Darlington County
The Darlington County industries that see more men than women are Mining, Quarrying, & Extraction (100.0%), Agriculture, Fishing & Hunting (95.1%), and Construction (78.2%), whereas the industries that tend to have a higher number of women are Health Care & Social Assistance (88.5%), Educational Services (76.4%), and Finance & Insurance (73.3%).
| Industry | Male | Female |
| Agriculture, Fishing & Hunting | 328 (95.1%) | 17 (4.9%) |
| Mining, Quarrying, & Extraction | 15 (100.0%) | 0 (0.0%) |
| Construction | 985 (78.2%) | 274 (21.8%) |
| Manufacturing | 3,423 (72.7%) | 1,284 (27.3%) |
| Wholesale Trade | 407 (72.8%) | 152 (27.2%) |
| Retail Trade | 1,762 (47.0%) | 1,990 (53.0%) |
| Transportation & Warehousing | 858 (77.0%) | 256 (23.0%) |
| Utilities | 655 (71.5%) | 261 (28.5%) |
| Information | 64 (60.4%) | 42 (39.6%) |
| Finance & Insurance | 222 (26.7%) | 610 (73.3%) |
| Real Estate, Rental & Leasing | 77 (54.2%) | 65 (45.8%) |
| Professional & Scientific | 270 (33.8%) | 529 (66.2%) |
| Enterprise Management | 31 (58.5%) | 22 (41.5%) |
| Administrative & Support | 703 (58.1%) | 508 (41.9%) |
| Educational Services | 637 (23.5%) | 2,068 (76.4%) |
| Health Care & Social Assistance | 448 (11.5%) | 3,448 (88.5%) |
| Arts, Entertainment & Recreation | 105 (27.7%) | 274 (72.3%) |
| Accommodation & Food Services | 727 (40.7%) | 1,057 (59.3%) |
| Public Administration | 503 (58.1%) | 363 (41.9%) |
| Total | 12,595 (47.9%) | 13,710 (52.1%) |
Education in Darlington County
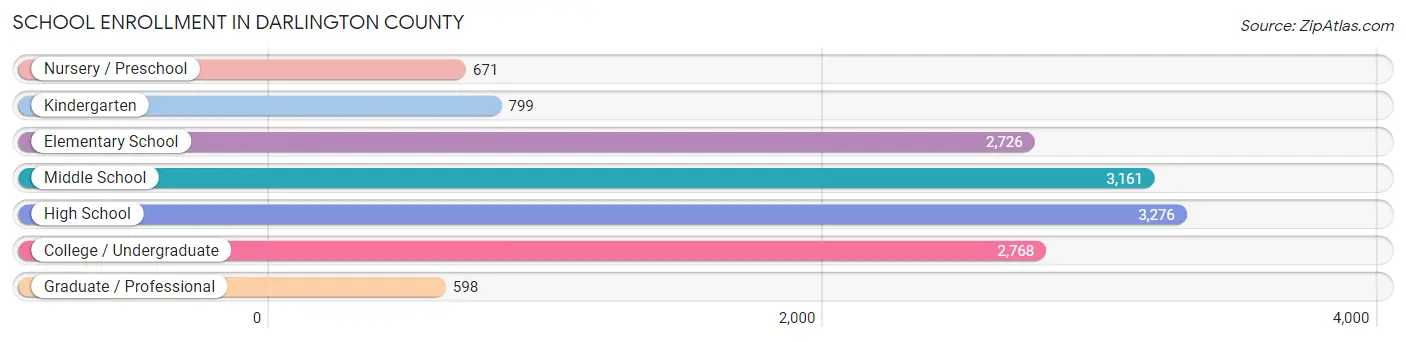
School Enrollment in Darlington County
The most common levels of schooling among the 13,999 students in Darlington County are high school (3,276 | 23.4%), middle school (3,161 | 22.6%), and college / undergraduate (2,768 | 19.8%).
| School Level | # Students | % Students |
| Nursery / Preschool | 671 | 4.8% |
| Kindergarten | 799 | 5.7% |
| Elementary School | 2,726 | 19.5% |
| Middle School | 3,161 | 22.6% |
| High School | 3,276 | 23.4% |
| College / Undergraduate | 2,768 | 19.8% |
| Graduate / Professional | 598 | 4.3% |
| Total | 13,999 | 100.0% |
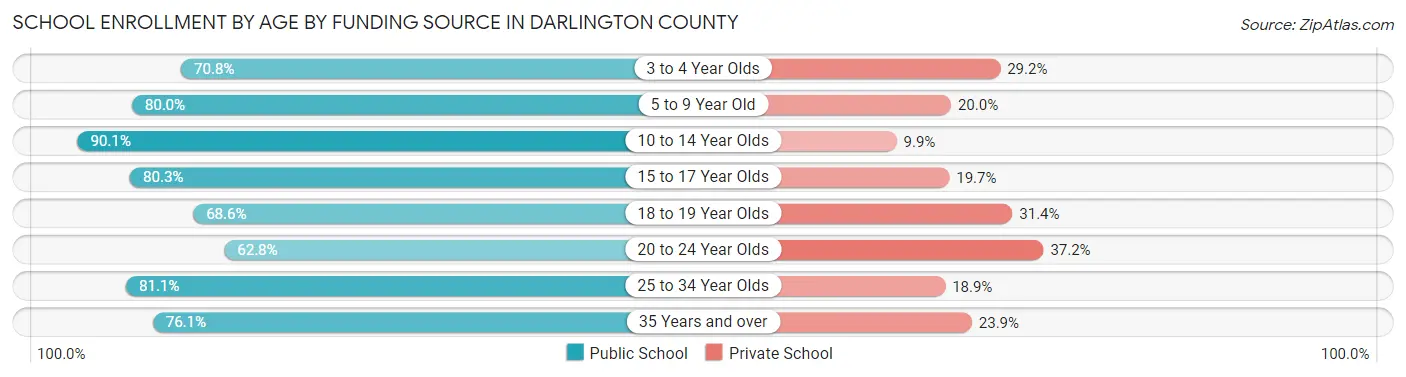
School Enrollment by Age by Funding Source in Darlington County
Out of a total of 13,999 students who are enrolled in schools in Darlington County, 2,814 (20.1%) attend a private institution, while the remaining 11,185 (79.9%) are enrolled in public schools. The age group of 20 to 24 year olds has the highest likelihood of being enrolled in private schools, with 483 (37.2% in the age bracket) enrolled. Conversely, the age group of 10 to 14 year olds has the lowest likelihood of being enrolled in a private school, with 3,738 (90.1% in the age bracket) attending a public institution.
| Age Bracket | Public School | Private School |
| 3 to 4 Year Olds | 464 (70.8%) | 191 (29.2%) |
| 5 to 9 Year Old | 2,410 (80.0%) | 602 (20.0%) |
| 10 to 14 Year Olds | 3,738 (90.1%) | 409 (9.9%) |
| 15 to 17 Year Olds | 1,850 (80.3%) | 453 (19.7%) |
| 18 to 19 Year Olds | 812 (68.6%) | 372 (31.4%) |
| 20 to 24 Year Olds | 815 (62.8%) | 483 (37.2%) |
| 25 to 34 Year Olds | 463 (81.1%) | 108 (18.9%) |
| 35 Years and over | 631 (76.1%) | 198 (23.9%) |
| Total | 11,185 (79.9%) | 2,814 (20.1%) |
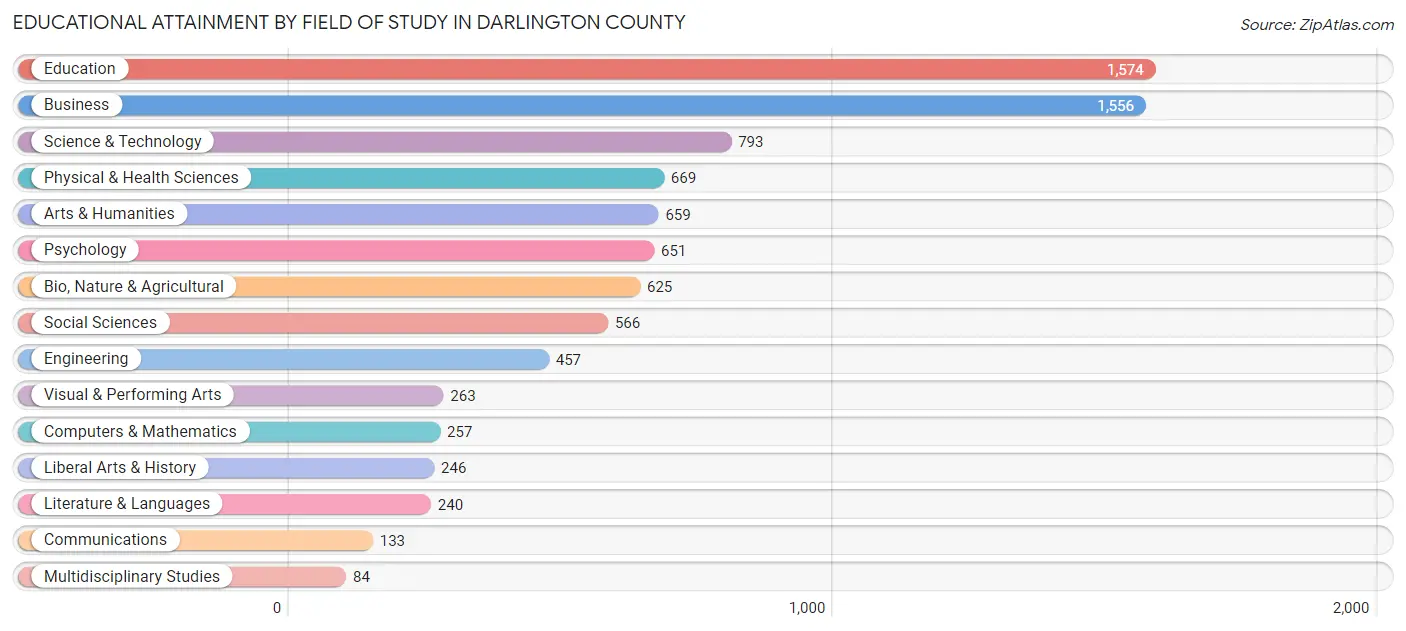
Educational Attainment by Field of Study in Darlington County
Education (1,574 | 17.9%), business (1,556 | 17.7%), science & technology (793 | 9.0%), physical & health sciences (669 | 7.6%), and arts & humanities (659 | 7.5%) are the most common fields of study among 8,773 individuals in Darlington County who have obtained a bachelor's degree or higher.
| Field of Study | # Graduates | % Graduates |
| Computers & Mathematics | 257 | 2.9% |
| Bio, Nature & Agricultural | 625 | 7.1% |
| Physical & Health Sciences | 669 | 7.6% |
| Psychology | 651 | 7.4% |
| Social Sciences | 566 | 6.5% |
| Engineering | 457 | 5.2% |
| Multidisciplinary Studies | 84 | 1.0% |
| Science & Technology | 793 | 9.0% |
| Business | 1,556 | 17.7% |
| Education | 1,574 | 17.9% |
| Literature & Languages | 240 | 2.7% |
| Liberal Arts & History | 246 | 2.8% |
| Visual & Performing Arts | 263 | 3.0% |
| Communications | 133 | 1.5% |
| Arts & Humanities | 659 | 7.5% |
| Total | 8,773 | 100.0% |
Transportation & Commute in Darlington County
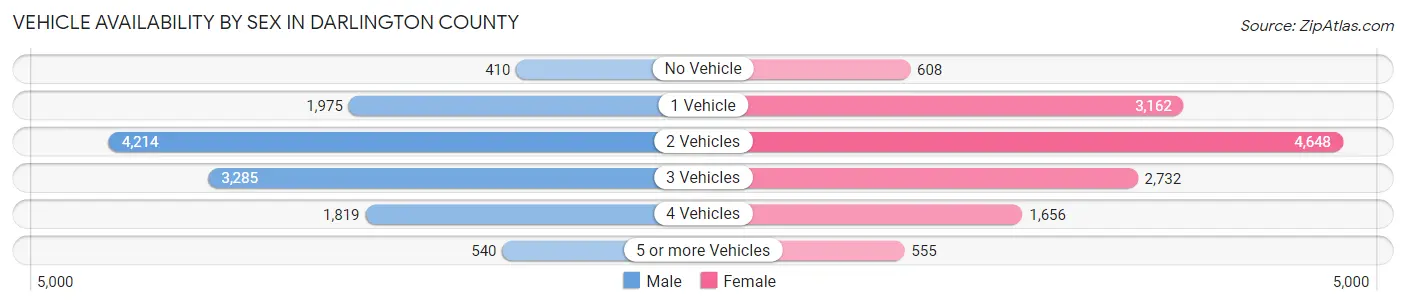
Vehicle Availability by Sex in Darlington County
The most prevalent vehicle ownership categories in Darlington County are males with 2 vehicles (4,214, accounting for 34.4%) and females with 2 vehicles (4,648, making up 31.5%).
| Vehicles Available | Male | Female |
| No Vehicle | 410 (3.4%) | 608 (4.5%) |
| 1 Vehicle | 1,975 (16.1%) | 3,162 (23.7%) |
| 2 Vehicles | 4,214 (34.4%) | 4,648 (34.8%) |
| 3 Vehicles | 3,285 (26.8%) | 2,732 (20.4%) |
| 4 Vehicles | 1,819 (14.9%) | 1,656 (12.4%) |
| 5 or more Vehicles | 540 (4.4%) | 555 (4.2%) |
| Total | 12,243 (100.0%) | 13,361 (100.0%) |
Commute Time in Darlington County
The most frequently occuring commute durations in Darlington County are 10 to 14 minutes (4,752 commuters, 19.2%), 20 to 24 minutes (4,532 commuters, 18.3%), and 15 to 19 minutes (4,013 commuters, 16.2%).
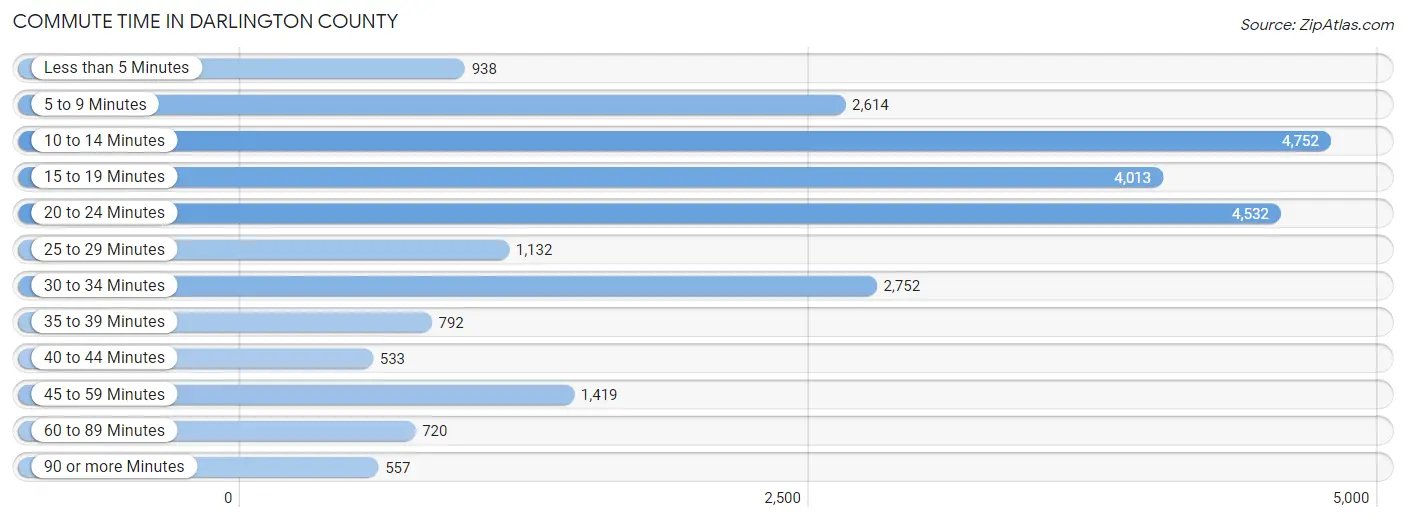
| Commute Time | # Commuters | % Commuters |
| Less than 5 Minutes | 938 | 3.8% |
| 5 to 9 Minutes | 2,614 | 10.6% |
| 10 to 14 Minutes | 4,752 | 19.2% |
| 15 to 19 Minutes | 4,013 | 16.2% |
| 20 to 24 Minutes | 4,532 | 18.3% |
| 25 to 29 Minutes | 1,132 | 4.6% |
| 30 to 34 Minutes | 2,752 | 11.1% |
| 35 to 39 Minutes | 792 | 3.2% |
| 40 to 44 Minutes | 533 | 2.1% |
| 45 to 59 Minutes | 1,419 | 5.7% |
| 60 to 89 Minutes | 720 | 2.9% |
| 90 or more Minutes | 557 | 2.2% |
Commute Time by Sex in Darlington County
The most common commute times in Darlington County are 10 to 14 minutes (2,263 commuters, 19.3%) for males and 10 to 14 minutes (2,489 commuters, 19.1%) for females.
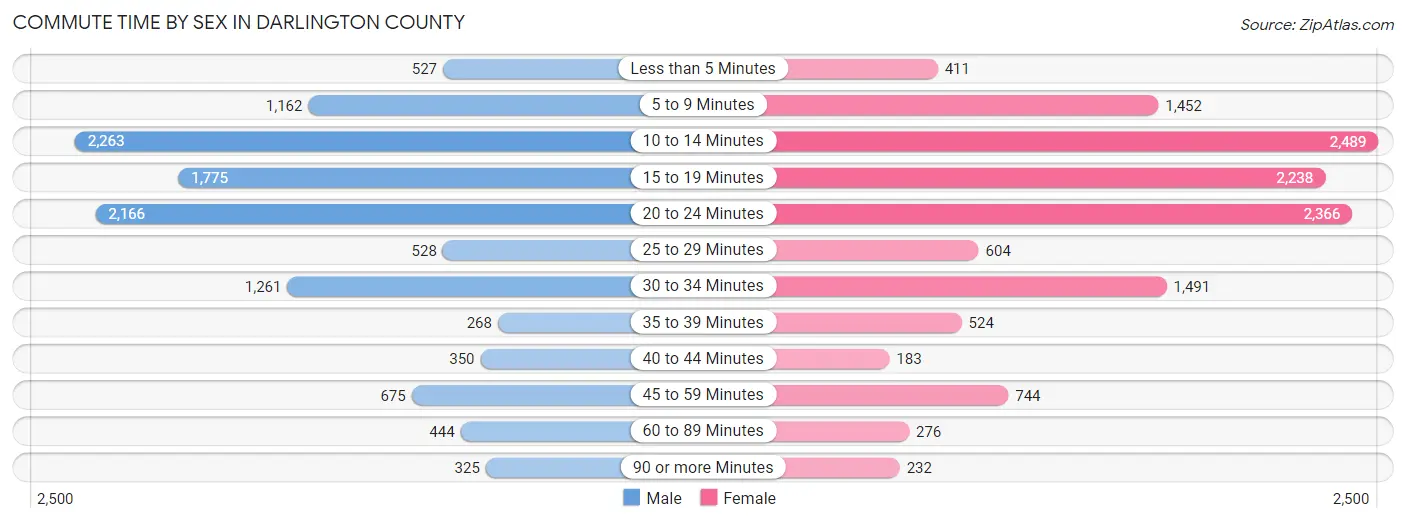
| Commute Time | Male | Female |
| Less than 5 Minutes | 527 (4.5%) | 411 (3.2%) |
| 5 to 9 Minutes | 1,162 (9.9%) | 1,452 (11.2%) |
| 10 to 14 Minutes | 2,263 (19.3%) | 2,489 (19.1%) |
| 15 to 19 Minutes | 1,775 (15.1%) | 2,238 (17.2%) |
| 20 to 24 Minutes | 2,166 (18.4%) | 2,366 (18.2%) |
| 25 to 29 Minutes | 528 (4.5%) | 604 (4.6%) |
| 30 to 34 Minutes | 1,261 (10.7%) | 1,491 (11.5%) |
| 35 to 39 Minutes | 268 (2.3%) | 524 (4.0%) |
| 40 to 44 Minutes | 350 (3.0%) | 183 (1.4%) |
| 45 to 59 Minutes | 675 (5.8%) | 744 (5.7%) |
| 60 to 89 Minutes | 444 (3.8%) | 276 (2.1%) |
| 90 or more Minutes | 325 (2.8%) | 232 (1.8%) |
Time of Departure to Work by Sex in Darlington County
The most frequent times of departure to work in Darlington County are 7:00 AM to 7:29 AM (1,818, 15.5%) for males and 7:00 AM to 7:29 AM (2,379, 18.3%) for females.
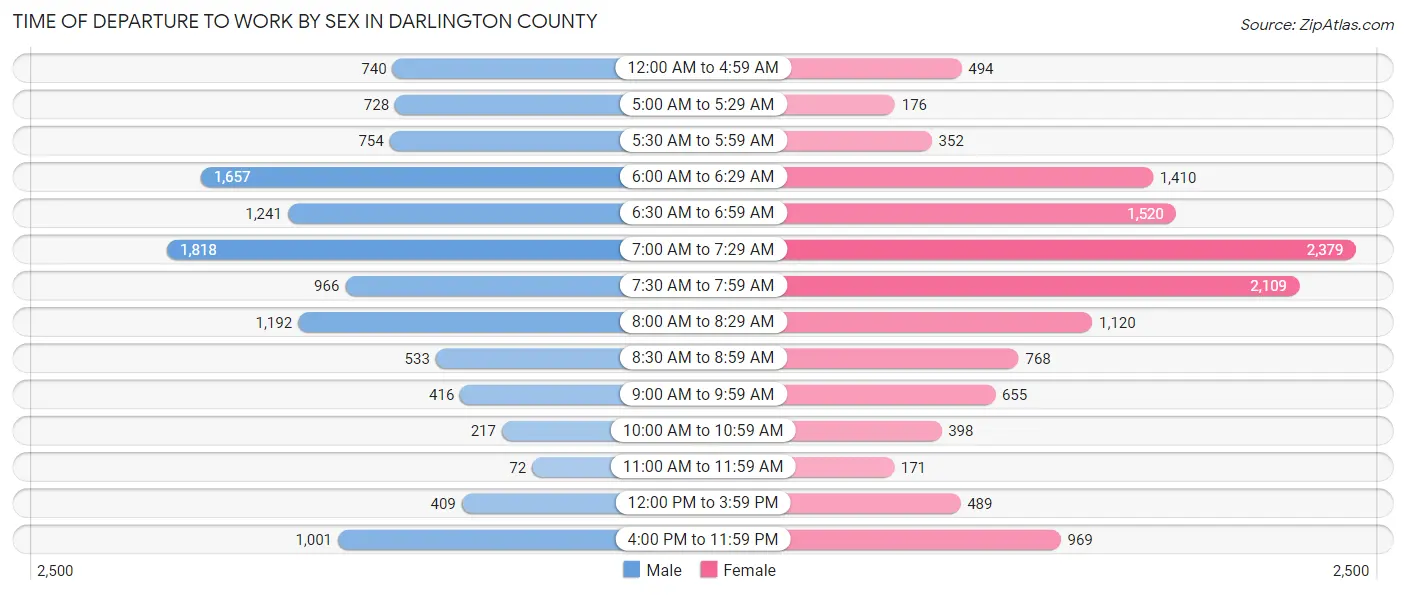
| Time of Departure | Male | Female |
| 12:00 AM to 4:59 AM | 740 (6.3%) | 494 (3.8%) |
| 5:00 AM to 5:29 AM | 728 (6.2%) | 176 (1.3%) |
| 5:30 AM to 5:59 AM | 754 (6.4%) | 352 (2.7%) |
| 6:00 AM to 6:29 AM | 1,657 (14.1%) | 1,410 (10.8%) |
| 6:30 AM to 6:59 AM | 1,241 (10.6%) | 1,520 (11.7%) |
| 7:00 AM to 7:29 AM | 1,818 (15.5%) | 2,379 (18.3%) |
| 7:30 AM to 7:59 AM | 966 (8.2%) | 2,109 (16.2%) |
| 8:00 AM to 8:29 AM | 1,192 (10.2%) | 1,120 (8.6%) |
| 8:30 AM to 8:59 AM | 533 (4.5%) | 768 (5.9%) |
| 9:00 AM to 9:59 AM | 416 (3.5%) | 655 (5.0%) |
| 10:00 AM to 10:59 AM | 217 (1.8%) | 398 (3.1%) |
| 11:00 AM to 11:59 AM | 72 (0.6%) | 171 (1.3%) |
| 12:00 PM to 3:59 PM | 409 (3.5%) | 489 (3.8%) |
| 4:00 PM to 11:59 PM | 1,001 (8.5%) | 969 (7.4%) |
| Total | 11,744 (100.0%) | 13,010 (100.0%) |
Housing Occupancy in Darlington County
Occupancy by Ownership in Darlington County
Of the total 25,022 dwellings in Darlington County, owner-occupied units account for 17,280 (69.1%), while renter-occupied units make up 7,742 (30.9%).
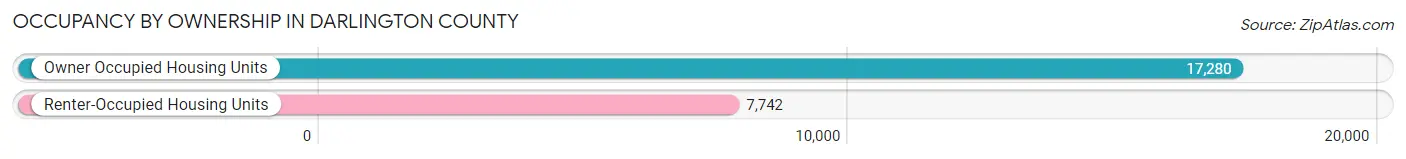
| Occupancy | # Housing Units | % Housing Units |
| Owner Occupied Housing Units | 17,280 | 69.1% |
| Renter-Occupied Housing Units | 7,742 | 30.9% |
| Total Occupied Housing Units | 25,022 | 100.0% |
Occupancy by Household Size in Darlington County
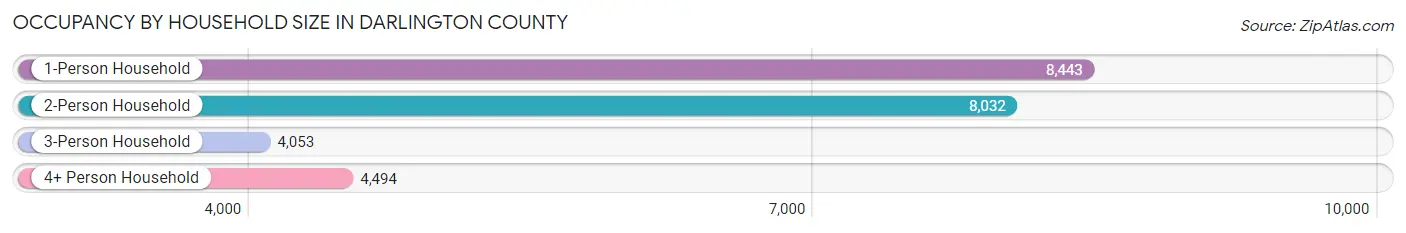
| Household Size | # Housing Units | % Housing Units |
| 1-Person Household | 8,443 | 33.7% |
| 2-Person Household | 8,032 | 32.1% |
| 3-Person Household | 4,053 | 16.2% |
| 4+ Person Household | 4,494 | 18.0% |
| Total Housing Units | 25,022 | 100.0% |
Occupancy by Ownership by Household Size in Darlington County
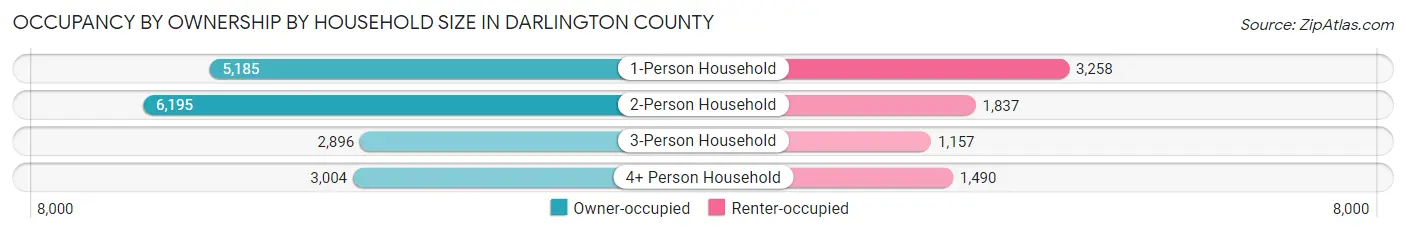
| Household Size | Owner-occupied | Renter-occupied |
| 1-Person Household | 5,185 (61.4%) | 3,258 (38.6%) |
| 2-Person Household | 6,195 (77.1%) | 1,837 (22.9%) |
| 3-Person Household | 2,896 (71.5%) | 1,157 (28.5%) |
| 4+ Person Household | 3,004 (66.8%) | 1,490 (33.2%) |
| Total Housing Units | 17,280 (69.1%) | 7,742 (30.9%) |
Occupancy by Educational Attainment in Darlington County
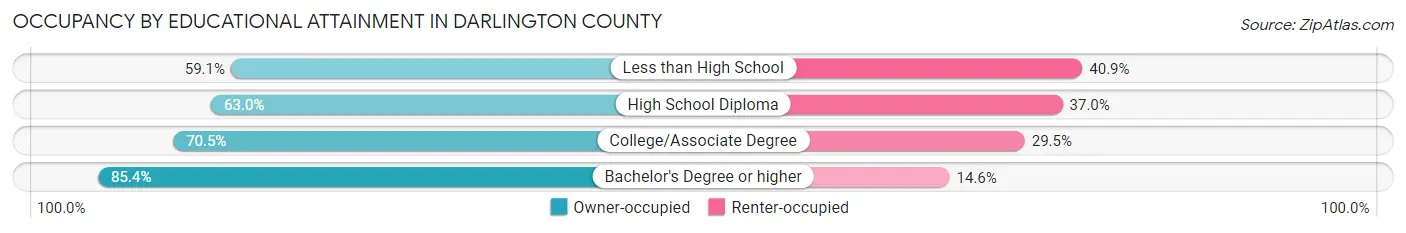
| Household Size | Owner-occupied | Renter-occupied |
| Less than High School | 1,945 (59.1%) | 1,345 (40.9%) |
| High School Diploma | 5,935 (63.0%) | 3,480 (37.0%) |
| College/Associate Degree | 5,315 (70.5%) | 2,221 (29.5%) |
| Bachelor's Degree or higher | 4,085 (85.4%) | 696 (14.6%) |
Occupancy by Age of Householder in Darlington County
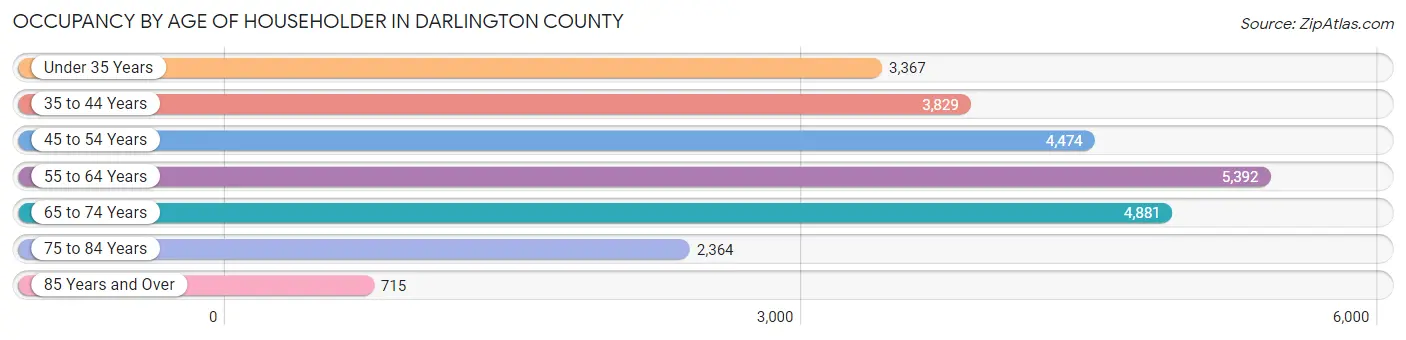
| Age Bracket | # Households | % Households |
| Under 35 Years | 3,367 | 13.5% |
| 35 to 44 Years | 3,829 | 15.3% |
| 45 to 54 Years | 4,474 | 17.9% |
| 55 to 64 Years | 5,392 | 21.5% |
| 65 to 74 Years | 4,881 | 19.5% |
| 75 to 84 Years | 2,364 | 9.5% |
| 85 Years and Over | 715 | 2.9% |
| Total | 25,022 | 100.0% |
Housing Finances in Darlington County
Median Income by Occupancy in Darlington County
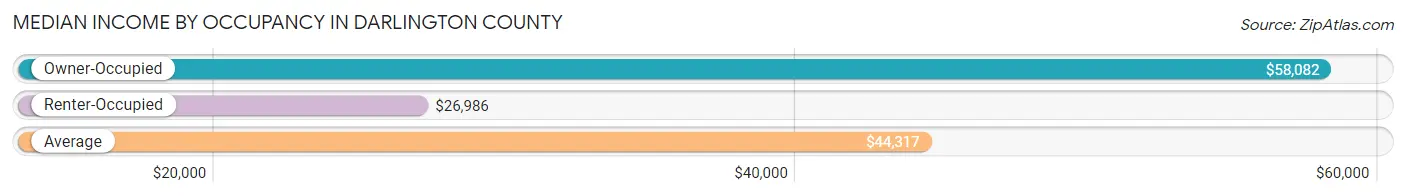
| Occupancy Type | # Households | Median Income |
| Owner-Occupied | 17,280 (69.1%) | $58,082 |
| Renter-Occupied | 7,742 (30.9%) | $26,986 |
| Average | 25,022 (100.0%) | $44,317 |
Occupancy by Householder Income Bracket in Darlington County
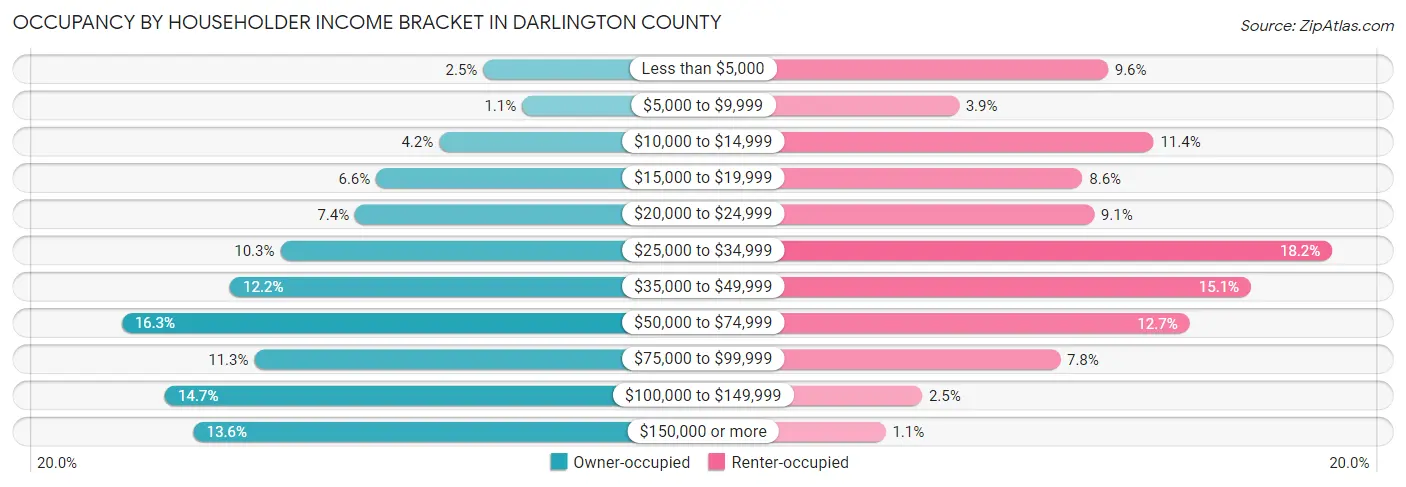
| Income Bracket | Owner-occupied | Renter-occupied |
| Less than $5,000 | 438 (2.5%) | 744 (9.6%) |
| $5,000 to $9,999 | 181 (1.1%) | 304 (3.9%) |
| $10,000 to $14,999 | 727 (4.2%) | 879 (11.4%) |
| $15,000 to $19,999 | 1,143 (6.6%) | 669 (8.6%) |
| $20,000 to $24,999 | 1,281 (7.4%) | 703 (9.1%) |
| $25,000 to $34,999 | 1,773 (10.3%) | 1,405 (18.1%) |
| $35,000 to $49,999 | 2,103 (12.2%) | 1,166 (15.1%) |
| $50,000 to $74,999 | 2,816 (16.3%) | 985 (12.7%) |
| $75,000 to $99,999 | 1,944 (11.3%) | 603 (7.8%) |
| $100,000 to $149,999 | 2,531 (14.6%) | 196 (2.5%) |
| $150,000 or more | 2,343 (13.6%) | 88 (1.1%) |
| Total | 17,280 (100.0%) | 7,742 (100.0%) |
Monthly Housing Cost Tiers in Darlington County
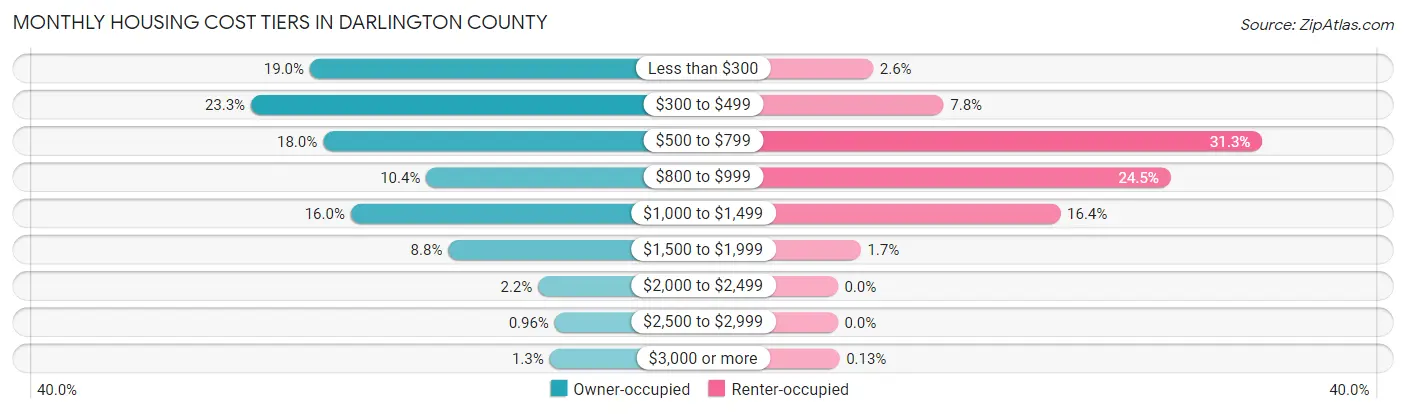
| Monthly Cost | Owner-occupied | Renter-occupied |
| Less than $300 | 3,282 (19.0%) | 202 (2.6%) |
| $300 to $499 | 4,031 (23.3%) | 604 (7.8%) |
| $500 to $799 | 3,113 (18.0%) | 2,422 (31.3%) |
| $800 to $999 | 1,800 (10.4%) | 1,900 (24.5%) |
| $1,000 to $1,499 | 2,761 (16.0%) | 1,270 (16.4%) |
| $1,500 to $1,999 | 1,520 (8.8%) | 132 (1.7%) |
| $2,000 to $2,499 | 376 (2.2%) | 0 (0.0%) |
| $2,500 to $2,999 | 166 (1.0%) | 0 (0.0%) |
| $3,000 or more | 231 (1.3%) | 10 (0.1%) |
| Total | 17,280 (100.0%) | 7,742 (100.0%) |
Physical Housing Characteristics in Darlington County
Housing Structures in Darlington County
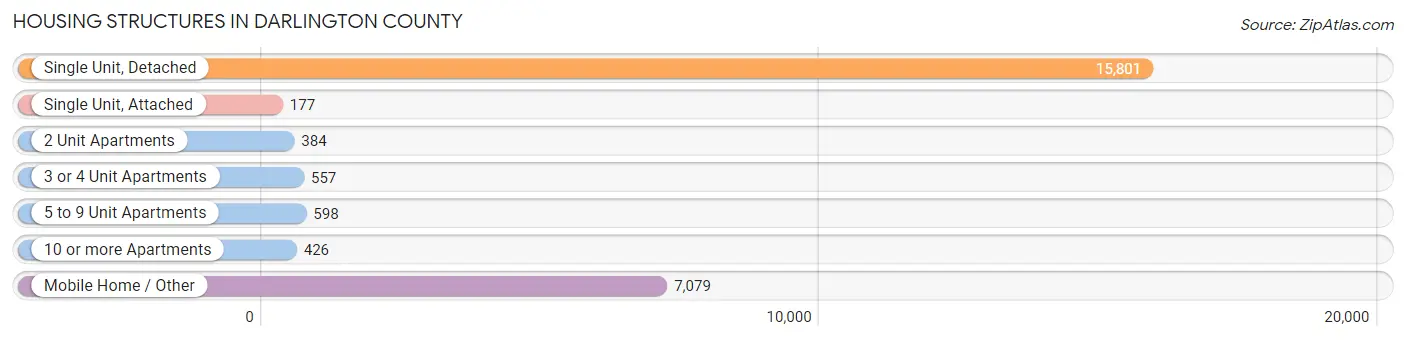
| Structure Type | # Housing Units | % Housing Units |
| Single Unit, Detached | 15,801 | 63.1% |
| Single Unit, Attached | 177 | 0.7% |
| 2 Unit Apartments | 384 | 1.5% |
| 3 or 4 Unit Apartments | 557 | 2.2% |
| 5 to 9 Unit Apartments | 598 | 2.4% |
| 10 or more Apartments | 426 | 1.7% |
| Mobile Home / Other | 7,079 | 28.3% |
| Total | 25,022 | 100.0% |
Housing Structures by Occupancy in Darlington County
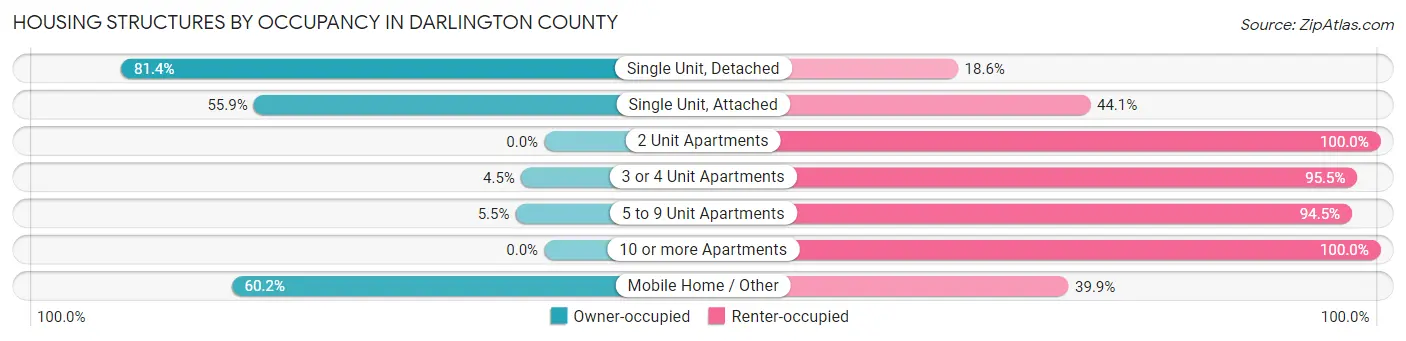
| Structure Type | Owner-occupied | Renter-occupied |
| Single Unit, Detached | 12,865 (81.4%) | 2,936 (18.6%) |
| Single Unit, Attached | 99 (55.9%) | 78 (44.1%) |
| 2 Unit Apartments | 0 (0.0%) | 384 (100.0%) |
| 3 or 4 Unit Apartments | 25 (4.5%) | 532 (95.5%) |
| 5 to 9 Unit Apartments | 33 (5.5%) | 565 (94.5%) |
| 10 or more Apartments | 0 (0.0%) | 426 (100.0%) |
| Mobile Home / Other | 4,258 (60.2%) | 2,821 (39.9%) |
| Total | 17,280 (69.1%) | 7,742 (30.9%) |
Housing Structures by Number of Rooms in Darlington County
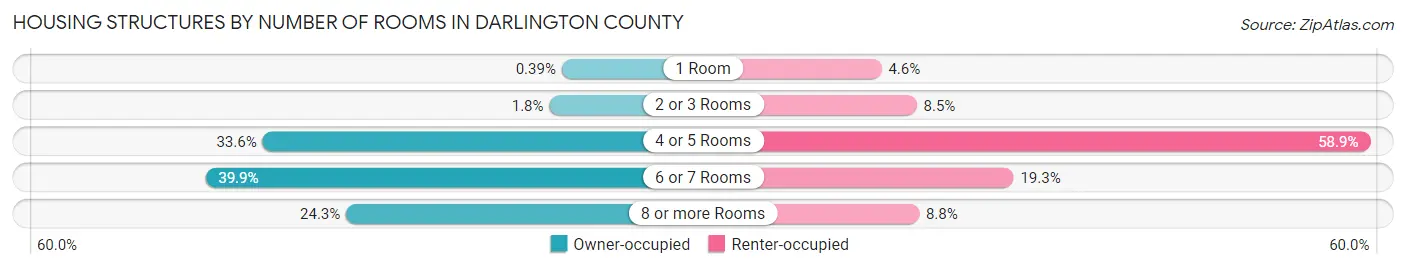
| Number of Rooms | Owner-occupied | Renter-occupied |
| 1 Room | 67 (0.4%) | 357 (4.6%) |
| 2 or 3 Rooms | 304 (1.8%) | 659 (8.5%) |
| 4 or 5 Rooms | 5,806 (33.6%) | 4,556 (58.9%) |
| 6 or 7 Rooms | 6,901 (39.9%) | 1,491 (19.3%) |
| 8 or more Rooms | 4,202 (24.3%) | 679 (8.8%) |
| Total | 17,280 (100.0%) | 7,742 (100.0%) |
Housing Structure by Heating Type in Darlington County
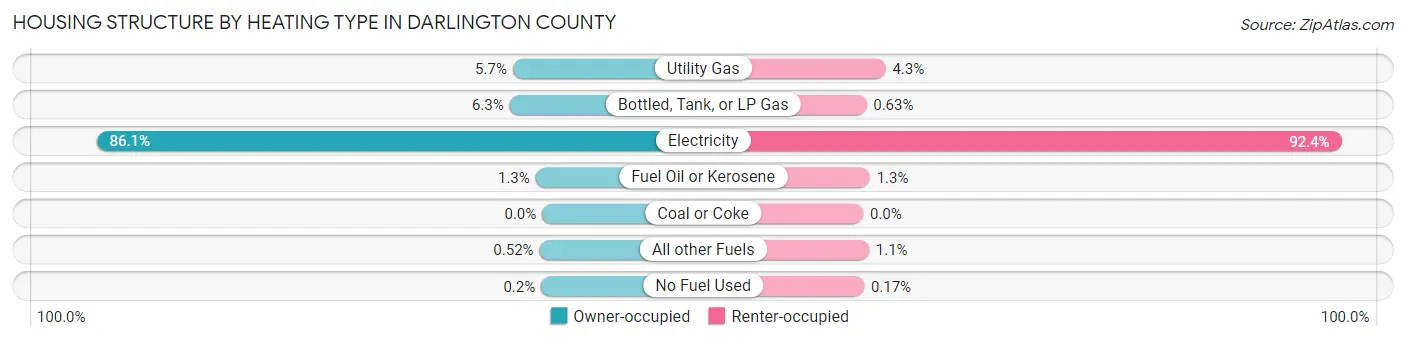
| Heating Type | Owner-occupied | Renter-occupied |
| Utility Gas | 979 (5.7%) | 336 (4.3%) |
| Bottled, Tank, or LP Gas | 1,087 (6.3%) | 49 (0.6%) |
| Electricity | 14,873 (86.1%) | 7,157 (92.4%) |
| Fuel Oil or Kerosene | 217 (1.3%) | 100 (1.3%) |
| Coal or Coke | 0 (0.0%) | 0 (0.0%) |
| All other Fuels | 89 (0.5%) | 87 (1.1%) |
| No Fuel Used | 35 (0.2%) | 13 (0.2%) |
| Total | 17,280 (100.0%) | 7,742 (100.0%) |
Household Vehicle Usage in Darlington County
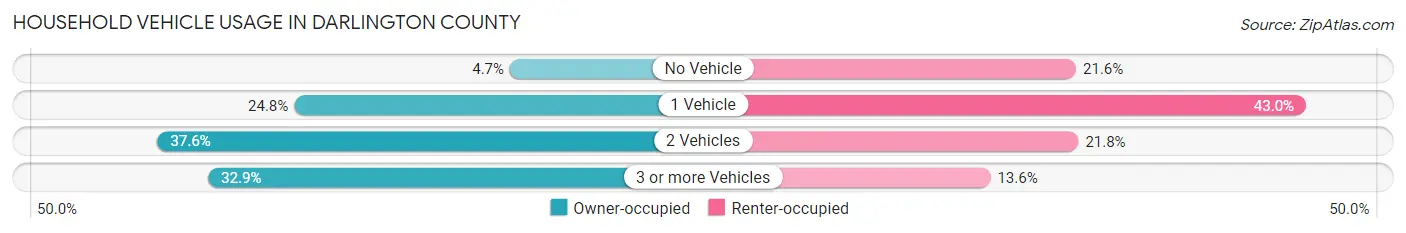
| Vehicles per Household | Owner-occupied | Renter-occupied |
| No Vehicle | 812 (4.7%) | 1,671 (21.6%) |
| 1 Vehicle | 4,292 (24.8%) | 3,331 (43.0%) |
| 2 Vehicles | 6,498 (37.6%) | 1,688 (21.8%) |
| 3 or more Vehicles | 5,678 (32.9%) | 1,052 (13.6%) |
| Total | 17,280 (100.0%) | 7,742 (100.0%) |
Real Estate & Mortgages in Darlington County
Real Estate and Mortgage Overview in Darlington County
| Characteristic | Without Mortgage | With Mortgage |
| Housing Units | 9,538 | 7,742 |
| Median Property Value | $93,800 | $166,000 |
| Median Household Income | $42,510 | $1,704 |
| Monthly Housing Costs | $362 | $205 |
| Real Estate Taxes | $457 | $157 |
Property Value by Mortgage Status in Darlington County
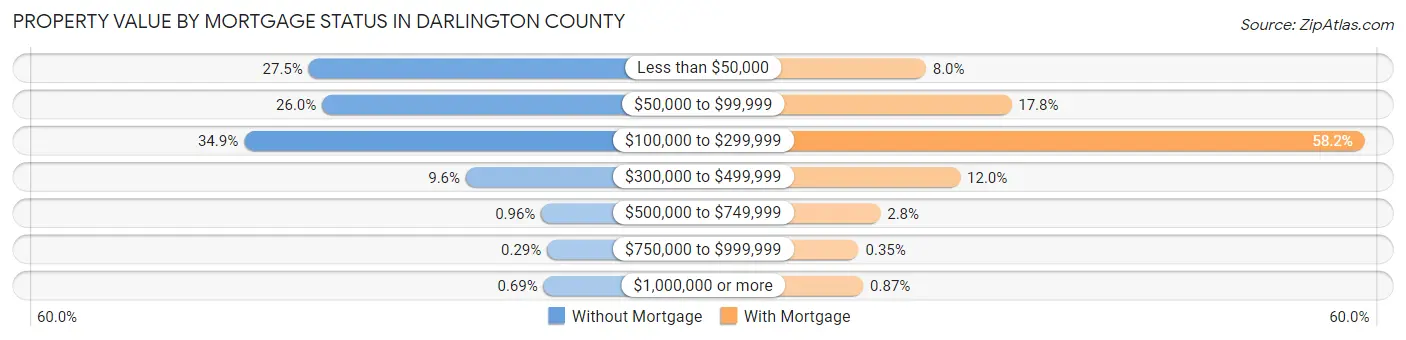
| Property Value | Without Mortgage | With Mortgage |
| Less than $50,000 | 2,627 (27.5%) | 622 (8.0%) |
| $50,000 to $99,999 | 2,480 (26.0%) | 1,378 (17.8%) |
| $100,000 to $299,999 | 3,332 (34.9%) | 4,504 (58.2%) |
| $300,000 to $499,999 | 913 (9.6%) | 925 (11.9%) |
| $500,000 to $749,999 | 92 (1.0%) | 219 (2.8%) |
| $750,000 to $999,999 | 28 (0.3%) | 27 (0.4%) |
| $1,000,000 or more | 66 (0.7%) | 67 (0.9%) |
| Total | 9,538 (100.0%) | 7,742 (100.0%) |
Household Income by Mortgage Status in Darlington County
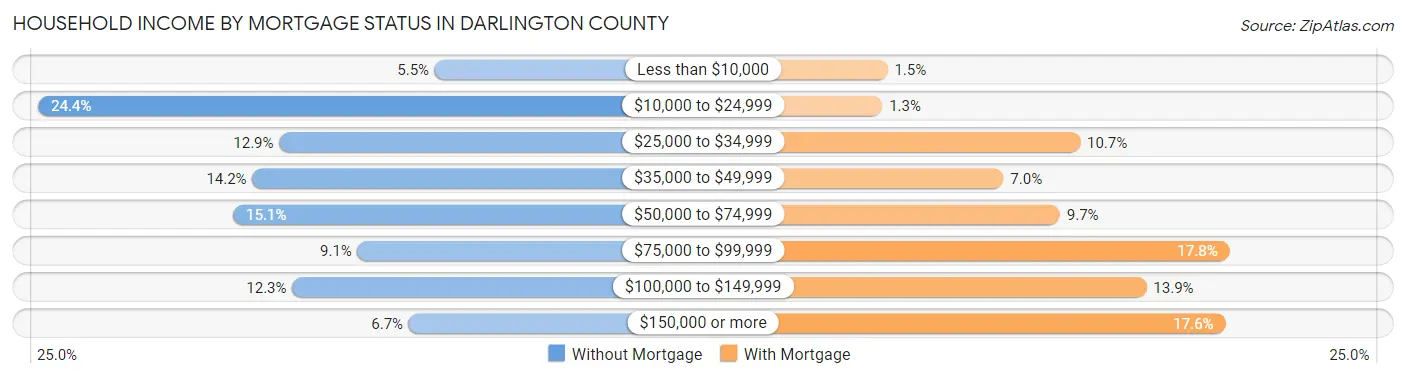
| Household Income | Without Mortgage | With Mortgage |
| Less than $10,000 | 521 (5.5%) | 118 (1.5%) |
| $10,000 to $24,999 | 2,323 (24.4%) | 98 (1.3%) |
| $25,000 to $34,999 | 1,228 (12.9%) | 828 (10.7%) |
| $35,000 to $49,999 | 1,350 (14.1%) | 545 (7.0%) |
| $50,000 to $74,999 | 1,437 (15.1%) | 753 (9.7%) |
| $75,000 to $99,999 | 872 (9.1%) | 1,379 (17.8%) |
| $100,000 to $149,999 | 1,168 (12.2%) | 1,072 (13.9%) |
| $150,000 or more | 639 (6.7%) | 1,363 (17.6%) |
| Total | 9,538 (100.0%) | 7,742 (100.0%) |
Property Value to Household Income Ratio in Darlington County
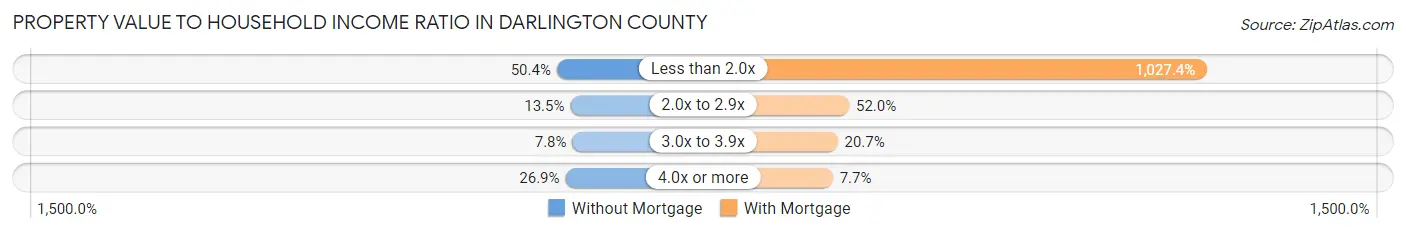
| Value-to-Income Ratio | Without Mortgage | With Mortgage |
| Less than 2.0x | 4,806 (50.4%) | 79,541 (1,027.4%) |
| 2.0x to 2.9x | 1,289 (13.5%) | 4,028 (52.0%) |
| 3.0x to 3.9x | 748 (7.8%) | 1,603 (20.7%) |
| 4.0x or more | 2,561 (26.9%) | 592 (7.6%) |
| Total | 9,538 (100.0%) | 7,742 (100.0%) |
Real Estate Taxes by Mortgage Status in Darlington County
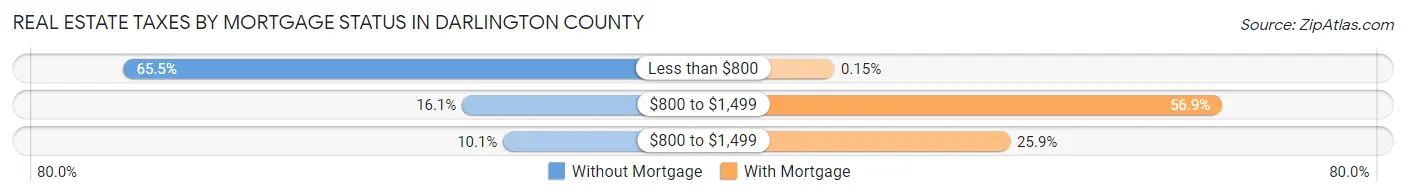
| Property Taxes | Without Mortgage | With Mortgage |
| Less than $800 | 6,251 (65.5%) | 12 (0.2%) |
| $800 to $1,499 | 1,532 (16.1%) | 4,402 (56.9%) |
| $800 to $1,499 | 960 (10.1%) | 2,004 (25.9%) |
| Total | 9,538 (100.0%) | 7,742 (100.0%) |
Health & Disability in Darlington County
Health Insurance Coverage by Age in Darlington County
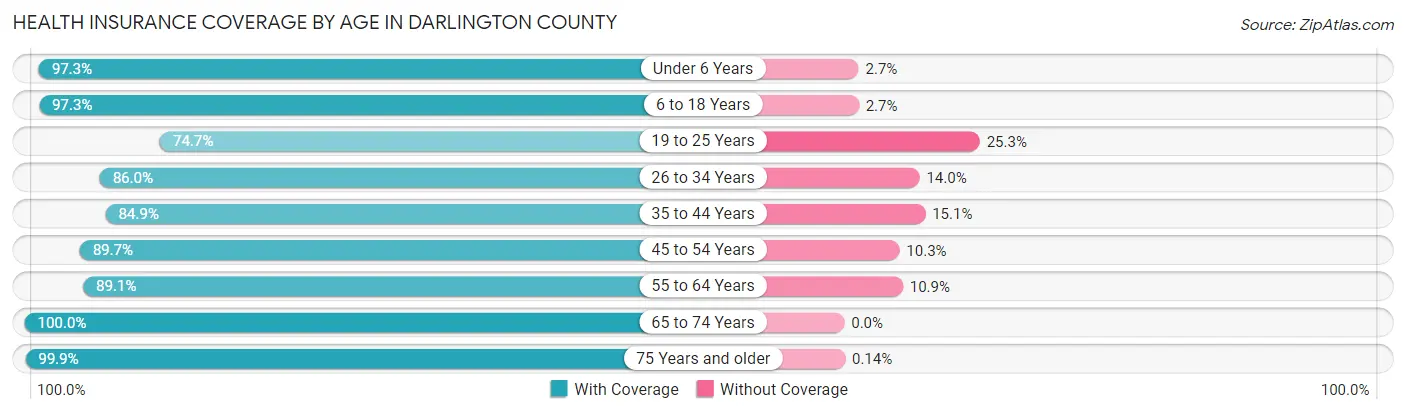
| Age Bracket | With Coverage | Without Coverage |
| Under 6 Years | 3,919 (97.3%) | 107 (2.7%) |
| 6 to 18 Years | 10,657 (97.3%) | 295 (2.7%) |
| 19 to 25 Years | 4,054 (74.7%) | 1,370 (25.3%) |
| 26 to 34 Years | 5,821 (86.0%) | 949 (14.0%) |
| 35 to 44 Years | 5,813 (84.9%) | 1,033 (15.1%) |
| 45 to 54 Years | 7,132 (89.7%) | 817 (10.3%) |
| 55 to 64 Years | 7,700 (89.1%) | 943 (10.9%) |
| 65 to 74 Years | 7,378 (100.0%) | 0 (0.0%) |
| 75 Years and older | 4,316 (99.9%) | 6 (0.1%) |
| Total | 56,790 (91.1%) | 5,520 (8.9%) |
Health Insurance Coverage by Citizenship Status in Darlington County
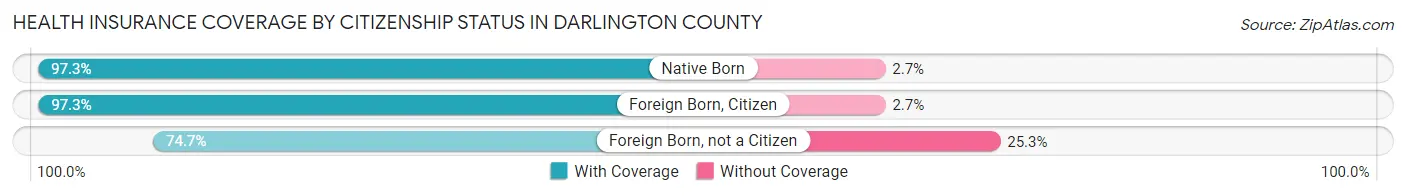
| Citizenship Status | With Coverage | Without Coverage |
| Native Born | 3,919 (97.3%) | 107 (2.7%) |
| Foreign Born, Citizen | 10,657 (97.3%) | 295 (2.7%) |
| Foreign Born, not a Citizen | 4,054 (74.7%) | 1,370 (25.3%) |
Health Insurance Coverage by Household Income in Darlington County
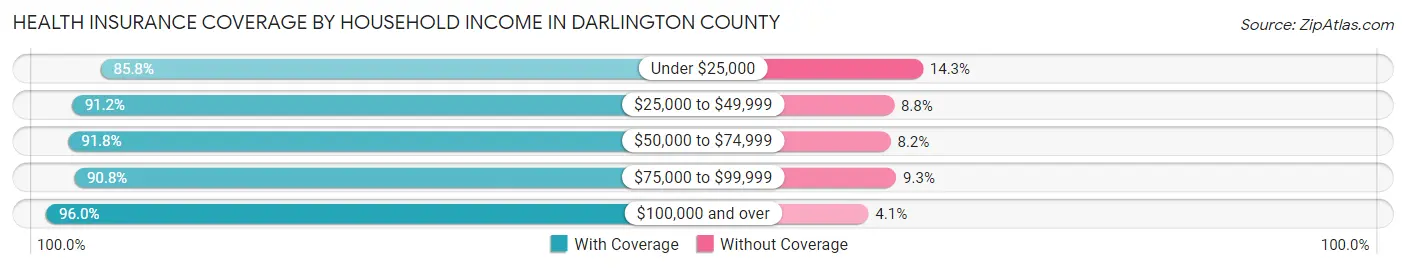
| Household Income | With Coverage | Without Coverage |
| Under $25,000 | 11,161 (85.8%) | 1,855 (14.2%) |
| $25,000 to $49,999 | 13,284 (91.2%) | 1,287 (8.8%) |
| $50,000 to $74,999 | 8,868 (91.8%) | 791 (8.2%) |
| $75,000 to $99,999 | 7,033 (90.7%) | 717 (9.2%) |
| $100,000 and over | 15,951 (96.0%) | 674 (4.1%) |
Public vs Private Health Insurance Coverage by Age in Darlington County
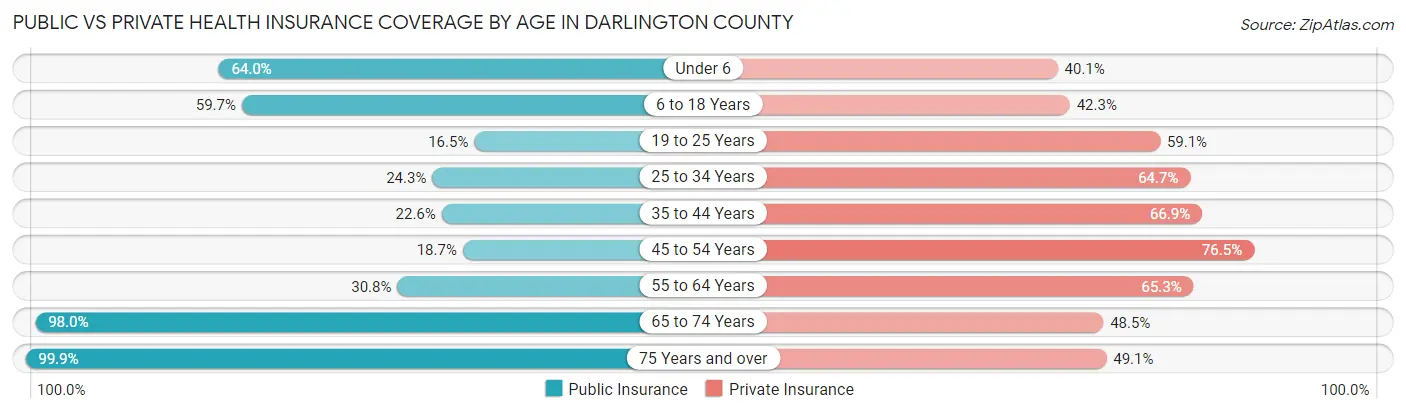
| Age Bracket | Public Insurance | Private Insurance |
| Under 6 | 2,577 (64.0%) | 1,613 (40.1%) |
| 6 to 18 Years | 6,536 (59.7%) | 4,634 (42.3%) |
| 19 to 25 Years | 897 (16.5%) | 3,203 (59.1%) |
| 25 to 34 Years | 1,648 (24.3%) | 4,378 (64.7%) |
| 35 to 44 Years | 1,547 (22.6%) | 4,577 (66.9%) |
| 45 to 54 Years | 1,485 (18.7%) | 6,081 (76.5%) |
| 55 to 64 Years | 2,664 (30.8%) | 5,643 (65.3%) |
| 65 to 74 Years | 7,232 (98.0%) | 3,580 (48.5%) |
| 75 Years and over | 4,316 (99.9%) | 2,122 (49.1%) |
| Total | 28,902 (46.4%) | 35,831 (57.5%) |
Disability Status by Sex by Age in Darlington County
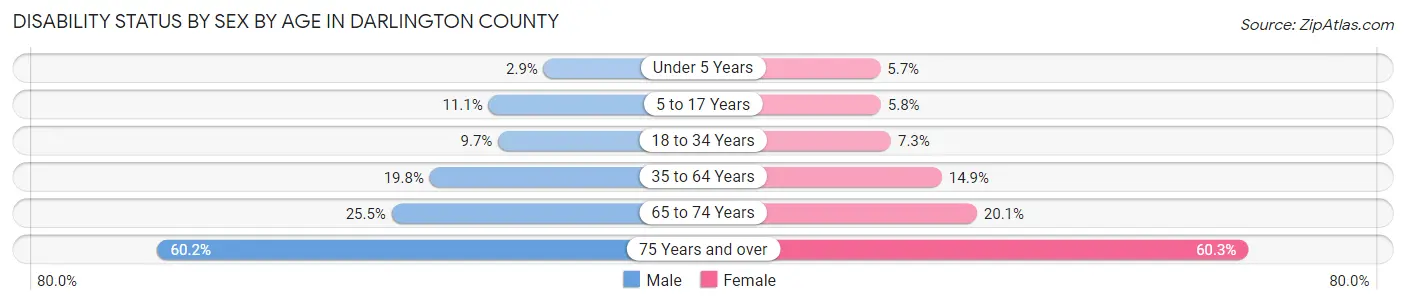
| Age Bracket | Male | Female |
| Under 5 Years | 53 (2.9%) | 95 (5.7%) |
| 5 to 17 Years | 600 (11.1%) | 295 (5.8%) |
| 18 to 34 Years | 618 (9.7%) | 499 (7.3%) |
| 35 to 64 Years | 2,178 (19.8%) | 1,851 (14.9%) |
| 65 to 74 Years | 864 (25.5%) | 800 (20.1%) |
| 75 Years and over | 1,065 (60.2%) | 1,541 (60.3%) |
Disability Class by Sex by Age in Darlington County
Disability Class: Hearing Difficulty
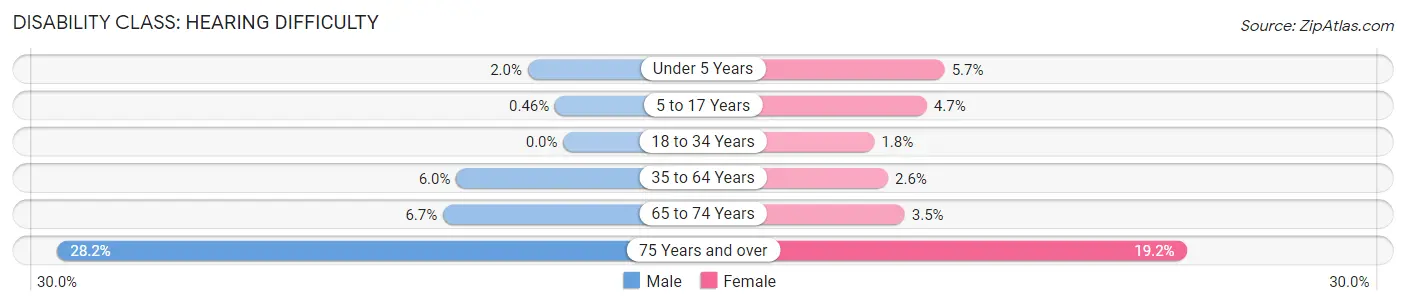
| Age Bracket | Male | Female |
| Under 5 Years | 36 (2.0%) | 95 (5.7%) |
| 5 to 17 Years | 25 (0.5%) | 241 (4.7%) |
| 18 to 34 Years | 0 (0.0%) | 124 (1.8%) |
| 35 to 64 Years | 654 (6.0%) | 321 (2.6%) |
| 65 to 74 Years | 227 (6.7%) | 140 (3.5%) |
| 75 Years and over | 498 (28.2%) | 490 (19.2%) |
Disability Class: Vision Difficulty
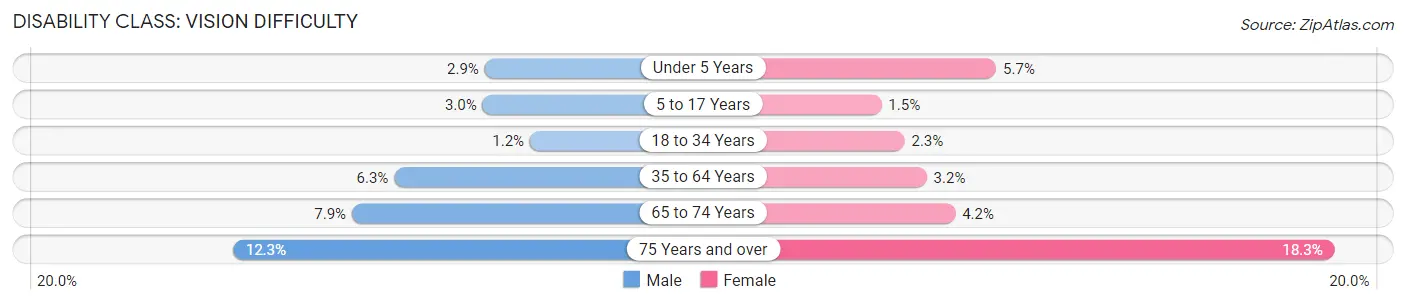
| Age Bracket | Male | Female |
| Under 5 Years | 53 (2.9%) | 95 (5.7%) |
| 5 to 17 Years | 162 (3.0%) | 75 (1.5%) |
| 18 to 34 Years | 79 (1.2%) | 159 (2.3%) |
| 35 to 64 Years | 690 (6.3%) | 393 (3.2%) |
| 65 to 74 Years | 266 (7.9%) | 168 (4.2%) |
| 75 Years and over | 217 (12.3%) | 467 (18.3%) |
Disability Class: Cognitive Difficulty
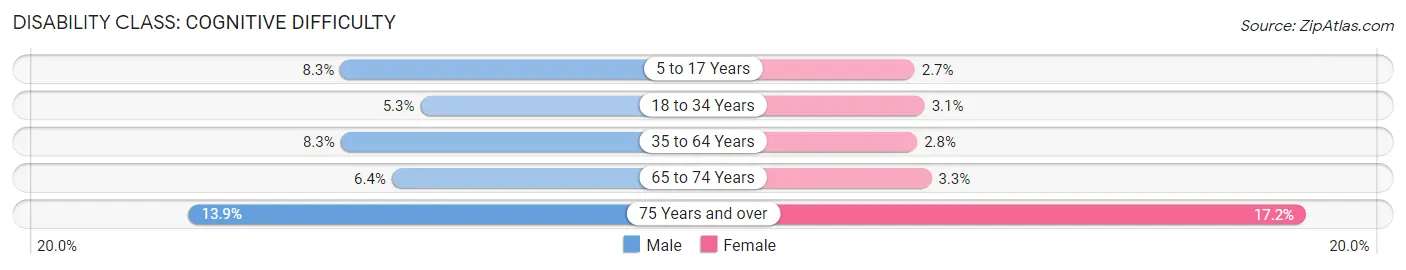
| Age Bracket | Male | Female |
| 5 to 17 Years | 448 (8.3%) | 138 (2.7%) |
| 18 to 34 Years | 339 (5.3%) | 210 (3.1%) |
| 35 to 64 Years | 908 (8.3%) | 349 (2.8%) |
| 65 to 74 Years | 216 (6.4%) | 133 (3.3%) |
| 75 Years and over | 246 (13.9%) | 440 (17.2%) |
Disability Class: Ambulatory Difficulty
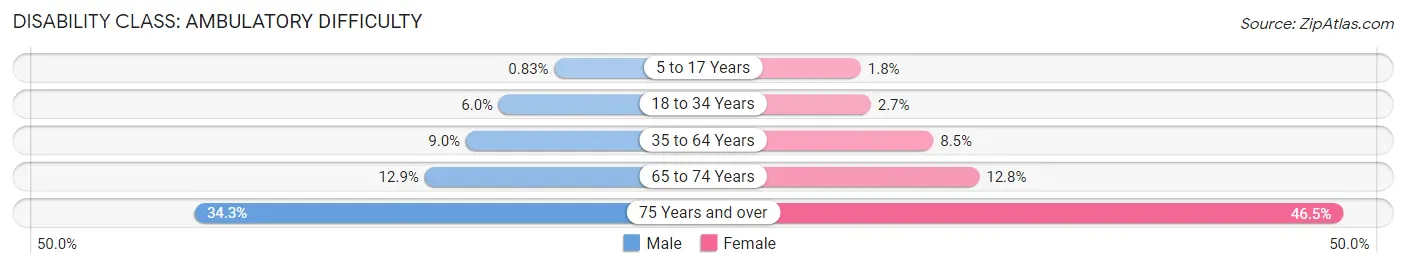
| Age Bracket | Male | Female |
| 5 to 17 Years | 45 (0.8%) | 90 (1.8%) |
| 18 to 34 Years | 382 (6.0%) | 184 (2.7%) |
| 35 to 64 Years | 992 (9.0%) | 1,058 (8.5%) |
| 65 to 74 Years | 436 (12.9%) | 509 (12.8%) |
| 75 Years and over | 606 (34.3%) | 1,188 (46.5%) |
Disability Class: Self-Care Difficulty
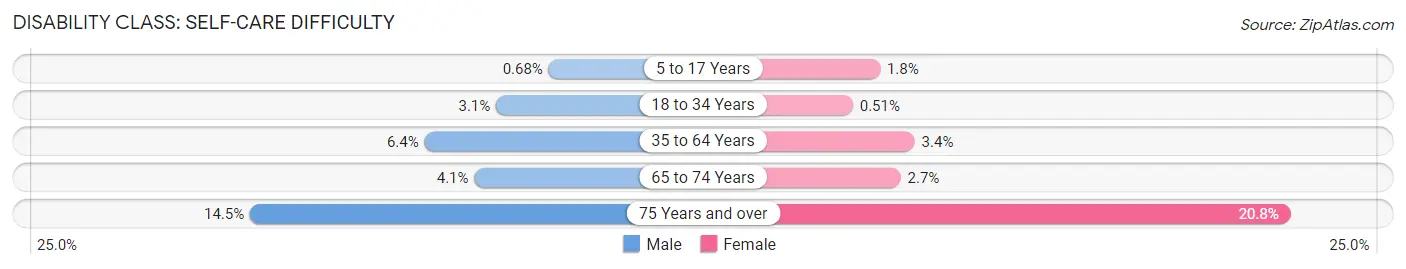
| Age Bracket | Male | Female |
| 5 to 17 Years | 37 (0.7%) | 90 (1.8%) |
| 18 to 34 Years | 199 (3.1%) | 35 (0.5%) |
| 35 to 64 Years | 707 (6.4%) | 421 (3.4%) |
| 65 to 74 Years | 140 (4.1%) | 109 (2.7%) |
| 75 Years and over | 257 (14.5%) | 532 (20.8%) |
Technology Access in Darlington County
Computing Device Access in Darlington County
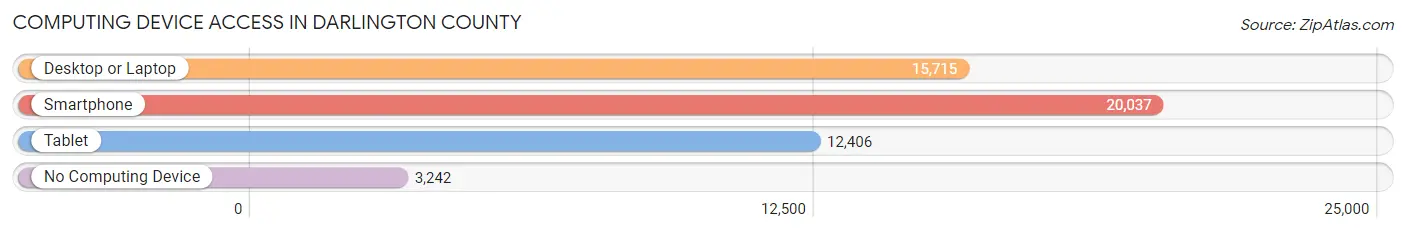
| Device Type | # Households | % Households |
| Desktop or Laptop | 15,715 | 62.8% |
| Smartphone | 20,037 | 80.1% |
| Tablet | 12,406 | 49.6% |
| No Computing Device | 3,242 | 13.0% |
| Total | 25,022 | 100.0% |
Internet Access in Darlington County
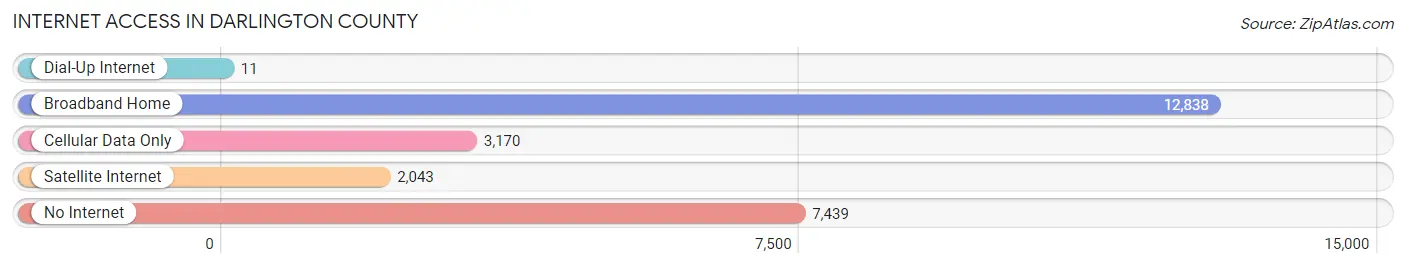
| Internet Type | # Households | % Households |
| Dial-Up Internet | 11 | 0.0% |
| Broadband Home | 12,838 | 51.3% |
| Cellular Data Only | 3,170 | 12.7% |
| Satellite Internet | 2,043 | 8.2% |
| No Internet | 7,439 | 29.7% |
| Total | 25,022 | 100.0% |
Darlington County Summary
Darlington County, South Carolina is located in the northeastern part of the state and is part of the Pee Dee region. It is bordered by Florence County to the north, Lee County to the east, Marlboro County to the south, and Chesterfield County to the west. The county seat is Darlington, and the largest city is Hartsville. The county was established in 1785 and named for the Earl of Darlington.
Geography
Darlington County covers an area of 590 square miles and is located in the Pee Dee region of South Carolina. The terrain is mostly flat, with some rolling hills in the northern part of the county. The county is drained by the Great Pee Dee River, which forms the western border of the county. Other major waterways include the Lynches River, which forms the eastern border, and the Little Pee Dee River, which flows through the center of the county. The county is mostly rural, with some small towns and villages scattered throughout.
Climate
Darlington County has a humid subtropical climate, with hot, humid summers and mild winters. The average annual temperature is around 70°F, with average highs in the summer reaching the mid-90s and average lows in the winter reaching the mid-30s. The average annual precipitation is around 45 inches, with most of it falling in the summer months.
Demographics
As of the 2010 census, Darlington County had a population of 68,681. The population was 54.2% White, 40.3% African American, 0.5% Native American, 1.7% Asian, 0.1% Pacific Islander, 1.7% from other races, and 1.5% from two or more races. Hispanic or Latino of any race were 3.3% of the population.
The median household income was $35,845, and the median family income was $43,945. The per capita income was $18,945. About 19.2% of the population was below the poverty line.
Economy
The economy of Darlington County is largely based on agriculture, with tobacco, cotton, and soybeans being the main crops. The county is also home to several manufacturing companies, including Sonoco Products Company, which produces paper and plastic products, and Hartsville Oil Mill, which produces cottonseed oil. The county is also home to several educational institutions, including Coker College and Florence-Darlington Technical College.
The county is served by two major highways, Interstate 20 and US Highway 52. The county is also served by the Darlington County Airport, which offers general aviation services.
Conclusion
Darlington County, South Carolina is a rural county located in the northeastern part of the state. It is mostly agricultural, with tobacco, cotton, and soybeans being the main crops. The county is also home to several manufacturing companies and educational institutions. The county is served by two major highways and the Darlington County Airport. The population is mostly White and African American, with a median household income of $35,845.
Common Questions
What is Per Capita Income in Darlington County?
Per Capita income in Darlington County is $28,821.
What is the Median Family Income in Darlington County?
Median Family Income in Darlington County is $59,939.
What is the Median Household income in Darlington County?
Median Household Income in Darlington County is $44,317.
What is Income or Wage Gap in Darlington County?
Income or Wage Gap in Darlington County is 34.9%.
Women in Darlington County earn 65.1 cents for every dollar earned by a man.
What is Family Income Deficit in Darlington County?
Family Income Deficit in Darlington County is $11,051.
Families that are below poverty line in Darlington County earn $11,051 less on average than the poverty threshold level.
What is Inequality or Gini Index in Darlington County?
Inequality or Gini Index in Darlington County is 0.50.
What is the Total Population of Darlington County?
Total Population of Darlington County is 63,025.
What is the Total Male Population of Darlington County?
Total Male Population of Darlington County is 30,142.
What is the Total Female Population of Darlington County?
Total Female Population of Darlington County is 32,883.
What is the Ratio of Males per 100 Females in Darlington County?
There are 91.66 Males per 100 Females in Darlington County.
What is the Ratio of Females per 100 Males in Darlington County?
There are 109.09 Females per 100 Males in Darlington County.
What is the Median Population Age in Darlington County?
Median Population Age in Darlington County is 41.4 Years.
What is the Average Family Size in Darlington County
Average Family Size in Darlington County is 3.2 People.
What is the Average Household Size in Darlington County
Average Household Size in Darlington County is 2.5 People.
How Large is the Labor Force in Darlington County?
There are 28,214 People in the Labor Forcein in Darlington County.
What is the Percentage of People in the Labor Force in Darlington County?
55.6% of People are in the Labor Force in Darlington County.
What is the Unemployment Rate in Darlington County?
Unemployment Rate in Darlington County is 6.5%.