Cities with the Highest Percentage of Population with a Degree in Physical and Health Sciences in the United States
RELATED REPORTS & OPTIONS
Physical and Health Sciences
United States
Compare Cities
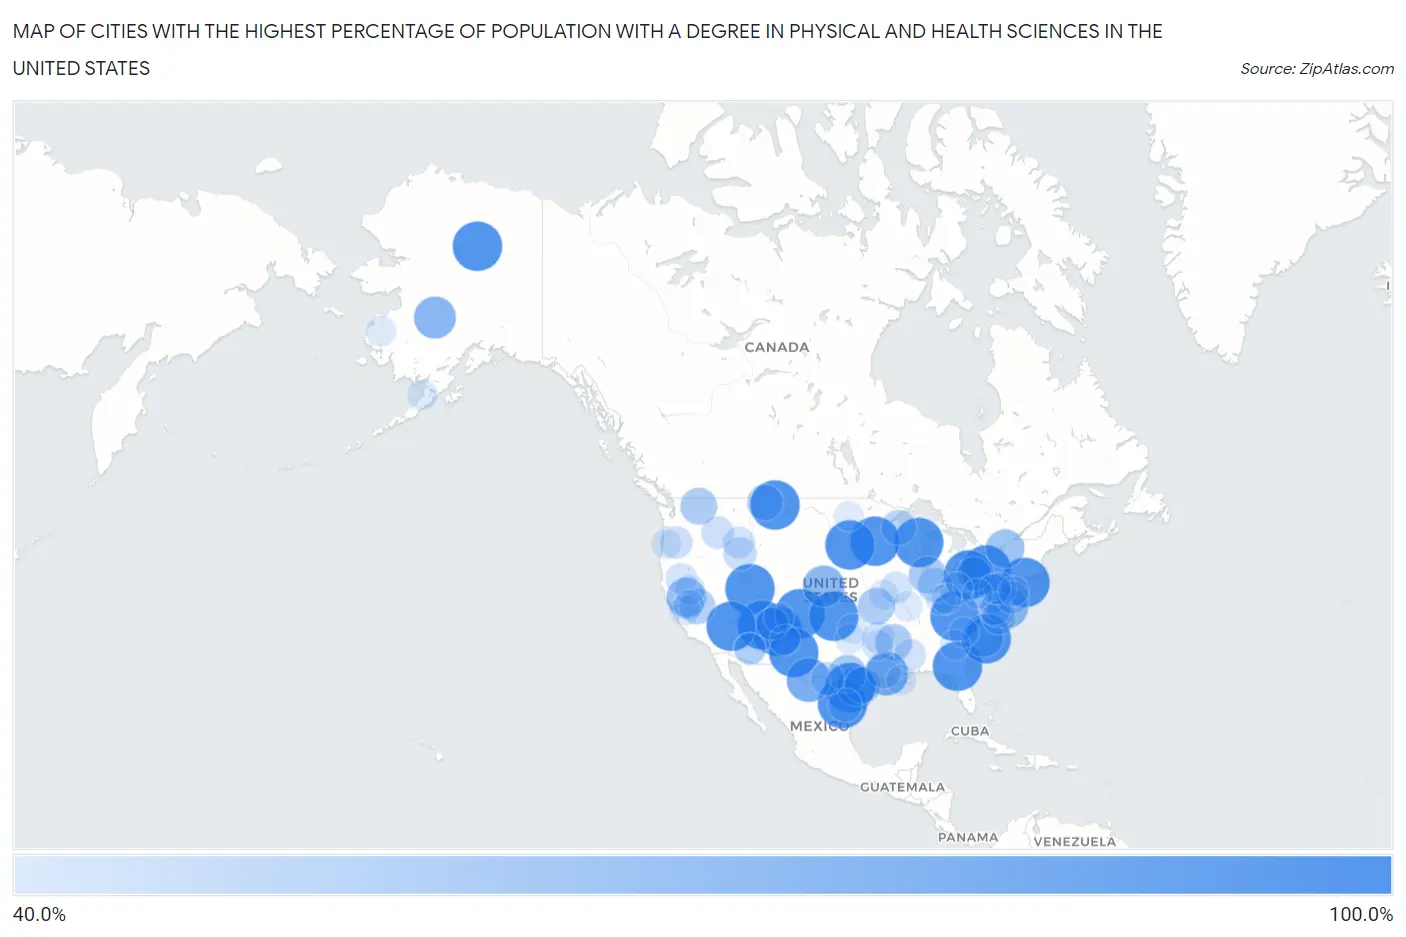
Map of Cities with the Highest Percentage of Population with a Degree in Physical and Health Sciences in the United States
0.0%
100.0%
Cities with the Highest Percentage of Population with a Degree in Physical and Health Sciences in the United States
| City | % Graduates | vs State | vs National | |
| 1. | San Rafael | 100.0% | 4.8%(+95.2)#1 | 3.1%(+96.9)#1 |
| 2. | Rocky Ridge | 100.0% | 2.8%(+97.2)#1 | 3.1%(+96.9)#2 |
| 3. | Blue Berry Hill | 100.0% | 3.3%(+96.7)#1 | 3.1%(+96.9)#3 |
| 4. | Low Mountain | 100.0% | 2.9%(+97.1)#1 | 3.1%(+96.9)#4 |
| 5. | Argyle | 100.0% | 2.6%(+97.4)#1 | 3.1%(+96.9)#5 |
| 6. | Sequatchie | 100.0% | 3.1%(+96.9)#1 | 3.1%(+96.9)#6 |
| 7. | Keokee | 100.0% | 3.2%(+96.8)#1 | 3.1%(+96.9)#7 |
| 8. | Sobieski | 100.0% | 2.9%(+97.1)#1 | 3.1%(+96.9)#8 |
| 9. | Coldfoot | 100.0% | 4.7%(+95.3)#1 | 3.1%(+96.9)#9 |
| 10. | White Hills | 100.0% | 2.9%(+97.1)#2 | 3.1%(+96.9)#10 |
| 11. | Big Rock | 100.0% | 3.1%(+96.9)#2 | 3.1%(+96.9)#11 |
| 12. | Ranchitos Del Norte | 100.0% | 3.3%(+96.7)#2 | 3.1%(+96.9)#12 |
| 13. | Mount Taylor | 100.0% | 4.8%(+95.2)#2 | 3.1%(+96.9)#13 |
| 14. | Biscay | 100.0% | 2.9%(+97.1)#1 | 3.1%(+96.9)#14 |
| 15. | Segundo | 100.0% | 3.6%(+96.4)#1 | 3.1%(+96.9)#16 |
| 16. | Hallsboro | 100.0% | 3.1%(+96.9)#1 | 3.1%(+96.9)#17 |
| 17. | Rew | 100.0% | 3.3%(+96.7)#1 | 3.1%(+96.9)#18 |
| 18. | Dodson | 100.0% | 3.7%(+96.3)#1 | 3.1%(+96.9)#19 |
| 19. | Timberon | 100.0% | 4.8%(+95.2)#3 | 3.1%(+96.9)#20 |
| 20. | Parkman | 100.0% | 3.0%(+97.0)#1 | 3.1%(+96.9)#21 |
| 21. | Bancroft | 100.0% | 2.1%(+97.9)#1 | 3.1%(+96.9)#22 |
| 22. | Rosston | 100.0% | 3.1%(+96.9)#1 | 3.1%(+96.9)#23 |
| 23. | Ocean Beach | 100.0% | 2.9%(+97.1)#1 | 3.1%(+96.9)#24 |
| 24. | Dewey | 100.0% | 3.7%(+96.3)#2 | 3.1%(+96.9)#25 |
| 25. | Rochester Institute Of Technology | 86.2% | 2.9%(+83.3)#2 | 3.1%(+83.1)#26 |
| 26. | Study Butte | 85.7% | 3.3%(+82.4)#3 | 3.1%(+82.6)#27 |
| 27. | Mermentau | 84.5% | 3.1%(+81.4)#1 | 3.1%(+81.4)#28 |
| 28. | Takotna | 80.0% | 4.7%(+75.3)#2 | 3.1%(+76.9)#29 |
| 29. | Max | 79.2% | 2.7%(+76.5)#1 | 3.1%(+76.1)#30 |
| 30. | Hallwood | 77.8% | 3.2%(+74.6)#2 | 3.1%(+74.7)#31 |
| 31. | Bloomington | 74.4% | 3.3%(+71.0)#4 | 3.1%(+71.3)#32 |
| 32. | Foresthill | 74.2% | 3.1%(+71.1)#1 | 3.1%(+71.1)#33 |
| 33. | Boardman | 72.7% | 3.1%(+69.6)#2 | 3.1%(+69.6)#34 |
| 34. | Yarrowsburg | 71.7% | 3.6%(+68.1)#1 | 3.1%(+68.6)#35 |
| 35. | Pamelia Center | 71.4% | 2.9%(+68.5)#3 | 3.1%(+68.3)#36 |
| 36. | Valle Hill | 70.6% | 3.9%(+66.7)#1 | 3.1%(+67.5)#37 |
| 37. | Driftwood | 69.2% | 3.3%(+65.9)#5 | 3.1%(+66.1)#38 |
| 38. | Hanna | 68.3% | 3.1%(+65.2)#1 | 3.1%(+65.2)#39 |
| 39. | Nespelem Community | 66.7% | 3.4%(+63.3)#1 | 3.1%(+63.6)#40 |
| 40. | Mitchellville | 66.7% | 3.2%(+63.4)#1 | 3.1%(+63.6)#41 |
| 41. | New Miami Colony | 66.7% | 3.7%(+62.9)#3 | 3.1%(+63.6)#42 |
| 42. | Schell City | 66.7% | 2.6%(+64.1)#1 | 3.1%(+63.6)#43 |
| 43. | Matagorda | 65.4% | 3.3%(+62.1)#6 | 3.1%(+62.3)#44 |
| 44. | West Havre | 64.5% | 3.7%(+60.8)#4 | 3.1%(+61.4)#45 |
| 45. | Lee Vining | 64.5% | 3.1%(+61.4)#2 | 3.1%(+61.4)#46 |
| 46. | Clam Lake | 62.5% | 2.9%(+59.6)#2 | 3.1%(+59.4)#47 |
| 47. | Orestes | 61.9% | 3.1%(+58.8)#2 | 3.1%(+58.8)#48 |
| 48. | New Kent | 61.7% | 3.2%(+58.5)#3 | 3.1%(+58.6)#49 |
| 49. | Reeves | 61.5% | 3.1%(+58.5)#2 | 3.1%(+58.4)#50 |
| 50. | Adamsville | 60.0% | 3.3%(+56.7)#2 | 3.1%(+56.9)#51 |
| 51. | Camptown | 59.5% | 3.2%(+56.3)#4 | 3.1%(+56.4)#52 |
| 52. | Citrus City | 58.3% | 3.3%(+55.0)#7 | 3.1%(+55.2)#53 |
| 53. | Brice | 58.0% | 3.0%(+55.0)#2 | 3.1%(+54.9)#54 |
| 54. | Lake View | 58.0% | 3.3%(+54.7)#8 | 3.1%(+54.9)#55 |
| 55. | Mariah Hill | 57.9% | 3.1%(+54.8)#3 | 3.1%(+54.8)#56 |
| 56. | Butte City | 57.9% | 3.2%(+54.7)#1 | 3.1%(+54.8)#57 |
| 57. | Linoma Beach | 57.9% | 2.7%(+55.2)#2 | 3.1%(+54.8)#58 |
| 58. | Hanover | 57.4% | 3.2%(+54.2)#5 | 3.1%(+54.3)#59 |
| 59. | Diamond Beach | 56.2% | 3.3%(+52.9)#1 | 3.1%(+53.2)#60 |
| 60. | Dorchester | 56.1% | 3.3%(+52.8)#2 | 3.1%(+53.0)#61 |
| 61. | Queens Gate | 56.1% | 3.3%(+52.8)#3 | 3.1%(+53.0)#62 |
| 62. | Naschitti | 55.6% | 4.8%(+50.7)#4 | 3.1%(+52.5)#63 |
| 63. | Idanha | 55.6% | 3.9%(+51.7)#1 | 3.1%(+52.5)#64 |
| 64. | White Bird | 55.6% | 3.2%(+52.4)#2 | 3.1%(+52.5)#65 |
| 65. | Goodyear Village | 54.5% | 2.9%(+51.7)#3 | 3.1%(+51.4)#66 |
| 66. | Black Springs | 54.5% | 3.2%(+51.3)#2 | 3.1%(+51.4)#67 |
| 67. | Conehatta | 53.8% | 3.0%(+50.9)#1 | 3.1%(+50.7)#68 |
| 68. | Leadore | 53.8% | 3.2%(+50.7)#3 | 3.1%(+50.7)#69 |
| 69. | Franklin Cdp Sacramento County | 53.8% | 3.1%(+50.7)#3 | 3.1%(+50.7)#70 |
| 70. | Upper Santan Village | 53.1% | 2.9%(+50.2)#4 | 3.1%(+50.0)#71 |
| 71. | Mcknightstown | 53.1% | 3.3%(+49.8)#4 | 3.1%(+50.0)#72 |
| 72. | Mcarthur | 52.9% | 3.1%(+49.8)#4 | 3.1%(+49.8)#73 |
| 73. | Coatsburg | 52.9% | 2.9%(+50.1)#1 | 3.1%(+49.8)#74 |
| 74. | Fulton | 51.9% | 3.2%(+48.6)#3 | 3.1%(+48.8)#75 |
| 75. | Polvadera | 51.2% | 4.8%(+46.4)#5 | 3.1%(+48.1)#76 |
| 76. | Rouse | 51.2% | 3.1%(+48.1)#5 | 3.1%(+48.1)#77 |
| 77. | Crawfordville | 50.8% | 2.6%(+48.2)#2 | 3.1%(+47.7)#78 |
| 78. | Rutgers University-Livingston Campus | 50.0% | 3.3%(+46.7)#3 | 3.1%(+46.9)#79 |
| 79. | Chauvin | 50.0% | 3.1%(+46.9)#3 | 3.1%(+46.9)#80 |
| 80. | Clifton | 50.0% | 2.9%(+47.1)#1 | 3.1%(+46.9)#81 |
| 81. | Elwood | 50.0% | 3.3%(+46.7)#4 | 3.1%(+46.9)#82 |
| 82. | Mountain Village | 50.0% | 4.7%(+45.3)#3 | 3.1%(+46.9)#83 |
| 83. | Willisville | 50.0% | 2.9%(+47.1)#2 | 3.1%(+46.9)#84 |
| 84. | Blanco | 50.0% | 4.8%(+45.2)#6 | 3.1%(+46.9)#85 |
| 85. | Sanders | 50.0% | 3.1%(+46.9)#1 | 3.1%(+46.9)#86 |
| 86. | Chilcoot Vinton | 50.0% | 3.1%(+46.9)#6 | 3.1%(+46.9)#87 |
| 87. | Newburg | 50.0% | 3.3%(+46.7)#1 | 3.1%(+46.9)#88 |
| 88. | Vallecito | 50.0% | 3.1%(+46.9)#7 | 3.1%(+46.9)#89 |
| 89. | Gilliam | 50.0% | 2.6%(+47.4)#2 | 3.1%(+46.9)#90 |
| 90. | Summit | 50.0% | 3.9%(+46.1)#2 | 3.1%(+46.9)#91 |
| 91. | Millboro | 50.0% | 3.2%(+46.8)#6 | 3.1%(+46.9)#92 |
| 92. | Fernwood | 50.0% | 3.0%(+47.0)#2 | 3.1%(+46.9)#93 |
| 93. | Rimini | 50.0% | 3.7%(+46.3)#5 | 3.1%(+46.9)#94 |
| 94. | Neville | 50.0% | 3.0%(+47.0)#3 | 3.1%(+46.9)#95 |
| 95. | Bridger | 50.0% | 2.1%(+47.9)#2 | 3.1%(+46.9)#96 |
| 96. | Rover | 50.0% | 3.2%(+46.8)#4 | 3.1%(+46.9)#97 |
| 97. | Pilot Point | 50.0% | 4.7%(+45.3)#4 | 3.1%(+46.9)#98 |
| 98. | Loco | 50.0% | 3.1%(+46.9)#2 | 3.1%(+46.9)#99 |
| 99. | Smith Village | 50.0% | 3.1%(+46.9)#3 | 3.1%(+46.9)#100 |
| 100. | Luverne | 50.0% | 2.3%(+47.7)#1 | 3.1%(+46.9)#101 |
Common Questions
What are the Top 10 Cities with the Highest Percentage of Population with a Degree in Physical and Health Sciences in the United States?
Top 10 Cities with the Highest Percentage of Population with a Degree in Physical and Health Sciences in the United States are:
#1
100.0%
#2
100.0%
#3
100.0%
#4
100.0%
#5
100.0%
#6
100.0%
#7
100.0%
#8
100.0%
#9
100.0%
#10
100.0%
What city has the Highest Percentage of Population with a Degree in Physical and Health Sciences in the United States?
San Rafael has the Highest Percentage of Population with a Degree in Physical and Health Sciences in the United States with 100.0%.
What is the Percentage of Population with a Degree in Physical and Health Sciences in the United States?
Percentage of Population with a Degree in Physical and Health Sciences in the United States is 3.1%.