Cities with the Highest Percentage of Immigrants from Czechoslovakia in the United States
RELATED REPORTS & OPTIONS
Czechoslovakia
United States
Compare Cities
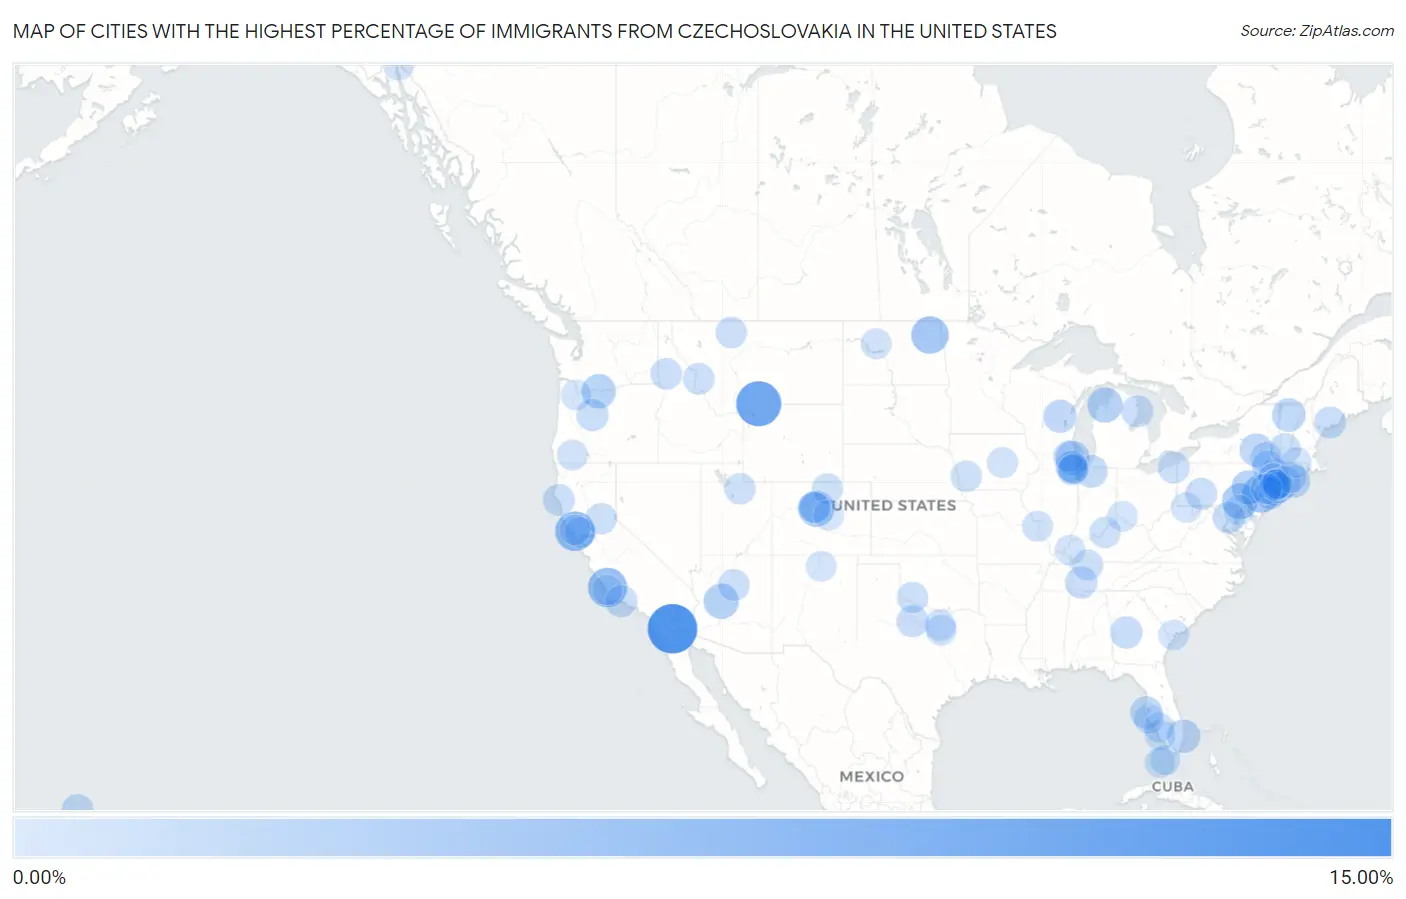
Map of Cities with the Highest Percentage of Immigrants from Czechoslovakia in the United States
0.00%
15.00%
Cities with the Highest Percentage of Immigrants from Czechoslovakia in the United States
| City | Czechoslovakia | vs State | vs National | |
| 1. | Ocotillo | 10.96% | 0.023%(+10.9)#1 | 0.020%(+10.9)#1 |
| 2. | Lyford | 9.54% | 0.0040%(+9.53)#1 | 0.020%(+9.52)#2 |
| 3. | Cooke City | 8.43% | 0.014%(+8.42)#1 | 0.020%(+8.41)#3 |
| 4. | Sleepy Hollow Lake | 6.42% | 0.044%(+6.37)#1 | 0.020%(+6.40)#4 |
| 5. | Bloomfield | 5.58% | 0.023%(+5.56)#2 | 0.020%(+5.56)#5 |
| 6. | Edna | 5.35% | 0.023%(+5.33)#3 | 0.020%(+5.33)#6 |
| 7. | Kingston | 4.58% | 0.043%(+4.53)#1 | 0.020%(+4.56)#7 |
| 8. | Lankin | 4.35% | 0.0024%(+4.35)#1 | 0.020%(+4.33)#8 |
| 9. | Keystone | 3.62% | 0.032%(+3.59)#1 | 0.020%(+3.60)#9 |
| 10. | Paradise | 3.46% | 0.015%(+3.44)#1 | 0.020%(+3.44)#10 |
| 11. | Point Pleasant Beach Borough | 3.18% | 0.043%(+3.13)#2 | 0.020%(+3.16)#11 |
| 12. | Wilhoit | 3.17% | 0.023%(+3.15)#1 | 0.020%(+3.15)#12 |
| 13. | Suttons Bay | 3.12% | 0.014%(+3.10)#1 | 0.020%(+3.10)#13 |
| 14. | Laurys Station | 2.75% | 0.015%(+2.73)#2 | 0.020%(+2.73)#14 |
| 15. | Dallesport | 2.73% | 0.023%(+2.71)#1 | 0.020%(+2.72)#15 |
| 16. | Mountain Dale | 2.69% | 0.044%(+2.65)#2 | 0.020%(+2.67)#16 |
| 17. | Rock Ridge | 2.63% | 0.033%(+2.60)#1 | 0.020%(+2.61)#17 |
| 18. | Knollwood | 2.50% | 0.037%(+2.46)#1 | 0.020%(+2.48)#18 |
| 19. | Renaissance At Monroe | 2.32% | 0.043%(+2.27)#3 | 0.020%(+2.30)#19 |
| 20. | Sea Ranch Lakes | 2.26% | 0.037%(+2.22)#1 | 0.020%(+2.24)#20 |
| 21. | Stowe | 2.22% | 0.014%(+2.20)#1 | 0.020%(+2.20)#21 |
| 22. | Cooperstown | 2.11% | 0.044%(+2.07)#3 | 0.020%(+2.09)#22 |
| 23. | Northport | 2.11% | 0.016%(+2.10)#1 | 0.020%(+2.09)#23 |
| 24. | Shelter Island | 1.95% | 0.044%(+1.91)#4 | 0.020%(+1.93)#24 |
| 25. | Fish Lake | 1.79% | 0.0040%(+1.79)#2 | 0.020%(+1.77)#25 |
| 26. | Tierra Verde | 1.74% | 0.037%(+1.71)#2 | 0.020%(+1.72)#26 |
| 27. | Reynolds | 1.64% | 0.013%(+1.63)#1 | 0.020%(+1.62)#27 |
| 28. | Camp Sherman | 1.60% | 0.025%(+1.57)#1 | 0.020%(+1.58)#28 |
| 29. | Summertown | 1.55% | 0.0057%(+1.54)#1 | 0.020%(+1.53)#29 |
| 30. | Kahaluu | 1.50% | 0.017%(+1.48)#1 | 0.020%(+1.48)#30 |
| 31. | Summerland | 1.49% | 0.023%(+1.47)#4 | 0.020%(+1.47)#31 |
| 32. | Throckmorton | 1.48% | 0.0073%(+1.47)#1 | 0.020%(+1.46)#32 |
| 33. | Konterra | 1.45% | 0.024%(+1.43)#1 | 0.020%(+1.43)#33 |
| 34. | Richmond | 1.42% | 0.029%(+1.39)#1 | 0.020%(+1.40)#34 |
| 35. | Mahopac | 1.40% | 0.044%(+1.36)#5 | 0.020%(+1.38)#35 |
| 36. | Shelter Cove | 1.40% | 0.023%(+1.38)#5 | 0.020%(+1.38)#36 |
| 37. | Harrisville | 1.40% | 0.014%(+1.39)#2 | 0.020%(+1.38)#37 |
| 38. | Vinco | 1.36% | 0.015%(+1.35)#3 | 0.020%(+1.34)#38 |
| 39. | Shoreham | 1.35% | 0.044%(+1.31)#6 | 0.020%(+1.33)#39 |
| 40. | Fort Valley | 1.33% | 0.023%(+1.30)#2 | 0.020%(+1.31)#40 |
| 41. | Windham | 1.32% | 0.044%(+1.28)#7 | 0.020%(+1.30)#41 |
| 42. | Indian Head Park | 1.32% | 0.037%(+1.28)#2 | 0.020%(+1.30)#42 |
| 43. | Jefferson | 1.30% | 0.015%(+1.28)#1 | 0.020%(+1.28)#43 |
| 44. | Lawrence | 1.28% | 0.044%(+1.24)#8 | 0.020%(+1.26)#44 |
| 45. | Stone Ridge | 1.26% | 0.044%(+1.22)#9 | 0.020%(+1.24)#45 |
| 46. | Silverthorne | 1.23% | 0.032%(+1.20)#2 | 0.020%(+1.21)#46 |
| 47. | Hamilton | 1.23% | 0.014%(+1.21)#2 | 0.020%(+1.21)#47 |
| 48. | Meadow Vista | 1.23% | 0.023%(+1.20)#6 | 0.020%(+1.21)#48 |
| 49. | Oakbrook Terrace | 1.22% | 0.037%(+1.19)#3 | 0.020%(+1.20)#49 |
| 50. | Peck | 1.21% | 0.0090%(+1.20)#1 | 0.020%(+1.19)#50 |
| 51. | Shelby | 1.21% | 0.014%(+1.20)#3 | 0.020%(+1.19)#51 |
| 52. | Route 7 Gateway | 1.19% | 0.033%(+1.16)#2 | 0.020%(+1.17)#52 |
| 53. | Mount Kisco | 1.18% | 0.044%(+1.14)#10 | 0.020%(+1.16)#53 |
| 54. | Headrick | 1.16% | 0.0047%(+1.16)#1 | 0.020%(+1.14)#54 |
| 55. | Kamas | 1.16% | 0.015%(+1.15)#1 | 0.020%(+1.14)#55 |
| 56. | Navesink | 1.16% | 0.043%(+1.12)#4 | 0.020%(+1.14)#56 |
| 57. | North Lindenhurst | 1.15% | 0.044%(+1.10)#11 | 0.020%(+1.13)#57 |
| 58. | Oakland | 1.13% | 0.0048%(+1.13)#1 | 0.020%(+1.11)#58 |
| 59. | Thornhill | 1.13% | 0.0038%(+1.13)#1 | 0.020%(+1.11)#59 |
| 60. | Laporte | 1.12% | 0.032%(+1.09)#3 | 0.020%(+1.10)#60 |
| 61. | Greenbrier | 1.09% | 0.0057%(+1.09)#2 | 0.020%(+1.07)#61 |
| 62. | Westlake | 1.08% | 0.0073%(+1.07)#2 | 0.020%(+1.06)#62 |
| 63. | Upper Brookville | 1.06% | 0.044%(+1.02)#12 | 0.020%(+1.04)#63 |
| 64. | Temelec | 1.06% | 0.023%(+1.04)#7 | 0.020%(+1.04)#64 |
| 65. | Readsboro | 1.06% | 0.014%(+1.04)#2 | 0.020%(+1.04)#65 |
| 66. | Lake Hopatcong | 1.01% | 0.043%(+0.969)#5 | 0.020%(+0.992)#66 |
| 67. | Coplay Borough | 1.00% | 0.015%(+0.988)#4 | 0.020%(+0.983)#67 |
| 68. | Dillon | 0.96% | 0.032%(+0.931)#4 | 0.020%(+0.943)#68 |
| 69. | Long Lake | 0.95% | 0.037%(+0.916)#4 | 0.020%(+0.933)#69 |
| 70. | Island Walk | 0.93% | 0.037%(+0.896)#3 | 0.020%(+0.914)#70 |
| 71. | Skagway | 0.93% | 0.023%(+0.910)#1 | 0.020%(+0.913)#71 |
| 72. | Clinton | 0.93% | 0.033%(+0.898)#3 | 0.020%(+0.912)#72 |
| 73. | Sea Cliff | 0.93% | 0.044%(+0.885)#13 | 0.020%(+0.909)#73 |
| 74. | Linden | 0.90% | 0.043%(+0.856)#6 | 0.020%(+0.880)#74 |
| 75. | Glen Rock Borough | 0.89% | 0.015%(+0.874)#5 | 0.020%(+0.869)#75 |
| 76. | Le Grand | 0.89% | 0.0048%(+0.881)#2 | 0.020%(+0.866)#76 |
| 77. | Brentwood | 0.88% | 0.0067%(+0.874)#1 | 0.020%(+0.861)#77 |
| 78. | Ryder | 0.88% | 0.0024%(+0.875)#2 | 0.020%(+0.858)#78 |
| 79. | Gold Hill | 0.87% | 0.025%(+0.848)#2 | 0.020%(+0.853)#79 |
| 80. | Flagtown | 0.87% | 0.043%(+0.829)#7 | 0.020%(+0.852)#80 |
| 81. | Dalworthington Gardens | 0.86% | 0.0073%(+0.854)#3 | 0.020%(+0.842)#81 |
| 82. | Palos Park | 0.85% | 0.037%(+0.811)#5 | 0.020%(+0.828)#82 |
| 83. | Graton | 0.84% | 0.023%(+0.814)#8 | 0.020%(+0.818)#83 |
| 84. | Taos | 0.82% | 0.015%(+0.806)#1 | 0.020%(+0.801)#84 |
| 85. | Perry Park | 0.82% | 0.032%(+0.786)#5 | 0.020%(+0.798)#85 |
| 86. | Marion | 0.79% | 0.0038%(+0.788)#2 | 0.020%(+0.772)#86 |
| 87. | Shell Point | 0.79% | 0.0085%(+0.781)#1 | 0.020%(+0.770)#87 |
| 88. | Cove Neck | 0.78% | 0.044%(+0.740)#14 | 0.020%(+0.765)#88 |
| 89. | Stock Island | 0.77% | 0.037%(+0.730)#4 | 0.020%(+0.747)#89 |
| 90. | Delaware Water Gap Borough | 0.77% | 0.015%(+0.752)#6 | 0.020%(+0.747)#90 |
| 91. | Metzger | 0.76% | 0.025%(+0.738)#3 | 0.020%(+0.743)#91 |
| 92. | The Village Of Indian Hill | 0.76% | 0.015%(+0.745)#2 | 0.020%(+0.741)#92 |
| 93. | Holland | 0.76% | 0.026%(+0.731)#1 | 0.020%(+0.738)#93 |
| 94. | Bridgeview | 0.74% | 0.037%(+0.707)#6 | 0.020%(+0.724)#94 |
| 95. | Woodlands | 0.73% | 0.023%(+0.704)#9 | 0.020%(+0.708)#95 |
| 96. | Suncoast Estates | 0.71% | 0.037%(+0.676)#5 | 0.020%(+0.693)#96 |
| 97. | Cheat Lake | 0.71% | 0.0066%(+0.701)#1 | 0.020%(+0.688)#97 |
| 98. | Southgate | 0.70% | 0.037%(+0.658)#6 | 0.020%(+0.676)#98 |
| 99. | Riverside | 0.69% | 0.024%(+0.668)#2 | 0.020%(+0.672)#99 |
| 100. | Big Pine Key | 0.67% | 0.037%(+0.629)#7 | 0.020%(+0.647)#100 |
Common Questions
What are the Top 10 Cities with the Highest Percentage of Immigrants from Czechoslovakia in the United States?
Top 10 Cities with the Highest Percentage of Immigrants from Czechoslovakia in the United States are:
What city has the Highest Percentage of Immigrants from Czechoslovakia in the United States?
Ocotillo has the Highest Percentage of Immigrants from Czechoslovakia in the United States with 10.96%.
What is the Percentage of Immigrants from Czechoslovakia in the United States?
Percentage of Immigrants from Czechoslovakia in the United States is 0.020%.