Cities with the Highest Percentage of Immigrants from Africa in the United States
RELATED REPORTS & OPTIONS
Africa
United States
Compare Cities
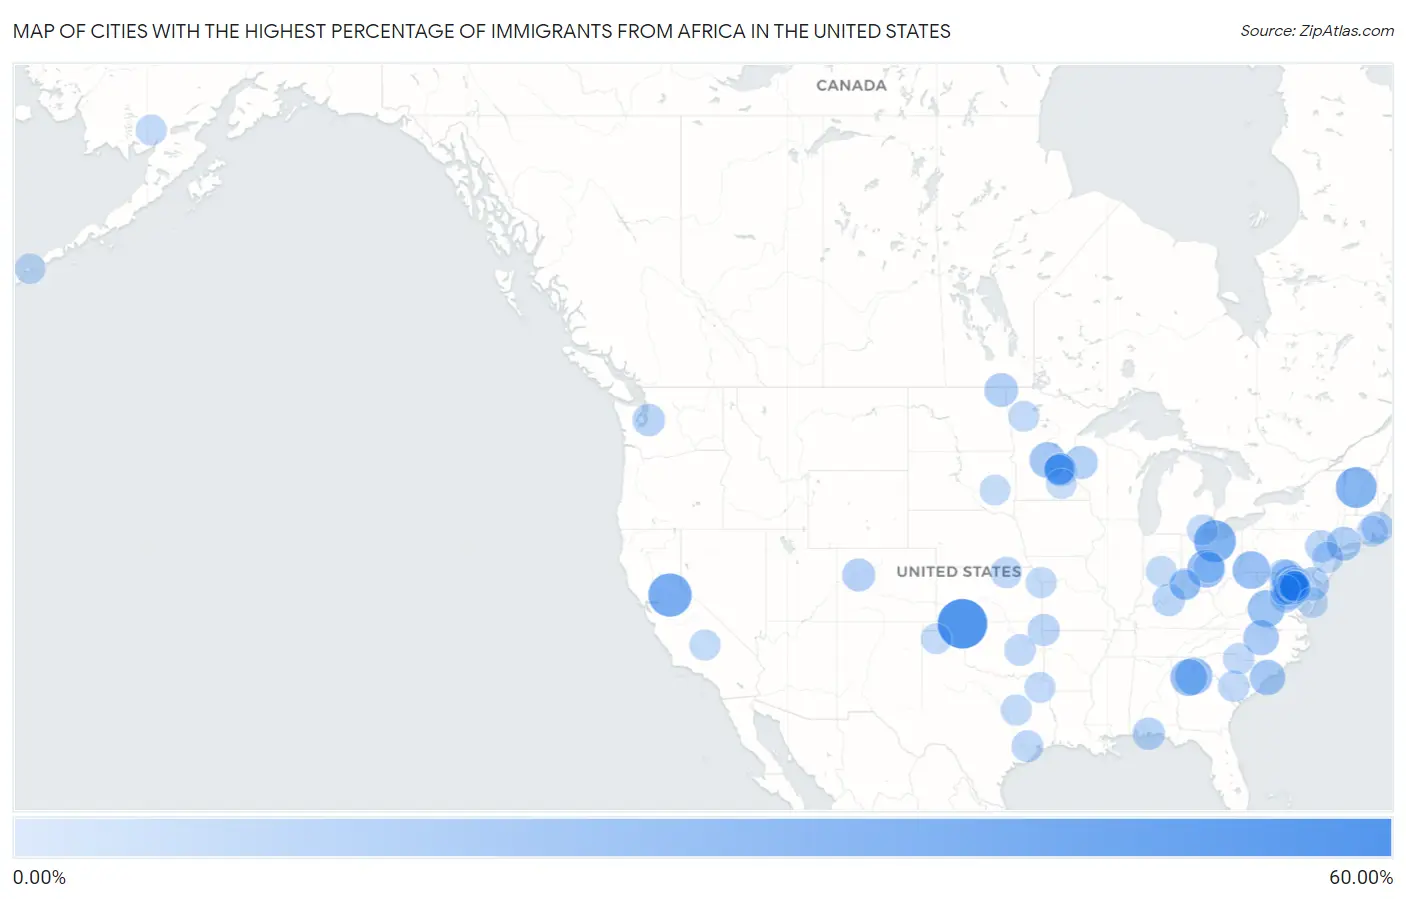
Map of Cities with the Highest Percentage of Immigrants from Africa in the United States
0.00%
60.00%
Cities with the Highest Percentage of Immigrants from Africa in the United States
| City | Africa | vs State | vs National | |
| 1. | Knowles | 54.55% | 0.35%(+54.2)#-1 | 0.78%(+53.8)#0 |
| 2. | Fiddletown | 39.29% | 0.54%(+38.7)#-1 | 0.78%(+38.5)#1 |
| 3. | Beulah Beach | 35.82% | 0.83%(+35.0)#-1 | 0.78%(+35.0)#2 |
| 4. | Graniteville | 33.47% | 0.38%(+33.1)#-1 | 0.78%(+32.7)#3 |
| 5. | Scotts | 32.97% | 0.39%(+32.6)#-1 | 0.78%(+32.2)#4 |
| 6. | White Oak | 29.42% | 3.06%(+26.4)#-1 | 0.78%(+28.6)#5 |
| 7. | Urbancrest | 26.36% | 0.83%(+25.5)#0 | 0.78%(+25.6)#6 |
| 8. | Ronco | 25.64% | 0.67%(+25.0)#-1 | 0.78%(+24.9)#7 |
| 9. | Niles | 24.74% | 0.48%(+24.3)#-1 | 0.78%(+24.0)#8 |
| 10. | Grayson | 24.52% | 1.10%(+23.4)#-1 | 0.78%(+23.7)#9 |
| 11. | Shipman | 24.37% | 1.40%(+23.0)#-1 | 0.78%(+23.6)#10 |
| 12. | Colwyn Borough | 24.22% | 0.67%(+23.5)#0 | 0.78%(+23.4)#11 |
| 13. | Clarkston | 23.82% | 1.10%(+22.7)#0 | 0.78%(+23.0)#12 |
| 14. | Goshen | 23.22% | 1.42%(+21.8)#-1 | 0.78%(+22.4)#13 |
| 15. | Waite Park | 21.47% | 2.38%(+19.1)#-1 | 0.78%(+20.7)#14 |
| 16. | Atlantic Beach | 20.48% | 0.21%(+20.3)#-1 | 0.78%(+19.7)#15 |
| 17. | Efland | 20.12% | 0.68%(+19.4)#-1 | 0.78%(+19.3)#16 |
| 18. | New Carrollton | 19.71% | 3.06%(+16.7)#0 | 0.78%(+18.9)#17 |
| 19. | Schuyler Lake | 19.51% | 1.08%(+18.4)#-1 | 0.78%(+18.7)#18 |
| 20. | Yermo | 19.16% | 0.54%(+18.6)#0 | 0.78%(+18.4)#19 |
| 21. | Woodbourne | 18.59% | 1.08%(+17.5)#0 | 0.78%(+17.8)#20 |
| 22. | Cannondale | 17.11% | 0.77%(+16.3)#-1 | 0.78%(+16.3)#21 |
| 23. | Fairland | 16.87% | 3.06%(+13.8)#1 | 0.78%(+16.1)#22 |
| 24. | Bathgate | 16.67% | 1.55%(+15.1)#-1 | 0.78%(+15.9)#23 |
| 25. | Williams Canyon | 16.67% | 0.54%(+16.1)#1 | 0.78%(+15.9)#24 |
| 26. | Bladensburg | 16.12% | 3.06%(+13.1)#2 | 0.78%(+15.3)#25 |
| 27. | Camden | 15.99% | 1.24%(+14.8)#-1 | 0.78%(+15.2)#26 |
| 28. | Innovation | 15.26% | 1.40%(+13.9)#0 | 0.78%(+14.5)#27 |
| 29. | Barron | 15.16% | 0.29%(+14.9)#-1 | 0.78%(+14.4)#28 |
| 30. | Calverton | 14.96% | 3.06%(+11.9)#3 | 0.78%(+14.2)#29 |
| 31. | Seabrook | 14.93% | 3.06%(+11.9)#4 | 0.78%(+14.2)#30 |
| 32. | Chacra | 14.72% | 0.73%(+14.0)#-1 | 0.78%(+13.9)#31 |
| 33. | Woodsboro | 14.52% | 3.06%(+11.5)#5 | 0.78%(+13.7)#32 |
| 34. | Darby Borough | 13.98% | 0.67%(+13.3)#1 | 0.78%(+13.2)#33 |
| 35. | Takoma Park | 13.85% | 3.06%(+10.8)#6 | 0.78%(+13.1)#34 |
| 36. | Seatac | 13.78% | 0.96%(+12.8)#-1 | 0.78%(+13.0)#35 |
| 37. | Adelphi | 13.67% | 3.06%(+10.6)#7 | 0.78%(+12.9)#36 |
| 38. | West Buechel | 13.53% | 0.54%(+13.0)#-1 | 0.78%(+12.8)#37 |
| 39. | Hilltop | 13.53% | 2.38%(+11.2)#0 | 0.78%(+12.8)#38 |
| 40. | Millbourne Borough | 13.40% | 0.67%(+12.7)#2 | 0.78%(+12.6)#39 |
| 41. | Garcon Point | 13.30% | 0.37%(+12.9)#-1 | 0.78%(+12.5)#40 |
| 42. | Pine Ridge | 13.06% | 0.67%(+12.4)#3 | 0.78%(+12.3)#41 |
| 43. | Brockton | 12.96% | 1.66%(+11.3)#13 | 0.78%(+12.2)#388 |
| 44. | Burtonsville | 12.89% | 3.06%(+9.83)#8 | 0.78%(+12.1)#389 |
| 45. | South Laurel | 12.89% | 3.06%(+9.83)#9 | 0.78%(+12.1)#390 |
| 46. | Burnt Mills | 12.79% | 3.06%(+9.73)#10 | 0.78%(+12.0)#391 |
| 47. | Noel | 12.75% | 0.44%(+12.3)#-1 | 0.78%(+12.0)#392 |
| 48. | Brooklyn Park | 12.16% | 2.38%(+9.78)#18 | 0.78%(+11.4)#513 |
| 49. | Cherry Hill | 12.10% | 1.40%(+10.7)#1 | 0.78%(+11.3)#514 |
| 50. | Bailey S Crossroads | 12.08% | 1.40%(+10.7)#2 | 0.78%(+11.3)#515 |
| 51. | Four Corners | 12.05% | 1.00%(+11.1)#-1 | 0.78%(+11.3)#516 |
| 52. | Beaver Creek | 11.61% | 3.06%(+8.55)#11 | 0.78%(+10.8)#517 |
| 53. | Cedar Heights | 11.47% | 3.06%(+8.41)#12 | 0.78%(+10.7)#518 |
| 54. | Glenn Dale | 11.39% | 3.06%(+8.33)#13 | 0.78%(+10.6)#519 |
| 55. | Lincolnia | 11.37% | 1.40%(+9.96)#3 | 0.78%(+10.6)#520 |
| 56. | Clearview | 11.36% | 0.35%(+11.0)#0 | 0.78%(+10.6)#521 |
| 57. | Voorhees | 11.35% | 1.42%(+9.93)#0 | 0.78%(+10.6)#522 |
| 58. | Lake Arbor | 11.28% | 3.06%(+8.22)#14 | 0.78%(+10.5)#523 |
| 59. | Landover | 11.26% | 3.06%(+8.21)#15 | 0.78%(+10.5)#524 |
| 60. | Linn | 11.26% | 0.48%(+10.8)#0 | 0.78%(+10.5)#525 |
| 61. | Denmark | 11.15% | 0.21%(+10.9)#0 | 0.78%(+10.4)#526 |
| 62. | Largo | 11.06% | 3.06%(+8.00)#16 | 0.78%(+10.3)#527 |
| 63. | Chillum | 11.03% | 3.06%(+7.97)#17 | 0.78%(+10.2)#528 |
| 64. | Silver Spring | 10.96% | 3.06%(+7.90)#18 | 0.78%(+10.2)#529 |
| 65. | Vauxhall | 10.86% | 1.42%(+9.44)#1 | 0.78%(+10.1)#530 |
| 66. | Jaars | 10.82% | 0.68%(+10.1)#0 | 0.78%(+10.0)#531 |
| 67. | Woodlawn Cdp Fairfax County | 10.71% | 1.40%(+9.30)#4 | 0.78%(+9.93)#532 |
| 68. | Delshire | 10.52% | 0.83%(+9.69)#1 | 0.78%(+9.74)#533 |
| 69. | Richland | 10.42% | 1.00%(+9.43)#0 | 0.78%(+9.64)#534 |
| 70. | Weldon | 10.42% | 0.54%(+9.87)#2 | 0.78%(+9.64)#535 |
| 71. | Four Square Mile | 10.35% | 0.73%(+9.62)#2 | 0.78%(+9.57)#536 |
| 72. | Pawtucket | 10.21% | 1.87%(+8.35)#-1 | 0.78%(+9.44)#537 |
| 73. | Leesylvania | 10.18% | 1.40%(+8.78)#5 | 0.78%(+9.40)#538 |
| 74. | Omaha | 10.12% | 1.00%(+9.13)#1 | 0.78%(+9.34)#539 |
| 75. | New Stuyahok | 10.12% | 0.33%(+9.79)#-1 | 0.78%(+9.34)#540 |
| 76. | Konterra | 10.12% | 3.06%(+7.06)#19 | 0.78%(+9.34)#541 |
| 77. | Stony Point | 10.08% | 0.39%(+9.69)#0 | 0.78%(+9.30)#542 |
| 78. | Riverside | 10.06% | 0.44%(+9.62)#0 | 0.78%(+9.28)#543 |
| 79. | Union Beach Borough | 10.02% | 1.42%(+8.60)#2 | 0.78%(+9.24)#544 |
| 80. | Whitehall | 9.96% | 0.83%(+9.14)#2 | 0.78%(+9.18)#545 |
| 81. | Southern Gateway | 9.88% | 1.40%(+8.48)#6 | 0.78%(+9.10)#546 |
| 82. | Brooklyn Center | 9.81% | 2.38%(+7.43)#19 | 0.78%(+9.03)#547 |
| 83. | Mitchellville | 9.75% | 3.06%(+6.69)#20 | 0.78%(+8.97)#548 |
| 84. | Mcintosh | 9.74% | 2.38%(+7.36)#20 | 0.78%(+8.96)#549 |
| 85. | Greenbelt | 9.69% | 3.06%(+6.63)#21 | 0.78%(+8.91)#550 |
| 86. | Cactus | 9.66% | 1.00%(+8.66)#2 | 0.78%(+8.88)#551 |
| 87. | Sharon Hill Borough | 9.64% | 0.67%(+8.97)#4 | 0.78%(+8.86)#552 |
| 88. | Brown Station | 9.59% | 3.06%(+6.53)#22 | 0.78%(+8.82)#553 |
| 89. | Speedway | 9.58% | 0.59%(+8.99)#-1 | 0.78%(+8.80)#554 |
| 90. | Artesian | 9.47% | 0.94%(+8.54)#-1 | 0.78%(+8.69)#555 |
| 91. | Queensland | 9.44% | 3.06%(+6.38)#23 | 0.78%(+8.66)#556 |
| 92. | Crescent Springs | 9.40% | 0.54%(+8.87)#0 | 0.78%(+8.62)#557 |
| 93. | Kemp Mill | 9.31% | 3.06%(+6.25)#24 | 0.78%(+8.53)#558 |
| 94. | New Hope | 9.27% | 2.38%(+6.89)#21 | 0.78%(+8.49)#559 |
| 95. | Akutan | 9.22% | 0.33%(+8.89)#0 | 0.78%(+8.44)#560 |
| 96. | Lanham | 9.20% | 3.06%(+6.14)#25 | 0.78%(+8.42)#561 |
| 97. | West Pocomoke | 9.18% | 3.06%(+6.12)#26 | 0.78%(+8.40)#562 |
| 98. | Bull Run | 9.01% | 1.40%(+7.61)#7 | 0.78%(+8.23)#563 |
| 99. | Brook Forest | 8.97% | 0.73%(+8.24)#3 | 0.78%(+8.19)#564 |
| 100. | Faribault | 8.88% | 2.38%(+6.50)#22 | 0.78%(+8.10)#565 |
Common Questions
What are the Top 10 Cities with the Highest Percentage of Immigrants from Africa in the United States?
Top 10 Cities with the Highest Percentage of Immigrants from Africa in the United States are:
#1
54.55%
#2
39.29%
#3
35.82%
#4
33.47%
#5
29.42%
#6
26.36%
#7
25.64%
#8
24.52%
#9
24.37%
#10
23.82%
What city has the Highest Percentage of Immigrants from Africa in the United States?
Knowles has the Highest Percentage of Immigrants from Africa in the United States with 54.55%.
What is the Percentage of Immigrants from Africa in the United States?
Percentage of Immigrants from Africa in the United States is 0.78%.