Cities with the Most Immigrants from Hungary in the United States
RELATED REPORTS & OPTIONS
Hungary
United States
Compare Cities
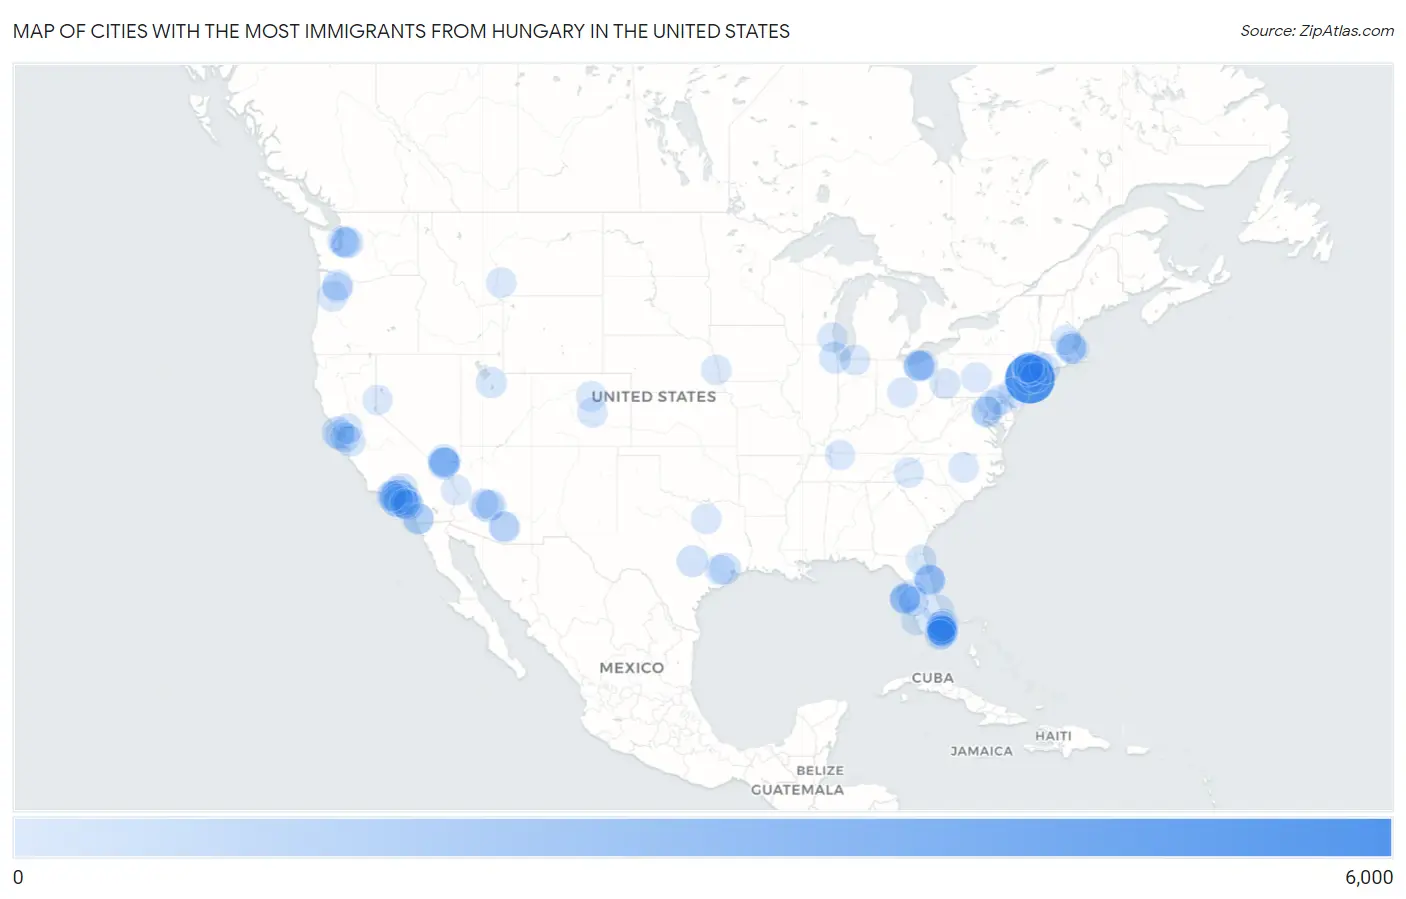
Map of Cities with the Most Immigrants from Hungary in the United States
0
6,000
Cities with the Most Immigrants from Hungary in the United States
| City | Hungary | vs State | vs National | |
| 1. | New York | 5,192 | 8,808(58.95%)#1 | 64,894(8.00%)#1 |
| 2. | Los Angeles | 1,965 | 10,936(17.97%)#1 | 64,894(3.03%)#2 |
| 3. | Phoenix | 514 | 1,572(32.70%)#1 | 64,894(0.79%)#3 |
| 4. | Enterprise | 482 | 1,513(31.86%)#1 | 64,894(0.74%)#4 |
| 5. | San Francisco | 474 | 10,936(4.33%)#2 | 64,894(0.73%)#5 |
| 6. | Houston | 469 | 2,637(17.79%)#1 | 64,894(0.72%)#6 |
| 7. | Austin | 438 | 2,637(16.61%)#2 | 64,894(0.67%)#7 |
| 8. | Sammamish | 396 | 1,673(23.67%)#1 | 64,894(0.61%)#8 |
| 9. | Las Vegas | 385 | 1,513(25.45%)#2 | 64,894(0.59%)#9 |
| 10. | San Diego | 383 | 10,936(3.50%)#3 | 64,894(0.59%)#10 |
| 11. | Chicago | 376 | 1,432(26.26%)#1 | 64,894(0.58%)#11 |
| 12. | Seattle | 281 | 1,673(16.80%)#2 | 64,894(0.43%)#12 |
| 13. | Hollywood | 277 | 9,122(3.04%)#1 | 64,894(0.43%)#13 |
| 14. | San Jose | 235 | 10,936(2.15%)#4 | 64,894(0.36%)#14 |
| 15. | Mission Viejo | 235 | 10,936(2.15%)#5 | 64,894(0.36%)#15 |
| 16. | Draper | 224 | 444(50.45%)#1 | 64,894(0.35%)#16 |
| 17. | Cape Coral | 206 | 9,122(2.26%)#2 | 64,894(0.32%)#17 |
| 18. | Port St Lucie | 201 | 9,122(2.20%)#3 | 64,894(0.31%)#18 |
| 19. | Port Orange | 187 | 9,122(2.05%)#4 | 64,894(0.29%)#19 |
| 20. | Boston | 183 | 1,910(9.58%)#1 | 64,894(0.28%)#20 |
| 21. | Wesley Chapel | 183 | 9,122(2.01%)#5 | 64,894(0.28%)#21 |
| 22. | Palmdale | 171 | 10,936(1.56%)#6 | 64,894(0.26%)#22 |
| 23. | Brea | 171 | 10,936(1.56%)#7 | 64,894(0.26%)#23 |
| 24. | Santa Clarita | 170 | 10,936(1.55%)#8 | 64,894(0.26%)#24 |
| 25. | Pacifica | 170 | 10,936(1.55%)#9 | 64,894(0.26%)#25 |
| 26. | Jacksonville | 169 | 9,122(1.85%)#6 | 64,894(0.26%)#26 |
| 27. | Salem | 167 | 943(17.71%)#1 | 64,894(0.26%)#27 |
| 28. | Pompano Beach | 167 | 9,122(1.83%)#7 | 64,894(0.26%)#28 |
| 29. | Danbury | 167 | 1,562(10.69%)#1 | 64,894(0.26%)#29 |
| 30. | Spring Valley | 164 | 1,513(10.84%)#3 | 64,894(0.25%)#30 |
| 31. | Hallandale Beach | 160 | 9,122(1.75%)#8 | 64,894(0.25%)#31 |
| 32. | Daytona Beach | 158 | 9,122(1.73%)#9 | 64,894(0.24%)#32 |
| 33. | Dania Beach | 152 | 9,122(1.67%)#10 | 64,894(0.23%)#33 |
| 34. | Portland | 150 | 943(15.91%)#2 | 64,894(0.23%)#34 |
| 35. | Jersey City | 147 | 4,659(3.16%)#1 | 64,894(0.23%)#35 |
| 36. | Pembroke Pines | 146 | 9,122(1.60%)#11 | 64,894(0.22%)#36 |
| 37. | Catalina Foothills | 146 | 1,572(9.29%)#2 | 64,894(0.22%)#37 |
| 38. | South Bend | 145 | 785(18.47%)#1 | 64,894(0.22%)#38 |
| 39. | Somerville | 145 | 1,910(7.59%)#2 | 64,894(0.22%)#39 |
| 40. | Philadelphia | 144 | 2,267(6.35%)#1 | 64,894(0.22%)#40 |
| 41. | Delray Beach | 142 | 9,122(1.56%)#12 | 64,894(0.22%)#41 |
| 42. | Simi Valley | 140 | 10,936(1.28%)#10 | 64,894(0.22%)#42 |
| 43. | Largo | 139 | 9,122(1.52%)#13 | 64,894(0.21%)#43 |
| 44. | Washington | 134 | 134(100.00%)#1 | 64,894(0.21%)#44 |
| 45. | Pittsburgh | 131 | 2,267(5.78%)#2 | 64,894(0.20%)#45 |
| 46. | Parma | 126 | 2,140(5.89%)#1 | 64,894(0.19%)#46 |
| 47. | Scottsdale | 125 | 1,572(7.95%)#3 | 64,894(0.19%)#47 |
| 48. | Redondo Beach | 123 | 10,936(1.12%)#11 | 64,894(0.19%)#48 |
| 49. | Denver | 121 | 1,186(10.20%)#1 | 64,894(0.19%)#49 |
| 50. | Baltimore | 119 | 904(13.16%)#1 | 64,894(0.18%)#50 |
| 51. | Raleigh | 119 | 1,491(7.98%)#1 | 64,894(0.18%)#51 |
| 52. | Clarksville | 119 | 470(25.32%)#1 | 64,894(0.18%)#52 |
| 53. | Cinco Ranch | 119 | 2,637(4.51%)#3 | 64,894(0.18%)#53 |
| 54. | Papillion | 117 | 282(41.49%)#1 | 64,894(0.18%)#54 |
| 55. | Irvine | 116 | 10,936(1.06%)#12 | 64,894(0.18%)#55 |
| 56. | Lake Havasu City | 116 | 1,572(7.38%)#4 | 64,894(0.18%)#56 |
| 57. | Miami Beach | 115 | 9,122(1.26%)#14 | 64,894(0.18%)#57 |
| 58. | South Daytona | 113 | 9,122(1.24%)#15 | 64,894(0.17%)#58 |
| 59. | Oak Creek | 111 | 858(12.94%)#1 | 64,894(0.17%)#59 |
| 60. | Fort Lauderdale | 110 | 9,122(1.21%)#16 | 64,894(0.17%)#60 |
| 61. | Davie | 110 | 9,122(1.21%)#17 | 64,894(0.17%)#61 |
| 62. | Monsey | 109 | 8,808(1.24%)#2 | 64,894(0.17%)#62 |
| 63. | Colorado Springs | 108 | 1,186(9.11%)#2 | 64,894(0.17%)#63 |
| 64. | Bellevue | 108 | 1,673(6.46%)#3 | 64,894(0.17%)#64 |
| 65. | High Bridge Borough | 108 | 4,659(2.32%)#2 | 64,894(0.17%)#65 |
| 66. | Coral Springs | 106 | 9,122(1.16%)#18 | 64,894(0.16%)#66 |
| 67. | Oro Valley | 106 | 1,572(6.74%)#5 | 64,894(0.16%)#67 |
| 68. | Concord | 105 | 10,936(0.96%)#13 | 64,894(0.16%)#68 |
| 69. | Santa Monica | 104 | 10,936(0.95%)#14 | 64,894(0.16%)#69 |
| 70. | Rocky River | 104 | 2,140(4.86%)#2 | 64,894(0.16%)#70 |
| 71. | Boalsburg | 104 | 2,267(4.59%)#3 | 64,894(0.16%)#71 |
| 72. | Paradise | 103 | 1,513(6.81%)#4 | 64,894(0.16%)#72 |
| 73. | Palm Harbor | 102 | 9,122(1.12%)#19 | 64,894(0.16%)#73 |
| 74. | Bostonia | 102 | 10,936(0.93%)#15 | 64,894(0.16%)#74 |
| 75. | Thousand Oaks | 100 | 10,936(0.91%)#16 | 64,894(0.15%)#75 |
| 76. | Nashua | 100 | 332(30.12%)#1 | 64,894(0.15%)#76 |
| 77. | Dallas | 98 | 2,637(3.72%)#4 | 64,894(0.15%)#77 |
| 78. | Reno | 98 | 1,513(6.48%)#5 | 64,894(0.15%)#78 |
| 79. | Bethesda | 98 | 904(10.84%)#2 | 64,894(0.15%)#79 |
| 80. | Columbus | 97 | 2,140(4.53%)#3 | 64,894(0.15%)#80 |
| 81. | Four Corners | 97 | 193(50.26%)#1 | 64,894(0.15%)#81 |
| 82. | Pepperdine University | 97 | 10,936(0.89%)#17 | 64,894(0.15%)#82 |
| 83. | Lake Oswego | 96 | 943(10.18%)#3 | 64,894(0.15%)#83 |
| 84. | Aventura | 96 | 9,122(1.05%)#20 | 64,894(0.15%)#84 |
| 85. | Kiryas Joel | 96 | 8,808(1.09%)#3 | 64,894(0.15%)#85 |
| 86. | Asheville | 94 | 1,491(6.30%)#2 | 64,894(0.14%)#86 |
| 87. | Middleburg Heights | 94 | 2,140(4.39%)#4 | 64,894(0.14%)#87 |
| 88. | Surprise | 93 | 1,572(5.92%)#6 | 64,894(0.14%)#88 |
| 89. | Brookline | 93 | 1,910(4.87%)#3 | 64,894(0.14%)#89 |
| 90. | West Haven | 93 | 1,562(5.95%)#2 | 64,894(0.14%)#90 |
| 91. | Garfield Heights | 93 | 2,140(4.35%)#5 | 64,894(0.14%)#91 |
| 92. | Westchester | 92 | 9,122(1.01%)#21 | 64,894(0.14%)#92 |
| 93. | Menlo Park | 92 | 10,936(0.84%)#18 | 64,894(0.14%)#93 |
| 94. | Mineola | 92 | 8,808(1.04%)#4 | 64,894(0.14%)#94 |
| 95. | Fish Hawk | 91 | 9,122(1.00%)#22 | 64,894(0.14%)#95 |
| 96. | Woodbury | 91 | 8,808(1.03%)#5 | 64,894(0.14%)#96 |
| 97. | Fountain Valley | 89 | 10,936(0.81%)#19 | 64,894(0.14%)#97 |
| 98. | Ossining | 89 | 8,808(1.01%)#6 | 64,894(0.14%)#98 |
| 99. | Clearwater | 88 | 9,122(0.96%)#23 | 64,894(0.14%)#99 |
| 100. | Havre De Grace | 88 | 904(9.73%)#3 | 64,894(0.14%)#100 |
Common Questions
What are the Top 10 Cities with the Most Immigrants from Hungary in the United States?
Top 10 Cities with the Most Immigrants from Hungary in the United States are:
What city has the Most Immigrants from Hungary in the United States?
New York has the Most Immigrants from Hungary in the United States with 5,192.
What is the Total Immigrants from Hungary in the United States?
Total Immigrants from Hungary in the United States is 64,894.