Cities with the Highest Percentage of Immigrants from North Macedonia in the United States
RELATED REPORTS & OPTIONS
North Macedonia
United States
Compare Cities
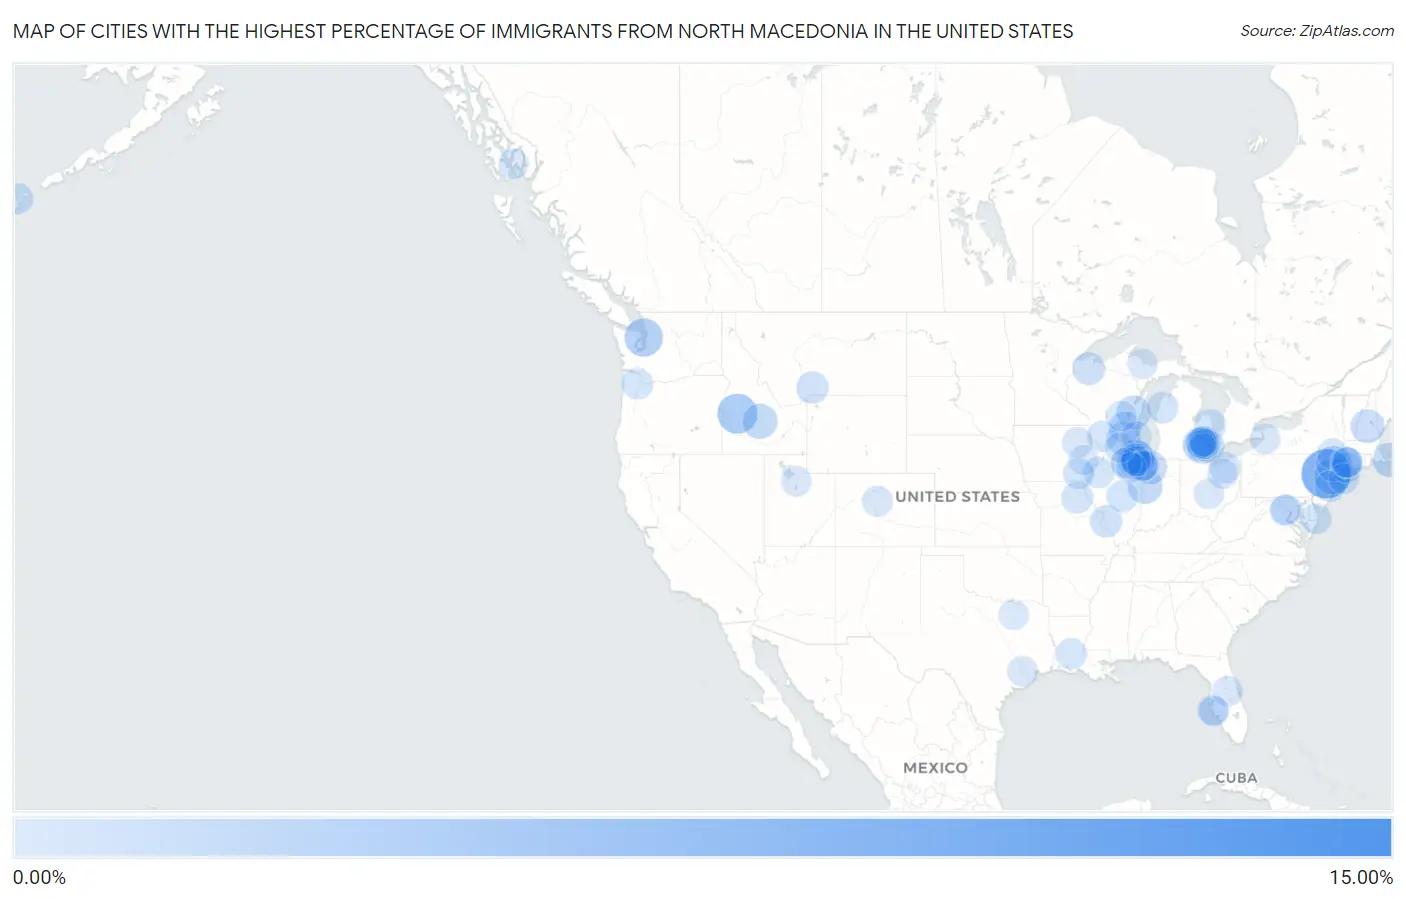
Map of Cities with the Highest Percentage of Immigrants from North Macedonia in the United States
0.00%
15.00%
Cities with the Highest Percentage of Immigrants from North Macedonia in the United States
| City | North Macedonia | vs State | vs National | |
| 1. | Foster | 12.77% | 0.016%(+12.8)#1 | 0.0086%(+12.8)#1 |
| 2. | Lake Telemark | 8.07% | 0.055%(+8.02)#1 | 0.0086%(+8.06)#2 |
| 3. | Garden Valley | 4.16% | 0.0065%(+4.15)#1 | 0.0086%(+4.15)#3 |
| 4. | Lincoln Park Borough | 3.62% | 0.055%(+3.56)#2 | 0.0086%(+3.61)#4 |
| 5. | Kingston | 3.47% | 0.0036%(+3.46)#1 | 0.0086%(+3.46)#5 |
| 6. | Countryside | 3.21% | 0.033%(+3.18)#1 | 0.0086%(+3.20)#6 |
| 7. | Garfield | 2.82% | 0.055%(+2.76)#3 | 0.0086%(+2.81)#7 |
| 8. | Balmville | 2.38% | 0.020%(+2.36)#1 | 0.0086%(+2.37)#8 |
| 9. | Attica | 2.19% | 0.016%(+2.17)#2 | 0.0086%(+2.18)#9 |
| 10. | Sun Valley | 2.17% | 0.0065%(+2.16)#2 | 0.0086%(+2.16)#10 |
| 11. | East Harwich | 1.95% | 0.0039%(+1.95)#1 | 0.0086%(+1.94)#11 |
| 12. | Elmwood Park Borough | 1.85% | 0.055%(+1.79)#4 | 0.0086%(+1.84)#12 |
| 13. | Whitewater | 1.76% | 0.016%(+1.75)#1 | 0.0086%(+1.75)#13 |
| 14. | La Crosse | 1.76% | 0.016%(+1.74)#3 | 0.0086%(+1.75)#14 |
| 15. | Potter | 1.75% | 0.016%(+1.73)#2 | 0.0086%(+1.74)#15 |
| 16. | Tilton Northfield | 1.68% | 0.0057%(+1.67)#1 | 0.0086%(+1.67)#16 |
| 17. | Palos Hills | 1.40% | 0.033%(+1.36)#2 | 0.0086%(+1.39)#17 |
| 18. | Indian Field | 1.33% | 0.037%(+1.29)#1 | 0.0086%(+1.32)#18 |
| 19. | Woodland Park Borough | 1.29% | 0.055%(+1.24)#5 | 0.0086%(+1.29)#19 |
| 20. | Hickory Hills | 1.25% | 0.033%(+1.22)#3 | 0.0086%(+1.25)#20 |
| 21. | Drummond | 1.20% | 0.016%(+1.18)#3 | 0.0086%(+1.19)#21 |
| 22. | Haledon Borough | 1.19% | 0.055%(+1.13)#6 | 0.0086%(+1.18)#22 |
| 23. | Oakland Borough | 1.18% | 0.055%(+1.12)#7 | 0.0086%(+1.17)#23 |
| 24. | Lyons | 1.16% | 0.033%(+1.13)#4 | 0.0086%(+1.15)#24 |
| 25. | Wallington Borough | 1.12% | 0.055%(+1.06)#8 | 0.0086%(+1.11)#25 |
| 26. | Utica | 1.10% | 0.039%(+1.06)#1 | 0.0086%(+1.09)#26 |
| 27. | Smithton | 1.05% | 0.033%(+1.02)#5 | 0.0086%(+1.04)#27 |
| 28. | Ball Pond | 0.99% | 0.037%(+0.951)#2 | 0.0086%(+0.979)#28 |
| 29. | Juneau | 0.99% | 0.016%(+0.971)#4 | 0.0086%(+0.978)#29 |
| 30. | Pray | 0.98% | 0.00092%(+0.982)#1 | 0.0086%(+0.975)#30 |
| 31. | Deckerville | 0.94% | 0.039%(+0.905)#2 | 0.0086%(+0.936)#31 |
| 32. | Village Of Grosse Pointe Shores | 0.92% | 0.039%(+0.880)#3 | 0.0086%(+0.911)#32 |
| 33. | Shelbina | 0.88% | 0.0020%(+0.876)#1 | 0.0086%(+0.869)#33 |
| 34. | Oakville | 0.86% | 0.037%(+0.826)#3 | 0.0086%(+0.854)#34 |
| 35. | Kaleva | 0.82% | 0.039%(+0.782)#4 | 0.0086%(+0.813)#35 |
| 36. | Crown Point | 0.79% | 0.016%(+0.779)#4 | 0.0086%(+0.786)#36 |
| 37. | Northville | 0.79% | 0.039%(+0.749)#5 | 0.0086%(+0.780)#37 |
| 38. | Wolverine Lake | 0.78% | 0.039%(+0.740)#6 | 0.0086%(+0.770)#38 |
| 39. | Unalaska | 0.76% | 0.023%(+0.737)#1 | 0.0086%(+0.751)#39 |
| 40. | Long Creek | 0.76% | 0.033%(+0.726)#6 | 0.0086%(+0.750)#40 |
| 41. | Middlebranch | 0.74% | 0.013%(+0.730)#1 | 0.0086%(+0.735)#41 |
| 42. | North Plains | 0.71% | 0.0037%(+0.709)#1 | 0.0086%(+0.705)#42 |
| 43. | Peapack And Gladstone Borough | 0.70% | 0.055%(+0.648)#9 | 0.0086%(+0.694)#43 |
| 44. | Alexis | 0.70% | 0.033%(+0.666)#7 | 0.0086%(+0.691)#44 |
| 45. | Robertsville | 0.67% | 0.055%(+0.617)#10 | 0.0086%(+0.664)#45 |
| 46. | Broadview Heights | 0.67% | 0.013%(+0.653)#2 | 0.0086%(+0.658)#46 |
| 47. | Wanaque Borough | 0.65% | 0.055%(+0.596)#11 | 0.0086%(+0.642)#47 |
| 48. | Fairfield | 0.64% | 0.0067%(+0.637)#1 | 0.0086%(+0.635)#48 |
| 49. | Pine Prairie | 0.64% | 0.0013%(+0.635)#1 | 0.0086%(+0.628)#49 |
| 50. | Birmingham | 0.63% | 0.039%(+0.591)#7 | 0.0086%(+0.622)#50 |
| 51. | Packanack Lake | 0.62% | 0.055%(+0.563)#12 | 0.0086%(+0.610)#51 |
| 52. | Newark | 0.61% | 0.033%(+0.573)#8 | 0.0086%(+0.597)#52 |
| 53. | Prospect Park Borough | 0.60% | 0.055%(+0.548)#13 | 0.0086%(+0.595)#53 |
| 54. | Dagsboro | 0.60% | 0.00080%(+0.597)#1 | 0.0086%(+0.589)#54 |
| 55. | St Clair Borough | 0.58% | 0.0022%(+0.576)#1 | 0.0086%(+0.570)#55 |
| 56. | Darien | 0.57% | 0.033%(+0.536)#9 | 0.0086%(+0.561)#56 |
| 57. | Audubon Borough | 0.56% | 0.055%(+0.508)#14 | 0.0086%(+0.555)#57 |
| 58. | Keego Harbor | 0.54% | 0.039%(+0.502)#8 | 0.0086%(+0.533)#58 |
| 59. | Linden | 0.54% | 0.016%(+0.523)#5 | 0.0086%(+0.530)#59 |
| 60. | Sylvan Lake | 0.52% | 0.039%(+0.481)#9 | 0.0086%(+0.512)#60 |
| 61. | Breckenridge | 0.52% | 0.0026%(+0.516)#1 | 0.0086%(+0.510)#61 |
| 62. | East Rutherford Borough | 0.51% | 0.055%(+0.454)#15 | 0.0086%(+0.500)#62 |
| 63. | Ledgewood | 0.51% | 0.055%(+0.454)#16 | 0.0086%(+0.500)#63 |
| 64. | West Hurley | 0.50% | 0.020%(+0.478)#2 | 0.0086%(+0.489)#64 |
| 65. | Westmont | 0.49% | 0.033%(+0.461)#10 | 0.0086%(+0.486)#65 |
| 66. | Dearborn Heights | 0.45% | 0.039%(+0.408)#10 | 0.0086%(+0.438)#66 |
| 67. | Berlin | 0.43% | 0.016%(+0.418)#6 | 0.0086%(+0.425)#67 |
| 68. | Granite | 0.43% | 0.00043%(+0.426)#1 | 0.0086%(+0.418)#68 |
| 69. | Schererville | 0.42% | 0.016%(+0.407)#5 | 0.0086%(+0.414)#69 |
| 70. | Bargaintown | 0.42% | 0.055%(+0.365)#17 | 0.0086%(+0.412)#70 |
| 71. | Lowes Island | 0.42% | 0.0037%(+0.413)#1 | 0.0086%(+0.409)#71 |
| 72. | Milltown Borough | 0.41% | 0.055%(+0.358)#18 | 0.0086%(+0.405)#72 |
| 73. | South Gate Ridge | 0.41% | 0.0048%(+0.404)#1 | 0.0086%(+0.400)#73 |
| 74. | Fairbank | 0.40% | 0.0067%(+0.396)#2 | 0.0086%(+0.394)#74 |
| 75. | Fulshear | 0.40% | 0.0037%(+0.395)#1 | 0.0086%(+0.390)#75 |
| 76. | Midland Park Borough | 0.40% | 0.055%(+0.344)#19 | 0.0086%(+0.390)#76 |
| 77. | Derby | 0.39% | 0.037%(+0.351)#4 | 0.0086%(+0.379)#77 |
| 78. | West Bay Shore | 0.38% | 0.020%(+0.360)#3 | 0.0086%(+0.372)#78 |
| 79. | Cedar Lake | 0.37% | 0.016%(+0.357)#6 | 0.0086%(+0.364)#79 |
| 80. | Watertown | 0.37% | 0.037%(+0.335)#5 | 0.0086%(+0.363)#80 |
| 81. | Millington | 0.36% | 0.033%(+0.327)#11 | 0.0086%(+0.352)#81 |
| 82. | Sterling Heights | 0.36% | 0.039%(+0.319)#11 | 0.0086%(+0.350)#82 |
| 83. | Lackawanna | 0.35% | 0.020%(+0.335)#4 | 0.0086%(+0.346)#83 |
| 84. | Pickerington | 0.35% | 0.013%(+0.335)#3 | 0.0086%(+0.340)#84 |
| 85. | Waterbury | 0.35% | 0.037%(+0.310)#6 | 0.0086%(+0.338)#85 |
| 86. | Coal City | 0.34% | 0.033%(+0.312)#12 | 0.0086%(+0.336)#86 |
| 87. | Allendale Borough | 0.34% | 0.055%(+0.282)#20 | 0.0086%(+0.329)#87 |
| 88. | Machesney Park | 0.32% | 0.033%(+0.291)#13 | 0.0086%(+0.315)#88 |
| 89. | Bay Hill | 0.32% | 0.0048%(+0.316)#2 | 0.0086%(+0.312)#89 |
| 90. | Cudahy | 0.32% | 0.016%(+0.299)#7 | 0.0086%(+0.307)#90 |
| 91. | Marquette | 0.31% | 0.039%(+0.275)#12 | 0.0086%(+0.306)#91 |
| 92. | Palos Park | 0.31% | 0.033%(+0.277)#14 | 0.0086%(+0.302)#92 |
| 93. | Rochester | 0.31% | 0.039%(+0.269)#13 | 0.0086%(+0.300)#93 |
| 94. | University Center | 0.31% | 0.0037%(+0.304)#2 | 0.0086%(+0.299)#94 |
| 95. | Coralville | 0.31% | 0.0067%(+0.300)#3 | 0.0086%(+0.298)#95 |
| 96. | Osprey | 0.31% | 0.0048%(+0.302)#3 | 0.0086%(+0.298)#96 |
| 97. | Rittman | 0.30% | 0.013%(+0.284)#4 | 0.0086%(+0.289)#97 |
| 98. | Wylie | 0.29% | 0.0037%(+0.291)#2 | 0.0086%(+0.286)#98 |
| 99. | Ketchikan | 0.29% | 0.023%(+0.271)#2 | 0.0086%(+0.285)#99 |
| 100. | Palisades Park Borough | 0.29% | 0.055%(+0.237)#21 | 0.0086%(+0.283)#100 |
Common Questions
What are the Top 10 Cities with the Highest Percentage of Immigrants from North Macedonia in the United States?
Top 10 Cities with the Highest Percentage of Immigrants from North Macedonia in the United States are:
#1
8.07%
#2
4.16%
#3
3.47%
#4
3.21%
#5
2.82%
#6
2.38%
#7
2.19%
#8
2.17%
#9
1.95%
#10
1.76%
What city has the Highest Percentage of Immigrants from North Macedonia in the United States?
Lake Telemark has the Highest Percentage of Immigrants from North Macedonia in the United States with 8.07%.
What is the Percentage of Immigrants from North Macedonia in the United States?
Percentage of Immigrants from North Macedonia in the United States is 0.0086%.