Cities with the Highest Percentage of Salvadoran Population in the United States
RELATED REPORTS & OPTIONS
Salvadoran
United States
Compare Cities
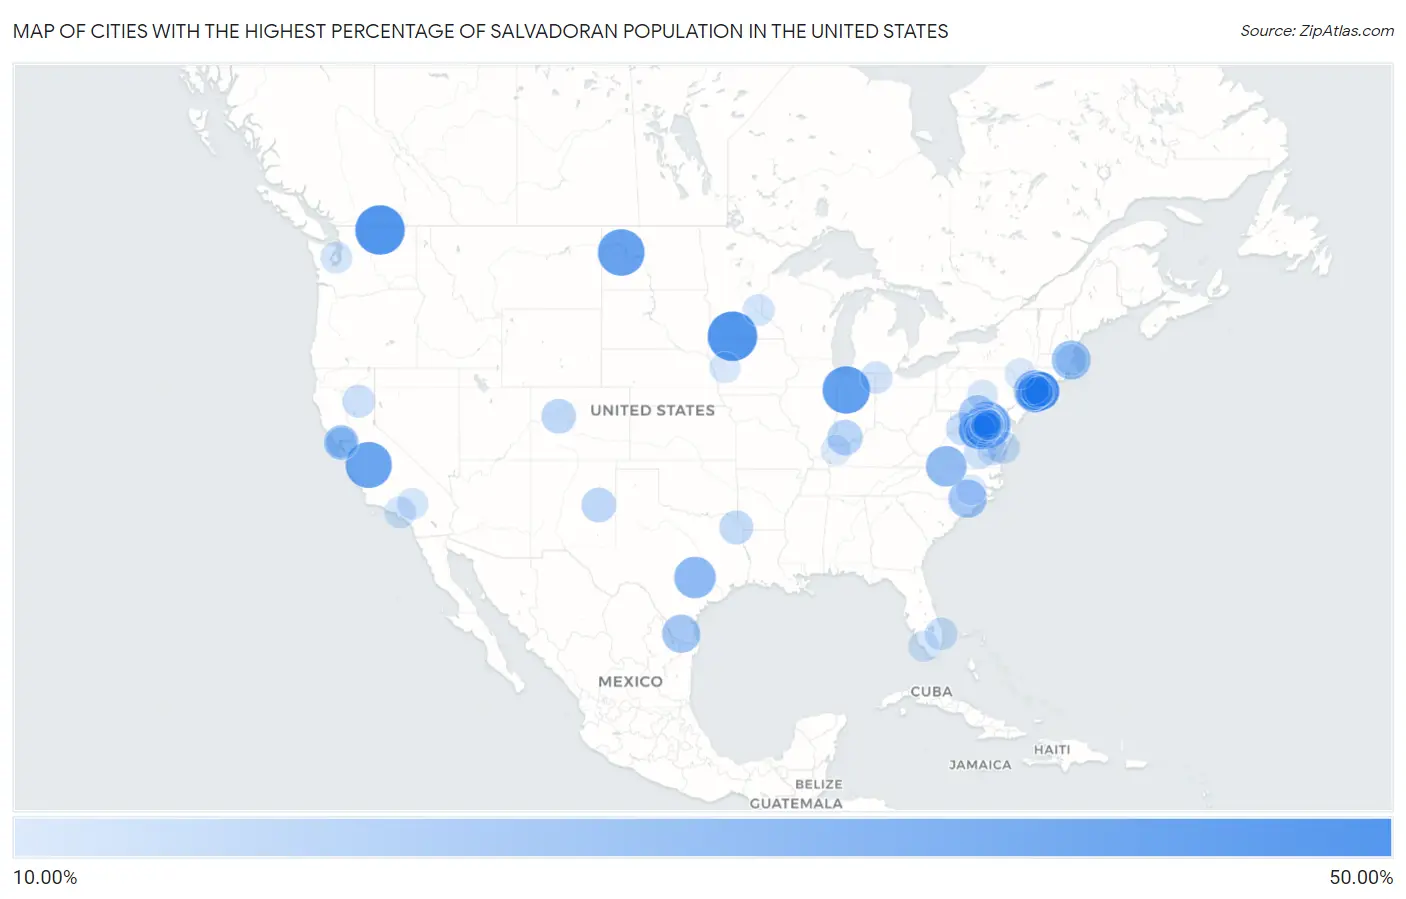
Map of Cities with the Highest Percentage of Salvadoran Population in the United States
0.00%
50.00%
Cities with the Highest Percentage of Salvadoran Population in the United States
| City | Salvadoran | vs State | vs National | |
| 1. | Alpha | 42.98% | 0.23%(+42.8)#1 | 0.72%(+42.3)#1 |
| 2. | Loomis | 42.86% | 0.35%(+42.5)#1 | 0.72%(+42.1)#2 |
| 3. | Monon | 39.40% | 0.20%(+39.2)#1 | 0.72%(+38.7)#3 |
| 4. | Mandaree | 38.45% | 0.11%(+38.3)#1 | 0.72%(+37.7)#4 |
| 5. | Landover Hills | 37.91% | 3.20%(+34.7)#1 | 0.72%(+37.2)#5 |
| 6. | Mendota | 37.43% | 1.91%(+35.5)#1 | 0.72%(+36.7)#6 |
| 7. | Edmonston | 35.98% | 3.20%(+32.8)#2 | 0.72%(+35.3)#7 |
| 8. | Berwyn Heights | 33.45% | 3.20%(+30.3)#3 | 0.72%(+32.7)#8 |
| 9. | Colmar Manor | 32.26% | 3.20%(+29.1)#4 | 0.72%(+31.5)#9 |
| 10. | Chillum | 31.05% | 3.20%(+27.8)#5 | 0.72%(+30.3)#10 |
| 11. | New Cassel | 30.99% | 0.94%(+30.1)#1 | 0.72%(+30.3)#11 |
| 12. | Rockfield | 30.26% | 0.20%(+30.1)#2 | 0.72%(+29.5)#12 |
| 13. | Wyldwood | 30.20% | 1.25%(+28.9)#1 | 0.72%(+29.5)#13 |
| 14. | Yorkshire | 29.79% | 2.02%(+27.8)#1 | 0.72%(+29.1)#14 |
| 15. | Laurel Park | 28.99% | 2.02%(+27.0)#2 | 0.72%(+28.3)#15 |
| 16. | Woodlawn Cdp Prince George S County | 28.88% | 3.20%(+25.7)#6 | 0.72%(+28.2)#16 |
| 17. | Loch Lomond | 27.66% | 2.02%(+25.6)#3 | 0.72%(+26.9)#17 |
| 18. | North Brentwood | 27.55% | 3.20%(+24.3)#7 | 0.72%(+26.8)#18 |
| 19. | Woodlawn Cdp Fairfax County | 27.47% | 2.02%(+25.5)#4 | 0.72%(+26.7)#19 |
| 20. | Fair Oaks | 27.44% | 0.20%(+27.2)#3 | 0.72%(+26.7)#20 |
| 21. | East Riverdale | 27.18% | 3.20%(+24.0)#8 | 0.72%(+26.5)#21 |
| 22. | Deerwood | 27.17% | 1.25%(+25.9)#2 | 0.72%(+26.4)#22 |
| 23. | Brentwood | 27.05% | 3.20%(+23.8)#9 | 0.72%(+26.3)#23 |
| 24. | Chelsea | 26.21% | 1.04%(+25.2)#1 | 0.72%(+25.5)#24 |
| 25. | Central Islip | 26.03% | 0.94%(+25.1)#2 | 0.72%(+25.3)#25 |
| 26. | Brentwood | 25.86% | 0.94%(+24.9)#3 | 0.72%(+25.1)#26 |
| 27. | Adelphi | 25.66% | 3.20%(+22.5)#10 | 0.72%(+24.9)#27 |
| 28. | North Bay Shore | 25.62% | 0.94%(+24.7)#4 | 0.72%(+24.9)#28 |
| 29. | Langley Park | 25.55% | 3.20%(+22.3)#11 | 0.72%(+24.8)#29 |
| 30. | Delmita | 25.00% | 1.25%(+23.8)#3 | 0.72%(+24.3)#30 |
| 31. | Ingold | 24.97% | 0.58%(+24.4)#1 | 0.72%(+24.2)#31 |
| 32. | Philadelphia | 24.75% | 0.20%(+24.6)#4 | 0.72%(+24.0)#32 |
| 33. | Roosevelt | 23.74% | 0.94%(+22.8)#5 | 0.72%(+23.0)#33 |
| 34. | Beltsville | 23.60% | 3.20%(+20.4)#12 | 0.72%(+22.9)#34 |
| 35. | Bagtown | 23.42% | 3.20%(+20.2)#13 | 0.72%(+22.7)#35 |
| 36. | Wheaton | 23.38% | 3.20%(+20.2)#14 | 0.72%(+22.7)#36 |
| 37. | Sudley | 21.56% | 2.02%(+19.5)#5 | 0.72%(+20.8)#37 |
| 38. | Hempstead | 21.48% | 0.94%(+20.5)#6 | 0.72%(+20.8)#38 |
| 39. | Huntingburg | 20.71% | 0.20%(+20.5)#5 | 0.72%(+20.0)#39 |
| 40. | Cottage City | 20.45% | 3.20%(+17.2)#15 | 0.72%(+19.7)#40 |
| 41. | Herndon | 19.93% | 2.02%(+17.9)#6 | 0.72%(+19.2)#41 |
| 42. | Sterling | 19.92% | 2.02%(+17.9)#7 | 0.72%(+19.2)#42 |
| 43. | Montalvin Manor | 19.86% | 1.91%(+18.0)#2 | 0.72%(+19.1)#43 |
| 44. | West Berlin | 19.70% | 0.88%(+18.8)#1 | 0.72%(+19.0)#44 |
| 45. | Uniondale | 19.70% | 0.94%(+18.8)#7 | 0.72%(+19.0)#45 |
| 46. | El Jebel | 19.52% | 0.34%(+19.2)#1 | 0.72%(+18.8)#46 |
| 47. | Fort Sumner | 19.49% | 0.16%(+19.3)#1 | 0.72%(+18.8)#47 |
| 48. | Spencerville | 19.34% | 3.20%(+16.1)#16 | 0.72%(+18.6)#48 |
| 49. | Manassas Park | 19.12% | 2.02%(+17.1)#8 | 0.72%(+18.4)#49 |
| 50. | Hyattsville | 18.84% | 3.20%(+15.6)#17 | 0.72%(+18.1)#50 |
| 51. | Forest Glen | 18.73% | 3.20%(+15.5)#18 | 0.72%(+18.0)#51 |
| 52. | Redland | 18.62% | 3.20%(+15.4)#19 | 0.72%(+17.9)#52 |
| 53. | Marietta | 18.45% | 1.25%(+17.2)#4 | 0.72%(+17.7)#53 |
| 54. | Bull Run | 18.30% | 2.02%(+16.3)#9 | 0.72%(+17.6)#54 |
| 55. | North Richmond | 18.24% | 1.91%(+16.3)#3 | 0.72%(+17.5)#55 |
| 56. | Glenmont | 18.18% | 3.20%(+15.0)#20 | 0.72%(+17.5)#56 |
| 57. | Inwood | 18.05% | 0.94%(+17.1)#8 | 0.72%(+17.3)#57 |
| 58. | Sugarland Run | 17.64% | 2.02%(+15.6)#10 | 0.72%(+16.9)#58 |
| 59. | Mifflintown Borough | 17.38% | 0.13%(+17.3)#1 | 0.72%(+16.7)#59 |
| 60. | Mount Jackson | 17.24% | 2.02%(+15.2)#11 | 0.72%(+16.5)#60 |
| 61. | Hutchison | 17.19% | 2.02%(+15.2)#12 | 0.72%(+16.5)#61 |
| 62. | Opal | 16.93% | 2.02%(+14.9)#13 | 0.72%(+16.2)#62 |
| 63. | Dumfries | 16.76% | 2.02%(+14.7)#14 | 0.72%(+16.0)#63 |
| 64. | Riverdale Park | 16.75% | 3.20%(+13.5)#21 | 0.72%(+16.0)#64 |
| 65. | Lake Almanor Country Club | 16.64% | 1.91%(+14.7)#4 | 0.72%(+15.9)#65 |
| 66. | Wyandanch | 16.42% | 0.94%(+15.5)#9 | 0.72%(+15.7)#66 |
| 67. | Arrowhead Beach | 16.41% | 0.58%(+15.8)#2 | 0.72%(+15.7)#67 |
| 68. | Dale City | 16.26% | 2.02%(+14.2)#15 | 0.72%(+15.5)#68 |
| 69. | Plantation Mobile Home Park | 16.17% | 0.37%(+15.8)#1 | 0.72%(+15.4)#69 |
| 70. | Onley | 15.85% | 2.02%(+13.8)#16 | 0.72%(+15.1)#70 |
| 71. | Bensley | 15.85% | 2.02%(+13.8)#17 | 0.72%(+15.1)#71 |
| 72. | Woodbridge | 15.76% | 2.02%(+13.7)#18 | 0.72%(+15.0)#72 |
| 73. | Pea Ridge | 15.74% | 0.089%(+15.6)#1 | 0.72%(+15.0)#73 |
| 74. | Hybla Valley | 15.65% | 2.02%(+13.6)#19 | 0.72%(+14.9)#74 |
| 75. | Blakeslee | 15.62% | 0.12%(+15.5)#1 | 0.72%(+14.9)#75 |
| 76. | New Carrollton | 15.60% | 3.20%(+12.4)#22 | 0.72%(+14.9)#76 |
| 77. | Seven Corners | 15.53% | 2.02%(+13.5)#20 | 0.72%(+14.8)#77 |
| 78. | Gorst | 15.15% | 0.35%(+14.8)#2 | 0.72%(+14.4)#78 |
| 79. | Landfall | 15.11% | 0.23%(+14.9)#2 | 0.72%(+14.4)#79 |
| 80. | Vernon | 14.89% | 1.91%(+13.0)#5 | 0.72%(+14.2)#80 |
| 81. | Everett | 14.80% | 1.04%(+13.8)#2 | 0.72%(+14.1)#81 |
| 82. | Mountain View Acres | 14.69% | 1.91%(+12.8)#6 | 0.72%(+14.0)#82 |
| 83. | Everglades | 14.69% | 0.37%(+14.3)#2 | 0.72%(+14.0)#83 |
| 84. | Denison | 14.25% | 0.26%(+14.0)#1 | 0.72%(+13.5)#84 |
| 85. | North Amityville | 14.23% | 0.94%(+13.3)#10 | 0.72%(+13.5)#85 |
| 86. | Hillandale | 14.19% | 3.20%(+11.0)#23 | 0.72%(+13.5)#86 |
| 87. | South Fallsburg | 14.19% | 0.94%(+13.3)#11 | 0.72%(+13.5)#87 |
| 88. | Glen Cove | 14.18% | 0.94%(+13.2)#12 | 0.72%(+13.5)#88 |
| 89. | Manassas | 14.08% | 2.02%(+12.1)#21 | 0.72%(+13.4)#89 |
| 90. | Saluda | 13.85% | 2.02%(+11.8)#22 | 0.72%(+13.1)#90 |
| 91. | Flower Hill | 13.75% | 3.20%(+10.6)#24 | 0.72%(+13.0)#91 |
| 92. | Aspen Hill | 13.60% | 3.20%(+10.4)#25 | 0.72%(+12.9)#92 |
| 93. | Mar Mac | 13.48% | 0.58%(+12.9)#3 | 0.72%(+12.8)#93 |
| 94. | East Salem | 13.48% | 0.13%(+13.3)#2 | 0.72%(+12.8)#94 |
| 95. | Islandia | 13.31% | 0.94%(+12.4)#13 | 0.72%(+12.6)#95 |
| 96. | Sebree | 13.24% | 0.078%(+13.2)#1 | 0.72%(+12.5)#96 |
| 97. | Mount Rainier | 13.23% | 3.20%(+10.0)#26 | 0.72%(+12.5)#97 |
| 98. | Glassmanor | 13.17% | 3.20%(+9.97)#27 | 0.72%(+12.4)#98 |
| 99. | Rollingwood | 13.12% | 1.91%(+11.2)#7 | 0.72%(+12.4)#99 |
| 100. | Seabrook | 13.02% | 3.20%(+9.82)#28 | 0.72%(+12.3)#100 |
Common Questions
What are the Top 10 Cities with the Highest Percentage of Salvadoran Population in the United States?
Top 10 Cities with the Highest Percentage of Salvadoran Population in the United States are:
What city has the Highest Percentage of Salvadoran Population in the United States?
Alpha has the Highest Percentage of Salvadoran Population in the United States with 42.98%.
What is the Percentage of Salvadoran Population in the United States?
Percentage of Salvadoran Population in the United States is 0.72%.