Cities with the Highest Percentage of West Indian Population in the United States
RELATED REPORTS & OPTIONS
West Indian
United States
Compare Cities
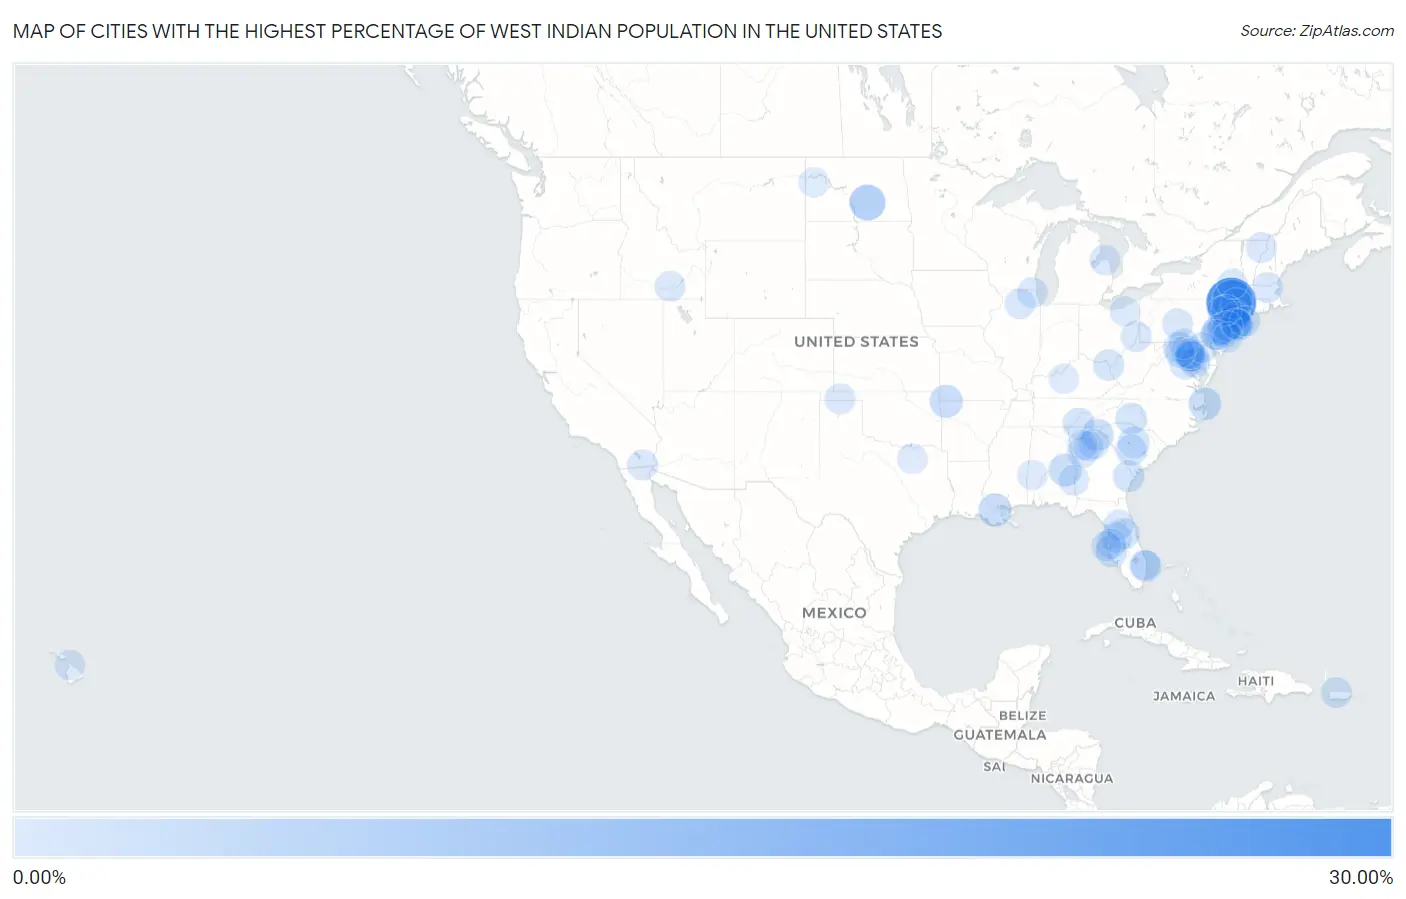
Map of Cities with the Highest Percentage of West Indian Population in the United States
0.00%
30.00%
Cities with the Highest Percentage of West Indian Population in the United States
| City | West Indian | vs State | vs National | |
| 1. | Tillson | 29.74% | 0.50%(+29.2)#1 | 0.081%(+29.7)#1 |
| 2. | East Kingston | 16.26% | 0.50%(+15.8)#2 | 0.081%(+16.2)#2 |
| 3. | Botsford | 11.21% | 0.14%(+11.1)#1 | 0.081%(+11.1)#3 |
| 4. | Menlo Park Terrace | 9.85% | 0.15%(+9.70)#1 | 0.081%(+9.77)#4 |
| 5. | Tappen | 9.09% | 0.0046%(+9.09)#1 | 0.081%(+9.01)#5 |
| 6. | Pea Ridge | 5.17% | 0.030%(+5.14)#1 | 0.081%(+5.09)#6 |
| 7. | Lutcher | 4.91% | 0.041%(+4.87)#1 | 0.081%(+4.83)#7 |
| 8. | Franklin | 4.53% | 0.040%(+4.49)#1 | 0.081%(+4.45)#8 |
| 9. | Coinjock | 4.32% | 0.073%(+4.25)#1 | 0.081%(+4.24)#9 |
| 10. | East Millstone | 4.25% | 0.15%(+4.10)#2 | 0.081%(+4.17)#10 |
| 11. | Griggstown | 3.90% | 0.15%(+3.75)#3 | 0.081%(+3.82)#11 |
| 12. | Cornelia | 3.85% | 0.12%(+3.73)#1 | 0.081%(+3.77)#12 |
| 13. | Haverstraw | 3.61% | 0.50%(+3.10)#3 | 0.081%(+3.52)#13 |
| 14. | Beesleys Point | 3.40% | 0.15%(+3.25)#4 | 0.081%(+3.32)#14 |
| 15. | Horsham | 3.30% | 0.082%(+3.21)#1 | 0.081%(+3.22)#15 |
| 16. | Memphis | 3.29% | 0.16%(+3.13)#1 | 0.081%(+3.21)#16 |
| 17. | Bloomingdale | 3.20% | 0.12%(+3.08)#2 | 0.081%(+3.12)#17 |
| 18. | Woodfield | 3.19% | 0.047%(+3.14)#1 | 0.081%(+3.11)#18 |
| 19. | East Cleveland | 3.17% | 0.021%(+3.15)#1 | 0.081%(+3.09)#19 |
| 20. | Weston | 2.89% | 0.14%(+2.74)#2 | 0.081%(+2.81)#20 |
| 21. | Iron Station | 2.86% | 0.073%(+2.79)#2 | 0.081%(+2.78)#21 |
| 22. | Laytonsville | 2.85% | 0.17%(+2.68)#1 | 0.081%(+2.77)#22 |
| 23. | Larksville Borough | 2.78% | 0.082%(+2.70)#2 | 0.081%(+2.70)#23 |
| 24. | Montverde | 2.69% | 0.16%(+2.53)#2 | 0.081%(+2.61)#24 |
| 25. | Penbrook Borough | 2.67% | 0.082%(+2.59)#3 | 0.081%(+2.59)#25 |
| 26. | North | 2.62% | 0.047%(+2.57)#2 | 0.081%(+2.54)#26 |
| 27. | Mount Vernon | 2.54% | 0.50%(+2.04)#4 | 0.081%(+2.46)#27 |
| 28. | Hawley Borough | 2.52% | 0.082%(+2.44)#4 | 0.081%(+2.44)#28 |
| 29. | Stroudsburg Borough | 2.49% | 0.082%(+2.41)#5 | 0.081%(+2.41)#29 |
| 30. | San Castle | 2.47% | 0.16%(+2.32)#3 | 0.081%(+2.39)#30 |
| 31. | Bellefonte | 2.47% | 0.016%(+2.45)#1 | 0.081%(+2.39)#31 |
| 32. | Kettering | 2.45% | 0.17%(+2.28)#2 | 0.081%(+2.37)#32 |
| 33. | Baldwin | 2.42% | 0.50%(+1.91)#5 | 0.081%(+2.34)#33 |
| 34. | Bogota Borough | 2.37% | 0.15%(+2.22)#5 | 0.081%(+2.29)#34 |
| 35. | Salisbury Center | 2.35% | 0.50%(+1.85)#6 | 0.081%(+2.27)#35 |
| 36. | Millbrook | 2.32% | 0.50%(+1.81)#7 | 0.081%(+2.23)#36 |
| 37. | Dade City North | 2.30% | 0.16%(+2.14)#4 | 0.081%(+2.22)#37 |
| 38. | Lambertville | 2.28% | 0.15%(+2.13)#6 | 0.081%(+2.20)#38 |
| 39. | Dumfries | 2.19% | 0.079%(+2.12)#1 | 0.081%(+2.11)#39 |
| 40. | South Floral Park | 2.13% | 0.50%(+1.62)#8 | 0.081%(+2.05)#40 |
| 41. | Shepherdstown | 2.11% | 0.0094%(+2.10)#1 | 0.081%(+2.03)#41 |
| 42. | Rosendale | 2.11% | 0.50%(+1.60)#9 | 0.081%(+2.03)#42 |
| 43. | Lakeview | 2.11% | 0.50%(+1.60)#10 | 0.081%(+2.02)#43 |
| 44. | Pine Grove Mills | 2.06% | 0.082%(+1.97)#6 | 0.081%(+1.97)#44 |
| 45. | Oak Bluffs | 2.04% | 0.096%(+1.94)#1 | 0.081%(+1.96)#45 |
| 46. | Bajadero | 1.98% | 0.11%(+1.87)#1 | 0.081%(+1.90)#46 |
| 47. | Stratford Downtown | 1.95% | 0.14%(+1.81)#3 | 0.081%(+1.87)#47 |
| 48. | Burlington Borough | 1.95% | 0.082%(+1.87)#7 | 0.081%(+1.87)#48 |
| 49. | Wolfhurst | 1.94% | 0.027%(+1.91)#1 | 0.081%(+1.86)#49 |
| 50. | Beaver Meadows Borough | 1.87% | 0.082%(+1.79)#8 | 0.081%(+1.79)#50 |
| 51. | Bald Eagle | 1.86% | 0.082%(+1.78)#9 | 0.081%(+1.78)#51 |
| 52. | Heber | 1.86% | 0.023%(+1.84)#1 | 0.081%(+1.78)#52 |
| 53. | Brentwood | 1.85% | 0.17%(+1.68)#3 | 0.081%(+1.77)#53 |
| 54. | Rafael Capo | 1.84% | 0.11%(+1.73)#2 | 0.081%(+1.76)#54 |
| 55. | Lake Belvedere Estates | 1.78% | 0.16%(+1.62)#5 | 0.081%(+1.70)#55 |
| 56. | Groton | 1.77% | 0.096%(+1.67)#2 | 0.081%(+1.69)#56 |
| 57. | Elmsford | 1.75% | 0.50%(+1.25)#11 | 0.081%(+1.67)#57 |
| 58. | West Burke | 1.71% | 0.0065%(+1.71)#1 | 0.081%(+1.63)#58 |
| 59. | Neptune City Borough | 1.71% | 0.15%(+1.56)#7 | 0.081%(+1.63)#59 |
| 60. | Silver Springs Shores | 1.69% | 0.16%(+1.53)#6 | 0.081%(+1.61)#60 |
| 61. | Hainesville | 1.66% | 0.026%(+1.64)#1 | 0.081%(+1.58)#61 |
| 62. | Port Austin | 1.65% | 0.014%(+1.64)#1 | 0.081%(+1.57)#62 |
| 63. | Goodwell | 1.61% | 0.016%(+1.59)#1 | 0.081%(+1.52)#63 |
| 64. | Acequia | 1.60% | 0.0083%(+1.60)#1 | 0.081%(+1.52)#64 |
| 65. | Palmarejo Comunidad Lajas Municipio | 1.58% | 0.11%(+1.47)#3 | 0.081%(+1.50)#65 |
| 66. | Eufaula | 1.58% | 0.040%(+1.54)#2 | 0.081%(+1.50)#66 |
| 67. | Tyrone | 1.56% | 0.12%(+1.43)#3 | 0.081%(+1.48)#67 |
| 68. | Twin Rivers | 1.55% | 0.15%(+1.40)#8 | 0.081%(+1.47)#68 |
| 69. | North Valley Stream | 1.54% | 0.50%(+1.04)#12 | 0.081%(+1.46)#69 |
| 70. | Fairplay | 1.54% | 0.12%(+1.41)#4 | 0.081%(+1.46)#70 |
| 71. | Lee | 1.54% | 0.026%(+1.51)#2 | 0.081%(+1.46)#71 |
| 72. | Port Jervis | 1.54% | 0.50%(+1.03)#13 | 0.081%(+1.46)#72 |
| 73. | University Park | 1.53% | 0.17%(+1.36)#4 | 0.081%(+1.45)#73 |
| 74. | Huntingtown | 1.52% | 0.17%(+1.35)#5 | 0.081%(+1.44)#74 |
| 75. | Chestnut Hill | 1.46% | 0.082%(+1.38)#10 | 0.081%(+1.38)#75 |
| 76. | Centereach | 1.44% | 0.50%(+0.938)#14 | 0.081%(+1.36)#76 |
| 77. | Iselin | 1.43% | 0.15%(+1.27)#9 | 0.081%(+1.35)#77 |
| 78. | Aberdeen Proving Ground | 1.41% | 0.17%(+1.23)#6 | 0.081%(+1.33)#78 |
| 79. | Walton Hills | 1.40% | 0.027%(+1.37)#2 | 0.081%(+1.32)#79 |
| 80. | Thurmont | 1.39% | 0.17%(+1.22)#7 | 0.081%(+1.31)#80 |
| 81. | Winder | 1.37% | 0.12%(+1.24)#5 | 0.081%(+1.29)#81 |
| 82. | Fairland | 1.36% | 0.17%(+1.18)#8 | 0.081%(+1.28)#82 |
| 83. | Halaula | 1.36% | 0.033%(+1.32)#1 | 0.081%(+1.27)#83 |
| 84. | Princeton | 1.34% | 0.040%(+1.30)#1 | 0.081%(+1.26)#84 |
| 85. | Hamilton | 1.34% | 0.079%(+1.26)#2 | 0.081%(+1.25)#85 |
| 86. | Egypt Lake Leto | 1.32% | 0.16%(+1.16)#7 | 0.081%(+1.24)#86 |
| 87. | Bowmanstown Borough | 1.32% | 0.082%(+1.23)#11 | 0.081%(+1.24)#87 |
| 88. | Mountain Park | 1.31% | 0.12%(+1.19)#6 | 0.081%(+1.23)#88 |
| 89. | Rotterdam | 1.31% | 0.50%(+0.801)#15 | 0.081%(+1.22)#89 |
| 90. | Arnegard | 1.29% | 0.0046%(+1.29)#2 | 0.081%(+1.21)#90 |
| 91. | Pennington | 1.27% | 0.040%(+1.23)#3 | 0.081%(+1.19)#91 |
| 92. | Washington Heights | 1.27% | 0.50%(+0.768)#16 | 0.081%(+1.19)#92 |
| 93. | Indian Shores | 1.27% | 0.16%(+1.11)#8 | 0.081%(+1.19)#93 |
| 94. | Chambersburg Borough | 1.27% | 0.082%(+1.19)#12 | 0.081%(+1.19)#94 |
| 95. | Elizabethtown | 1.26% | 0.016%(+1.24)#2 | 0.081%(+1.18)#95 |
| 96. | Marietta | 1.26% | 0.12%(+1.13)#7 | 0.081%(+1.18)#96 |
| 97. | Glenside | 1.20% | 0.082%(+1.12)#13 | 0.081%(+1.12)#97 |
| 98. | Crestwood Village | 1.20% | 0.15%(+1.05)#10 | 0.081%(+1.12)#98 |
| 99. | Renovo Borough | 1.20% | 0.082%(+1.12)#14 | 0.081%(+1.12)#99 |
| 100. | East | 1.17% | 0.14%(+1.03)#4 | 0.081%(+1.09)#100 |
Common Questions
What are the Top 10 Cities with the Highest Percentage of West Indian Population in the United States?
Top 10 Cities with the Highest Percentage of West Indian Population in the United States are:
What city has the Highest Percentage of West Indian Population in the United States?
Tillson has the Highest Percentage of West Indian Population in the United States with 29.74%.
What is the Percentage of West Indian Population in the United States?
Percentage of West Indian Population in the United States is 0.081%.