Cities with the Highest Percentage of Liberian Population in the United States
RELATED REPORTS & OPTIONS
Liberian
United States
Compare Cities
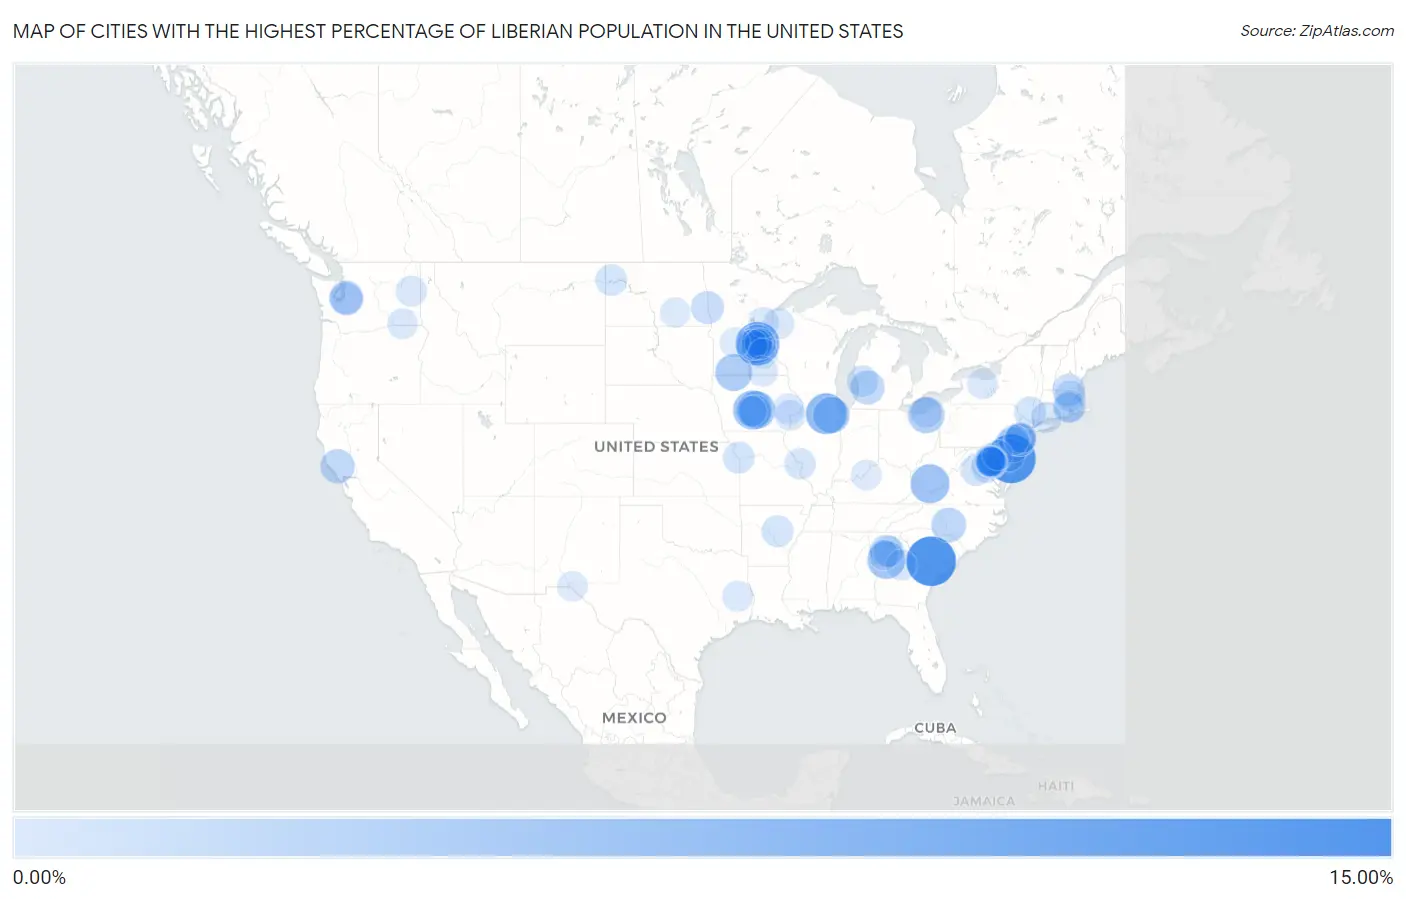
Map of Cities with the Highest Percentage of Liberian Population in the United States
0.00%
15.00%
Cities with the Highest Percentage of Liberian Population in the United States
| City | Liberian | vs State | vs National | |
| 1. | Denmark | 11.15% | 0.0090%(+11.1)#1 | 0.028%(+11.1)#1 |
| 2. | Rising Sun Lebanon | 10.79% | 0.10%(+10.7)#1 | 0.028%(+10.8)#2 |
| 3. | Darby Borough | 8.47% | 0.083%(+8.39)#1 | 0.028%(+8.44)#3 |
| 4. | Brooklyn Center | 7.79% | 0.25%(+7.55)#1 | 0.028%(+7.76)#4 |
| 5. | Colwyn Borough | 6.98% | 0.083%(+6.90)#2 | 0.028%(+6.96)#5 |
| 6. | Lisbon | 6.25% | 0.0056%(+6.24)#1 | 0.028%(+6.22)#6 |
| 7. | New Hope | 5.63% | 0.25%(+5.39)#2 | 0.028%(+5.61)#7 |
| 8. | Sophia | 5.20% | 0.0050%(+5.20)#1 | 0.028%(+5.17)#8 |
| 9. | Johnston | 5.13% | 0.12%(+5.02)#1 | 0.028%(+5.10)#9 |
| 10. | Bondurant | 4.73% | 0.12%(+4.61)#2 | 0.028%(+4.70)#10 |
| 11. | Hampton | 4.61% | 0.041%(+4.57)#1 | 0.028%(+4.58)#11 |
| 12. | Brooklyn Park | 4.54% | 0.25%(+4.29)#3 | 0.028%(+4.51)#12 |
| 13. | Sharon Hill Borough | 4.18% | 0.083%(+4.10)#3 | 0.028%(+4.16)#13 |
| 14. | Jackson | 4.06% | 0.25%(+3.81)#4 | 0.028%(+4.03)#14 |
| 15. | Prospect Park Borough | 3.99% | 0.083%(+3.91)#4 | 0.028%(+3.97)#15 |
| 16. | South Coatesville Borough | 3.94% | 0.083%(+3.86)#5 | 0.028%(+3.91)#16 |
| 17. | Elwood | 3.89% | 0.0056%(+3.88)#2 | 0.028%(+3.86)#17 |
| 18. | Orange | 3.88% | 0.028%(+3.85)#1 | 0.028%(+3.85)#18 |
| 19. | Lansdowne Borough | 3.68% | 0.083%(+3.60)#6 | 0.028%(+3.65)#19 |
| 20. | Boothwyn | 3.07% | 0.083%(+2.99)#7 | 0.028%(+3.04)#20 |
| 21. | Troy | 2.94% | 0.036%(+2.91)#1 | 0.028%(+2.92)#21 |
| 22. | Geyserville | 2.75% | 0.0068%(+2.74)#1 | 0.028%(+2.72)#22 |
| 23. | Kentwood | 2.61% | 0.024%(+2.58)#1 | 0.028%(+2.58)#23 |
| 24. | Lakeland North | 2.40% | 0.018%(+2.38)#1 | 0.028%(+2.37)#24 |
| 25. | Algona | 2.11% | 0.018%(+2.10)#2 | 0.028%(+2.09)#25 |
| 26. | Fargo | 2.02% | 0.41%(+1.61)#1 | 0.028%(+1.99)#26 |
| 27. | Clayton | 1.99% | 0.10%(+1.88)#2 | 0.028%(+1.96)#27 |
| 28. | Hudson | 1.86% | 0.027%(+1.83)#1 | 0.028%(+1.83)#28 |
| 29. | Chamblee | 1.82% | 0.041%(+1.78)#2 | 0.028%(+1.80)#29 |
| 30. | Altoona | 1.79% | 0.12%(+1.68)#3 | 0.028%(+1.77)#30 |
| 31. | Morton Borough | 1.78% | 0.083%(+1.69)#8 | 0.028%(+1.75)#31 |
| 32. | Burlington | 1.72% | 0.065%(+1.65)#1 | 0.028%(+1.69)#32 |
| 33. | Maple Grove | 1.71% | 0.25%(+1.46)#5 | 0.028%(+1.68)#33 |
| 34. | Penndel Borough | 1.68% | 0.083%(+1.60)#9 | 0.028%(+1.65)#34 |
| 35. | Millbourne Borough | 1.61% | 0.083%(+1.53)#10 | 0.028%(+1.59)#35 |
| 36. | Charleroi Borough | 1.59% | 0.083%(+1.50)#11 | 0.028%(+1.56)#36 |
| 37. | Croydon | 1.53% | 0.083%(+1.44)#12 | 0.028%(+1.50)#37 |
| 38. | Champlin | 1.51% | 0.25%(+1.26)#6 | 0.028%(+1.48)#38 |
| 39. | Hopkins | 1.50% | 0.25%(+1.26)#7 | 0.028%(+1.48)#39 |
| 40. | Collingdale Borough | 1.49% | 0.083%(+1.41)#13 | 0.028%(+1.46)#40 |
| 41. | Pawtucket | 1.46% | 0.33%(+1.12)#1 | 0.028%(+1.43)#41 |
| 42. | Walden | 1.38% | 0.024%(+1.36)#1 | 0.028%(+1.36)#42 |
| 43. | Riverside | 1.34% | 0.013%(+1.33)#1 | 0.028%(+1.32)#43 |
| 44. | Ward | 1.33% | 0.0034%(+1.33)#1 | 0.028%(+1.31)#44 |
| 45. | Culpeper | 1.29% | 0.027%(+1.26)#1 | 0.028%(+1.26)#45 |
| 46. | Williston | 1.28% | 0.41%(+0.872)#2 | 0.028%(+1.25)#46 |
| 47. | Ravenna | 1.25% | 0.024%(+1.23)#2 | 0.028%(+1.22)#47 |
| 48. | West Concord | 1.24% | 0.039%(+1.20)#1 | 0.028%(+1.21)#48 |
| 49. | William Paterson University Of New Jersey | 1.20% | 0.065%(+1.13)#2 | 0.028%(+1.17)#49 |
| 50. | Lilburn | 1.19% | 0.041%(+1.15)#3 | 0.028%(+1.16)#50 |
| 51. | Bristol Borough | 1.17% | 0.083%(+1.08)#14 | 0.028%(+1.14)#51 |
| 52. | Center Point | 1.16% | 0.0088%(+1.16)#1 | 0.028%(+1.14)#52 |
| 53. | Hazelwood | 1.15% | 0.013%(+1.14)#2 | 0.028%(+1.12)#53 |
| 54. | Providence | 1.15% | 0.33%(+0.815)#2 | 0.028%(+1.12)#54 |
| 55. | Yeadon Borough | 1.09% | 0.083%(+1.01)#15 | 0.028%(+1.06)#55 |
| 56. | Lake Barcroft | 1.08% | 0.027%(+1.05)#2 | 0.028%(+1.05)#56 |
| 57. | Mounds View | 1.02% | 0.25%(+0.768)#8 | 0.028%(+0.987)#57 |
| 58. | Fairless Hills | 1.01% | 0.083%(+0.927)#16 | 0.028%(+0.982)#58 |
| 59. | Minong | 0.98% | 0.0097%(+0.972)#1 | 0.028%(+0.954)#59 |
| 60. | Ansonia | 0.98% | 0.014%(+0.962)#1 | 0.028%(+0.948)#60 |
| 61. | Fairchild Afb | 0.97% | 0.018%(+0.956)#3 | 0.028%(+0.946)#61 |
| 62. | Hardwick | 0.97% | 0.041%(+0.927)#4 | 0.028%(+0.940)#62 |
| 63. | Kettering | 0.97% | 0.070%(+0.896)#1 | 0.028%(+0.938)#63 |
| 64. | Andover | 0.97% | 0.25%(+0.718)#9 | 0.028%(+0.937)#64 |
| 65. | Osseo | 0.95% | 0.25%(+0.702)#10 | 0.028%(+0.921)#65 |
| 66. | Clive | 0.94% | 0.12%(+0.821)#4 | 0.028%(+0.909)#66 |
| 67. | West Laurel | 0.90% | 0.070%(+0.830)#2 | 0.028%(+0.872)#67 |
| 68. | Sandstone | 0.90% | 0.25%(+0.649)#11 | 0.028%(+0.868)#68 |
| 69. | Tipton | 0.89% | 0.12%(+0.779)#5 | 0.028%(+0.867)#69 |
| 70. | Richmond Heights | 0.89% | 0.028%(+0.858)#2 | 0.028%(+0.859)#70 |
| 71. | Landover | 0.87% | 0.070%(+0.802)#3 | 0.028%(+0.844)#71 |
| 72. | White Oak | 0.86% | 0.070%(+0.789)#4 | 0.028%(+0.831)#72 |
| 73. | Crystal | 0.86% | 0.25%(+0.611)#12 | 0.028%(+0.830)#73 |
| 74. | Pittsford | 0.85% | 0.024%(+0.827)#2 | 0.028%(+0.824)#74 |
| 75. | Penn State Berks | 0.84% | 0.083%(+0.756)#17 | 0.028%(+0.811)#75 |
| 76. | Muscatine | 0.81% | 0.12%(+0.696)#6 | 0.028%(+0.783)#76 |
| 77. | Trenton | 0.81% | 0.065%(+0.741)#3 | 0.028%(+0.778)#77 |
| 78. | Diboll | 0.79% | 0.020%(+0.772)#1 | 0.028%(+0.764)#78 |
| 79. | Chillum | 0.79% | 0.070%(+0.715)#5 | 0.028%(+0.757)#79 |
| 80. | Woodbridge | 0.78% | 0.027%(+0.752)#3 | 0.028%(+0.751)#80 |
| 81. | Walla Walla | 0.77% | 0.018%(+0.756)#4 | 0.028%(+0.746)#81 |
| 82. | New Brighton | 0.77% | 0.25%(+0.522)#13 | 0.028%(+0.741)#82 |
| 83. | District Heights | 0.76% | 0.070%(+0.692)#6 | 0.028%(+0.734)#83 |
| 84. | Bladensburg | 0.74% | 0.070%(+0.672)#7 | 0.028%(+0.714)#84 |
| 85. | Austin | 0.73% | 0.25%(+0.487)#14 | 0.028%(+0.706)#85 |
| 86. | West Buechel | 0.72% | 0.012%(+0.711)#1 | 0.028%(+0.695)#86 |
| 87. | Glenn Dale | 0.72% | 0.070%(+0.652)#8 | 0.028%(+0.694)#87 |
| 88. | Fort Bliss | 0.71% | 0.020%(+0.692)#2 | 0.028%(+0.683)#88 |
| 89. | Plymouth Meeting | 0.70% | 0.083%(+0.612)#18 | 0.028%(+0.668)#89 |
| 90. | Coral Hills | 0.69% | 0.070%(+0.621)#9 | 0.028%(+0.662)#90 |
| 91. | Hampton | 0.68% | 0.25%(+0.430)#15 | 0.028%(+0.649)#91 |
| 92. | Maple Plain | 0.67% | 0.25%(+0.427)#16 | 0.028%(+0.646)#92 |
| 93. | Trainer Borough | 0.67% | 0.083%(+0.589)#19 | 0.028%(+0.644)#93 |
| 94. | East Point | 0.67% | 0.041%(+0.631)#5 | 0.028%(+0.644)#94 |
| 95. | East Lansdowne Borough | 0.67% | 0.083%(+0.583)#20 | 0.028%(+0.638)#95 |
| 96. | Rosedale | 0.66% | 0.070%(+0.588)#10 | 0.028%(+0.630)#96 |
| 97. | Mount Rainier | 0.65% | 0.070%(+0.584)#11 | 0.028%(+0.626)#97 |
| 98. | Gackle | 0.65% | 0.41%(+0.241)#3 | 0.028%(+0.619)#98 |
| 99. | Glenolden Borough | 0.64% | 0.083%(+0.556)#21 | 0.028%(+0.612)#99 |
| 100. | Kandiyohi | 0.64% | 0.25%(+0.390)#17 | 0.028%(+0.609)#100 |
Common Questions
What are the Top 10 Cities with the Highest Percentage of Liberian Population in the United States?
Top 10 Cities with the Highest Percentage of Liberian Population in the United States are:
What city has the Highest Percentage of Liberian Population in the United States?
Denmark has the Highest Percentage of Liberian Population in the United States with 11.15%.
What is the Percentage of Liberian Population in the United States?
Percentage of Liberian Population in the United States is 0.028%.