Cities with the Highest Percentage of Immigrants from Israel in the United States
RELATED REPORTS & OPTIONS
Israel
United States
Compare Cities
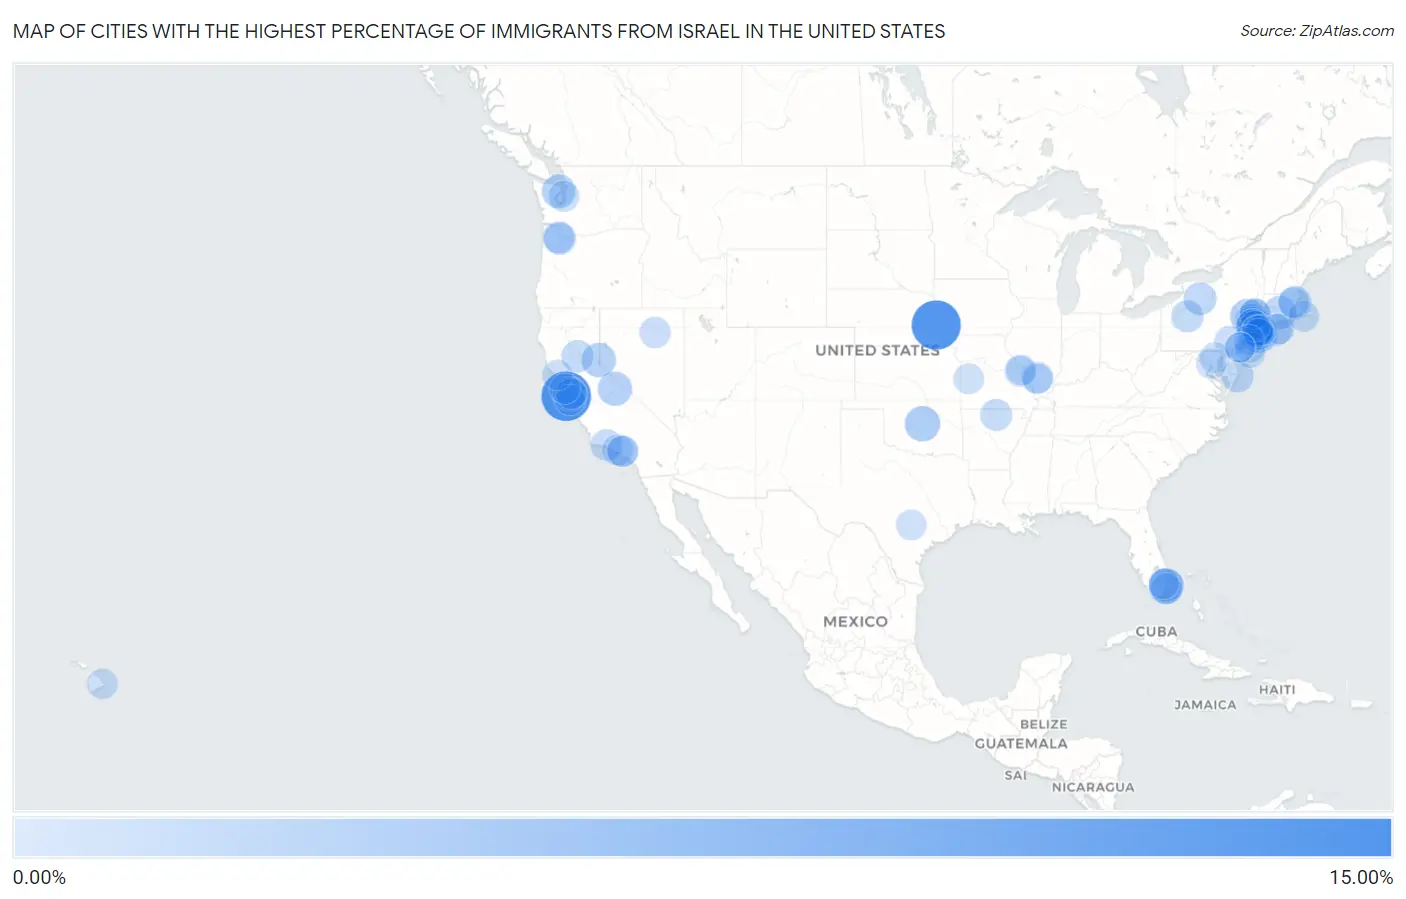
Map of Cities with the Highest Percentage of Immigrants from Israel in the United States
0.00%
15.00%
Cities with the Highest Percentage of Immigrants from Israel in the United States
| City | Israel | vs State | vs National | |
| 1. | Pescadero | 12.03% | 0.084%(+12.0)#-1 | 0.042%(+12.0)#0 |
| 2. | Wann | 11.83% | 0.0058%(+11.8)#-1 | 0.042%(+11.8)#1 |
| 3. | Lyndon Center | 10.85% | 0.015%(+10.8)#-1 | 0.042%(+10.8)#2 |
| 4. | Demarest Borough | 6.96% | 0.12%(+6.84)#-1 | 0.042%(+6.92)#3 |
| 5. | Cresskill Borough | 6.49% | 0.12%(+6.37)#0 | 0.042%(+6.45)#4 |
| 6. | Hewlett Harbor | 5.35% | 0.15%(+5.20)#4 | 0.042%(+5.31)#16 |
| 7. | Thomaston | 3.82% | 0.15%(+3.67)#5 | 0.042%(+3.78)#17 |
| 8. | Arcadia | 3.77% | 0.0054%(+3.77)#-1 | 0.042%(+3.73)#18 |
| 9. | Indian Creek | 3.70% | 0.067%(+3.64)#-1 | 0.042%(+3.66)#19 |
| 10. | Saddle Rock | 3.65% | 0.15%(+3.50)#6 | 0.042%(+3.60)#20 |
| 11. | Bloomingburg | 3.43% | 0.15%(+3.28)#7 | 0.042%(+3.39)#21 |
| 12. | Tenafly Borough | 3.23% | 0.12%(+3.11)#1 | 0.042%(+3.19)#22 |
| 13. | Mammoth Lakes | 3.18% | 0.084%(+3.10)#0 | 0.042%(+3.14)#23 |
| 14. | Carnelian Bay | 3.18% | 0.084%(+3.10)#1 | 0.042%(+3.14)#24 |
| 15. | Kiryas Joel | 3.17% | 0.15%(+3.02)#8 | 0.042%(+3.12)#25 |
| 16. | Hewlett Neck | 3.12% | 0.15%(+2.97)#9 | 0.042%(+3.08)#26 |
| 17. | Wesley Hills | 3.09% | 0.15%(+2.94)#10 | 0.042%(+3.04)#27 |
| 18. | Loyola | 2.96% | 0.084%(+2.88)#2 | 0.042%(+2.92)#28 |
| 19. | Saddle Rock Estates | 2.96% | 0.15%(+2.81)#11 | 0.042%(+2.92)#29 |
| 20. | Quilcene | 2.95% | 0.033%(+2.92)#-1 | 0.042%(+2.91)#30 |
| 21. | Aventura | 2.81% | 0.067%(+2.74)#0 | 0.042%(+2.76)#31 |
| 22. | New Hempstead | 2.68% | 0.15%(+2.53)#12 | 0.042%(+2.64)#32 |
| 23. | Mansfield Center | 2.65% | 0.038%(+2.62)#-1 | 0.042%(+2.61)#33 |
| 24. | Brookline | 2.62% | 0.087%(+2.53)#6 | 0.042%(+2.58)#100 |
| 25. | Cedarhurst | 2.39% | 0.15%(+2.25)#13 | 0.042%(+2.35)#101 |
| 26. | Rosanky | 2.35% | 0.017%(+2.34)#-1 | 0.042%(+2.31)#102 |
| 27. | Great Neck Estates | 2.35% | 0.15%(+2.20)#14 | 0.042%(+2.31)#103 |
| 28. | Great Neck Plaza | 2.34% | 0.15%(+2.19)#15 | 0.042%(+2.30)#104 |
| 29. | South Nyack | 2.33% | 0.15%(+2.18)#16 | 0.042%(+2.29)#105 |
| 30. | Deal Borough | 2.33% | 0.12%(+2.21)#2 | 0.042%(+2.28)#106 |
| 31. | Canaseraga | 2.32% | 0.15%(+2.17)#17 | 0.042%(+2.28)#107 |
| 32. | Hewlett Bay Park | 2.27% | 0.15%(+2.12)#18 | 0.042%(+2.22)#108 |
| 33. | West Ocean City | 2.13% | 0.061%(+2.07)#-1 | 0.042%(+2.09)#109 |
| 34. | Rockleigh Borough | 2.12% | 0.12%(+2.00)#3 | 0.042%(+2.07)#110 |
| 35. | Palermo | 2.08% | 0.084%(+2.00)#3 | 0.042%(+2.04)#111 |
| 36. | Kensington | 2.01% | 0.15%(+1.86)#19 | 0.042%(+1.96)#112 |
| 37. | Englewood Cliffs Borough | 1.98% | 0.12%(+1.86)#4 | 0.042%(+1.94)#113 |
| 38. | Wilcox | 1.98% | 0.026%(+1.95)#-1 | 0.042%(+1.94)#114 |
| 39. | South Wilton | 1.96% | 0.038%(+1.92)#0 | 0.042%(+1.92)#115 |
| 40. | North Hills | 1.95% | 0.15%(+1.81)#20 | 0.042%(+1.91)#116 |
| 41. | Woodmere | 1.95% | 0.15%(+1.80)#21 | 0.042%(+1.91)#153 |
| 42. | Cedar Mill | 1.94% | 0.047%(+1.90)#-1 | 0.042%(+1.90)#154 |
| 43. | Spackenkill | 1.94% | 0.15%(+1.79)#22 | 0.042%(+1.90)#155 |
| 44. | Calico Rock | 1.92% | 0.0044%(+1.92)#-1 | 0.042%(+1.88)#156 |
| 45. | Jekyll Island | 1.90% | 0.025%(+1.88)#-1 | 0.042%(+1.86)#157 |
| 46. | Renaissance At Monroe | 1.88% | 0.12%(+1.76)#5 | 0.042%(+1.84)#158 |
| 47. | Pleasantdale | 1.83% | 0.12%(+1.71)#6 | 0.042%(+1.79)#159 |
| 48. | Fair Lawn Borough | 1.81% | 0.12%(+1.70)#8 | 0.042%(+1.77)#200 |
| 49. | Kaser | 1.80% | 0.15%(+1.65)#23 | 0.042%(+1.76)#201 |
| 50. | Bethany | 1.79% | 0.047%(+1.74)#0 | 0.042%(+1.75)#202 |
| 51. | Airmont | 1.79% | 0.15%(+1.64)#24 | 0.042%(+1.74)#203 |
| 52. | Roslyn | 1.78% | 0.15%(+1.63)#25 | 0.042%(+1.73)#204 |
| 53. | Great Neck Gardens | 1.76% | 0.15%(+1.61)#26 | 0.042%(+1.71)#205 |
| 54. | Roslyn Estates | 1.63% | 0.15%(+1.48)#27 | 0.042%(+1.59)#206 |
| 55. | Fisher Island | 1.62% | 0.067%(+1.55)#1 | 0.042%(+1.57)#207 |
| 56. | Closter Borough | 1.61% | 0.12%(+1.49)#9 | 0.042%(+1.57)#208 |
| 57. | Clearbrook | 1.61% | 0.12%(+1.49)#10 | 0.042%(+1.57)#209 |
| 58. | Southampton | 1.61% | 0.15%(+1.46)#28 | 0.042%(+1.56)#210 |
| 59. | Toro Canyon | 1.60% | 0.084%(+1.51)#4 | 0.042%(+1.55)#211 |
| 60. | Beverly Hills | 1.59% | 0.084%(+1.50)#5 | 0.042%(+1.54)#212 |
| 61. | Pinon Hills | 1.55% | 0.084%(+1.47)#6 | 0.042%(+1.51)#213 |
| 62. | Radom | 1.54% | 0.033%(+1.51)#-1 | 0.042%(+1.50)#214 |
| 63. | Carlin | 1.52% | 0.077%(+1.44)#-1 | 0.042%(+1.48)#215 |
| 64. | Lido Beach | 1.49% | 0.15%(+1.34)#29 | 0.042%(+1.45)#216 |
| 65. | Russell Gardens | 1.45% | 0.15%(+1.31)#30 | 0.042%(+1.41)#217 |
| 66. | Sagaponack | 1.45% | 0.15%(+1.30)#31 | 0.042%(+1.41)#218 |
| 67. | Monsey | 1.44% | 0.15%(+1.29)#32 | 0.042%(+1.39)#219 |
| 68. | Oak Park | 1.42% | 0.084%(+1.33)#7 | 0.042%(+1.37)#220 |
| 69. | Manchester | 1.39% | 0.033%(+1.36)#0 | 0.042%(+1.35)#221 |
| 70. | Kings Point | 1.38% | 0.15%(+1.23)#33 | 0.042%(+1.33)#222 |
| 71. | Halfway House | 1.36% | 0.026%(+1.33)#0 | 0.042%(+1.31)#223 |
| 72. | New Seabury | 1.36% | 0.087%(+1.27)#7 | 0.042%(+1.31)#224 |
| 73. | Great Neck | 1.32% | 0.15%(+1.17)#34 | 0.042%(+1.28)#225 |
| 74. | Alpine Borough | 1.31% | 0.12%(+1.19)#11 | 0.042%(+1.27)#226 |
| 75. | Westwood | 1.29% | 0.012%(+1.28)#-1 | 0.042%(+1.25)#227 |
| 76. | Beach Haven West | 1.28% | 0.12%(+1.16)#12 | 0.042%(+1.24)#228 |
| 77. | West Hollywood | 1.28% | 0.084%(+1.19)#8 | 0.042%(+1.24)#229 |
| 78. | Arlington | 1.25% | 0.15%(+1.10)#35 | 0.042%(+1.21)#230 |
| 79. | Felton | 1.22% | 0.084%(+1.13)#9 | 0.042%(+1.17)#231 |
| 80. | Appleton City | 1.20% | 0.012%(+1.19)#0 | 0.042%(+1.16)#232 |
| 81. | Holiday Heights | 1.17% | 0.12%(+1.05)#13 | 0.042%(+1.13)#233 |
| 82. | Merion Station | 1.17% | 0.026%(+1.14)#4 | 0.042%(+1.13)#234 |
| 83. | Pikesville | 1.16% | 0.061%(+1.09)#1 | 0.042%(+1.11)#235 |
| 84. | Newton | 1.15% | 0.087%(+1.07)#21 | 0.042%(+1.11)#288 |
| 85. | Lake Dunlap | 1.15% | 0.017%(+1.13)#0 | 0.042%(+1.10)#289 |
| 86. | Bala Cynwyd | 1.14% | 0.026%(+1.12)#5 | 0.042%(+1.10)#290 |
| 87. | Hawaiian Beaches | 1.13% | 0.015%(+1.12)#-1 | 0.042%(+1.09)#291 |
| 88. | Oyster Bay Cove | 1.13% | 0.15%(+0.984)#36 | 0.042%(+1.09)#292 |
| 89. | Sunnyvale | 1.13% | 0.084%(+1.05)#18 | 0.042%(+1.09)#293 |
| 90. | Occidental | 1.13% | 0.084%(+1.05)#19 | 0.042%(+1.09)#294 |
| 91. | Cooper City | 1.12% | 0.067%(+1.05)#2 | 0.042%(+1.08)#295 |
| 92. | Orangeburg | 1.12% | 0.15%(+0.968)#37 | 0.042%(+1.07)#296 |
| 93. | Hewlett | 1.11% | 0.15%(+0.958)#38 | 0.042%(+1.06)#297 |
| 94. | Colma | 1.09% | 0.084%(+1.01)#20 | 0.042%(+1.05)#298 |
| 95. | Yorketown | 1.08% | 0.12%(+0.964)#14 | 0.042%(+1.04)#299 |
| 96. | Greentree | 1.08% | 0.12%(+0.962)#15 | 0.042%(+1.04)#300 |
| 97. | Kemp Mill | 1.06% | 0.061%(+0.996)#2 | 0.042%(+1.01)#301 |
| 98. | Hanley Hills | 1.05% | 0.012%(+1.04)#1 | 0.042%(+1.01)#302 |
| 99. | Du Bois | 1.03% | 0.033%(+0.998)#0 | 0.042%(+0.989)#303 |
| 100. | Springdale | 1.03% | 0.12%(+0.911)#16 | 0.042%(+0.988)#304 |
Common Questions
What are the Top 10 Cities with the Highest Percentage of Immigrants from Israel in the United States?
Top 10 Cities with the Highest Percentage of Immigrants from Israel in the United States are:
#1
12.03%
#2
11.83%
#3
5.35%
#4
3.82%
#5
3.77%
#6
3.70%
#7
3.65%
#8
3.43%
#9
3.18%
#10
3.18%
What city has the Highest Percentage of Immigrants from Israel in the United States?
Pescadero has the Highest Percentage of Immigrants from Israel in the United States with 12.03%.
What is the Percentage of Immigrants from Israel in the United States?
Percentage of Immigrants from Israel in the United States is 0.042%.