Summerville, SC Map & Demographics
Summerville Map
Summerville Overview
$38,714
PER CAPITA INCOME
$95,842
AVG FAMILY INCOME
$73,712
AVG HOUSEHOLD INCOME
32.2%
WAGE / INCOME GAP [ % ]
67.8¢/ $1
WAGE / INCOME GAP [ $ ]
$10,042
FAMILY INCOME DEFICIT
0.42
INEQUALITY / GINI INDEX
50,839
TOTAL POPULATION
24,356
MALE POPULATION
26,483
FEMALE POPULATION
91.97
MALES / 100 FEMALES
108.73
FEMALES / 100 MALES
38.8
MEDIAN AGE
3.0
AVG FAMILY SIZE
2.5
AVG HOUSEHOLD SIZE
27,272
LABOR FORCE [ PEOPLE ]
67.6%
PERCENT IN LABOR FORCE
5.8%
UNEMPLOYMENT RATE
Summerville Area Codes
Income in Summerville
Income Overview in Summerville
Per Capita Income in Summerville is $38,714, while median incomes of families and households are $95,842 and $73,712 respectively.
| Characteristic | Number | Measure |
| Per Capita Income | 50,839 | $38,714 |
| Median Family Income | 13,561 | $95,842 |
| Mean Family Income | 13,561 | $112,750 |
| Median Household Income | 20,137 | $73,712 |
| Mean Household Income | 20,137 | $95,031 |
| Income Deficit | 13,561 | $10,042 |
| Wage / Income Gap (%) | 50,839 | 32.20% |
| Wage / Income Gap ($) | 50,839 | 67.80¢ per $1 |
| Gini / Inequality Index | 50,839 | 0.42 |
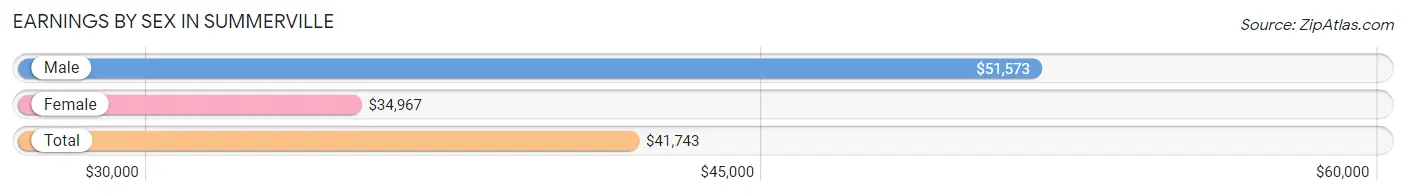
Earnings by Sex in Summerville
Average Earnings in Summerville are $41,743, $51,573 for men and $34,967 for women, a difference of 32.2%.
| Sex | Number | Average Earnings |
| Male | 14,375 (51.7%) | $51,573 |
| Female | 13,447 (48.3%) | $34,967 |
| Total | 27,822 (100.0%) | $41,743 |
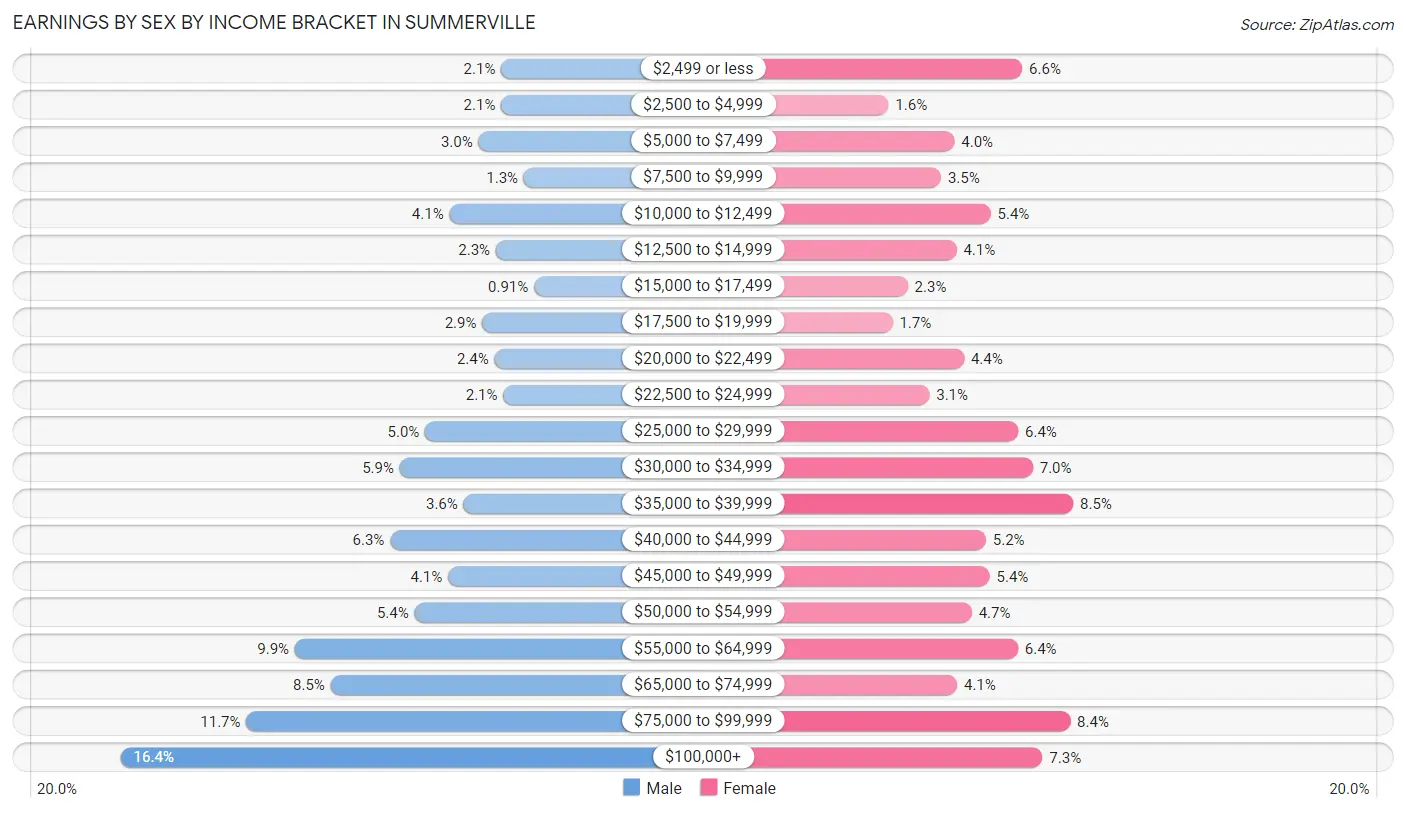
Earnings by Sex by Income Bracket in Summerville
The most common earnings brackets in Summerville are $100,000+ for men (2,358 | 16.4%) and $35,000 to $39,999 for women (1,140 | 8.5%).
| Income | Male | Female |
| $2,499 or less | 307 (2.1%) | 884 (6.6%) |
| $2,500 to $4,999 | 308 (2.1%) | 210 (1.6%) |
| $5,000 to $7,499 | 430 (3.0%) | 542 (4.0%) |
| $7,500 to $9,999 | 185 (1.3%) | 475 (3.5%) |
| $10,000 to $12,499 | 587 (4.1%) | 725 (5.4%) |
| $12,500 to $14,999 | 337 (2.3%) | 552 (4.1%) |
| $15,000 to $17,499 | 131 (0.9%) | 307 (2.3%) |
| $17,500 to $19,999 | 409 (2.9%) | 230 (1.7%) |
| $20,000 to $22,499 | 344 (2.4%) | 590 (4.4%) |
| $22,500 to $24,999 | 296 (2.1%) | 415 (3.1%) |
| $25,000 to $29,999 | 718 (5.0%) | 863 (6.4%) |
| $30,000 to $34,999 | 854 (5.9%) | 937 (7.0%) |
| $35,000 to $39,999 | 511 (3.5%) | 1,140 (8.5%) |
| $40,000 to $44,999 | 906 (6.3%) | 700 (5.2%) |
| $45,000 to $49,999 | 594 (4.1%) | 720 (5.3%) |
| $50,000 to $54,999 | 775 (5.4%) | 629 (4.7%) |
| $55,000 to $64,999 | 1,419 (9.9%) | 862 (6.4%) |
| $65,000 to $74,999 | 1,226 (8.5%) | 555 (4.1%) |
| $75,000 to $99,999 | 1,680 (11.7%) | 1,126 (8.4%) |
| $100,000+ | 2,358 (16.4%) | 985 (7.3%) |
| Total | 14,375 (100.0%) | 13,447 (100.0%) |
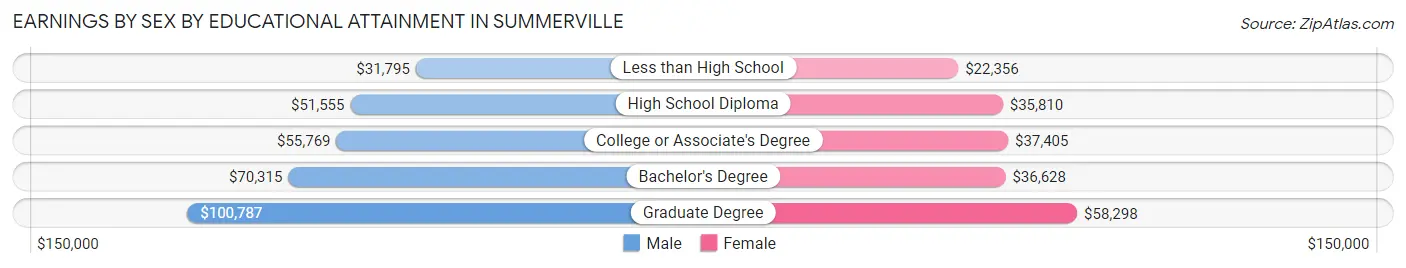
Earnings by Sex by Educational Attainment in Summerville
Average earnings in Summerville are $57,698 for men and $38,538 for women, a difference of 33.2%. Men with an educational attainment of graduate degree enjoy the highest average annual earnings of $100,787, while those with less than high school education earn the least with $31,795. Women with an educational attainment of graduate degree earn the most with the average annual earnings of $58,298, while those with less than high school education have the smallest earnings of $22,356.
| Educational Attainment | Male Income | Female Income |
| Less than High School | $31,795 | $22,356 |
| High School Diploma | $51,555 | $35,810 |
| College or Associate's Degree | $55,769 | $37,405 |
| Bachelor's Degree | $70,315 | $36,628 |
| Graduate Degree | $100,787 | $58,298 |
| Total | $57,698 | $38,538 |
Family Income in Summerville
Family Income Brackets in Summerville
According to the Summerville family income data, there are 3,038 families falling into the $100,000 to $149,999 income range, which is the most common income bracket and makes up 22.4% of all families. Conversely, the $10,000 to $14,999 income bracket is the least frequent group with only 149 families (1.1%) belonging to this category.
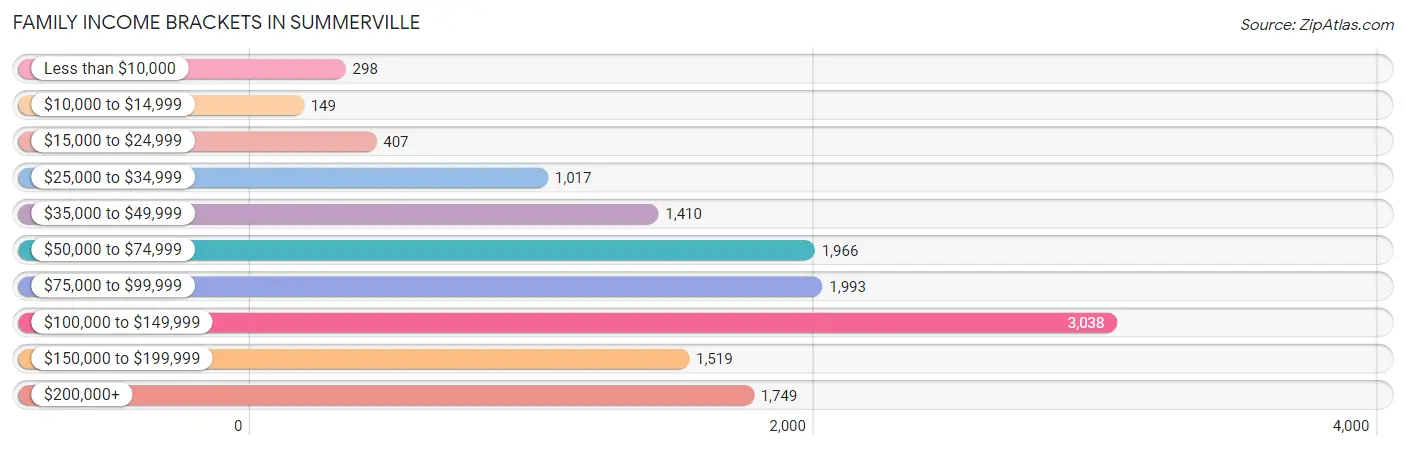
| Income Bracket | # Families | % Families |
| Less than $10,000 | 298 | 2.2% |
| $10,000 to $14,999 | 149 | 1.1% |
| $15,000 to $24,999 | 407 | 3.0% |
| $25,000 to $34,999 | 1,017 | 7.5% |
| $35,000 to $49,999 | 1,410 | 10.4% |
| $50,000 to $74,999 | 1,966 | 14.5% |
| $75,000 to $99,999 | 1,993 | 14.7% |
| $100,000 to $149,999 | 3,038 | 22.4% |
| $150,000 to $199,999 | 1,519 | 11.2% |
| $200,000+ | 1,749 | 12.9% |
Family Income by Famaliy Size in Summerville
6-person families (270 | 2.0%) account for the highest median family income in Summerville with $152,361 per family, while 2-person families (6,876 | 50.7%) have the highest median income of $45,566 per family member.
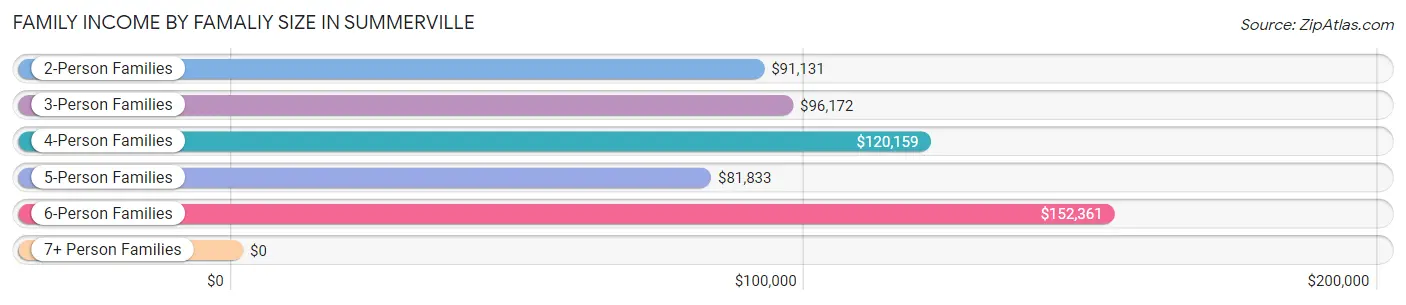
| Income Bracket | # Families | Median Income |
| 2-Person Families | 6,876 (50.7%) | $91,131 |
| 3-Person Families | 3,222 (23.8%) | $96,172 |
| 4-Person Families | 2,022 (14.9%) | $120,159 |
| 5-Person Families | 998 (7.4%) | $81,833 |
| 6-Person Families | 270 (2.0%) | $152,361 |
| 7+ Person Families | 173 (1.3%) | $0 |
| Total | 13,561 (100.0%) | $95,842 |
Family Income by Number of Earners in Summerville
The median family income in Summerville is $95,842, with families comprising 3+ earners (1,147) having the highest median family income of $133,578, while families with 1 earner (4,860) have the lowest median family income of $55,019, accounting for 8.5% and 35.8% of families, respectively.
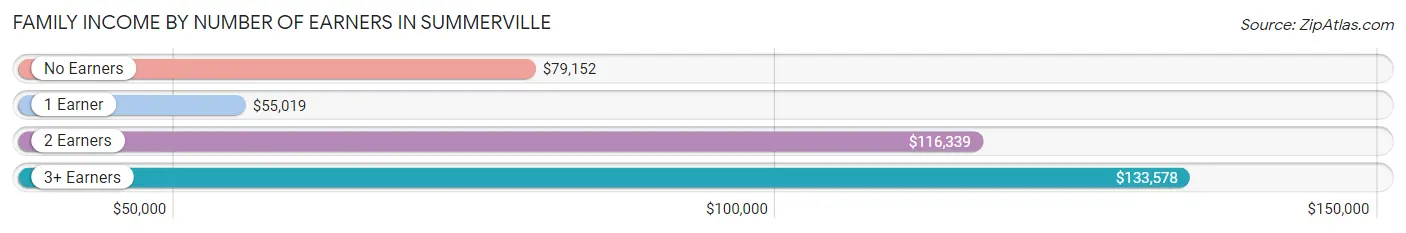
| Number of Earners | # Families | Median Income |
| No Earners | 1,599 (11.8%) | $79,152 |
| 1 Earner | 4,860 (35.8%) | $55,019 |
| 2 Earners | 5,955 (43.9%) | $116,339 |
| 3+ Earners | 1,147 (8.5%) | $133,578 |
| Total | 13,561 (100.0%) | $95,842 |
Household Income in Summerville
Household Income Brackets in Summerville
With 3,705 households falling in the category, the $100,000 to $149,999 income range is the most frequent in Summerville, accounting for 18.4% of all households. In contrast, only 564 households (2.8%) fall into the less than $10,000 income bracket, making it the least populous group.
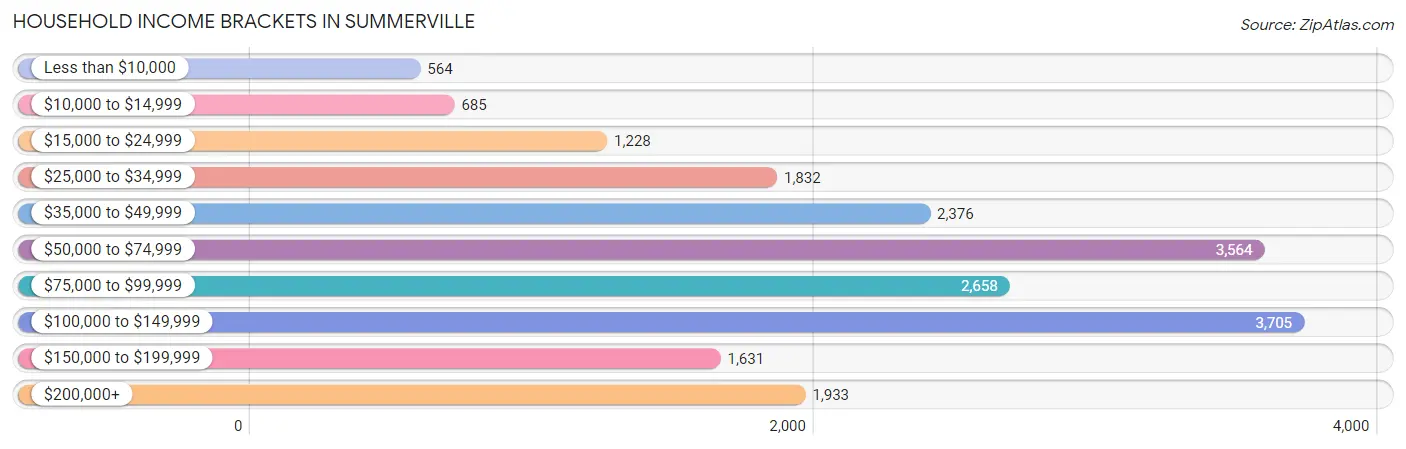
| Income Bracket | # Households | % Households |
| Less than $10,000 | 564 | 2.8% |
| $10,000 to $14,999 | 685 | 3.4% |
| $15,000 to $24,999 | 1,228 | 6.1% |
| $25,000 to $34,999 | 1,832 | 9.1% |
| $35,000 to $49,999 | 2,376 | 11.8% |
| $50,000 to $74,999 | 3,564 | 17.7% |
| $75,000 to $99,999 | 2,658 | 13.2% |
| $100,000 to $149,999 | 3,705 | 18.4% |
| $150,000 to $199,999 | 1,631 | 8.1% |
| $200,000+ | 1,933 | 9.6% |
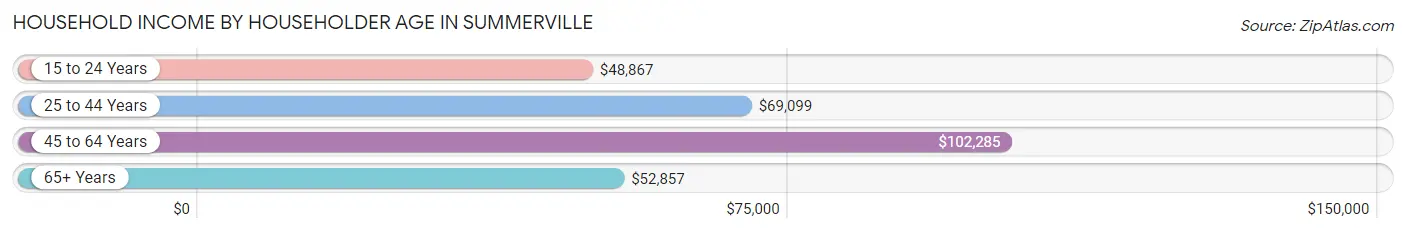
Household Income by Householder Age in Summerville
The median household income in Summerville is $73,712, with the highest median household income of $102,285 found in the 45 to 64 years age bracket for the primary householder. A total of 7,681 households (38.1%) fall into this category. Meanwhile, the 15 to 24 years age bracket for the primary householder has the lowest median household income of $48,867, with 717 households (3.6%) in this group.
| Income Bracket | # Households | Median Income |
| 15 to 24 Years | 717 (3.6%) | $48,867 |
| 25 to 44 Years | 6,819 (33.9%) | $69,099 |
| 45 to 64 Years | 7,681 (38.1%) | $102,285 |
| 65+ Years | 4,920 (24.4%) | $52,857 |
| Total | 20,137 (100.0%) | $73,712 |
Poverty in Summerville
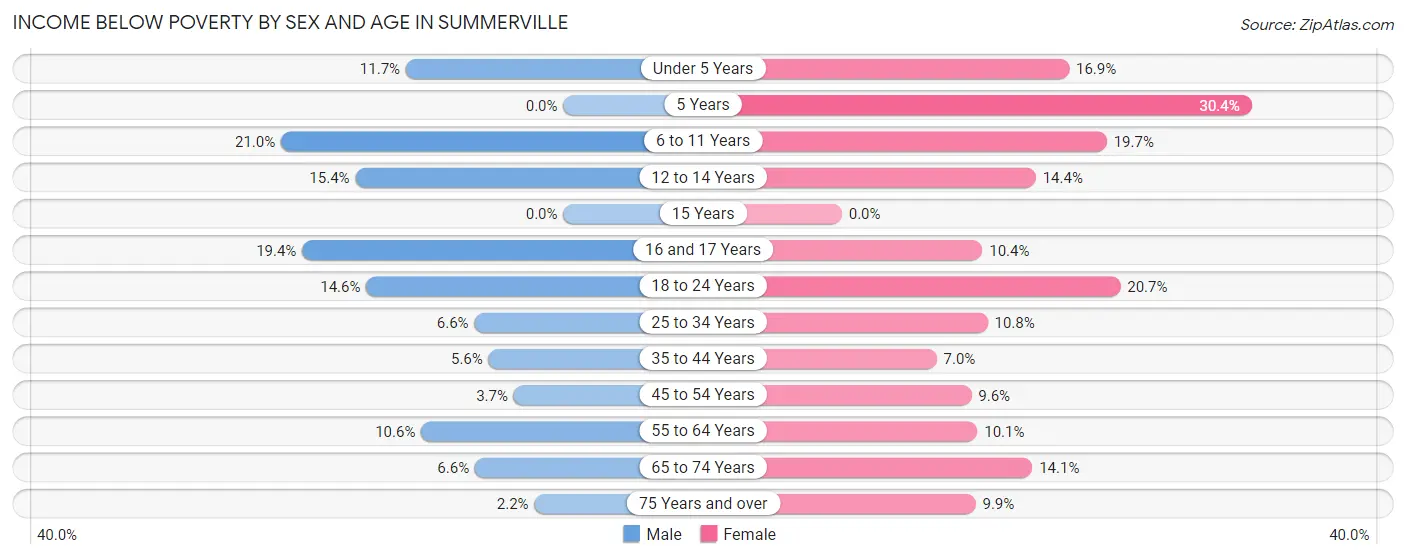
Income Below Poverty by Sex and Age in Summerville
With 9.2% poverty level for males and 12.3% for females among the residents of Summerville, 6 to 11 year old males and 5 year old females are the most vulnerable to poverty, with 348 males (21.0%) and 80 females (30.4%) in their respective age groups living below the poverty level.
| Age Bracket | Male | Female |
| Under 5 Years | 215 (11.7%) | 259 (16.9%) |
| 5 Years | 0 (0.0%) | 80 (30.4%) |
| 6 to 11 Years | 348 (21.0%) | 386 (19.7%) |
| 12 to 14 Years | 172 (15.4%) | 142 (14.4%) |
| 15 Years | 0 (0.0%) | 0 (0.0%) |
| 16 and 17 Years | 127 (19.4%) | 70 (10.4%) |
| 18 to 24 Years | 327 (14.6%) | 383 (20.7%) |
| 25 to 34 Years | 196 (6.6%) | 402 (10.8%) |
| 35 to 44 Years | 164 (5.6%) | 277 (7.0%) |
| 45 to 54 Years | 117 (3.7%) | 293 (9.6%) |
| 55 to 64 Years | 395 (10.5%) | 364 (10.1%) |
| 65 to 74 Years | 129 (6.6%) | 423 (14.1%) |
| 75 Years and over | 23 (2.1%) | 149 (9.9%) |
| Total | 2,213 (9.2%) | 3,228 (12.3%) |
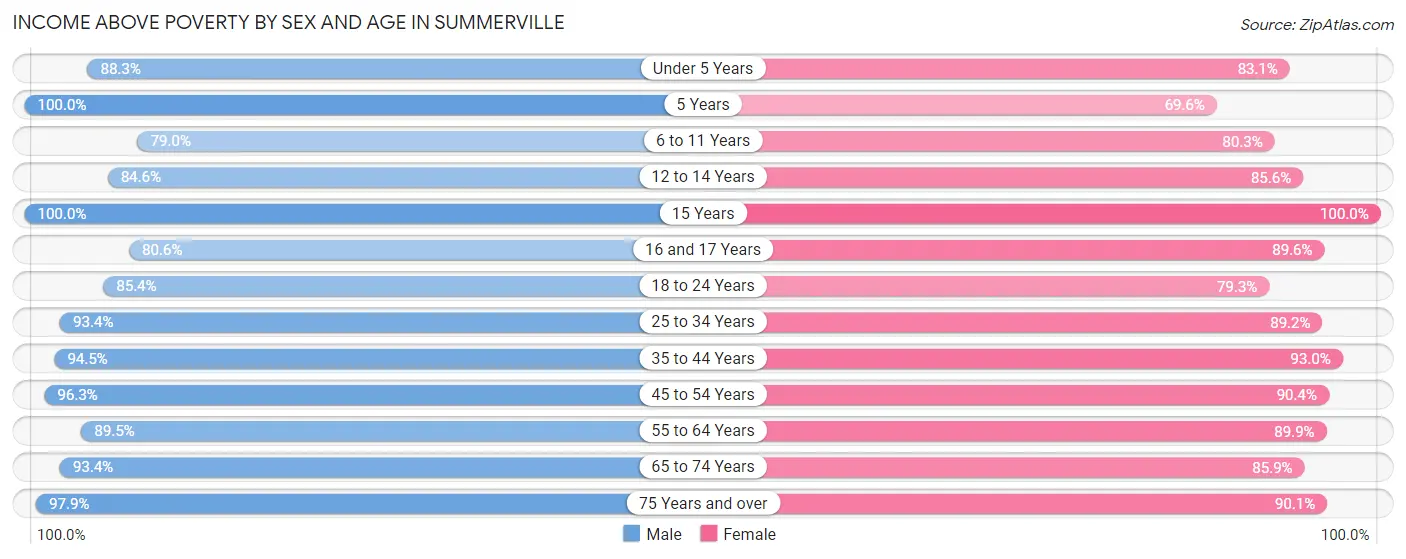
Income Above Poverty by Sex and Age in Summerville
According to the poverty statistics in Summerville, males aged 5 years and females aged 15 years are the age groups that are most secure financially, with 100.0% of males and 100.0% of females in these age groups living above the poverty line.
| Age Bracket | Male | Female |
| Under 5 Years | 1,624 (88.3%) | 1,276 (83.1%) |
| 5 Years | 532 (100.0%) | 183 (69.6%) |
| 6 to 11 Years | 1,312 (79.0%) | 1,576 (80.3%) |
| 12 to 14 Years | 942 (84.6%) | 844 (85.6%) |
| 15 Years | 229 (100.0%) | 227 (100.0%) |
| 16 and 17 Years | 528 (80.6%) | 601 (89.6%) |
| 18 to 24 Years | 1,908 (85.4%) | 1,469 (79.3%) |
| 25 to 34 Years | 2,775 (93.4%) | 3,314 (89.2%) |
| 35 to 44 Years | 2,791 (94.5%) | 3,657 (93.0%) |
| 45 to 54 Years | 3,065 (96.3%) | 2,752 (90.4%) |
| 55 to 64 Years | 3,350 (89.4%) | 3,253 (89.9%) |
| 65 to 74 Years | 1,836 (93.4%) | 2,568 (85.9%) |
| 75 Years and over | 1,047 (97.9%) | 1,352 (90.1%) |
| Total | 21,939 (90.8%) | 23,072 (87.7%) |
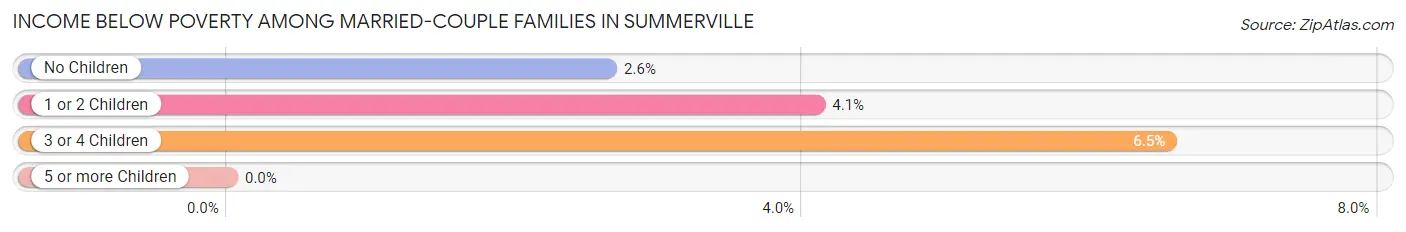
Income Below Poverty Among Married-Couple Families in Summerville
The poverty statistics for married-couple families in Summerville show that 3.4% or 340 of the total 9,910 families live below the poverty line. Families with 3 or 4 children have the highest poverty rate of 6.5%, comprising of 61 families. On the other hand, families with 5 or more children have the lowest poverty rate of 0.0%, which includes 0 families.
| Children | Above Poverty | Below Poverty |
| No Children | 5,720 (97.4%) | 155 (2.6%) |
| 1 or 2 Children | 2,905 (95.9%) | 124 (4.1%) |
| 3 or 4 Children | 872 (93.5%) | 61 (6.5%) |
| 5 or more Children | 73 (100.0%) | 0 (0.0%) |
| Total | 9,570 (96.6%) | 340 (3.4%) |
Income Below Poverty Among Single-Parent Households in Summerville
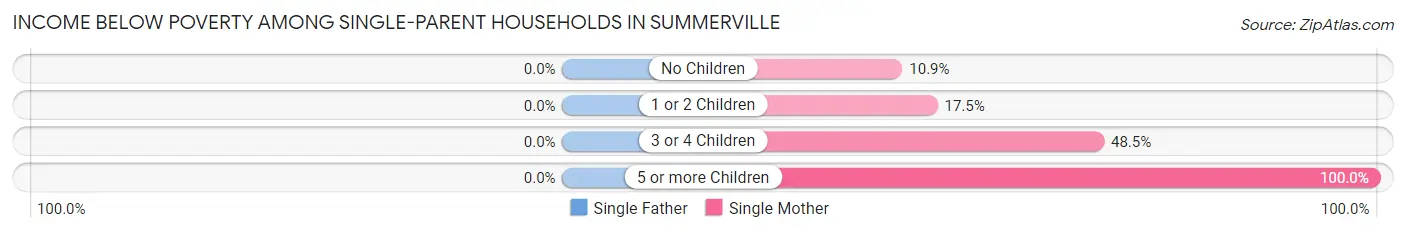
| Children | Single Father | Single Mother |
| No Children | 0 (0.0%) | 101 (10.9%) |
| 1 or 2 Children | 0 (0.0%) | 299 (17.5%) |
| 3 or 4 Children | 0 (0.0%) | 97 (48.5%) |
| 5 or more Children | 0 (0.0%) | 75 (100.0%) |
| Total | 0 (0.0%) | 572 (19.7%) |
Income Below Poverty Among Married-Couple vs Single-Parent Households in Summerville
The poverty data for Summerville shows that 340 of the married-couple family households (3.4%) and 572 of the single-parent households (15.7%) are living below the poverty level. Within the married-couple family households, those with 3 or 4 children have the highest poverty rate, with 61 households (6.5%) falling below the poverty line. Among the single-parent households, those with 5 or more children have the highest poverty rate, with 75 household (100.0%) living below poverty.
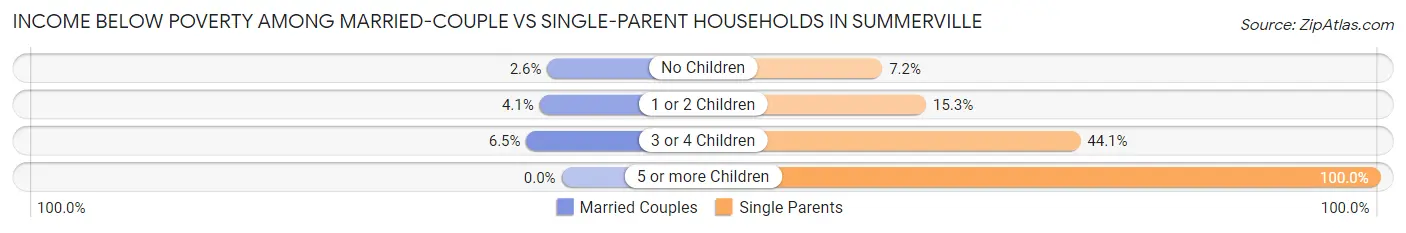
| Children | Married-Couple Families | Single-Parent Households |
| No Children | 155 (2.6%) | 101 (7.2%) |
| 1 or 2 Children | 124 (4.1%) | 299 (15.3%) |
| 3 or 4 Children | 61 (6.5%) | 97 (44.1%) |
| 5 or more Children | 0 (0.0%) | 75 (100.0%) |
| Total | 340 (3.4%) | 572 (15.7%) |
Race in Summerville
The most populous races in Summerville are White / Caucasian (36,173 | 71.2%), Black / African American (10,234 | 20.1%), and Hispanic or Latino (2,984 | 5.9%).
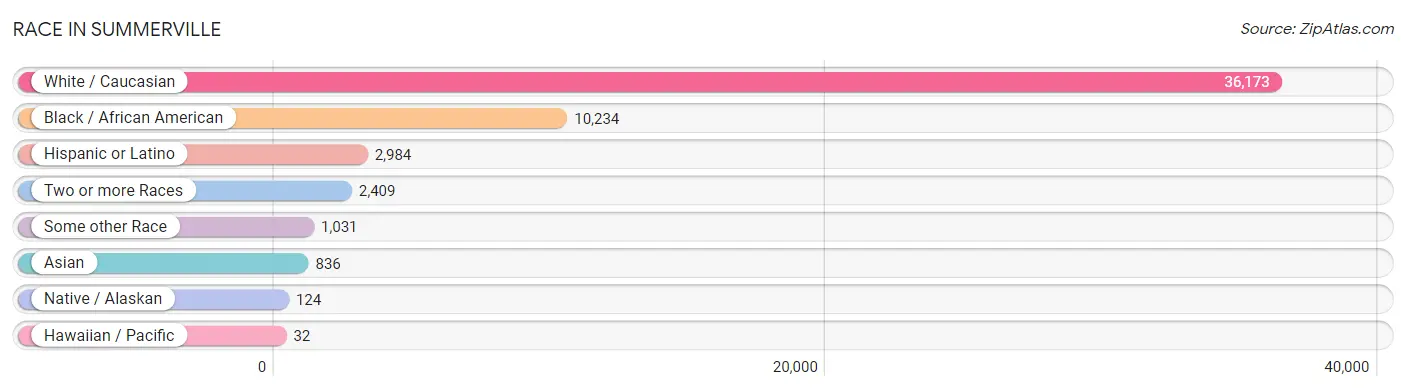
| Race | # Population | % Population |
| Asian | 836 | 1.6% |
| Black / African American | 10,234 | 20.1% |
| Hawaiian / Pacific | 32 | 0.1% |
| Hispanic or Latino | 2,984 | 5.9% |
| Native / Alaskan | 124 | 0.2% |
| White / Caucasian | 36,173 | 71.2% |
| Two or more Races | 2,409 | 4.7% |
| Some other Race | 1,031 | 2.0% |
| Total | 50,839 | 100.0% |
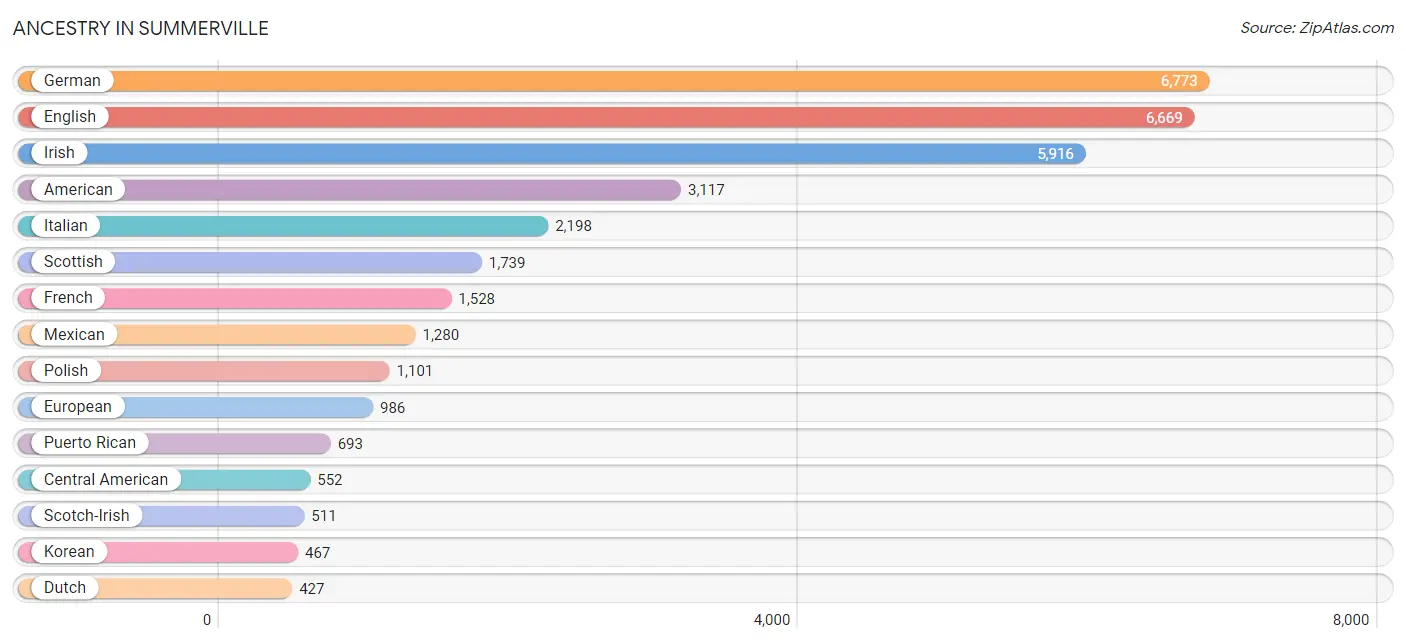
Ancestry in Summerville
The most populous ancestries reported in Summerville are German (6,773 | 13.3%), English (6,669 | 13.1%), Irish (5,916 | 11.6%), American (3,117 | 6.1%), and Italian (2,198 | 4.3%), together accounting for 48.5% of all Summerville residents.
| Ancestry | # Population | % Population |
| African | 223 | 0.4% |
| American | 3,117 | 6.1% |
| Apache | 57 | 0.1% |
| Arab | 299 | 0.6% |
| Armenian | 130 | 0.3% |
| Australian | 52 | 0.1% |
| Austrian | 13 | 0.0% |
| Bahamian | 85 | 0.2% |
| Belgian | 187 | 0.4% |
| Bermudan | 47 | 0.1% |
| Bhutanese | 124 | 0.2% |
| Blackfeet | 7 | 0.0% |
| British | 336 | 0.7% |
| Burmese | 95 | 0.2% |
| Canadian | 155 | 0.3% |
| Central American | 552 | 1.1% |
| Central American Indian | 145 | 0.3% |
| Cherokee | 160 | 0.3% |
| Chilean | 24 | 0.1% |
| Choctaw | 46 | 0.1% |
| Colombian | 78 | 0.2% |
| Croatian | 29 | 0.1% |
| Cuban | 27 | 0.1% |
| Czech | 72 | 0.1% |
| Czechoslovakian | 24 | 0.1% |
| Danish | 150 | 0.3% |
| Dominican | 121 | 0.2% |
| Dutch | 427 | 0.8% |
| Eastern European | 133 | 0.3% |
| Egyptian | 18 | 0.0% |
| English | 6,669 | 13.1% |
| European | 986 | 1.9% |
| Filipino | 14 | 0.0% |
| Finnish | 150 | 0.3% |
| French | 1,528 | 3.0% |
| French American Indian | 19 | 0.0% |
| French Canadian | 339 | 0.7% |
| German | 6,773 | 13.3% |
| Greek | 134 | 0.3% |
| Guamanian / Chamorro | 43 | 0.1% |
| Guatemalan | 228 | 0.4% |
| Haitian | 93 | 0.2% |
| Honduran | 67 | 0.1% |
| Hungarian | 112 | 0.2% |
| Indian (Asian) | 181 | 0.4% |
| Irish | 5,916 | 11.6% |
| Israeli | 55 | 0.1% |
| Italian | 2,198 | 4.3% |
| Jamaican | 27 | 0.1% |
| Japanese | 4 | 0.0% |
| Korean | 467 | 0.9% |
| Lebanese | 281 | 0.5% |
| Lithuanian | 30 | 0.1% |
| Lumbee | 37 | 0.1% |
| Malaysian | 96 | 0.2% |
| Mexican | 1,280 | 2.5% |
| Mexican American Indian | 29 | 0.1% |
| Northern European | 27 | 0.1% |
| Norwegian | 264 | 0.5% |
| Panamanian | 220 | 0.4% |
| Peruvian | 127 | 0.3% |
| Polish | 1,101 | 2.2% |
| Portuguese | 62 | 0.1% |
| Puerto Rican | 693 | 1.4% |
| Romanian | 117 | 0.2% |
| Russian | 100 | 0.2% |
| Salvadoran | 37 | 0.1% |
| Scandinavian | 189 | 0.4% |
| Scotch-Irish | 511 | 1.0% |
| Scottish | 1,739 | 3.4% |
| Serbian | 15 | 0.0% |
| Sierra Leonean | 24 | 0.1% |
| Slavic | 17 | 0.0% |
| Slovak | 118 | 0.2% |
| Slovene | 15 | 0.0% |
| South American | 229 | 0.4% |
| Spaniard | 28 | 0.1% |
| Sri Lankan | 17 | 0.0% |
| Subsaharan African | 247 | 0.5% |
| Swedish | 137 | 0.3% |
| Syrian | 10 | 0.0% |
| Thai | 108 | 0.2% |
| Ukrainian | 115 | 0.2% |
| Welsh | 136 | 0.3% |
| West Indian | 54 | 0.1% | View All 85 Rows |
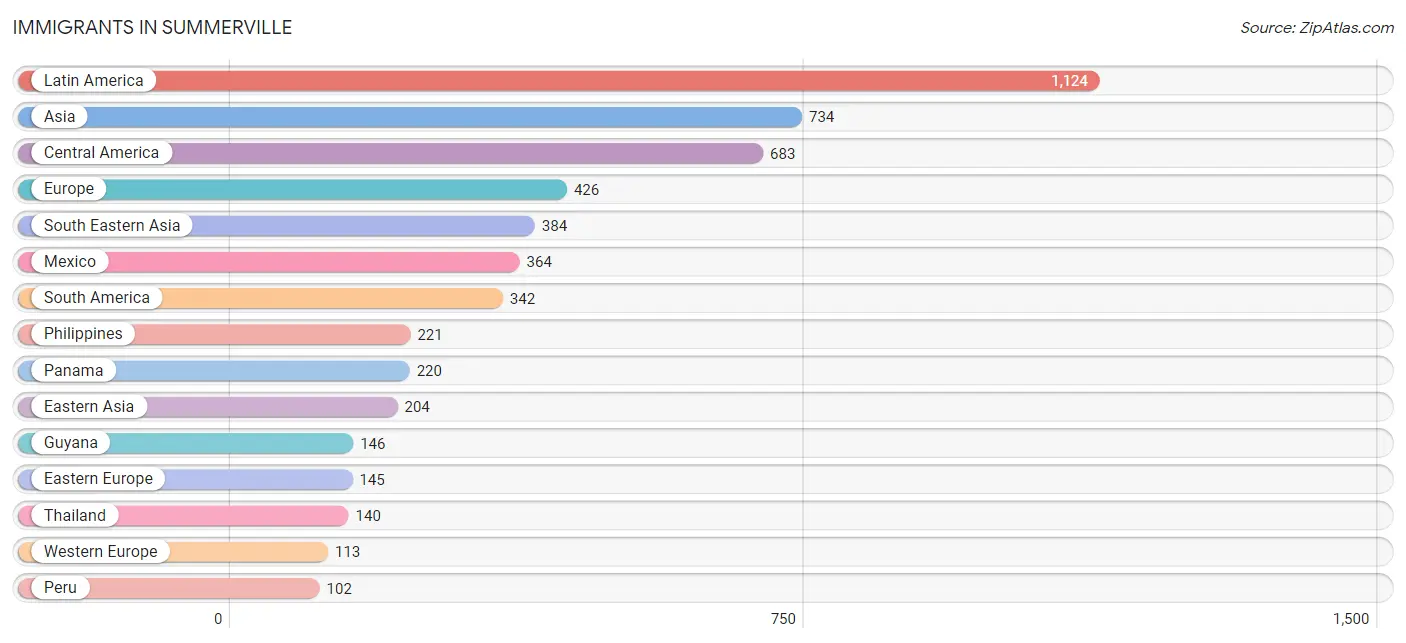
Immigrants in Summerville
The most numerous immigrant groups reported in Summerville came from Latin America (1,124 | 2.2%), Asia (734 | 1.4%), Central America (683 | 1.3%), Europe (426 | 0.8%), and South Eastern Asia (384 | 0.8%), together accounting for 6.6% of all Summerville residents.
| Immigration Origin | # Population | % Population |
| Afghanistan | 44 | 0.1% |
| Asia | 734 | 1.4% |
| Belize | 27 | 0.1% |
| Bolivia | 14 | 0.0% |
| Cambodia | 6 | 0.0% |
| Canada | 95 | 0.2% |
| Caribbean | 99 | 0.2% |
| Central America | 683 | 1.3% |
| Chile | 1 | 0.0% |
| China | 78 | 0.2% |
| Colombia | 31 | 0.1% |
| Czechoslovakia | 15 | 0.0% |
| Dominican Republic | 72 | 0.1% |
| Eastern Asia | 204 | 0.4% |
| Eastern Europe | 145 | 0.3% |
| England | 48 | 0.1% |
| Europe | 426 | 0.8% |
| France | 14 | 0.0% |
| Germany | 99 | 0.2% |
| Guatemala | 21 | 0.0% |
| Guyana | 146 | 0.3% |
| Honduras | 51 | 0.1% |
| India | 47 | 0.1% |
| Israel | 55 | 0.1% |
| Italy | 10 | 0.0% |
| Jamaica | 27 | 0.1% |
| Japan | 49 | 0.1% |
| Korea | 77 | 0.2% |
| Latin America | 1,124 | 2.2% |
| Mexico | 364 | 0.7% |
| Northern Europe | 69 | 0.1% |
| Oceania | 7 | 0.0% |
| Panama | 220 | 0.4% |
| Peru | 102 | 0.2% |
| Philippines | 221 | 0.4% |
| Poland | 30 | 0.1% |
| Portugal | 9 | 0.0% |
| Romania | 100 | 0.2% |
| Scotland | 21 | 0.0% |
| South America | 342 | 0.7% |
| South Central Asia | 91 | 0.2% |
| South Eastern Asia | 384 | 0.8% |
| Southern Europe | 47 | 0.1% |
| Spain | 28 | 0.1% |
| Taiwan | 8 | 0.0% |
| Thailand | 140 | 0.3% |
| Venezuela | 48 | 0.1% |
| Vietnam | 17 | 0.0% |
| Western Asia | 55 | 0.1% |
| Western Europe | 113 | 0.2% | View All 50 Rows |
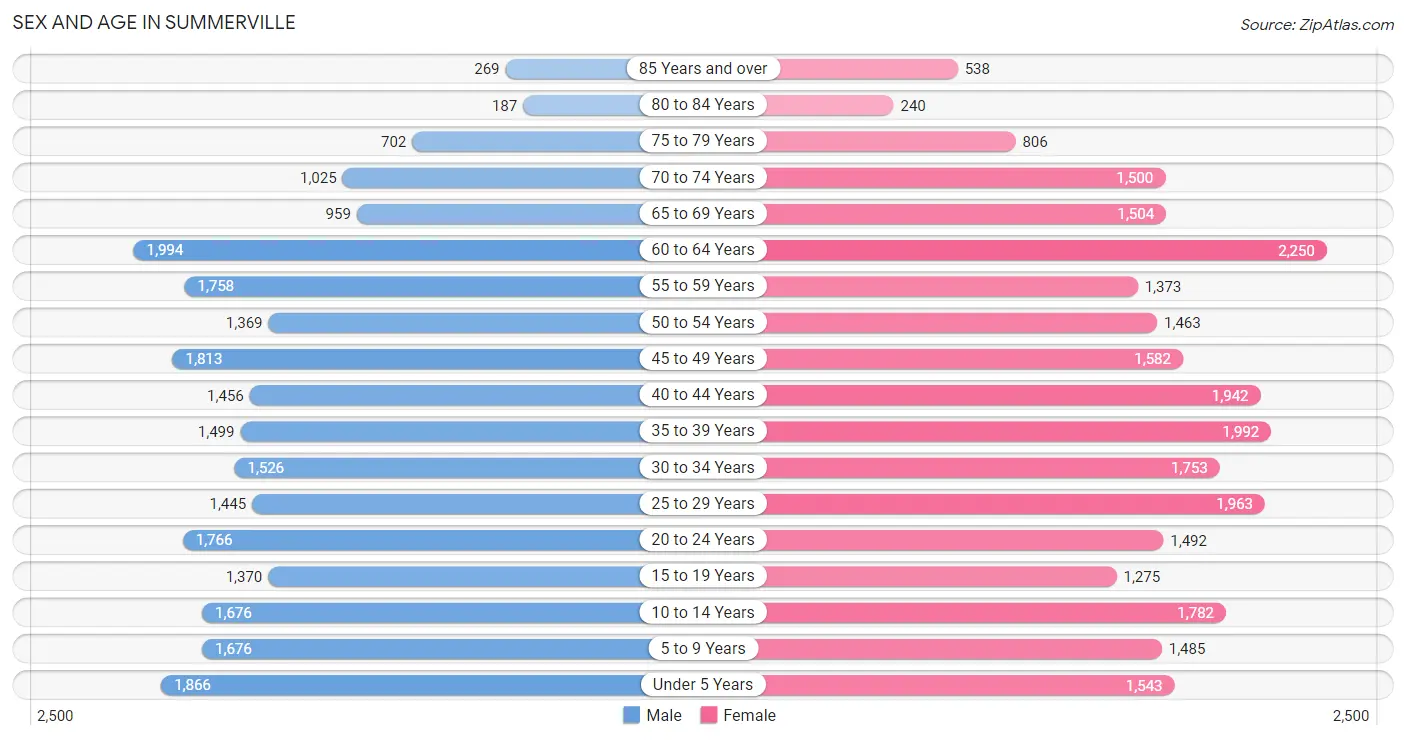
Sex and Age in Summerville
Sex and Age in Summerville
The most populous age groups in Summerville are 60 to 64 Years (1,994 | 8.2%) for men and 60 to 64 Years (2,250 | 8.5%) for women.
| Age Bracket | Male | Female |
| Under 5 Years | 1,866 (7.7%) | 1,543 (5.8%) |
| 5 to 9 Years | 1,676 (6.9%) | 1,485 (5.6%) |
| 10 to 14 Years | 1,676 (6.9%) | 1,782 (6.7%) |
| 15 to 19 Years | 1,370 (5.6%) | 1,275 (4.8%) |
| 20 to 24 Years | 1,766 (7.2%) | 1,492 (5.6%) |
| 25 to 29 Years | 1,445 (5.9%) | 1,963 (7.4%) |
| 30 to 34 Years | 1,526 (6.3%) | 1,753 (6.6%) |
| 35 to 39 Years | 1,499 (6.1%) | 1,992 (7.5%) |
| 40 to 44 Years | 1,456 (6.0%) | 1,942 (7.3%) |
| 45 to 49 Years | 1,813 (7.4%) | 1,582 (6.0%) |
| 50 to 54 Years | 1,369 (5.6%) | 1,463 (5.5%) |
| 55 to 59 Years | 1,758 (7.2%) | 1,373 (5.2%) |
| 60 to 64 Years | 1,994 (8.2%) | 2,250 (8.5%) |
| 65 to 69 Years | 959 (3.9%) | 1,504 (5.7%) |
| 70 to 74 Years | 1,025 (4.2%) | 1,500 (5.7%) |
| 75 to 79 Years | 702 (2.9%) | 806 (3.0%) |
| 80 to 84 Years | 187 (0.8%) | 240 (0.9%) |
| 85 Years and over | 269 (1.1%) | 538 (2.0%) |
| Total | 24,356 (100.0%) | 26,483 (100.0%) |
Families and Households in Summerville
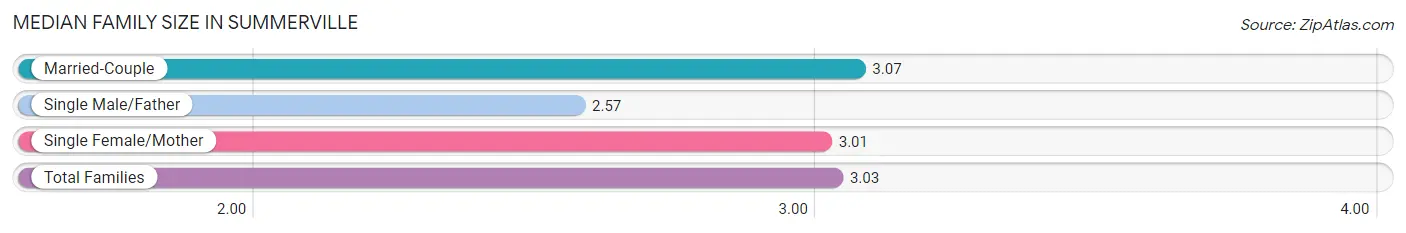
Median Family Size in Summerville
The median family size in Summerville is 3.03 persons per family, with married-couple families (9,910 | 73.1%) accounting for the largest median family size of 3.07 persons per family. On the other hand, single male/father families (741 | 5.5%) represent the smallest median family size with 2.57 persons per family.
| Family Type | # Families | Family Size |
| Married-Couple | 9,910 (73.1%) | 3.07 |
| Single Male/Father | 741 (5.5%) | 2.57 |
| Single Female/Mother | 2,910 (21.5%) | 3.01 |
| Total Families | 13,561 (100.0%) | 3.03 |
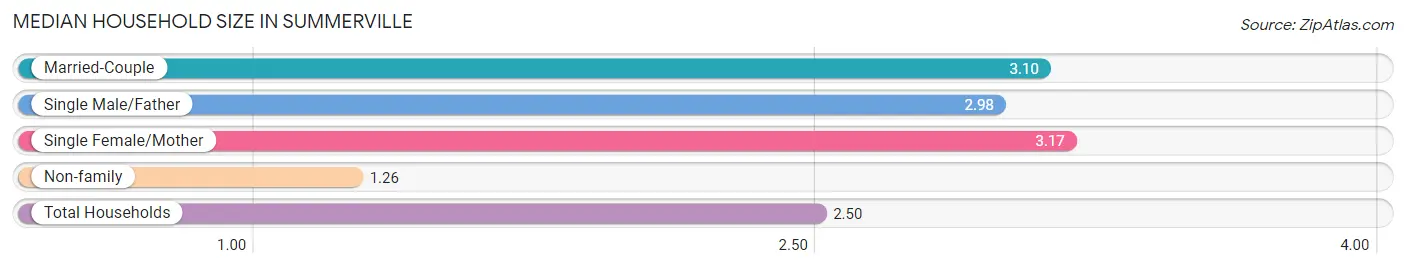
Median Household Size in Summerville
The median household size in Summerville is 2.50 persons per household, with single female/mother households (2,910 | 14.4%) accounting for the largest median household size of 3.17 persons per household. non-family households (6,576 | 32.7%) represent the smallest median household size with 1.26 persons per household.
| Household Type | # Households | Household Size |
| Married-Couple | 9,910 (49.2%) | 3.10 |
| Single Male/Father | 741 (3.7%) | 2.98 |
| Single Female/Mother | 2,910 (14.4%) | 3.17 |
| Non-family | 6,576 (32.7%) | 1.26 |
| Total Households | 20,137 (100.0%) | 2.50 |
Household Size by Marriage Status in Summerville
Out of a total of 20,137 households in Summerville, 13,561 (67.3%) are family households, while 6,576 (32.7%) are nonfamily households. The most numerous type of family households are 2-person households, comprising 6,557, and the most common type of nonfamily households are 1-person households, comprising 5,474.
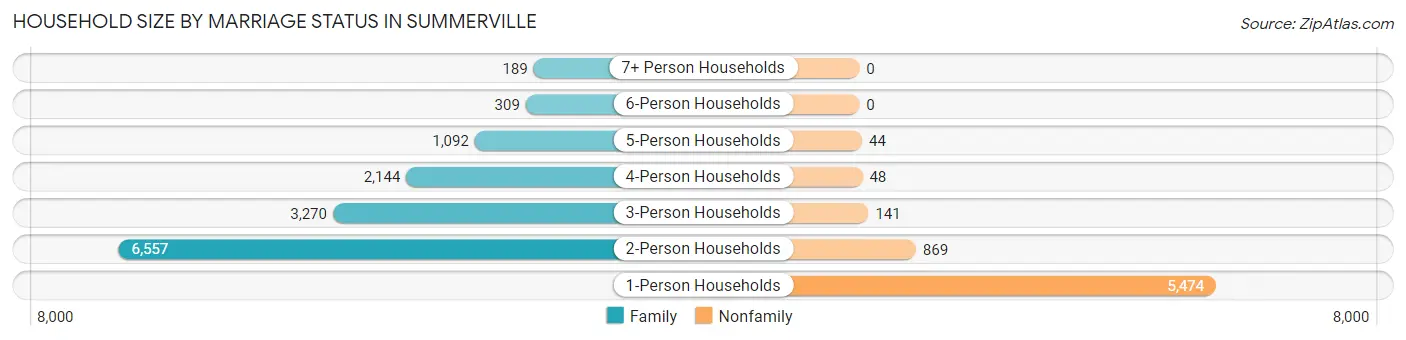
| Household Size | Family Households | Nonfamily Households |
| 1-Person Households | - | 5,474 (27.2%) |
| 2-Person Households | 6,557 (32.6%) | 869 (4.3%) |
| 3-Person Households | 3,270 (16.2%) | 141 (0.7%) |
| 4-Person Households | 2,144 (10.6%) | 48 (0.2%) |
| 5-Person Households | 1,092 (5.4%) | 44 (0.2%) |
| 6-Person Households | 309 (1.5%) | 0 (0.0%) |
| 7+ Person Households | 189 (0.9%) | 0 (0.0%) |
| Total | 13,561 (67.3%) | 6,576 (32.7%) |
Female Fertility in Summerville
Fertility by Age in Summerville
Average fertility rate in Summerville is 47.0 births per 1,000 women. Women in the age bracket of 20 to 34 years have the highest fertility rate with 80.0 births per 1,000 women. Women in the age bracket of 20 to 34 years acount for 71.2% of all women with births.
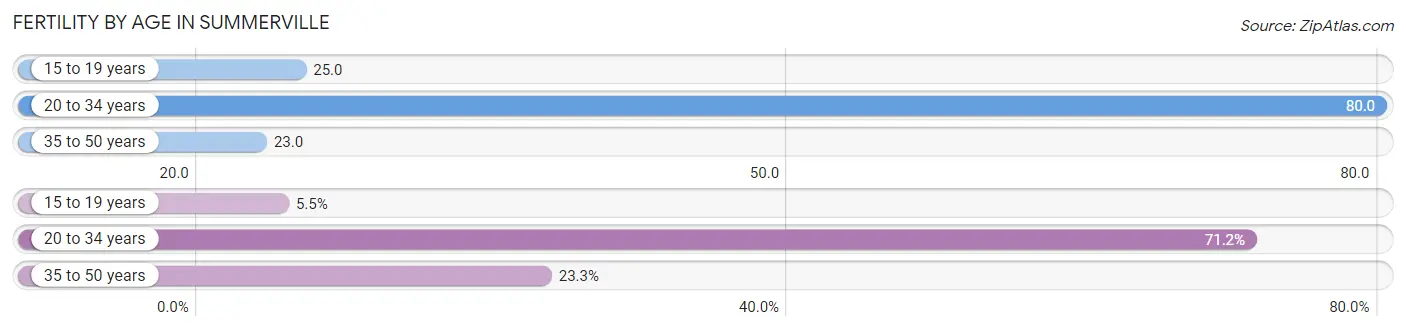
| Age Bracket | Women with Births | Births / 1,000 Women |
| 15 to 19 years | 32 (5.5%) | 25.0 |
| 20 to 34 years | 415 (71.2%) | 80.0 |
| 35 to 50 years | 136 (23.3%) | 23.0 |
| Total | 583 (100.0%) | 47.0 |
Fertility by Age by Marriage Status in Summerville
64.8% of women with births (583) in Summerville are married. The highest percentage of unmarried women with births falls into 15 to 19 years age bracket with 100.0% of them unmarried at the time of birth, while the lowest percentage of unmarried women with births belong to 35 to 50 years age bracket with 20.6% of them unmarried.
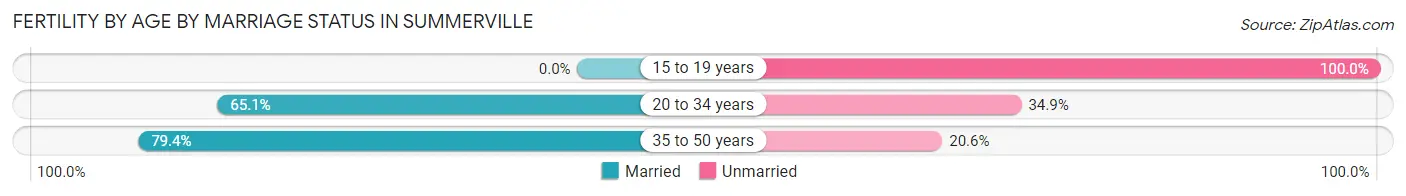
| Age Bracket | Married | Unmarried |
| 15 to 19 years | 0 (0.0%) | 32 (100.0%) |
| 20 to 34 years | 270 (65.1%) | 145 (34.9%) |
| 35 to 50 years | 108 (79.4%) | 28 (20.6%) |
| Total | 378 (64.8%) | 205 (35.2%) |
Fertility by Education in Summerville
Average fertility rate in Summerville is 47.0 births per 1,000 women. Women with the education attainment of graduate degree have the highest fertility rate of 100.0 births per 1,000 women, while women with the education attainment of less than high school have the lowest fertility at 11.0 births per 1,000 women. Women with the education attainment of college or associate's degree represent 40.1% of all women with births.
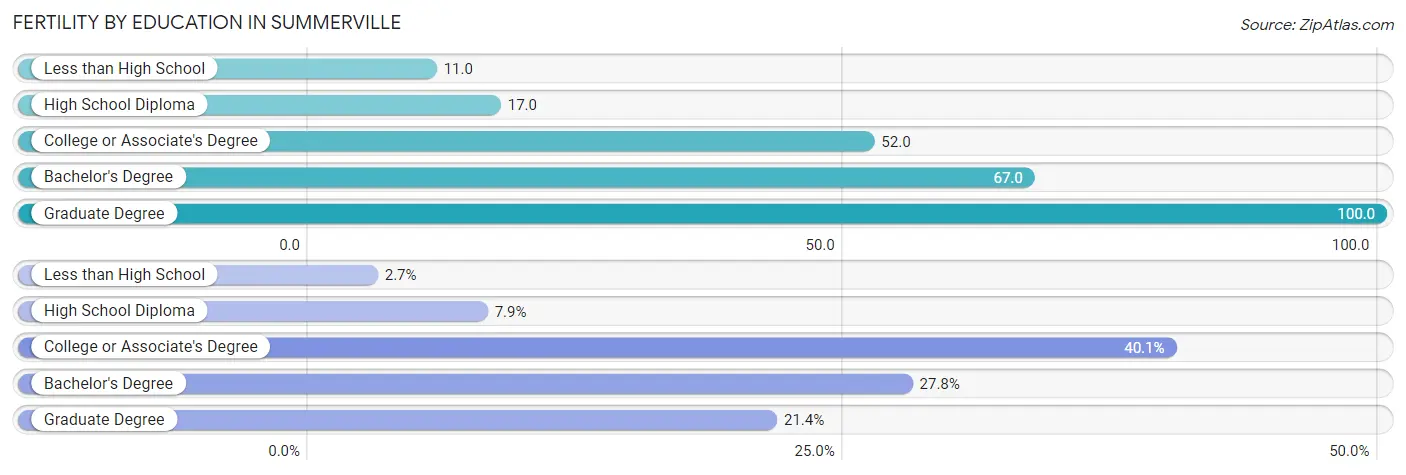
| Educational Attainment | Women with Births | Births / 1,000 Women |
| Less than High School | 16 (2.7%) | 11.0 |
| High School Diploma | 46 (7.9%) | 17.0 |
| College or Associate's Degree | 234 (40.1%) | 52.0 |
| Bachelor's Degree | 162 (27.8%) | 67.0 |
| Graduate Degree | 125 (21.4%) | 100.0 |
| Total | 583 (100.0%) | 47.0 |
Fertility by Education by Marriage Status in Summerville
35.2% of women with births in Summerville are unmarried. Women with the educational attainment of bachelor's degree are most likely to be married with 88.3% of them married at childbirth, while women with the educational attainment of high school diploma are least likely to be married with 100.0% of them unmarried at childbirth.
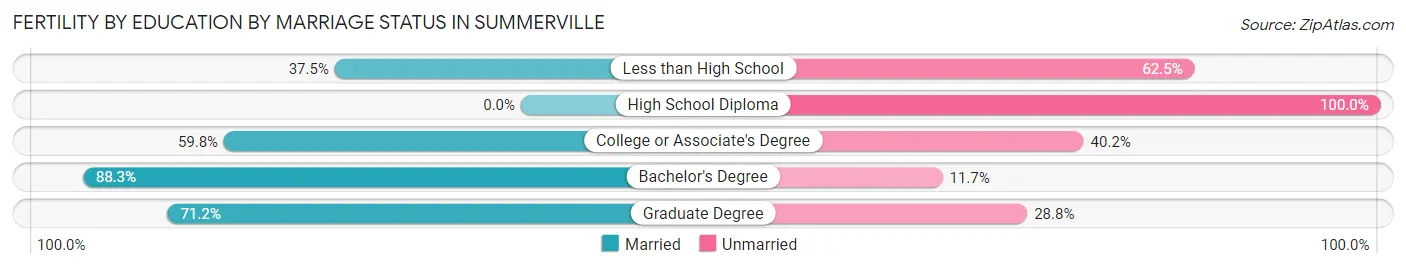
| Educational Attainment | Married | Unmarried |
| Less than High School | 6 (37.5%) | 10 (62.5%) |
| High School Diploma | 0 (0.0%) | 46 (100.0%) |
| College or Associate's Degree | 140 (59.8%) | 94 (40.2%) |
| Bachelor's Degree | 143 (88.3%) | 19 (11.7%) |
| Graduate Degree | 89 (71.2%) | 36 (28.8%) |
| Total | 378 (64.8%) | 205 (35.2%) |
Employment Characteristics in Summerville
Employment by Class of Employer in Summerville
Among the 25,217 employed individuals in Summerville, private company employees (16,587 | 65.8%), local government employees (1,788 | 7.1%), and federal government employees (1,710 | 6.8%) make up the most common classes of employment.
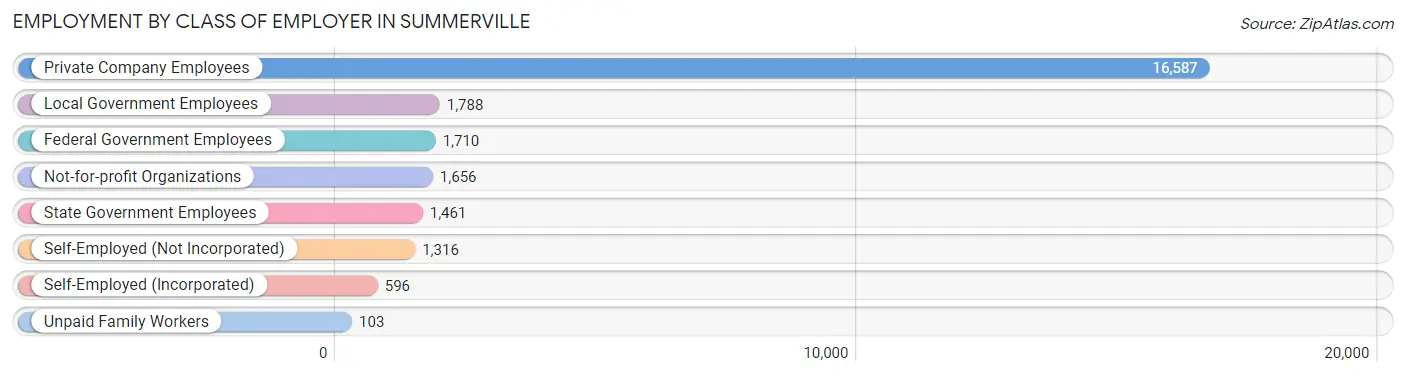
| Employer Class | # Employees | % Employees |
| Private Company Employees | 16,587 | 65.8% |
| Self-Employed (Incorporated) | 596 | 2.4% |
| Self-Employed (Not Incorporated) | 1,316 | 5.2% |
| Not-for-profit Organizations | 1,656 | 6.6% |
| Local Government Employees | 1,788 | 7.1% |
| State Government Employees | 1,461 | 5.8% |
| Federal Government Employees | 1,710 | 6.8% |
| Unpaid Family Workers | 103 | 0.4% |
| Total | 25,217 | 100.0% |
Employment Status by Age in Summerville
According to the labor force statistics for Summerville, out of the total population over 16 years of age (40,343), 67.6% or 27,272 individuals are in the labor force, with 5.8% or 1,582 of them unemployed. The age group with the highest labor force participation rate is 25 to 29 years, with 91.3% or 3,112 individuals in the labor force. Within the labor force, the 25 to 29 years age range has the highest percentage of unemployed individuals, with 14.8% or 461 of them being unemployed.
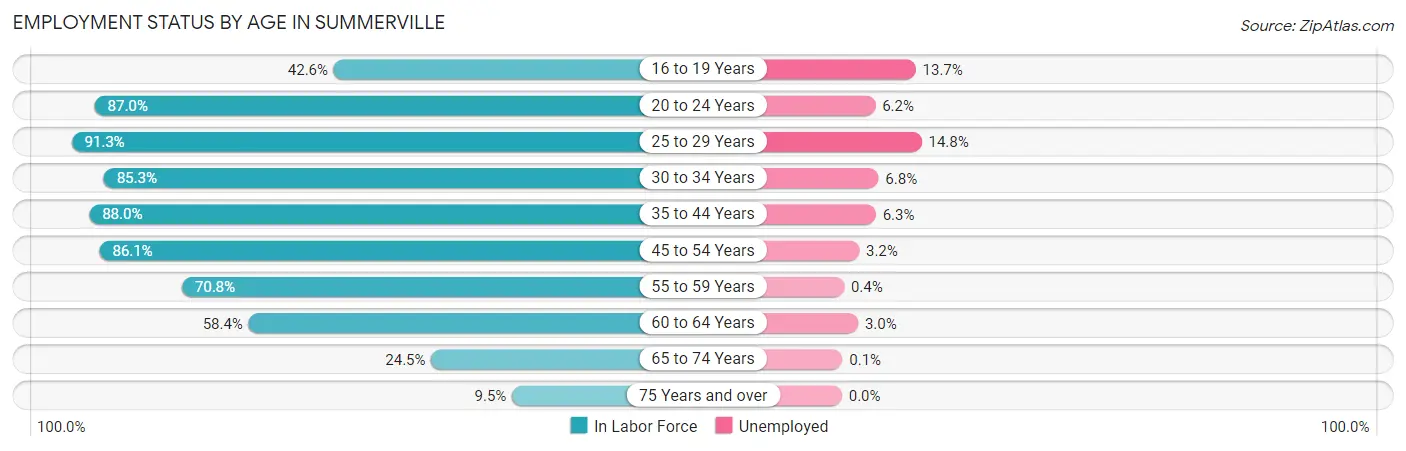
| Age Bracket | In Labor Force | Unemployed |
| 16 to 19 Years | 927 (42.6%) | 127 (13.7%) |
| 20 to 24 Years | 2,834 (87.0%) | 176 (6.2%) |
| 25 to 29 Years | 3,112 (91.3%) | 461 (14.8%) |
| 30 to 34 Years | 2,797 (85.3%) | 190 (6.8%) |
| 35 to 44 Years | 6,062 (88.0%) | 382 (6.3%) |
| 45 to 54 Years | 5,361 (86.1%) | 172 (3.2%) |
| 55 to 59 Years | 2,217 (70.8%) | 9 (0.4%) |
| 60 to 64 Years | 2,478 (58.4%) | 74 (3.0%) |
| 65 to 74 Years | 1,222 (24.5%) | 1 (0.1%) |
| 75 Years and over | 260 (9.5%) | 0 (0.0%) |
| Total | 27,272 (67.6%) | 1,582 (5.8%) |
Employment Status by Educational Attainment in Summerville
According to labor force statistics for Summerville, 81.1% of individuals (22,041) out of the total population between 25 and 64 years of age (27,178) are in the labor force, with 5.8% or 1,278 of them being unemployed. The group with the highest labor force participation rate are those with the educational attainment of bachelor's degree or higher, with 87.9% or 7,293 individuals in the labor force. Within the labor force, individuals with less than high school education have the highest percentage of unemployment, with 8.4% or 62 of them being unemployed.
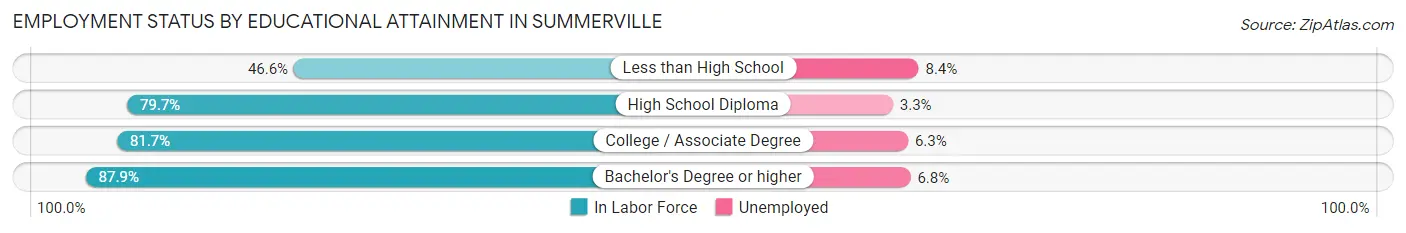
| Educational Attainment | In Labor Force | Unemployed |
| Less than High School | 739 (46.6%) | 133 (8.4%) |
| High School Diploma | 5,187 (79.7%) | 215 (3.3%) |
| College / Associate Degree | 8,813 (81.7%) | 680 (6.3%) |
| Bachelor's Degree or higher | 7,293 (87.9%) | 564 (6.8%) |
| Total | 22,041 (81.1%) | 1,576 (5.8%) |
Employment Occupations by Sex in Summerville
Management, Business, Science and Arts Occupations
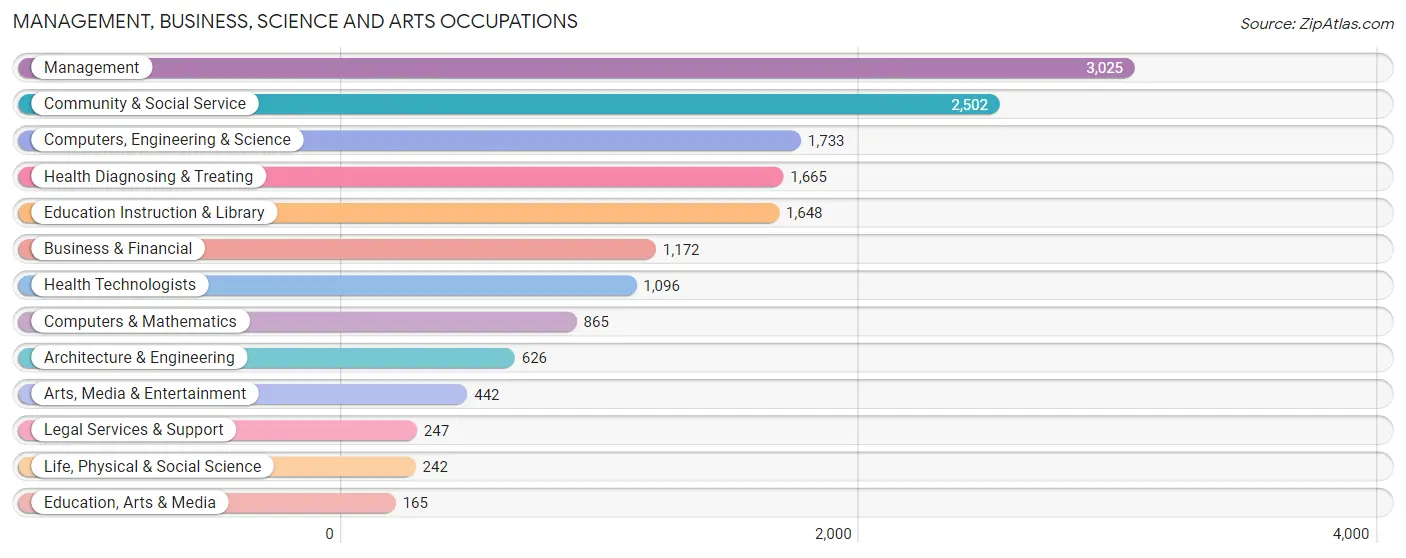
The most common Management, Business, Science and Arts occupations in Summerville are Management (3,025 | 11.9%), Community & Social Service (2,502 | 9.8%), Computers, Engineering & Science (1,733 | 6.8%), Health Diagnosing & Treating (1,665 | 6.5%), and Education Instruction & Library (1,648 | 6.5%).
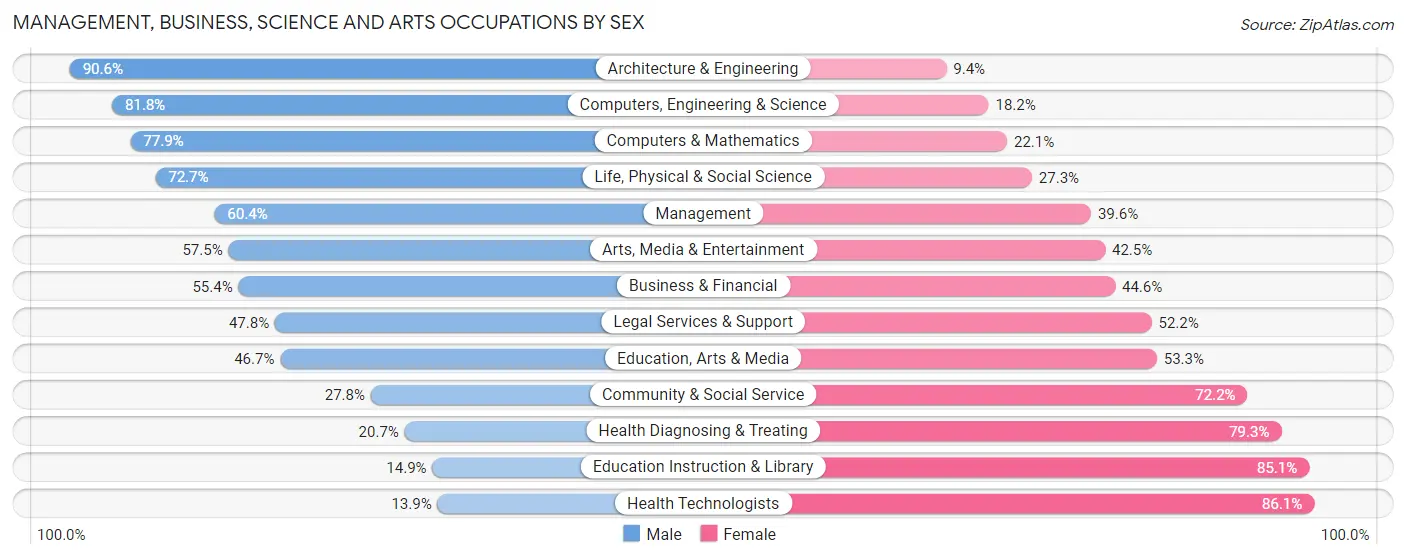
Management, Business, Science and Arts Occupations by Sex
Within the Management, Business, Science and Arts occupations in Summerville, the most male-oriented occupations are Architecture & Engineering (90.6%), Computers, Engineering & Science (81.8%), and Computers & Mathematics (77.9%), while the most female-oriented occupations are Health Technologists (86.1%), Education Instruction & Library (85.1%), and Health Diagnosing & Treating (79.3%).
| Occupation | Male | Female |
| Management | 1,827 (60.4%) | 1,198 (39.6%) |
| Business & Financial | 649 (55.4%) | 523 (44.6%) |
| Computers, Engineering & Science | 1,417 (81.8%) | 316 (18.2%) |
| Computers & Mathematics | 674 (77.9%) | 191 (22.1%) |
| Architecture & Engineering | 567 (90.6%) | 59 (9.4%) |
| Life, Physical & Social Science | 176 (72.7%) | 66 (27.3%) |
| Community & Social Service | 695 (27.8%) | 1,807 (72.2%) |
| Education, Arts & Media | 77 (46.7%) | 88 (53.3%) |
| Legal Services & Support | 118 (47.8%) | 129 (52.2%) |
| Education Instruction & Library | 246 (14.9%) | 1,402 (85.1%) |
| Arts, Media & Entertainment | 254 (57.5%) | 188 (42.5%) |
| Health Diagnosing & Treating | 345 (20.7%) | 1,320 (79.3%) |
| Health Technologists | 152 (13.9%) | 944 (86.1%) |
| Total (Category) | 4,933 (48.9%) | 5,164 (51.1%) |
| Total (Overall) | 13,328 (52.3%) | 12,135 (47.7%) |
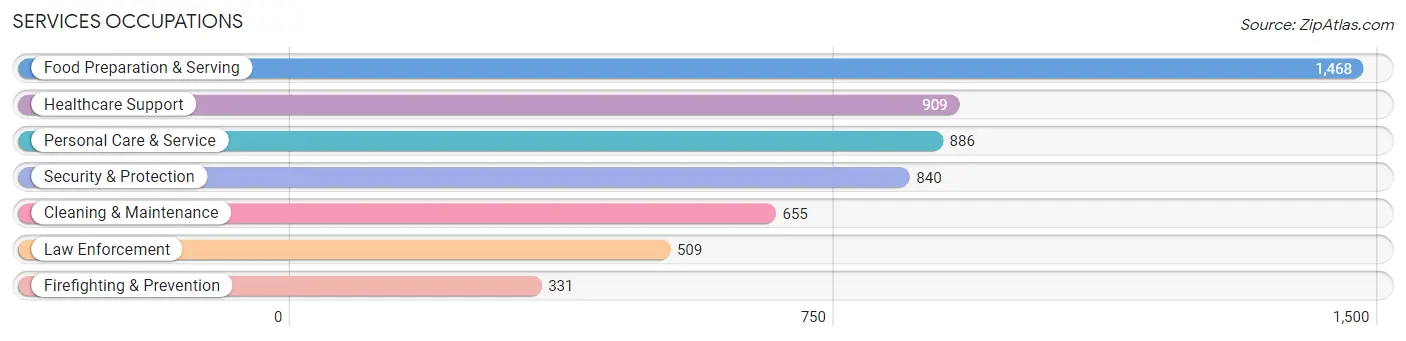
Services Occupations
The most common Services occupations in Summerville are Food Preparation & Serving (1,468 | 5.8%), Healthcare Support (909 | 3.6%), Personal Care & Service (886 | 3.5%), Security & Protection (840 | 3.3%), and Cleaning & Maintenance (655 | 2.6%).
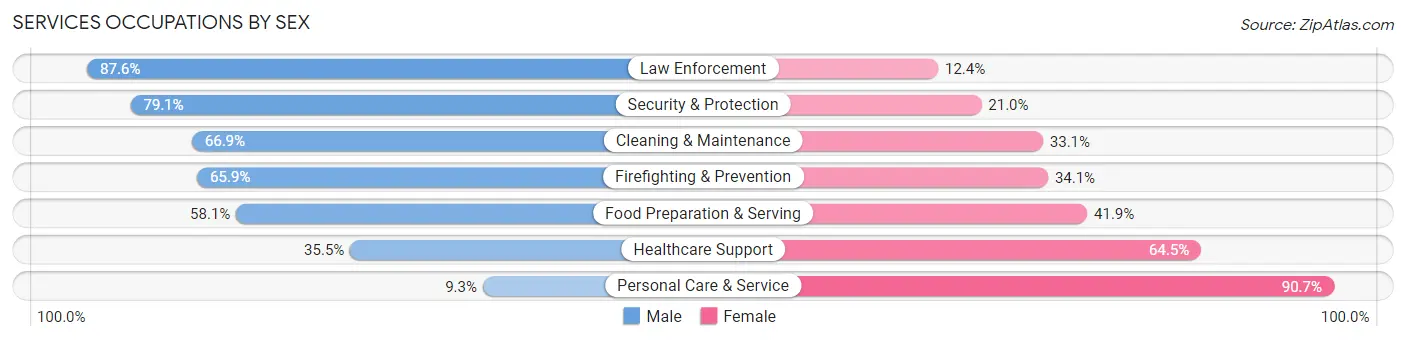
Services Occupations by Sex
Within the Services occupations in Summerville, the most male-oriented occupations are Law Enforcement (87.6%), Security & Protection (79.0%), and Cleaning & Maintenance (66.9%), while the most female-oriented occupations are Personal Care & Service (90.7%), Healthcare Support (64.5%), and Food Preparation & Serving (41.9%).
| Occupation | Male | Female |
| Healthcare Support | 323 (35.5%) | 586 (64.5%) |
| Security & Protection | 664 (79.0%) | 176 (20.9%) |
| Firefighting & Prevention | 218 (65.9%) | 113 (34.1%) |
| Law Enforcement | 446 (87.6%) | 63 (12.4%) |
| Food Preparation & Serving | 853 (58.1%) | 615 (41.9%) |
| Cleaning & Maintenance | 438 (66.9%) | 217 (33.1%) |
| Personal Care & Service | 82 (9.3%) | 804 (90.7%) |
| Total (Category) | 2,360 (49.6%) | 2,398 (50.4%) |
| Total (Overall) | 13,328 (52.3%) | 12,135 (47.7%) |
Sales and Office Occupations
The most common Sales and Office occupations in Summerville are Office & Administration (3,548 | 13.9%), and Sales & Related (2,107 | 8.3%).

Sales and Office Occupations by Sex

| Occupation | Male | Female |
| Sales & Related | 973 (46.2%) | 1,134 (53.8%) |
| Office & Administration | 649 (18.3%) | 2,899 (81.7%) |
| Total (Category) | 1,622 (28.7%) | 4,033 (71.3%) |
| Total (Overall) | 13,328 (52.3%) | 12,135 (47.7%) |
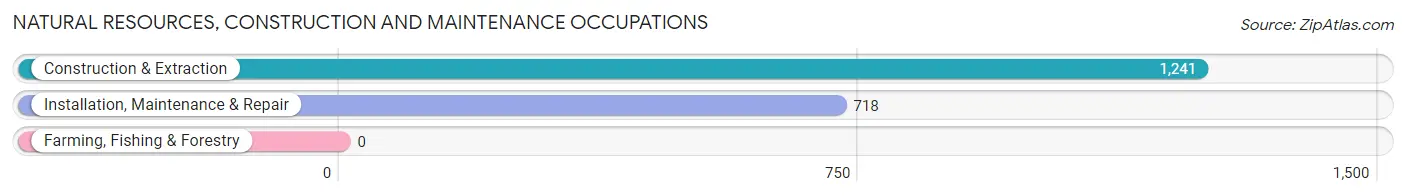
Natural Resources, Construction and Maintenance Occupations
The most common Natural Resources, Construction and Maintenance occupations in Summerville are Construction & Extraction (1,241 | 4.9%), and Installation, Maintenance & Repair (718 | 2.8%).
Natural Resources, Construction and Maintenance Occupations by Sex
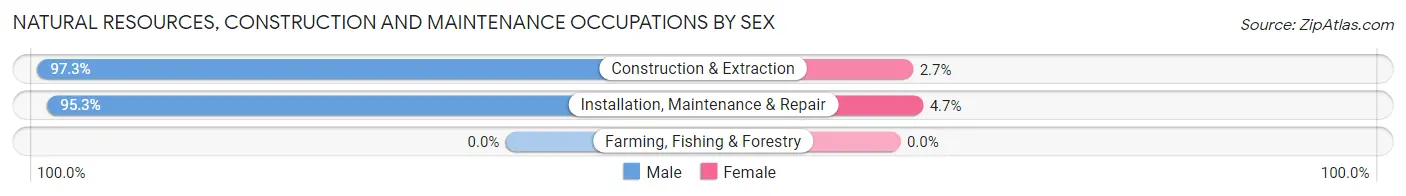
| Occupation | Male | Female |
| Farming, Fishing & Forestry | 0 (0.0%) | 0 (0.0%) |
| Construction & Extraction | 1,208 (97.3%) | 33 (2.7%) |
| Installation, Maintenance & Repair | 684 (95.3%) | 34 (4.7%) |
| Total (Category) | 1,892 (96.6%) | 67 (3.4%) |
| Total (Overall) | 13,328 (52.3%) | 12,135 (47.7%) |
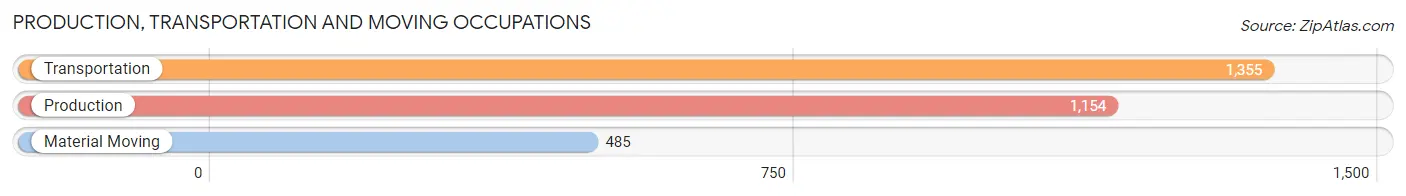
Production, Transportation and Moving Occupations
The most common Production, Transportation and Moving occupations in Summerville are Transportation (1,355 | 5.3%), Production (1,154 | 4.5%), and Material Moving (485 | 1.9%).
Production, Transportation and Moving Occupations by Sex
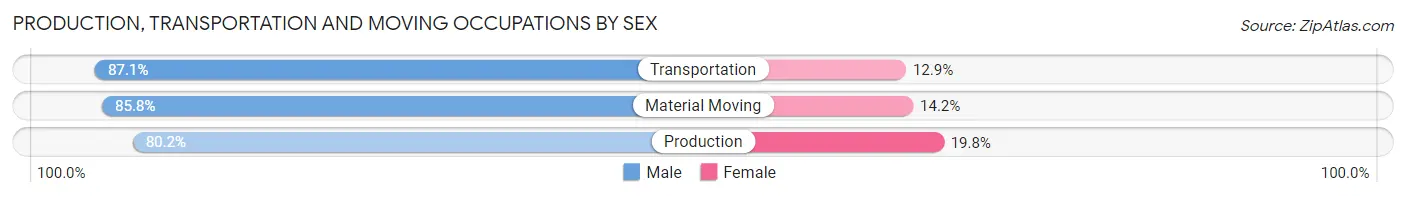
| Occupation | Male | Female |
| Production | 925 (80.2%) | 229 (19.8%) |
| Transportation | 1,180 (87.1%) | 175 (12.9%) |
| Material Moving | 416 (85.8%) | 69 (14.2%) |
| Total (Category) | 2,521 (84.2%) | 473 (15.8%) |
| Total (Overall) | 13,328 (52.3%) | 12,135 (47.7%) |
Employment Industries by Sex in Summerville
Employment Industries in Summerville
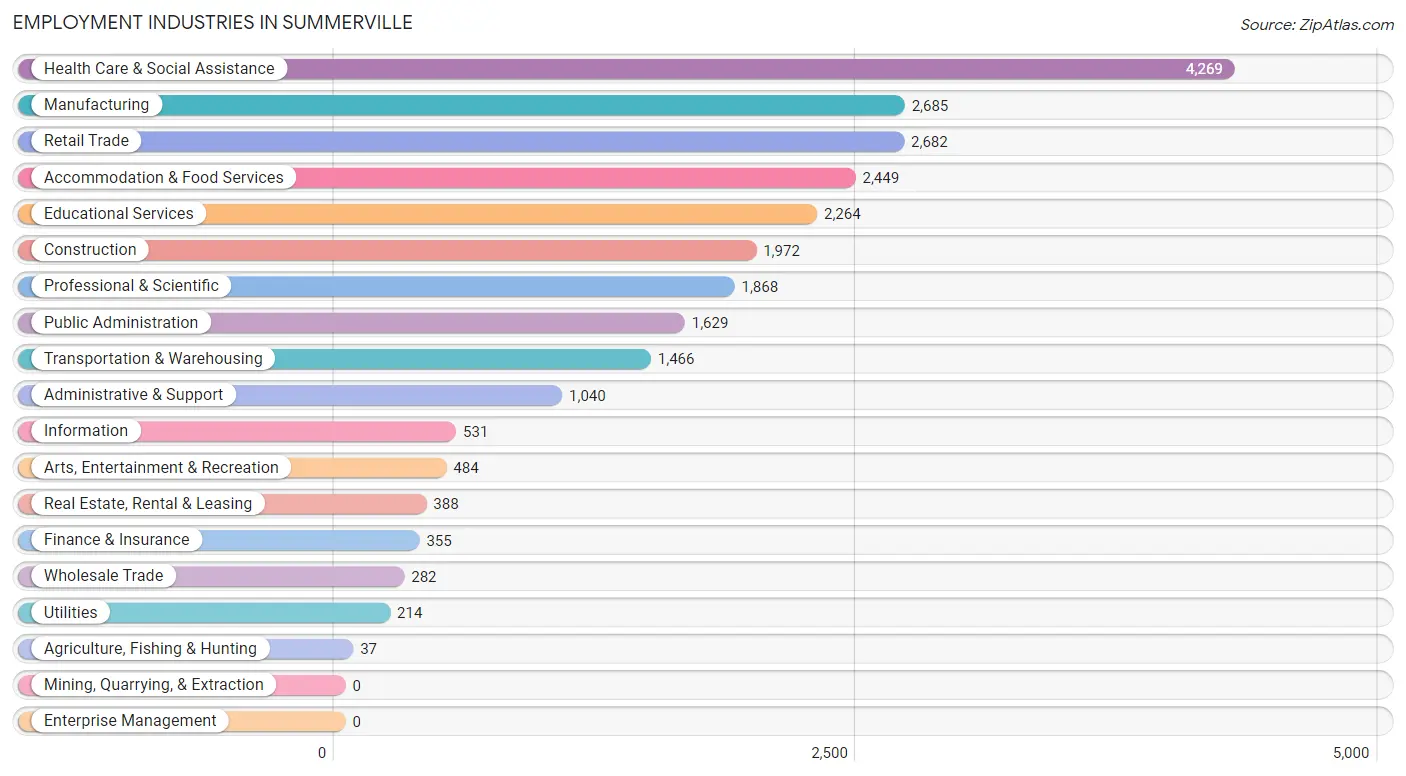
The major employment industries in Summerville include Health Care & Social Assistance (4,269 | 16.8%), Manufacturing (2,685 | 10.5%), Retail Trade (2,682 | 10.5%), Accommodation & Food Services (2,449 | 9.6%), and Educational Services (2,264 | 8.9%).
Employment Industries by Sex in Summerville
The Summerville industries that see more men than women are Construction (80.4%), Manufacturing (78.4%), and Transportation & Warehousing (76.6%), whereas the industries that tend to have a higher number of women are Health Care & Social Assistance (77.7%), Educational Services (75.7%), and Real Estate, Rental & Leasing (65.2%).
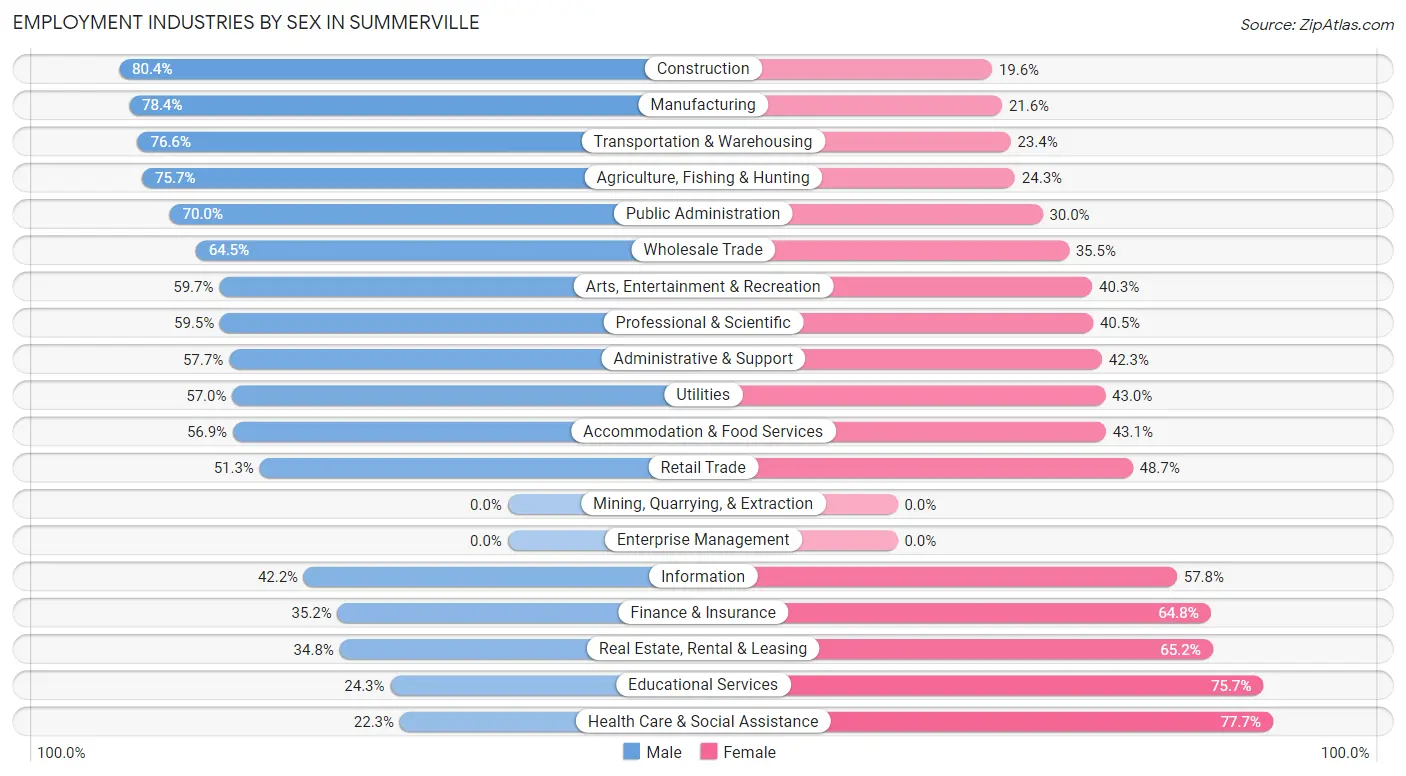
| Industry | Male | Female |
| Agriculture, Fishing & Hunting | 28 (75.7%) | 9 (24.3%) |
| Mining, Quarrying, & Extraction | 0 (0.0%) | 0 (0.0%) |
| Construction | 1,586 (80.4%) | 386 (19.6%) |
| Manufacturing | 2,104 (78.4%) | 581 (21.6%) |
| Wholesale Trade | 182 (64.5%) | 100 (35.5%) |
| Retail Trade | 1,377 (51.3%) | 1,305 (48.7%) |
| Transportation & Warehousing | 1,123 (76.6%) | 343 (23.4%) |
| Utilities | 122 (57.0%) | 92 (43.0%) |
| Information | 224 (42.2%) | 307 (57.8%) |
| Finance & Insurance | 125 (35.2%) | 230 (64.8%) |
| Real Estate, Rental & Leasing | 135 (34.8%) | 253 (65.2%) |
| Professional & Scientific | 1,112 (59.5%) | 756 (40.5%) |
| Enterprise Management | 0 (0.0%) | 0 (0.0%) |
| Administrative & Support | 600 (57.7%) | 440 (42.3%) |
| Educational Services | 550 (24.3%) | 1,714 (75.7%) |
| Health Care & Social Assistance | 953 (22.3%) | 3,316 (77.7%) |
| Arts, Entertainment & Recreation | 289 (59.7%) | 195 (40.3%) |
| Accommodation & Food Services | 1,393 (56.9%) | 1,056 (43.1%) |
| Public Administration | 1,140 (70.0%) | 489 (30.0%) |
| Total | 13,328 (52.3%) | 12,135 (47.7%) |
Education in Summerville
School Enrollment in Summerville
The most common levels of schooling among the 11,541 students in Summerville are middle school (2,704 | 23.4%), elementary school (2,649 | 23.0%), and high school (2,152 | 18.6%).
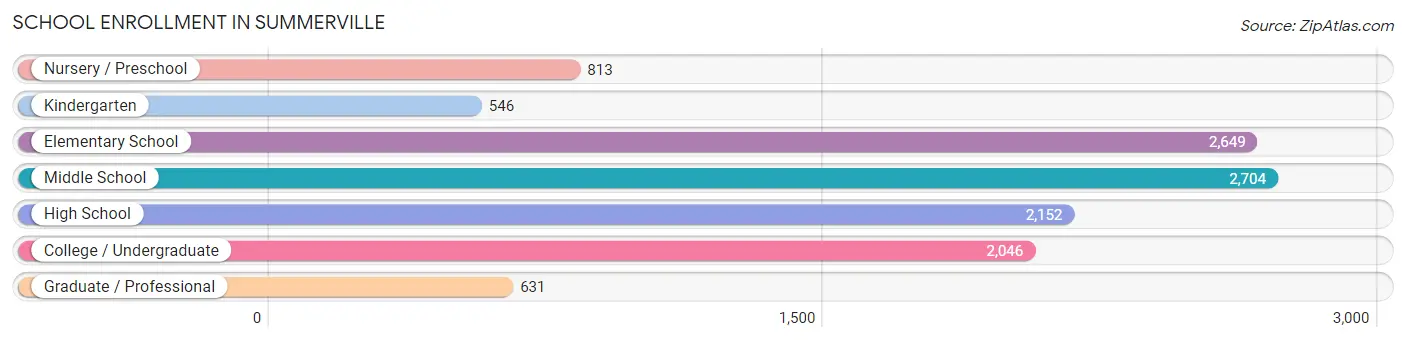
| School Level | # Students | % Students |
| Nursery / Preschool | 813 | 7.0% |
| Kindergarten | 546 | 4.7% |
| Elementary School | 2,649 | 23.0% |
| Middle School | 2,704 | 23.4% |
| High School | 2,152 | 18.6% |
| College / Undergraduate | 2,046 | 17.7% |
| Graduate / Professional | 631 | 5.5% |
| Total | 11,541 | 100.0% |
School Enrollment by Age by Funding Source in Summerville
Out of a total of 11,541 students who are enrolled in schools in Summerville, 2,435 (21.1%) attend a private institution, while the remaining 9,106 (78.9%) are enrolled in public schools. The age group of 3 to 4 year olds has the highest likelihood of being enrolled in private schools, with 380 (69.1% in the age bracket) enrolled. Conversely, the age group of 15 to 17 year olds has the lowest likelihood of being enrolled in a private school, with 1,530 (87.0% in the age bracket) attending a public institution.
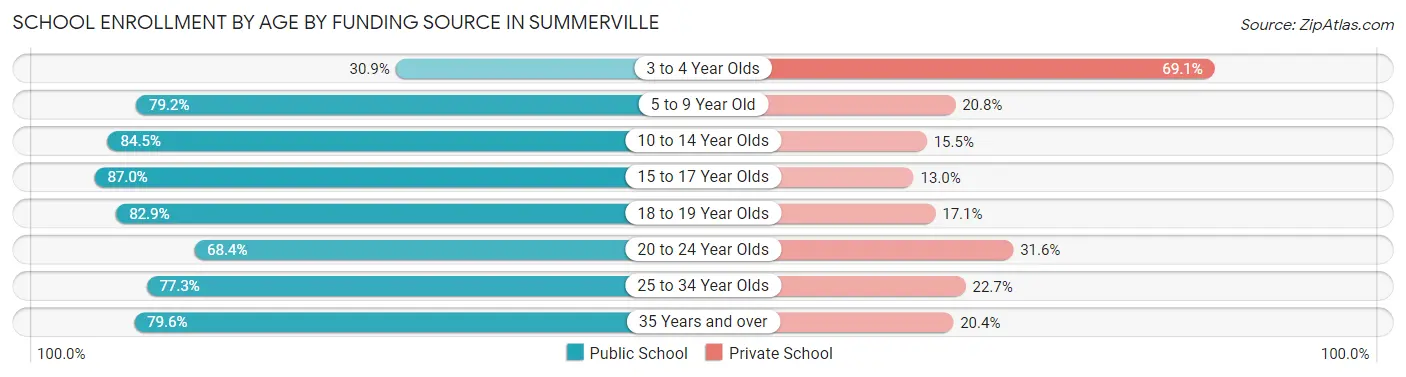
| Age Bracket | Public School | Private School |
| 3 to 4 Year Olds | 170 (30.9%) | 380 (69.1%) |
| 5 to 9 Year Old | 2,381 (79.2%) | 624 (20.8%) |
| 10 to 14 Year Olds | 2,874 (84.5%) | 526 (15.5%) |
| 15 to 17 Year Olds | 1,530 (87.0%) | 229 (13.0%) |
| 18 to 19 Year Olds | 408 (82.9%) | 84 (17.1%) |
| 20 to 24 Year Olds | 611 (68.4%) | 282 (31.6%) |
| 25 to 34 Year Olds | 630 (77.3%) | 185 (22.7%) |
| 35 Years and over | 499 (79.6%) | 128 (20.4%) |
| Total | 9,106 (78.9%) | 2,435 (21.1%) |
Educational Attainment by Field of Study in Summerville
Business (2,657 | 23.2%), education (1,594 | 13.9%), science & technology (1,227 | 10.7%), social sciences (1,050 | 9.2%), and psychology (799 | 7.0%) are the most common fields of study among 11,451 individuals in Summerville who have obtained a bachelor's degree or higher.
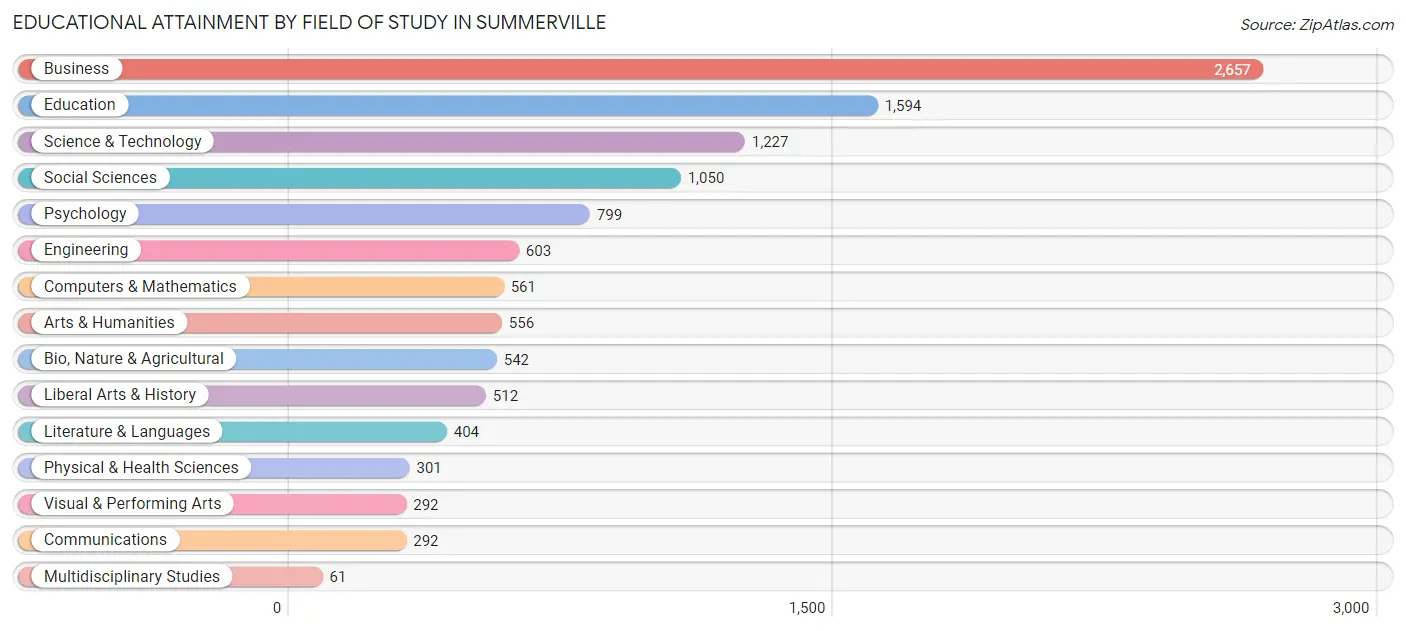
| Field of Study | # Graduates | % Graduates |
| Computers & Mathematics | 561 | 4.9% |
| Bio, Nature & Agricultural | 542 | 4.7% |
| Physical & Health Sciences | 301 | 2.6% |
| Psychology | 799 | 7.0% |
| Social Sciences | 1,050 | 9.2% |
| Engineering | 603 | 5.3% |
| Multidisciplinary Studies | 61 | 0.5% |
| Science & Technology | 1,227 | 10.7% |
| Business | 2,657 | 23.2% |
| Education | 1,594 | 13.9% |
| Literature & Languages | 404 | 3.5% |
| Liberal Arts & History | 512 | 4.5% |
| Visual & Performing Arts | 292 | 2.5% |
| Communications | 292 | 2.5% |
| Arts & Humanities | 556 | 4.9% |
| Total | 11,451 | 100.0% |
Transportation & Commute in Summerville
Vehicle Availability by Sex in Summerville
The most prevalent vehicle ownership categories in Summerville are males with 2 vehicles (6,273, accounting for 47.0%) and females with 2 vehicles (5,018, making up 53.0%).
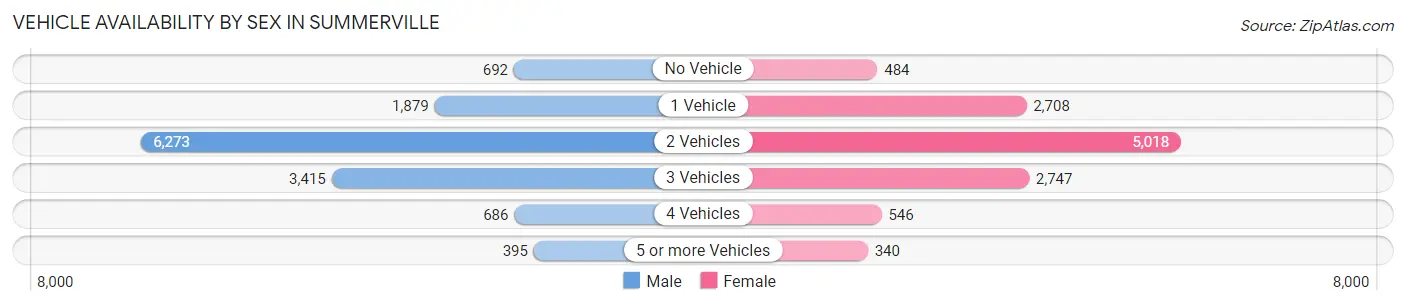
| Vehicles Available | Male | Female |
| No Vehicle | 692 (5.2%) | 484 (4.1%) |
| 1 Vehicle | 1,879 (14.1%) | 2,708 (22.9%) |
| 2 Vehicles | 6,273 (47.0%) | 5,018 (42.4%) |
| 3 Vehicles | 3,415 (25.6%) | 2,747 (23.2%) |
| 4 Vehicles | 686 (5.1%) | 546 (4.6%) |
| 5 or more Vehicles | 395 (3.0%) | 340 (2.9%) |
| Total | 13,340 (100.0%) | 11,843 (100.0%) |
Commute Time in Summerville
The most frequently occuring commute durations in Summerville are 30 to 34 minutes (3,552 commuters, 15.2%), 45 to 59 minutes (3,533 commuters, 15.1%), and 15 to 19 minutes (3,145 commuters, 13.5%).
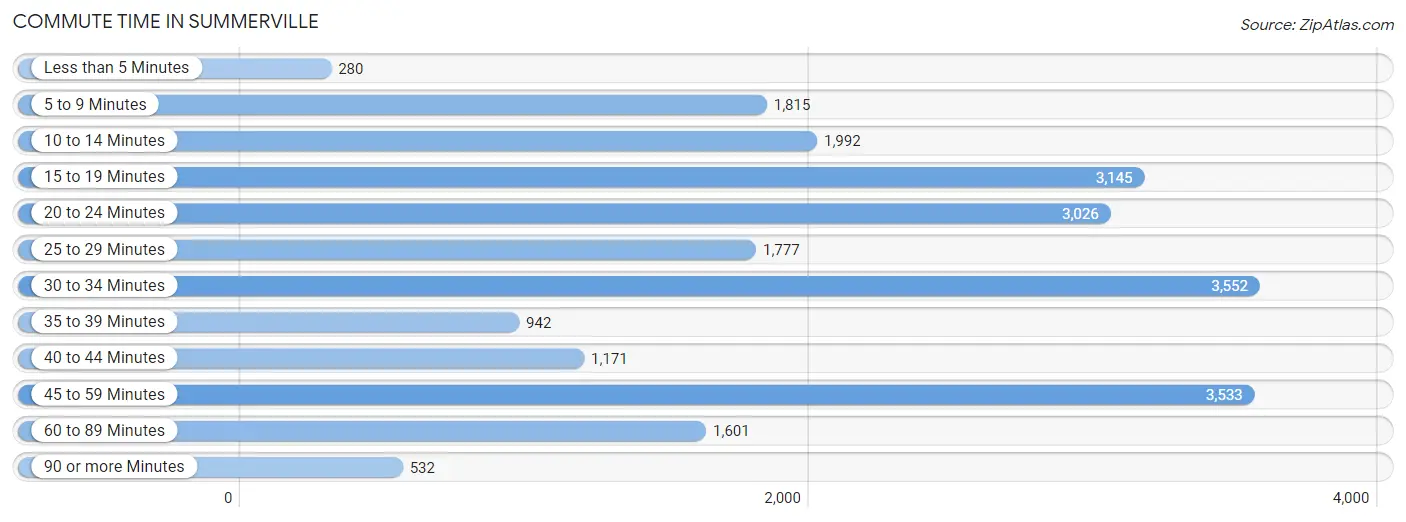
| Commute Time | # Commuters | % Commuters |
| Less than 5 Minutes | 280 | 1.2% |
| 5 to 9 Minutes | 1,815 | 7.8% |
| 10 to 14 Minutes | 1,992 | 8.5% |
| 15 to 19 Minutes | 3,145 | 13.5% |
| 20 to 24 Minutes | 3,026 | 13.0% |
| 25 to 29 Minutes | 1,777 | 7.6% |
| 30 to 34 Minutes | 3,552 | 15.2% |
| 35 to 39 Minutes | 942 | 4.0% |
| 40 to 44 Minutes | 1,171 | 5.0% |
| 45 to 59 Minutes | 3,533 | 15.1% |
| 60 to 89 Minutes | 1,601 | 6.9% |
| 90 or more Minutes | 532 | 2.3% |
Commute Time by Sex in Summerville
The most common commute times in Summerville are 30 to 34 minutes (2,386 commuters, 19.3%) for males and 45 to 59 minutes (1,960 commuters, 17.8%) for females.
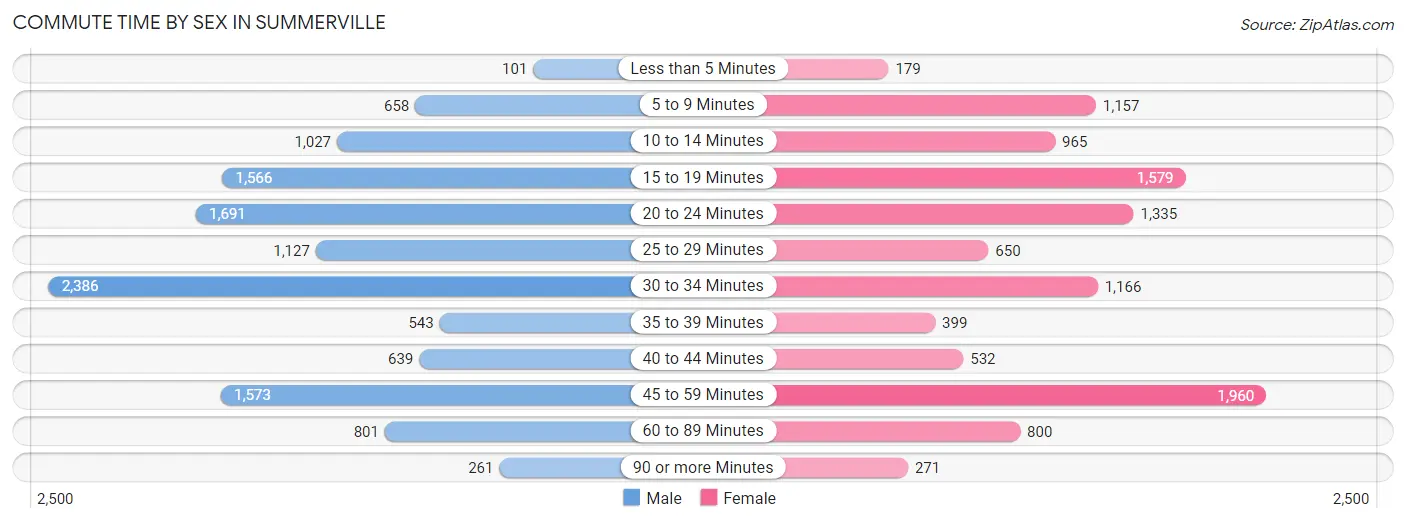
| Commute Time | Male | Female |
| Less than 5 Minutes | 101 (0.8%) | 179 (1.6%) |
| 5 to 9 Minutes | 658 (5.3%) | 1,157 (10.5%) |
| 10 to 14 Minutes | 1,027 (8.3%) | 965 (8.8%) |
| 15 to 19 Minutes | 1,566 (12.7%) | 1,579 (14.4%) |
| 20 to 24 Minutes | 1,691 (13.7%) | 1,335 (12.1%) |
| 25 to 29 Minutes | 1,127 (9.1%) | 650 (5.9%) |
| 30 to 34 Minutes | 2,386 (19.3%) | 1,166 (10.6%) |
| 35 to 39 Minutes | 543 (4.4%) | 399 (3.6%) |
| 40 to 44 Minutes | 639 (5.2%) | 532 (4.8%) |
| 45 to 59 Minutes | 1,573 (12.7%) | 1,960 (17.8%) |
| 60 to 89 Minutes | 801 (6.5%) | 800 (7.3%) |
| 90 or more Minutes | 261 (2.1%) | 271 (2.5%) |
Time of Departure to Work by Sex in Summerville
The most frequent times of departure to work in Summerville are 7:00 AM to 7:29 AM (1,973, 16.0%) for males and 6:30 AM to 6:59 AM (1,959, 17.8%) for females.
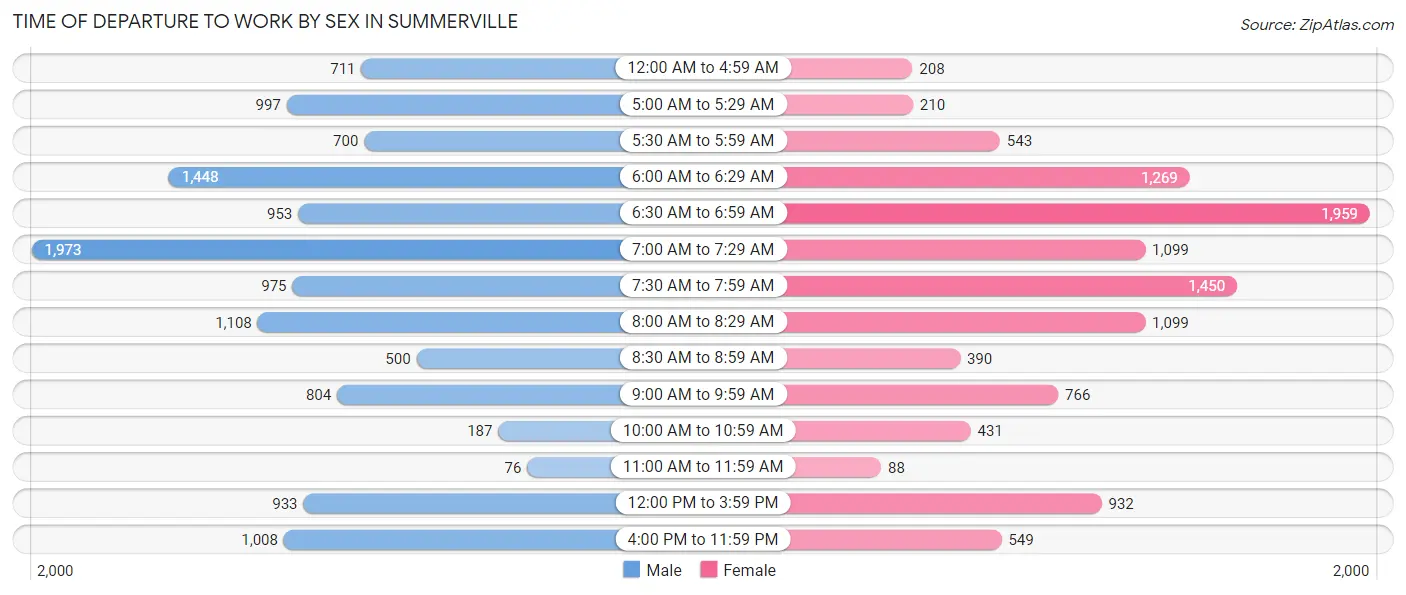
| Time of Departure | Male | Female |
| 12:00 AM to 4:59 AM | 711 (5.8%) | 208 (1.9%) |
| 5:00 AM to 5:29 AM | 997 (8.1%) | 210 (1.9%) |
| 5:30 AM to 5:59 AM | 700 (5.7%) | 543 (4.9%) |
| 6:00 AM to 6:29 AM | 1,448 (11.7%) | 1,269 (11.5%) |
| 6:30 AM to 6:59 AM | 953 (7.7%) | 1,959 (17.8%) |
| 7:00 AM to 7:29 AM | 1,973 (16.0%) | 1,099 (10.0%) |
| 7:30 AM to 7:59 AM | 975 (7.9%) | 1,450 (13.2%) |
| 8:00 AM to 8:29 AM | 1,108 (8.9%) | 1,099 (10.0%) |
| 8:30 AM to 8:59 AM | 500 (4.0%) | 390 (3.5%) |
| 9:00 AM to 9:59 AM | 804 (6.5%) | 766 (7.0%) |
| 10:00 AM to 10:59 AM | 187 (1.5%) | 431 (3.9%) |
| 11:00 AM to 11:59 AM | 76 (0.6%) | 88 (0.8%) |
| 12:00 PM to 3:59 PM | 933 (7.5%) | 932 (8.5%) |
| 4:00 PM to 11:59 PM | 1,008 (8.2%) | 549 (5.0%) |
| Total | 12,373 (100.0%) | 10,993 (100.0%) |
Housing Occupancy in Summerville
Occupancy by Ownership in Summerville
Of the total 20,137 dwellings in Summerville, owner-occupied units account for 13,828 (68.7%), while renter-occupied units make up 6,309 (31.3%).
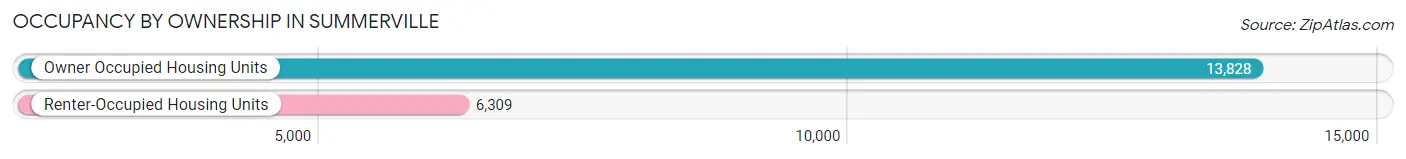
| Occupancy | # Housing Units | % Housing Units |
| Owner Occupied Housing Units | 13,828 | 68.7% |
| Renter-Occupied Housing Units | 6,309 | 31.3% |
| Total Occupied Housing Units | 20,137 | 100.0% |
Occupancy by Household Size in Summerville
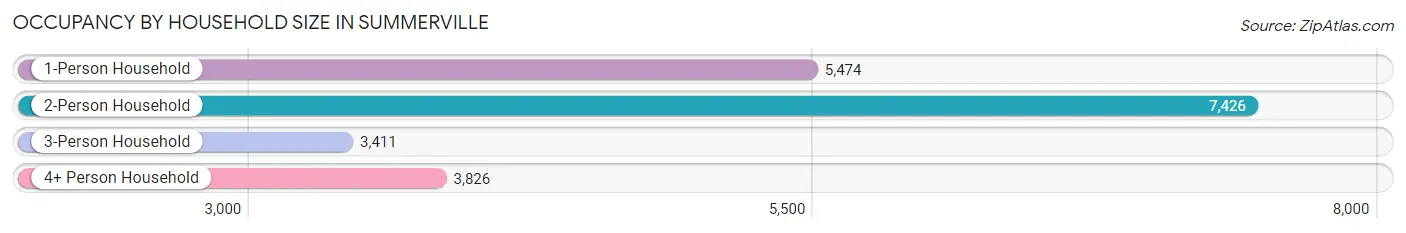
| Household Size | # Housing Units | % Housing Units |
| 1-Person Household | 5,474 | 27.2% |
| 2-Person Household | 7,426 | 36.9% |
| 3-Person Household | 3,411 | 16.9% |
| 4+ Person Household | 3,826 | 19.0% |
| Total Housing Units | 20,137 | 100.0% |
Occupancy by Ownership by Household Size in Summerville
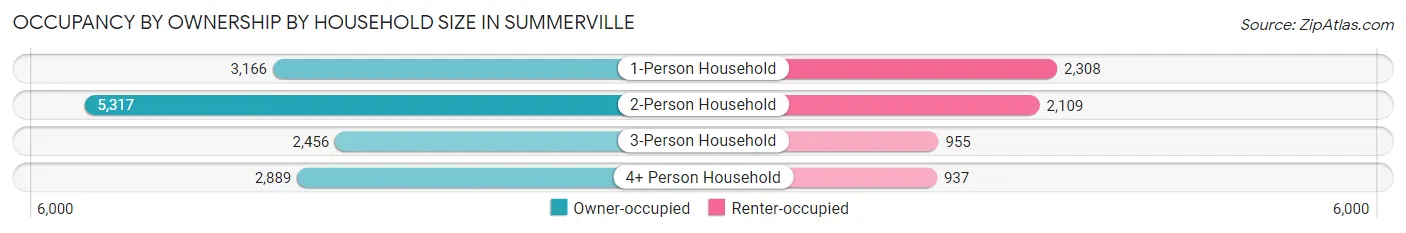
| Household Size | Owner-occupied | Renter-occupied |
| 1-Person Household | 3,166 (57.8%) | 2,308 (42.2%) |
| 2-Person Household | 5,317 (71.6%) | 2,109 (28.4%) |
| 3-Person Household | 2,456 (72.0%) | 955 (28.0%) |
| 4+ Person Household | 2,889 (75.5%) | 937 (24.5%) |
| Total Housing Units | 13,828 (68.7%) | 6,309 (31.3%) |
Occupancy by Educational Attainment in Summerville
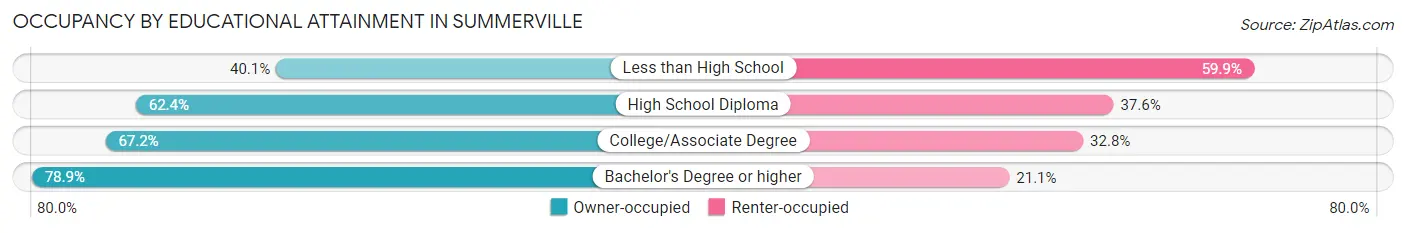
| Household Size | Owner-occupied | Renter-occupied |
| Less than High School | 388 (40.1%) | 579 (59.9%) |
| High School Diploma | 2,642 (62.4%) | 1,595 (37.6%) |
| College/Associate Degree | 5,624 (67.2%) | 2,749 (32.8%) |
| Bachelor's Degree or higher | 5,174 (78.9%) | 1,386 (21.1%) |
Occupancy by Age of Householder in Summerville
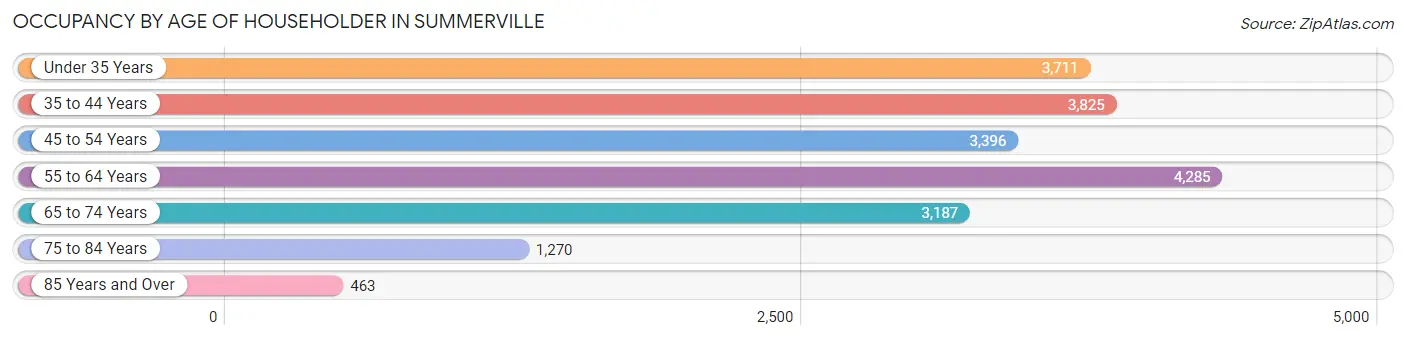
| Age Bracket | # Households | % Households |
| Under 35 Years | 3,711 | 18.4% |
| 35 to 44 Years | 3,825 | 19.0% |
| 45 to 54 Years | 3,396 | 16.9% |
| 55 to 64 Years | 4,285 | 21.3% |
| 65 to 74 Years | 3,187 | 15.8% |
| 75 to 84 Years | 1,270 | 6.3% |
| 85 Years and Over | 463 | 2.3% |
| Total | 20,137 | 100.0% |
Housing Finances in Summerville
Median Income by Occupancy in Summerville
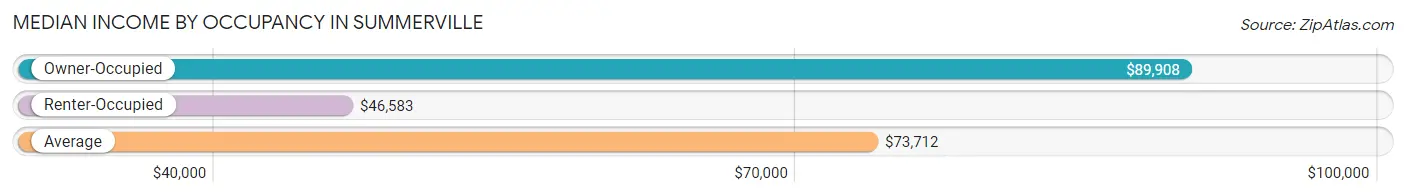
| Occupancy Type | # Households | Median Income |
| Owner-Occupied | 13,828 (68.7%) | $89,908 |
| Renter-Occupied | 6,309 (31.3%) | $46,583 |
| Average | 20,137 (100.0%) | $73,712 |
Occupancy by Householder Income Bracket in Summerville
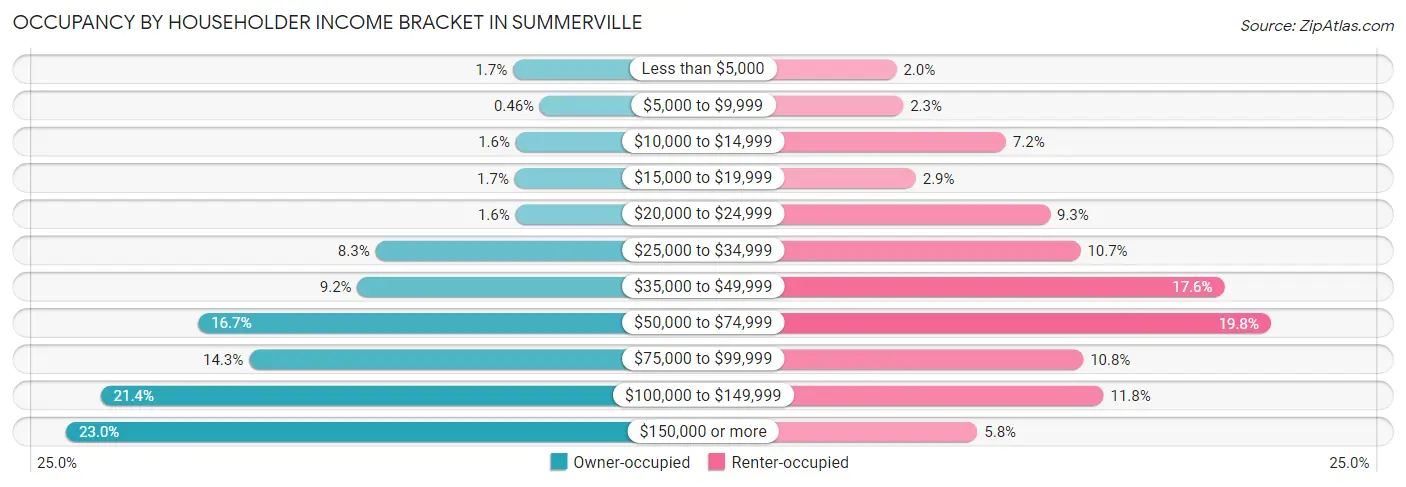
| Income Bracket | Owner-occupied | Renter-occupied |
| Less than $5,000 | 241 (1.7%) | 123 (1.9%) |
| $5,000 to $9,999 | 63 (0.5%) | 143 (2.3%) |
| $10,000 to $14,999 | 223 (1.6%) | 452 (7.2%) |
| $15,000 to $19,999 | 230 (1.7%) | 181 (2.9%) |
| $20,000 to $24,999 | 224 (1.6%) | 584 (9.3%) |
| $25,000 to $34,999 | 1,147 (8.3%) | 676 (10.7%) |
| $35,000 to $49,999 | 1,265 (9.1%) | 1,108 (17.6%) |
| $50,000 to $74,999 | 2,314 (16.7%) | 1,247 (19.8%) |
| $75,000 to $99,999 | 1,979 (14.3%) | 684 (10.8%) |
| $100,000 to $149,999 | 2,957 (21.4%) | 745 (11.8%) |
| $150,000 or more | 3,185 (23.0%) | 366 (5.8%) |
| Total | 13,828 (100.0%) | 6,309 (100.0%) |
Monthly Housing Cost Tiers in Summerville
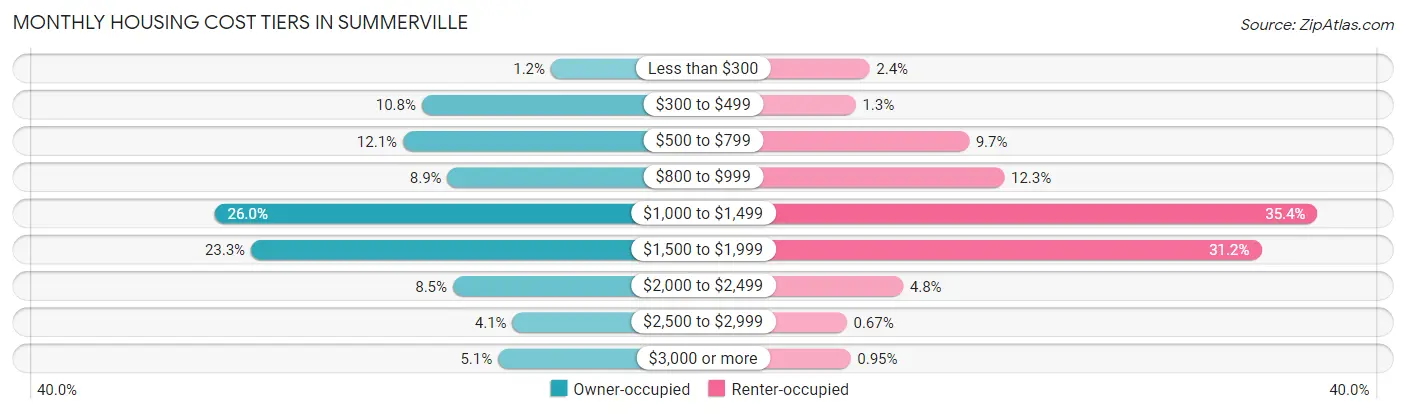
| Monthly Cost | Owner-occupied | Renter-occupied |
| Less than $300 | 171 (1.2%) | 148 (2.4%) |
| $300 to $499 | 1,487 (10.7%) | 84 (1.3%) |
| $500 to $799 | 1,679 (12.1%) | 610 (9.7%) |
| $800 to $999 | 1,225 (8.9%) | 774 (12.3%) |
| $1,000 to $1,499 | 3,597 (26.0%) | 2,230 (35.3%) |
| $1,500 to $1,999 | 3,226 (23.3%) | 1,969 (31.2%) |
| $2,000 to $2,499 | 1,170 (8.5%) | 304 (4.8%) |
| $2,500 to $2,999 | 563 (4.1%) | 42 (0.7%) |
| $3,000 or more | 710 (5.1%) | 60 (0.9%) |
| Total | 13,828 (100.0%) | 6,309 (100.0%) |
Physical Housing Characteristics in Summerville
Housing Structures in Summerville
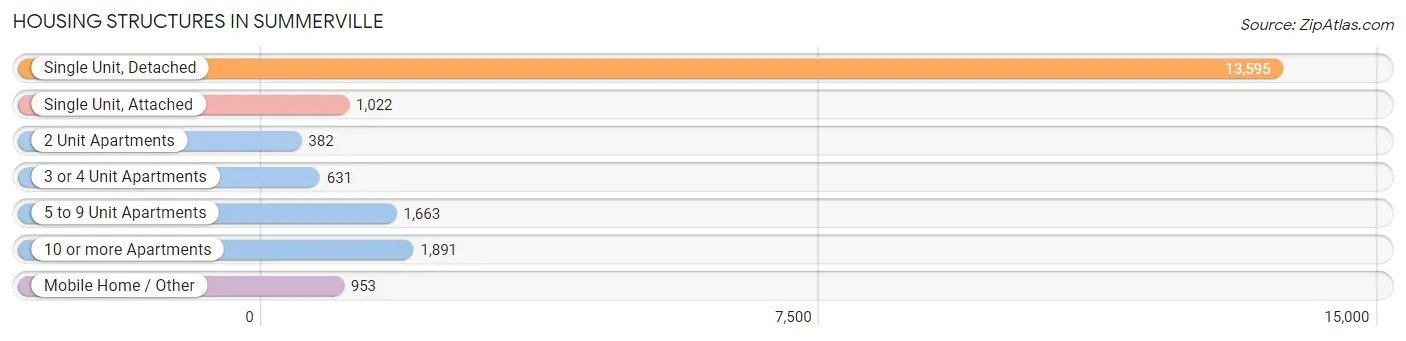
| Structure Type | # Housing Units | % Housing Units |
| Single Unit, Detached | 13,595 | 67.5% |
| Single Unit, Attached | 1,022 | 5.1% |
| 2 Unit Apartments | 382 | 1.9% |
| 3 or 4 Unit Apartments | 631 | 3.1% |
| 5 to 9 Unit Apartments | 1,663 | 8.3% |
| 10 or more Apartments | 1,891 | 9.4% |
| Mobile Home / Other | 953 | 4.7% |
| Total | 20,137 | 100.0% |
Housing Structures by Occupancy in Summerville
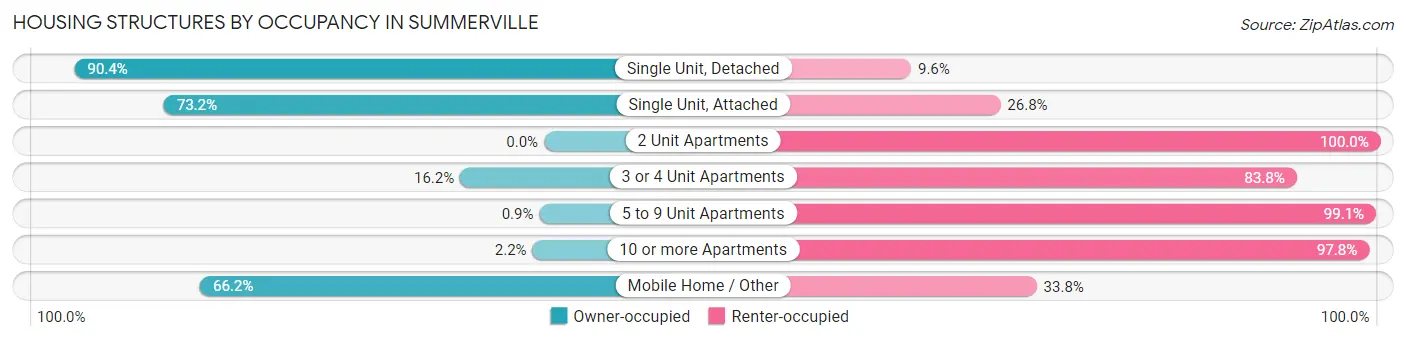
| Structure Type | Owner-occupied | Renter-occupied |
| Single Unit, Detached | 12,290 (90.4%) | 1,305 (9.6%) |
| Single Unit, Attached | 748 (73.2%) | 274 (26.8%) |
| 2 Unit Apartments | 0 (0.0%) | 382 (100.0%) |
| 3 or 4 Unit Apartments | 102 (16.2%) | 529 (83.8%) |
| 5 to 9 Unit Apartments | 15 (0.9%) | 1,648 (99.1%) |
| 10 or more Apartments | 42 (2.2%) | 1,849 (97.8%) |
| Mobile Home / Other | 631 (66.2%) | 322 (33.8%) |
| Total | 13,828 (68.7%) | 6,309 (31.3%) |
Housing Structures by Number of Rooms in Summerville
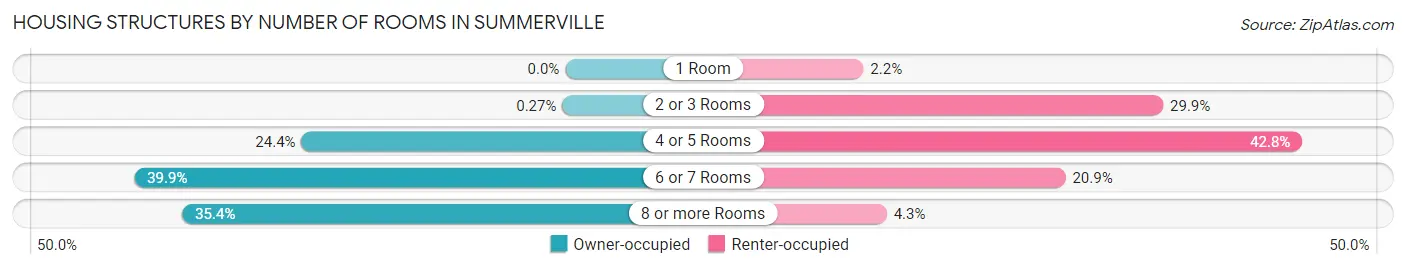
| Number of Rooms | Owner-occupied | Renter-occupied |
| 1 Room | 0 (0.0%) | 137 (2.2%) |
| 2 or 3 Rooms | 38 (0.3%) | 1,886 (29.9%) |
| 4 or 5 Rooms | 3,374 (24.4%) | 2,697 (42.7%) |
| 6 or 7 Rooms | 5,515 (39.9%) | 1,316 (20.9%) |
| 8 or more Rooms | 4,901 (35.4%) | 273 (4.3%) |
| Total | 13,828 (100.0%) | 6,309 (100.0%) |
Housing Structure by Heating Type in Summerville
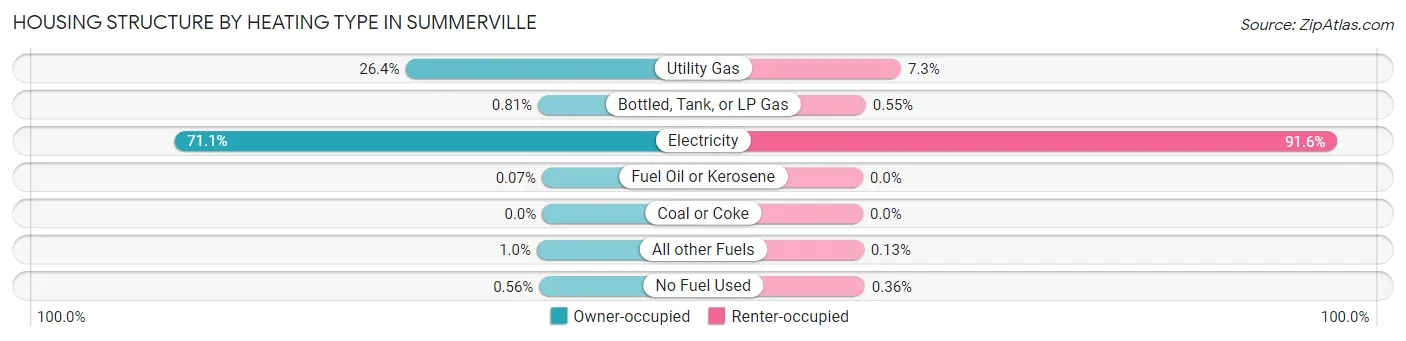
| Heating Type | Owner-occupied | Renter-occupied |
| Utility Gas | 3,655 (26.4%) | 463 (7.3%) |
| Bottled, Tank, or LP Gas | 112 (0.8%) | 35 (0.5%) |
| Electricity | 9,831 (71.1%) | 5,780 (91.6%) |
| Fuel Oil or Kerosene | 9 (0.1%) | 0 (0.0%) |
| Coal or Coke | 0 (0.0%) | 0 (0.0%) |
| All other Fuels | 143 (1.0%) | 8 (0.1%) |
| No Fuel Used | 78 (0.6%) | 23 (0.4%) |
| Total | 13,828 (100.0%) | 6,309 (100.0%) |
Household Vehicle Usage in Summerville
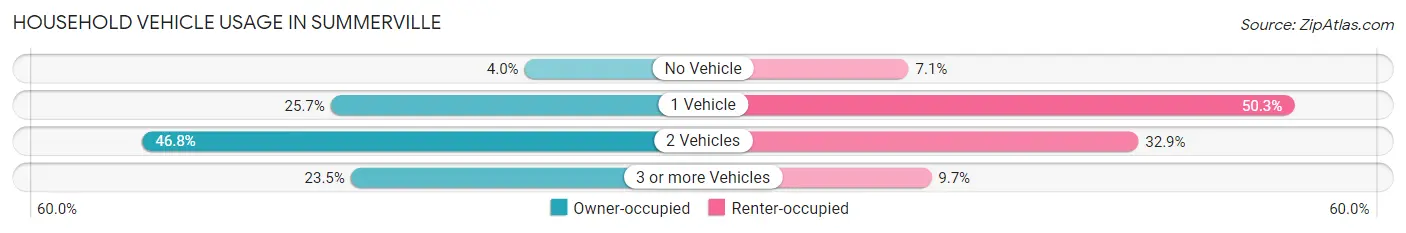
| Vehicles per Household | Owner-occupied | Renter-occupied |
| No Vehicle | 554 (4.0%) | 450 (7.1%) |
| 1 Vehicle | 3,556 (25.7%) | 3,174 (50.3%) |
| 2 Vehicles | 6,471 (46.8%) | 2,074 (32.9%) |
| 3 or more Vehicles | 3,247 (23.5%) | 611 (9.7%) |
| Total | 13,828 (100.0%) | 6,309 (100.0%) |
Real Estate & Mortgages in Summerville
Real Estate and Mortgage Overview in Summerville
| Characteristic | Without Mortgage | With Mortgage |
| Housing Units | 3,667 | 10,161 |
| Median Property Value | $276,800 | $276,600 |
| Median Household Income | $58,585 | $2,706 |
| Monthly Housing Costs | $561 | $710 |
| Real Estate Taxes | $1,540 | $417 |
Property Value by Mortgage Status in Summerville
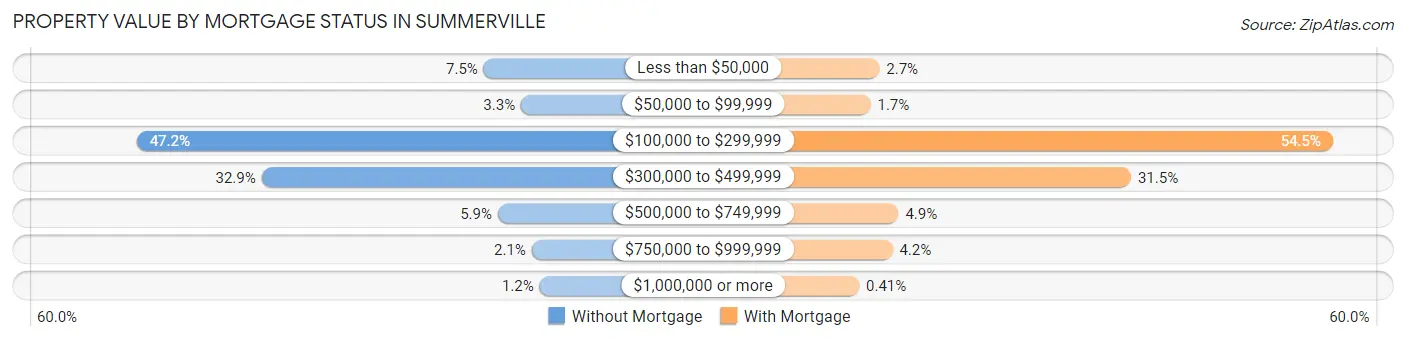
| Property Value | Without Mortgage | With Mortgage |
| Less than $50,000 | 276 (7.5%) | 276 (2.7%) |
| $50,000 to $99,999 | 120 (3.3%) | 174 (1.7%) |
| $100,000 to $299,999 | 1,730 (47.2%) | 5,542 (54.5%) |
| $300,000 to $499,999 | 1,207 (32.9%) | 3,199 (31.5%) |
| $500,000 to $749,999 | 217 (5.9%) | 499 (4.9%) |
| $750,000 to $999,999 | 75 (2.1%) | 429 (4.2%) |
| $1,000,000 or more | 42 (1.1%) | 42 (0.4%) |
| Total | 3,667 (100.0%) | 10,161 (100.0%) |
Household Income by Mortgage Status in Summerville
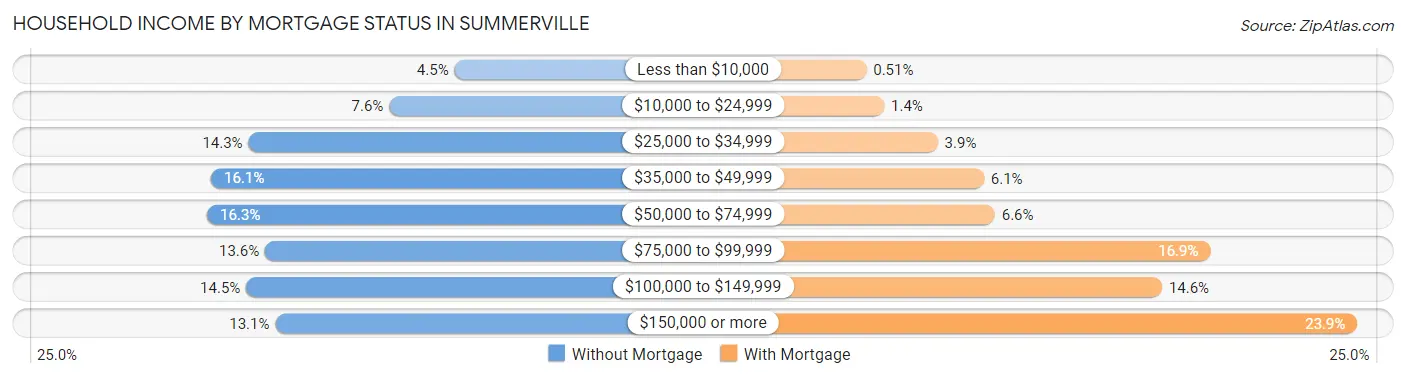
| Household Income | Without Mortgage | With Mortgage |
| Less than $10,000 | 166 (4.5%) | 52 (0.5%) |
| $10,000 to $24,999 | 280 (7.6%) | 138 (1.4%) |
| $25,000 to $34,999 | 526 (14.3%) | 397 (3.9%) |
| $35,000 to $49,999 | 591 (16.1%) | 621 (6.1%) |
| $50,000 to $74,999 | 598 (16.3%) | 674 (6.6%) |
| $75,000 to $99,999 | 497 (13.6%) | 1,716 (16.9%) |
| $100,000 to $149,999 | 530 (14.4%) | 1,482 (14.6%) |
| $150,000 or more | 479 (13.1%) | 2,427 (23.9%) |
| Total | 3,667 (100.0%) | 10,161 (100.0%) |
Property Value to Household Income Ratio in Summerville
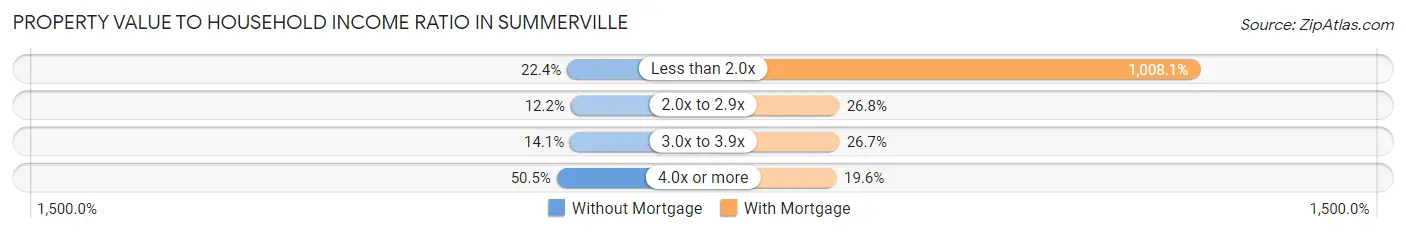
| Value-to-Income Ratio | Without Mortgage | With Mortgage |
| Less than 2.0x | 820 (22.4%) | 102,431 (1,008.1%) |
| 2.0x to 2.9x | 447 (12.2%) | 2,723 (26.8%) |
| 3.0x to 3.9x | 517 (14.1%) | 2,714 (26.7%) |
| 4.0x or more | 1,852 (50.5%) | 1,988 (19.6%) |
| Total | 3,667 (100.0%) | 10,161 (100.0%) |
Real Estate Taxes by Mortgage Status in Summerville
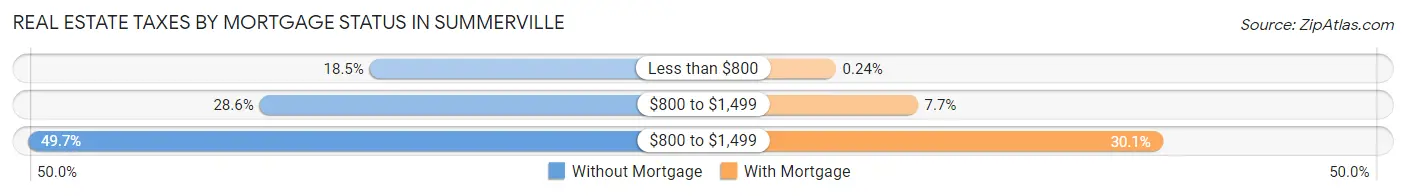
| Property Taxes | Without Mortgage | With Mortgage |
| Less than $800 | 678 (18.5%) | 24 (0.2%) |
| $800 to $1,499 | 1,047 (28.5%) | 784 (7.7%) |
| $800 to $1,499 | 1,822 (49.7%) | 3,058 (30.1%) |
| Total | 3,667 (100.0%) | 10,161 (100.0%) |
Health & Disability in Summerville
Health Insurance Coverage by Age in Summerville
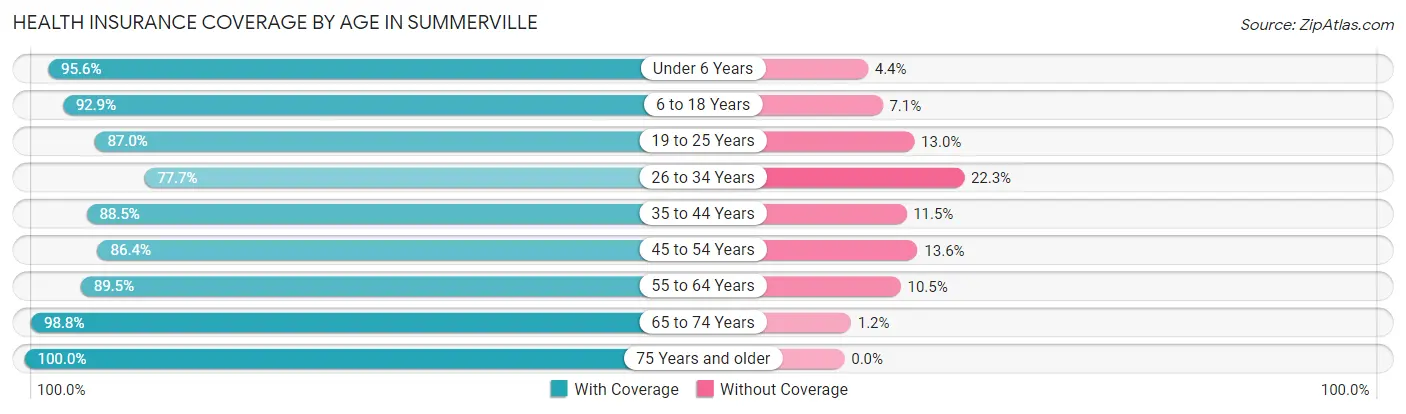
| Age Bracket | With Coverage | Without Coverage |
| Under 6 Years | 4,020 (95.6%) | 184 (4.4%) |
| 6 to 18 Years | 7,484 (92.9%) | 574 (7.1%) |
| 19 to 25 Years | 3,585 (87.0%) | 537 (13.0%) |
| 26 to 34 Years | 4,657 (77.7%) | 1,337 (22.3%) |
| 35 to 44 Years | 6,074 (88.5%) | 792 (11.5%) |
| 45 to 54 Years | 5,362 (86.4%) | 846 (13.6%) |
| 55 to 64 Years | 6,590 (89.5%) | 772 (10.5%) |
| 65 to 74 Years | 4,896 (98.8%) | 60 (1.2%) |
| 75 Years and older | 2,571 (100.0%) | 0 (0.0%) |
| Total | 45,239 (89.9%) | 5,102 (10.1%) |
Health Insurance Coverage by Citizenship Status in Summerville
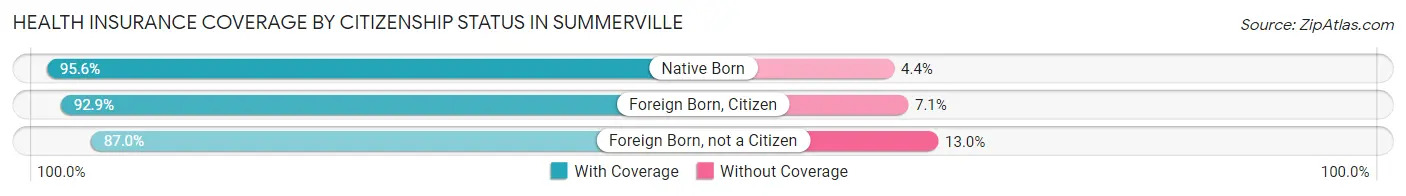
| Citizenship Status | With Coverage | Without Coverage |
| Native Born | 4,020 (95.6%) | 184 (4.4%) |
| Foreign Born, Citizen | 7,484 (92.9%) | 574 (7.1%) |
| Foreign Born, not a Citizen | 3,585 (87.0%) | 537 (13.0%) |
Health Insurance Coverage by Household Income in Summerville
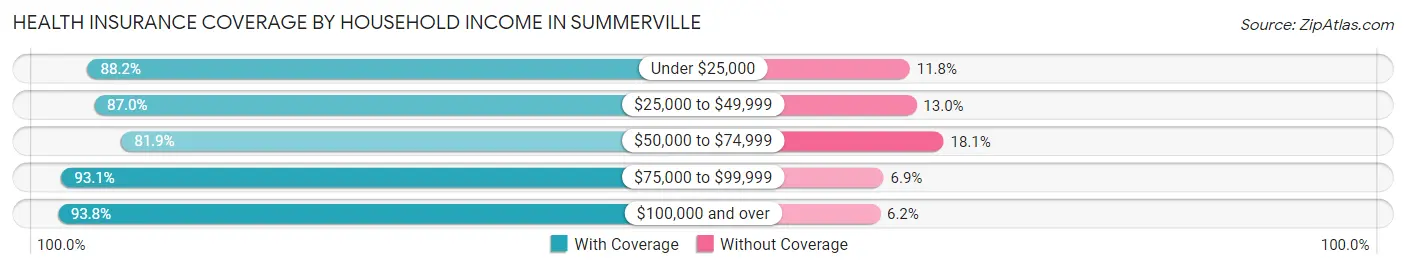
| Household Income | With Coverage | Without Coverage |
| Under $25,000 | 3,392 (88.2%) | 454 (11.8%) |
| $25,000 to $49,999 | 8,161 (87.0%) | 1,224 (13.0%) |
| $50,000 to $74,999 | 7,128 (81.9%) | 1,578 (18.1%) |
| $75,000 to $99,999 | 6,068 (93.1%) | 450 (6.9%) |
| $100,000 and over | 20,345 (93.8%) | 1,351 (6.2%) |
Public vs Private Health Insurance Coverage by Age in Summerville
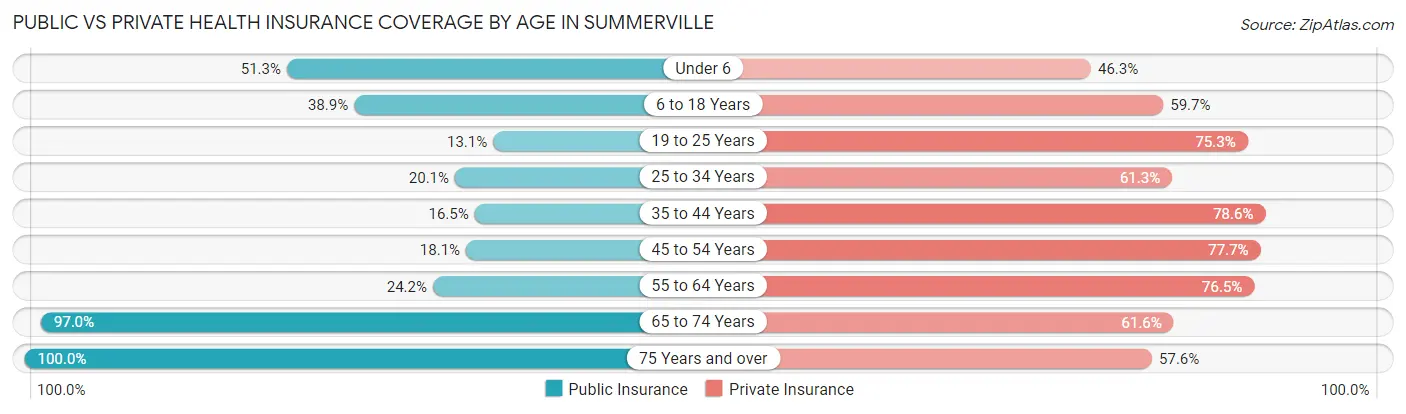
| Age Bracket | Public Insurance | Private Insurance |
| Under 6 | 2,158 (51.3%) | 1,945 (46.3%) |
| 6 to 18 Years | 3,131 (38.9%) | 4,809 (59.7%) |
| 19 to 25 Years | 538 (13.1%) | 3,104 (75.3%) |
| 25 to 34 Years | 1,207 (20.1%) | 3,673 (61.3%) |
| 35 to 44 Years | 1,132 (16.5%) | 5,396 (78.6%) |
| 45 to 54 Years | 1,123 (18.1%) | 4,823 (77.7%) |
| 55 to 64 Years | 1,784 (24.2%) | 5,634 (76.5%) |
| 65 to 74 Years | 4,806 (97.0%) | 3,052 (61.6%) |
| 75 Years and over | 2,571 (100.0%) | 1,481 (57.6%) |
| Total | 18,450 (36.6%) | 33,917 (67.4%) |
Disability Status by Sex by Age in Summerville
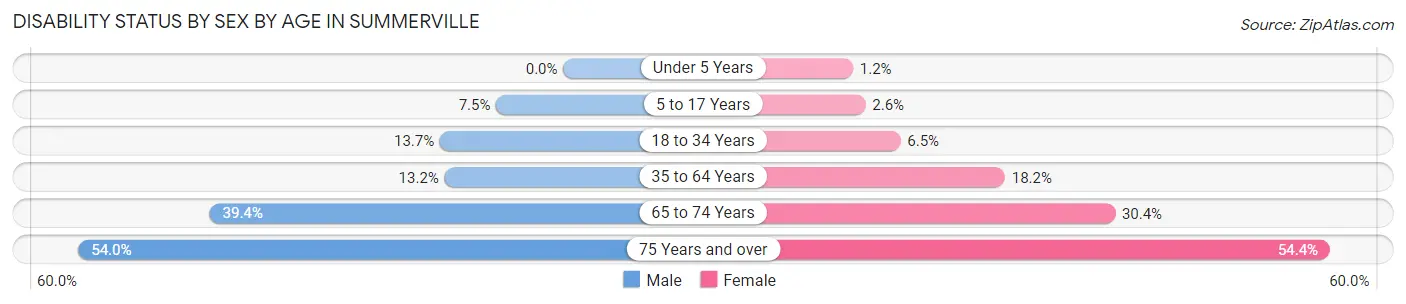
| Age Bracket | Male | Female |
| Under 5 Years | 0 (0.0%) | 19 (1.2%) |
| 5 to 17 Years | 316 (7.5%) | 109 (2.6%) |
| 18 to 34 Years | 692 (13.7%) | 361 (6.5%) |
| 35 to 64 Years | 1,301 (13.2%) | 1,923 (18.1%) |
| 65 to 74 Years | 774 (39.4%) | 910 (30.4%) |
| 75 Years and over | 578 (54.0%) | 816 (54.4%) |
Disability Class by Sex by Age in Summerville
Disability Class: Hearing Difficulty
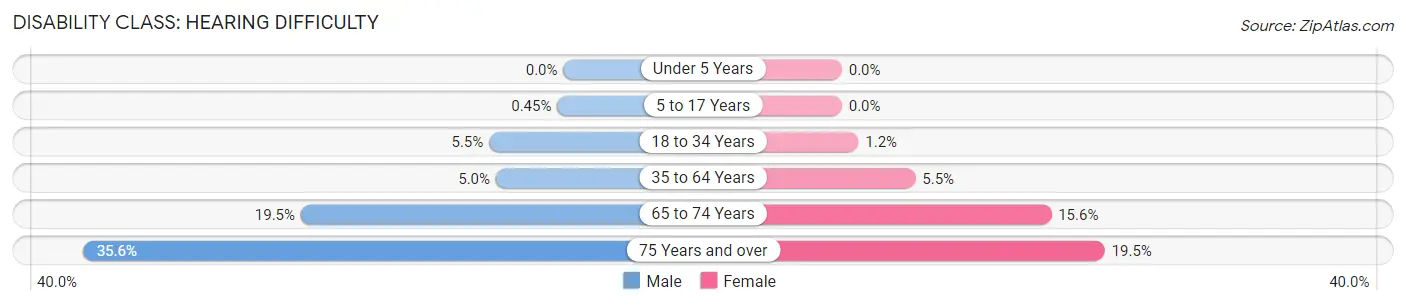
| Age Bracket | Male | Female |
| Under 5 Years | 0 (0.0%) | 0 (0.0%) |
| 5 to 17 Years | 19 (0.4%) | 0 (0.0%) |
| 18 to 34 Years | 278 (5.5%) | 68 (1.2%) |
| 35 to 64 Years | 493 (5.0%) | 579 (5.5%) |
| 65 to 74 Years | 383 (19.5%) | 465 (15.5%) |
| 75 Years and over | 381 (35.6%) | 293 (19.5%) |
Disability Class: Vision Difficulty
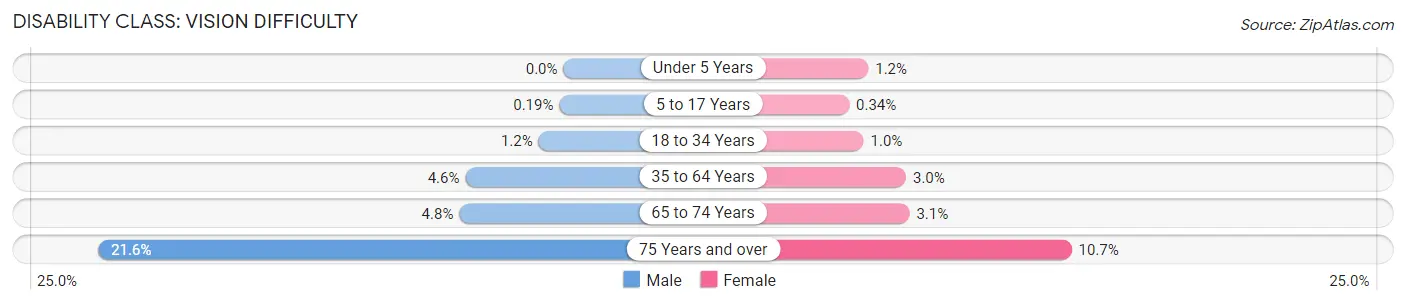
| Age Bracket | Male | Female |
| Under 5 Years | 0 (0.0%) | 19 (1.2%) |
| 5 to 17 Years | 8 (0.2%) | 14 (0.3%) |
| 18 to 34 Years | 58 (1.1%) | 56 (1.0%) |
| 35 to 64 Years | 448 (4.5%) | 316 (3.0%) |
| 65 to 74 Years | 95 (4.8%) | 94 (3.1%) |
| 75 Years and over | 231 (21.6%) | 160 (10.7%) |
Disability Class: Cognitive Difficulty
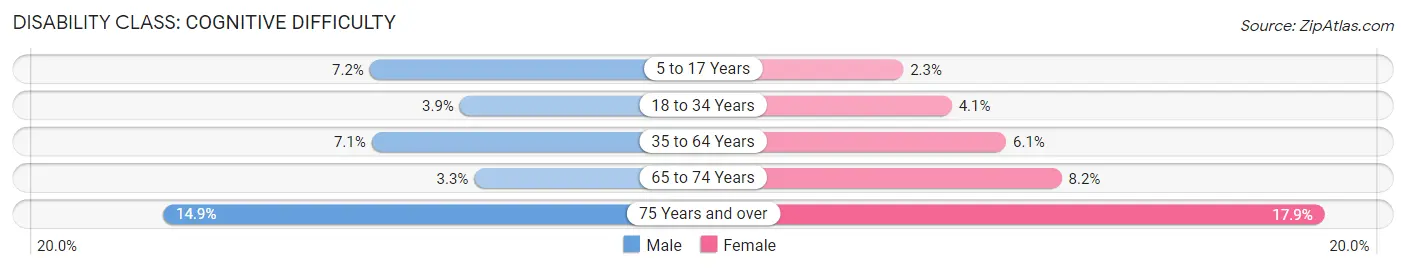
| Age Bracket | Male | Female |
| 5 to 17 Years | 304 (7.2%) | 95 (2.3%) |
| 18 to 34 Years | 194 (3.8%) | 226 (4.1%) |
| 35 to 64 Years | 701 (7.1%) | 646 (6.1%) |
| 65 to 74 Years | 65 (3.3%) | 244 (8.2%) |
| 75 Years and over | 159 (14.9%) | 269 (17.9%) |
Disability Class: Ambulatory Difficulty
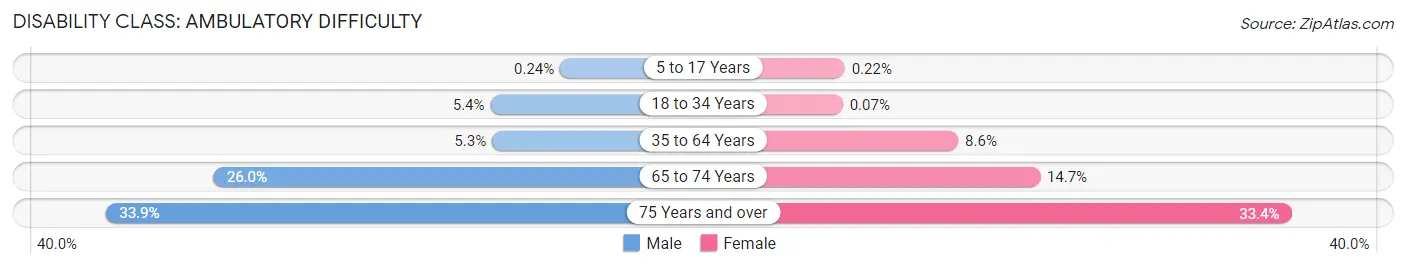
| Age Bracket | Male | Female |
| 5 to 17 Years | 10 (0.2%) | 9 (0.2%) |
| 18 to 34 Years | 273 (5.4%) | 4 (0.1%) |
| 35 to 64 Years | 522 (5.3%) | 915 (8.6%) |
| 65 to 74 Years | 510 (26.0%) | 440 (14.7%) |
| 75 Years and over | 363 (33.9%) | 501 (33.4%) |
Disability Class: Self-Care Difficulty
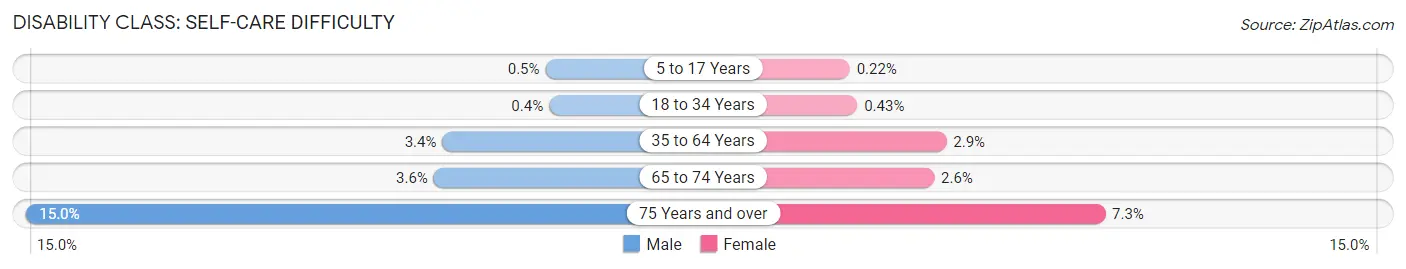
| Age Bracket | Male | Female |
| 5 to 17 Years | 21 (0.5%) | 9 (0.2%) |
| 18 to 34 Years | 20 (0.4%) | 24 (0.4%) |
| 35 to 64 Years | 332 (3.4%) | 308 (2.9%) |
| 65 to 74 Years | 71 (3.6%) | 77 (2.6%) |
| 75 Years and over | 160 (14.9%) | 110 (7.3%) |
Technology Access in Summerville
Computing Device Access in Summerville
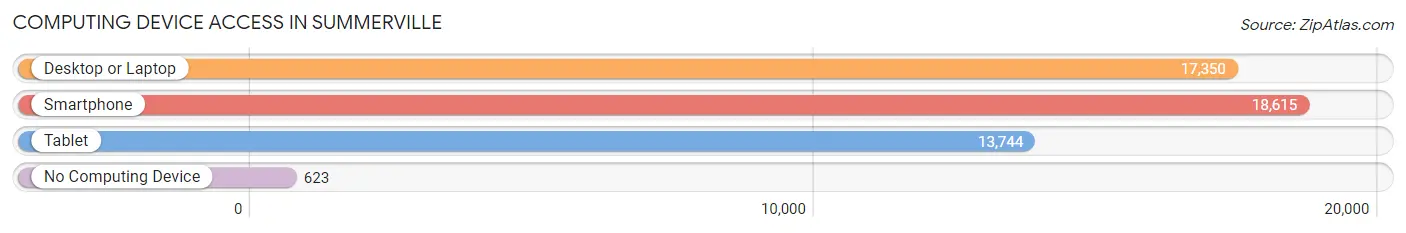
| Device Type | # Households | % Households |
| Desktop or Laptop | 17,350 | 86.2% |
| Smartphone | 18,615 | 92.4% |
| Tablet | 13,744 | 68.2% |
| No Computing Device | 623 | 3.1% |
| Total | 20,137 | 100.0% |
Internet Access in Summerville
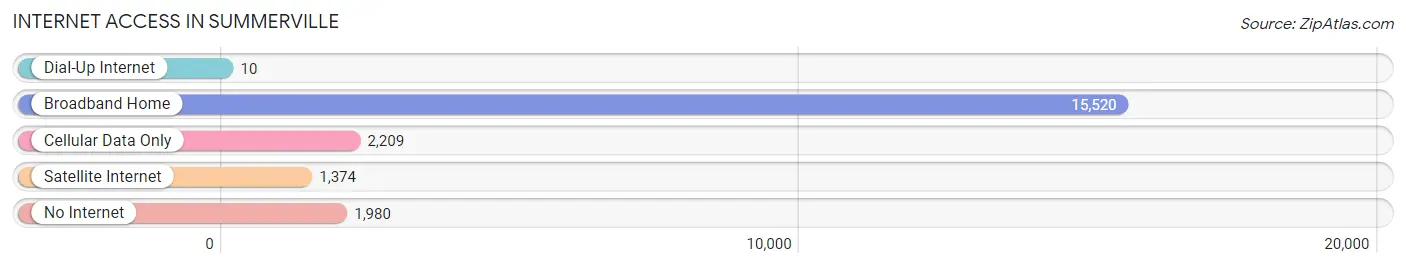
| Internet Type | # Households | % Households |
| Dial-Up Internet | 10 | 0.1% |
| Broadband Home | 15,520 | 77.1% |
| Cellular Data Only | 2,209 | 11.0% |
| Satellite Internet | 1,374 | 6.8% |
| No Internet | 1,980 | 9.8% |
| Total | 20,137 | 100.0% |
Summerville Summary
History
The town of Summerville, South Carolina is located in the Lowcountry region of the state, and has a rich history that dates back to the early 1700s. The area was first settled by Europeans in 1785, when a group of French Huguenots led by Jean Pierre Purry established a settlement near the Ashley River. The settlement was named Summerville, after the warm summer climate of the area.
In the early 1800s, the town began to grow and prosper as a center of commerce and industry. The town was home to several cotton plantations, and the railroad was built through the area in 1831, connecting Summerville to other parts of the state. The town was also home to several churches, schools, and other businesses.
In the late 1800s, Summerville became a popular tourist destination, as visitors flocked to the area to enjoy its mild climate and natural beauty. The town was also home to several resorts, including the Pine Forest Inn, which was built in 1891.
In the early 1900s, Summerville continued to grow and prosper. The town was home to several factories, including a cotton mill, a paper mill, and a brickyard. The town was also home to several schools, including Summerville High School, which was established in 1908.
In the late 1900s, Summerville experienced a period of decline as the local economy shifted away from manufacturing and towards tourism. The town was also affected by the Great Depression, and many of the factories and businesses closed. However, the town was able to rebound in the late 20th century, and today it is a thriving community with a vibrant economy.
Geography
Summerville is located in the Lowcountry region of South Carolina, about 25 miles northwest of Charleston. The town is situated on the Ashley River, and is surrounded by several small towns and villages. The town is located in Dorchester County, and is part of the Charleston-North Charleston-Summerville Metropolitan Statistical Area.
The town has a total area of 8.3 square miles, and is located at an elevation of about 50 feet above sea level. The town is located in a humid subtropical climate zone, and experiences hot, humid summers and mild winters.
Economy
Summerville’s economy is largely based on tourism, manufacturing, and retail. The town is home to several resorts and hotels, as well as several restaurants and shops. The town is also home to several manufacturing companies, including a paper mill, a brickyard, and a cotton mill.
The town is also home to several large employers, including Trident Health, a healthcare provider, and Blackbaud, a software company. The town is also home to several educational institutions, including Trident Technical College and the College of Charleston.
Demographics
As of the 2010 census, the town of Summerville had a population of 43,392. The population is largely white (77.3%), with African Americans making up 17.2% of the population. The town also has a large Hispanic population (7.2%), as well as a small Asian population (2.2%).
The median household income in Summerville is $54,845, and the median home value is $179,400. The town has a poverty rate of 11.2%, and the unemployment rate is 4.2%. The town is also home to several educational institutions, including Summerville High School, Trident Technical College, and the College of Charleston.
Common Questions
What is Per Capita Income in Summerville?
Per Capita income in Summerville is $38,714.
What is the Median Family Income in Summerville?
Median Family Income in Summerville is $95,842.
What is the Median Household income in Summerville?
Median Household Income in Summerville is $73,712.
What is Income or Wage Gap in Summerville?
Income or Wage Gap in Summerville is 32.2%.
Women in Summerville earn 67.8 cents for every dollar earned by a man.
What is Family Income Deficit in Summerville?
Family Income Deficit in Summerville is $10,042.
Families that are below poverty line in Summerville earn $10,042 less on average than the poverty threshold level.
What is Inequality or Gini Index in Summerville?
Inequality or Gini Index in Summerville is 0.42.
What is the Total Population of Summerville?
Total Population of Summerville is 50,839.
What is the Total Male Population of Summerville?
Total Male Population of Summerville is 24,356.
What is the Total Female Population of Summerville?
Total Female Population of Summerville is 26,483.
What is the Ratio of Males per 100 Females in Summerville?
There are 91.97 Males per 100 Females in Summerville.
What is the Ratio of Females per 100 Males in Summerville?
There are 108.73 Females per 100 Males in Summerville.
What is the Median Population Age in Summerville?
Median Population Age in Summerville is 38.8 Years.
What is the Average Family Size in Summerville
Average Family Size in Summerville is 3.0 People.
What is the Average Household Size in Summerville
Average Household Size in Summerville is 2.5 People.
How Large is the Labor Force in Summerville?
There are 27,272 People in the Labor Forcein in Summerville.
What is the Percentage of People in the Labor Force in Summerville?
67.6% of People are in the Labor Force in Summerville.
What is the Unemployment Rate in Summerville?
Unemployment Rate in Summerville is 5.8%.