Orangeburg County, SC Map & Demographics
Orangeburg County Map
Orangeburg County Overview
$23,636
PER CAPITA INCOME
$53,849
AVG FAMILY INCOME
$41,020
AVG HOUSEHOLD INCOME
20.0%
WAGE / INCOME GAP [ % ]
80.0¢/ $1
WAGE / INCOME GAP [ $ ]
$11,278
FAMILY INCOME DEFICIT
0.48
INEQUALITY / GINI INDEX
84,159
TOTAL POPULATION
39,563
MALE POPULATION
44,596
FEMALE POPULATION
88.71
MALES / 100 FEMALES
112.72
FEMALES / 100 MALES
40.5
MEDIAN AGE
3.2
AVG FAMILY SIZE
2.5
AVG HOUSEHOLD SIZE
35,906
LABOR FORCE [ PEOPLE ]
53.0%
PERCENT IN LABOR FORCE
9.2%
UNEMPLOYMENT RATE
Income in Orangeburg County
Income Overview in Orangeburg County
Per Capita Income in Orangeburg County is $23,636, while median incomes of families and households are $53,849 and $41,020 respectively.
| Characteristic | Number | Measure |
| Per Capita Income | 84,159 | $23,636 |
| Median Family Income | 19,942 | $53,849 |
| Mean Family Income | 19,942 | $71,131 |
| Median Household Income | 32,687 | $41,020 |
| Mean Household Income | 32,687 | $56,740 |
| Income Deficit | 19,942 | $11,278 |
| Wage / Income Gap (%) | 84,159 | 19.99% |
| Wage / Income Gap ($) | 84,159 | 80.01¢ per $1 |
| Gini / Inequality Index | 84,159 | 0.48 |
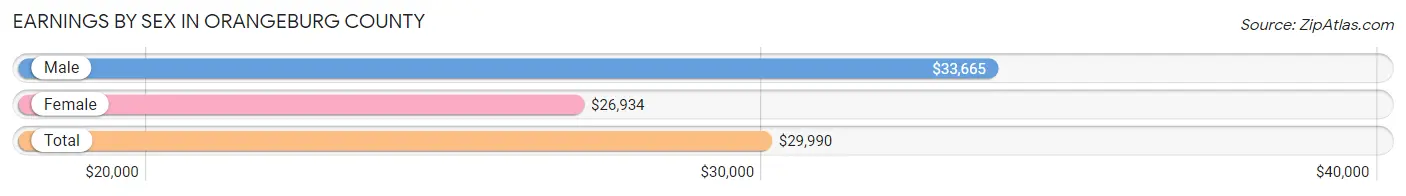
Earnings by Sex in Orangeburg County
Average Earnings in Orangeburg County are $29,990, $33,665 for men and $26,934 for women, a difference of 20.0%.
| Sex | Number | Average Earnings |
| Male | 18,774 (49.8%) | $33,665 |
| Female | 18,939 (50.2%) | $26,934 |
| Total | 37,713 (100.0%) | $29,990 |
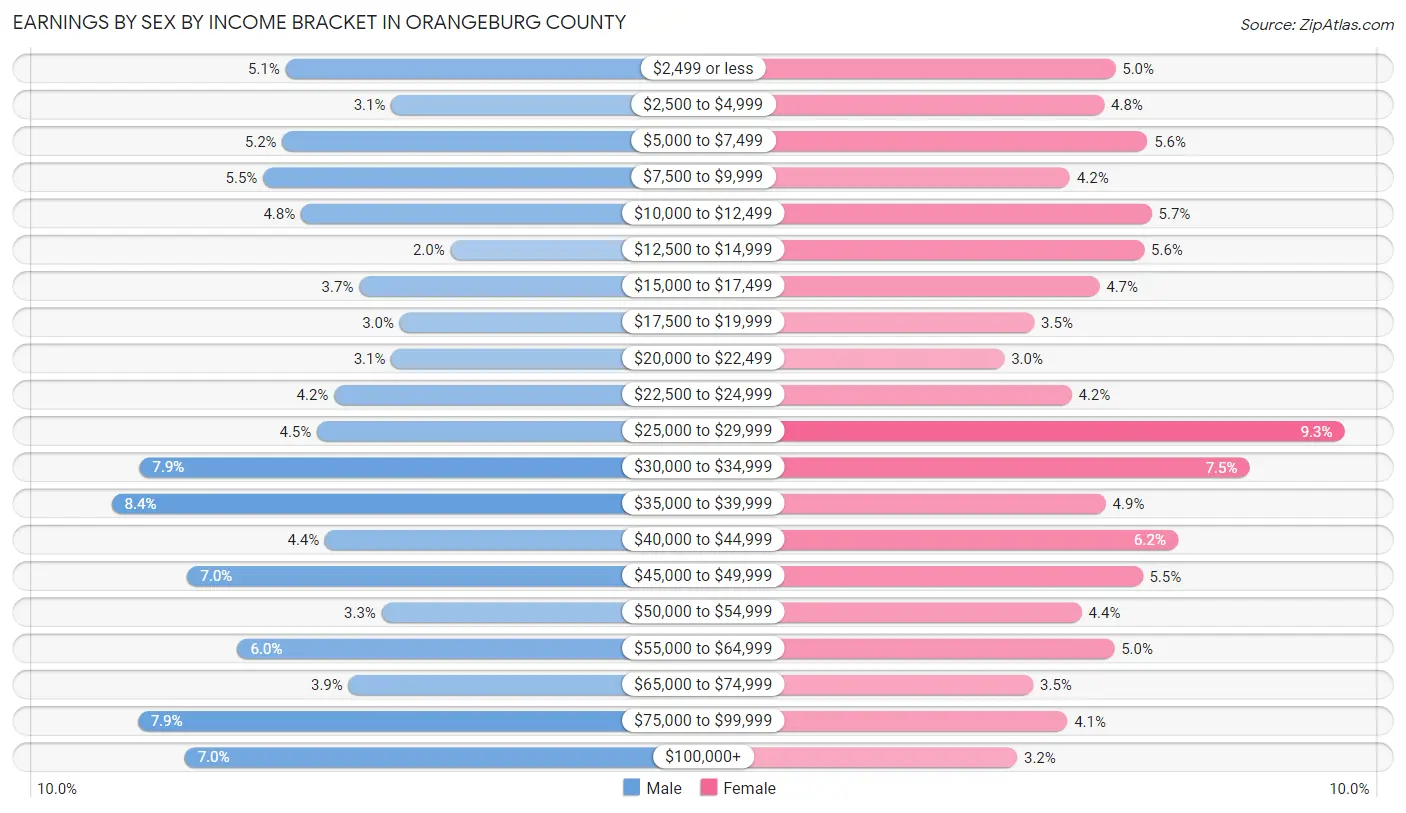
Earnings by Sex by Income Bracket in Orangeburg County
The most common earnings brackets in Orangeburg County are $35,000 to $39,999 for men (1,571 | 8.4%) and $25,000 to $29,999 for women (1,766 | 9.3%).
| Income | Male | Female |
| $2,499 or less | 959 (5.1%) | 953 (5.0%) |
| $2,500 to $4,999 | 587 (3.1%) | 913 (4.8%) |
| $5,000 to $7,499 | 971 (5.2%) | 1,066 (5.6%) |
| $7,500 to $9,999 | 1,039 (5.5%) | 791 (4.2%) |
| $10,000 to $12,499 | 904 (4.8%) | 1,082 (5.7%) |
| $12,500 to $14,999 | 380 (2.0%) | 1,054 (5.6%) |
| $15,000 to $17,499 | 701 (3.7%) | 896 (4.7%) |
| $17,500 to $19,999 | 557 (3.0%) | 664 (3.5%) |
| $20,000 to $22,499 | 588 (3.1%) | 558 (2.9%) |
| $22,500 to $24,999 | 788 (4.2%) | 797 (4.2%) |
| $25,000 to $29,999 | 848 (4.5%) | 1,766 (9.3%) |
| $30,000 to $34,999 | 1,474 (7.9%) | 1,428 (7.5%) |
| $35,000 to $39,999 | 1,571 (8.4%) | 919 (4.9%) |
| $40,000 to $44,999 | 821 (4.4%) | 1,174 (6.2%) |
| $45,000 to $49,999 | 1,304 (7.0%) | 1,049 (5.5%) |
| $50,000 to $54,999 | 622 (3.3%) | 833 (4.4%) |
| $55,000 to $64,999 | 1,128 (6.0%) | 949 (5.0%) |
| $65,000 to $74,999 | 738 (3.9%) | 661 (3.5%) |
| $75,000 to $99,999 | 1,479 (7.9%) | 782 (4.1%) |
| $100,000+ | 1,315 (7.0%) | 604 (3.2%) |
| Total | 18,774 (100.0%) | 18,939 (100.0%) |
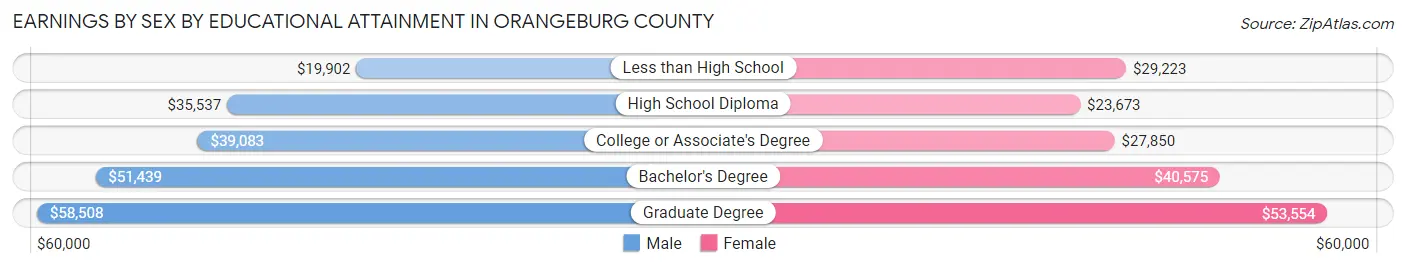
Earnings by Sex by Educational Attainment in Orangeburg County
Average earnings in Orangeburg County are $37,567 for men and $30,879 for women, a difference of 17.8%. Men with an educational attainment of graduate degree enjoy the highest average annual earnings of $58,508, while those with less than high school education earn the least with $19,902. Women with an educational attainment of graduate degree earn the most with the average annual earnings of $53,554, while those with high school diploma education have the smallest earnings of $23,673.
| Educational Attainment | Male Income | Female Income |
| Less than High School | $19,902 | $29,223 |
| High School Diploma | $35,537 | $23,673 |
| College or Associate's Degree | $39,083 | $27,850 |
| Bachelor's Degree | $51,439 | $40,575 |
| Graduate Degree | $58,508 | $53,554 |
| Total | $37,567 | $30,879 |
Family Income in Orangeburg County
Family Income Brackets in Orangeburg County
According to the Orangeburg County family income data, there are 3,370 families falling into the $50,000 to $74,999 income range, which is the most common income bracket and makes up 16.9% of all families. Conversely, the $200,000+ income bracket is the least frequent group with only 558 families (2.8%) belonging to this category.
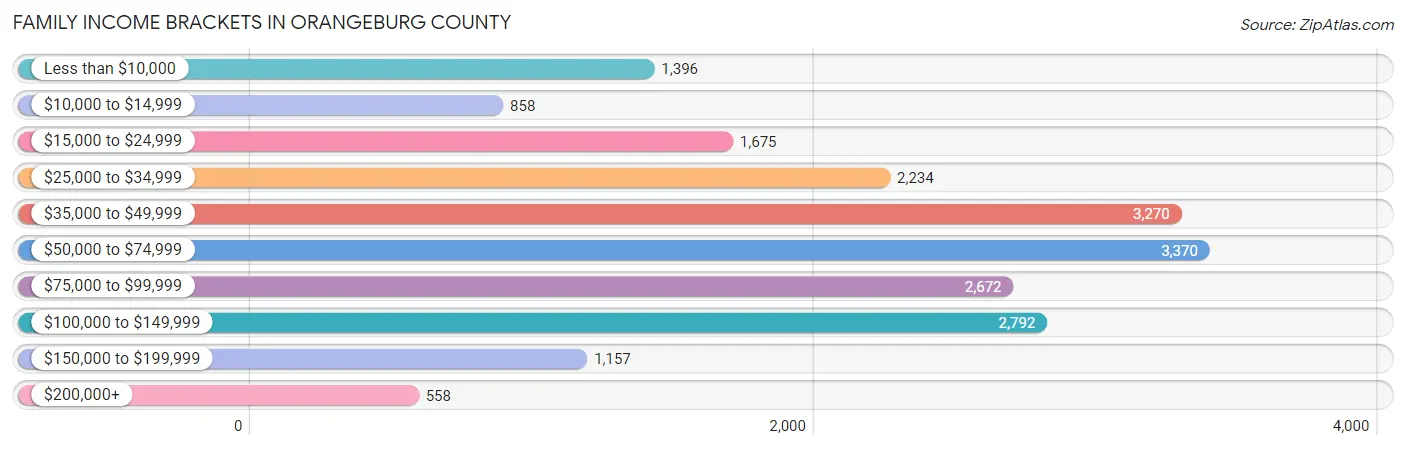
| Income Bracket | # Families | % Families |
| Less than $10,000 | 1,396 | 7.0% |
| $10,000 to $14,999 | 858 | 4.3% |
| $15,000 to $24,999 | 1,675 | 8.4% |
| $25,000 to $34,999 | 2,234 | 11.2% |
| $35,000 to $49,999 | 3,270 | 16.4% |
| $50,000 to $74,999 | 3,370 | 16.9% |
| $75,000 to $99,999 | 2,672 | 13.4% |
| $100,000 to $149,999 | 2,792 | 14.0% |
| $150,000 to $199,999 | 1,157 | 5.8% |
| $200,000+ | 558 | 2.8% |
Family Income by Famaliy Size in Orangeburg County
4-person families (2,560 | 12.8%) account for the highest median family income in Orangeburg County with $74,167 per family, while 2-person families (11,334 | 56.8%) have the highest median income of $23,464 per family member.
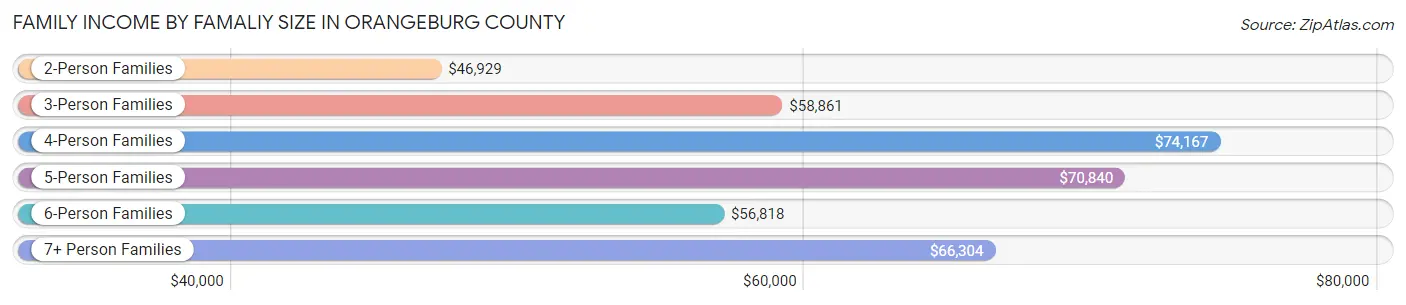
| Income Bracket | # Families | Median Income |
| 2-Person Families | 11,334 (56.8%) | $46,929 |
| 3-Person Families | 4,111 (20.6%) | $58,861 |
| 4-Person Families | 2,560 (12.8%) | $74,167 |
| 5-Person Families | 1,027 (5.1%) | $70,840 |
| 6-Person Families | 432 (2.2%) | $56,818 |
| 7+ Person Families | 478 (2.4%) | $66,304 |
| Total | 19,942 (100.0%) | $53,849 |
Family Income by Number of Earners in Orangeburg County
The median family income in Orangeburg County is $53,849, with families comprising 3+ earners (1,426) having the highest median family income of $120,299, while families with no earners (4,398) have the lowest median family income of $27,185, accounting for 7.1% and 22.1% of families, respectively.
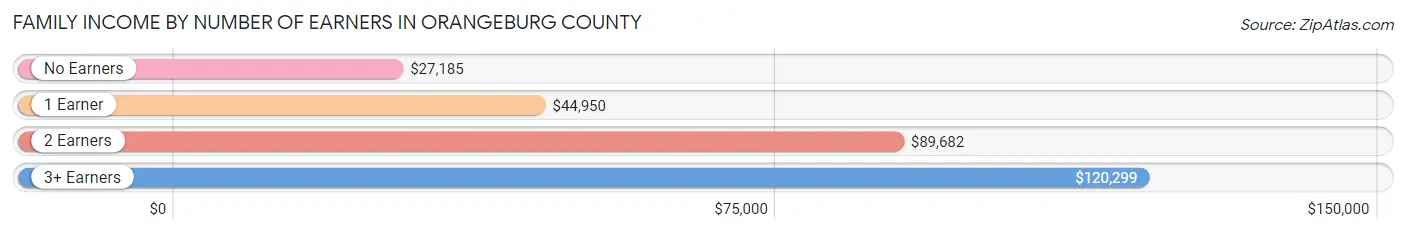
| Number of Earners | # Families | Median Income |
| No Earners | 4,398 (22.1%) | $27,185 |
| 1 Earner | 8,165 (40.9%) | $44,950 |
| 2 Earners | 5,953 (29.8%) | $89,682 |
| 3+ Earners | 1,426 (7.1%) | $120,299 |
| Total | 19,942 (100.0%) | $53,849 |
Household Income in Orangeburg County
Household Income Brackets in Orangeburg County
With 5,132 households falling in the category, the $35,000 to $49,999 income range is the most frequent in Orangeburg County, accounting for 15.7% of all households. In contrast, only 654 households (2.0%) fall into the $200,000+ income bracket, making it the least populous group.
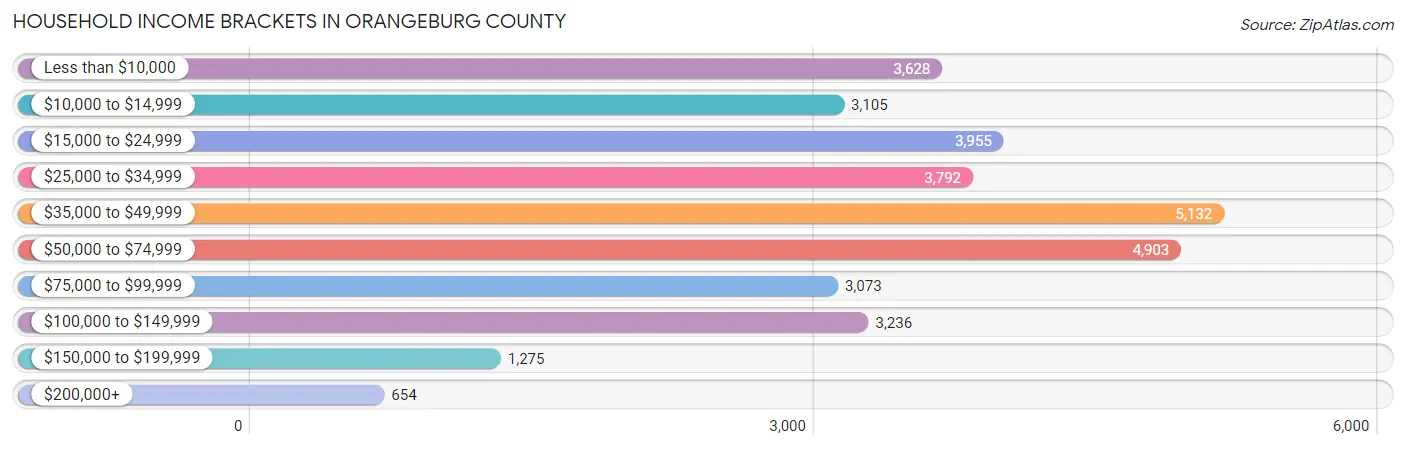
| Income Bracket | # Households | % Households |
| Less than $10,000 | 3,628 | 11.1% |
| $10,000 to $14,999 | 3,105 | 9.5% |
| $15,000 to $24,999 | 3,955 | 12.1% |
| $25,000 to $34,999 | 3,792 | 11.6% |
| $35,000 to $49,999 | 5,132 | 15.7% |
| $50,000 to $74,999 | 4,903 | 15.0% |
| $75,000 to $99,999 | 3,073 | 9.4% |
| $100,000 to $149,999 | 3,236 | 9.9% |
| $150,000 to $199,999 | 1,275 | 3.9% |
| $200,000+ | 654 | 2.0% |
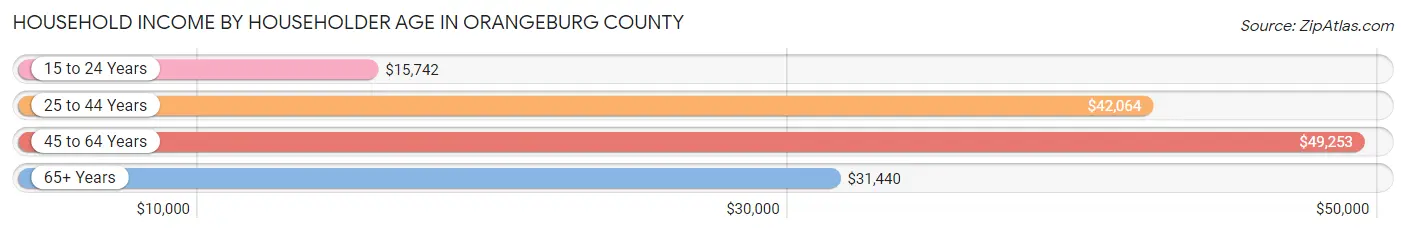
Household Income by Householder Age in Orangeburg County
The median household income in Orangeburg County is $41,020, with the highest median household income of $49,253 found in the 45 to 64 years age bracket for the primary householder. A total of 12,153 households (37.2%) fall into this category. Meanwhile, the 15 to 24 years age bracket for the primary householder has the lowest median household income of $15,742, with 731 households (2.2%) in this group.
| Income Bracket | # Households | Median Income |
| 15 to 24 Years | 731 (2.2%) | $15,742 |
| 25 to 44 Years | 8,383 (25.7%) | $42,064 |
| 45 to 64 Years | 12,153 (37.2%) | $49,253 |
| 65+ Years | 11,420 (34.9%) | $31,440 |
| Total | 32,687 (100.0%) | $41,020 |
Poverty in Orangeburg County
Income Below Poverty by Sex and Age in Orangeburg County
With 25.6% poverty level for males and 24.4% for females among the residents of Orangeburg County, 5 year old males and 5 year old females are the most vulnerable to poverty, with 141 males (46.8%) and 207 females (53.6%) in their respective age groups living below the poverty level.
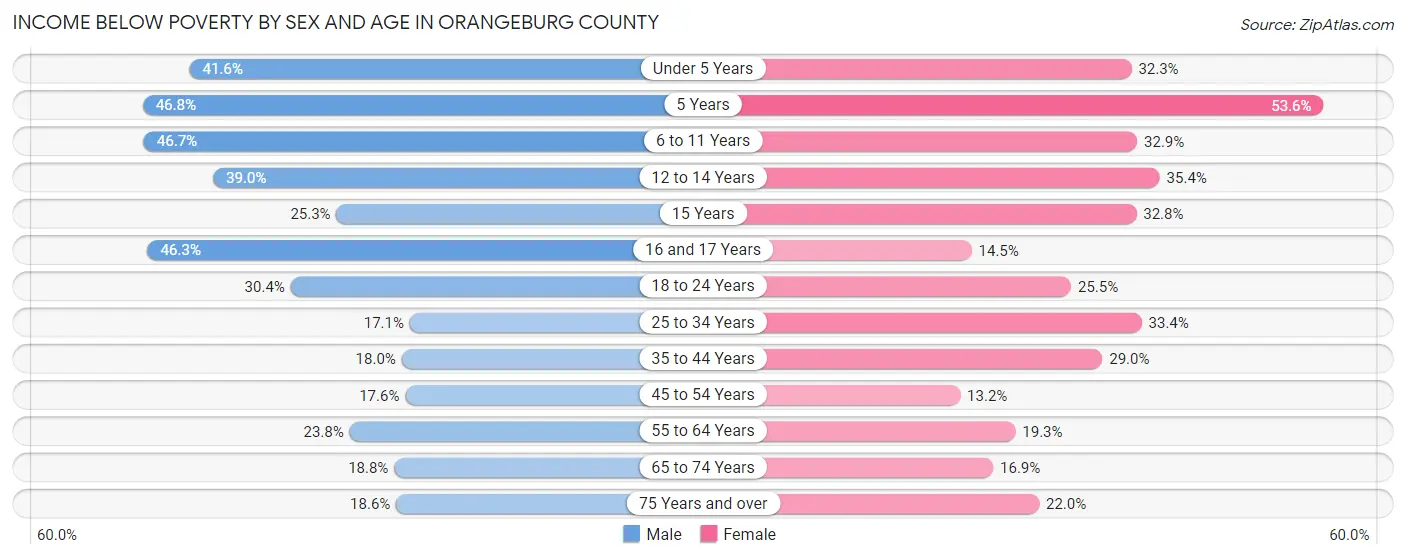
| Age Bracket | Male | Female |
| Under 5 Years | 925 (41.6%) | 693 (32.3%) |
| 5 Years | 141 (46.8%) | 207 (53.6%) |
| 6 to 11 Years | 1,383 (46.7%) | 1,085 (32.9%) |
| 12 to 14 Years | 809 (39.0%) | 515 (35.4%) |
| 15 Years | 190 (25.3%) | 224 (32.8%) |
| 16 and 17 Years | 383 (46.3%) | 129 (14.5%) |
| 18 to 24 Years | 991 (30.4%) | 923 (25.5%) |
| 25 to 34 Years | 768 (17.1%) | 1,701 (33.4%) |
| 35 to 44 Years | 719 (18.0%) | 1,357 (29.0%) |
| 45 to 54 Years | 771 (17.6%) | 663 (13.2%) |
| 55 to 64 Years | 1,294 (23.8%) | 1,215 (19.3%) |
| 65 to 74 Years | 862 (18.8%) | 917 (16.9%) |
| 75 Years and over | 511 (18.6%) | 848 (22.0%) |
| Total | 9,747 (25.6%) | 10,477 (24.4%) |
Income Above Poverty by Sex and Age in Orangeburg County
According to the poverty statistics in Orangeburg County, males aged 25 to 34 years and females aged 45 to 54 years are the age groups that are most secure financially, with 82.9% of males and 86.8% of females in these age groups living above the poverty line.
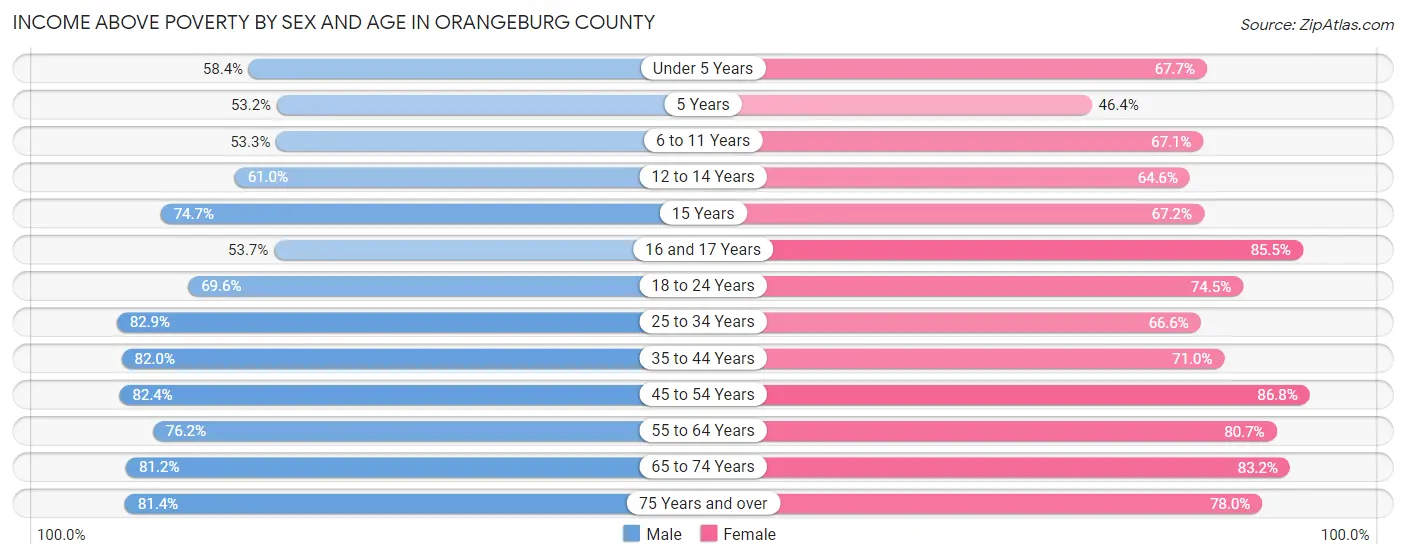
| Age Bracket | Male | Female |
| Under 5 Years | 1,297 (58.4%) | 1,455 (67.7%) |
| 5 Years | 160 (53.2%) | 179 (46.4%) |
| 6 to 11 Years | 1,578 (53.3%) | 2,214 (67.1%) |
| 12 to 14 Years | 1,265 (61.0%) | 940 (64.6%) |
| 15 Years | 562 (74.7%) | 459 (67.2%) |
| 16 and 17 Years | 444 (53.7%) | 763 (85.5%) |
| 18 to 24 Years | 2,272 (69.6%) | 2,692 (74.5%) |
| 25 to 34 Years | 3,722 (82.9%) | 3,393 (66.6%) |
| 35 to 44 Years | 3,273 (82.0%) | 3,320 (71.0%) |
| 45 to 54 Years | 3,607 (82.4%) | 4,368 (86.8%) |
| 55 to 64 Years | 4,141 (76.2%) | 5,071 (80.7%) |
| 65 to 74 Years | 3,714 (81.2%) | 4,524 (83.2%) |
| 75 Years and over | 2,234 (81.4%) | 3,011 (78.0%) |
| Total | 28,269 (74.4%) | 32,389 (75.6%) |
Income Below Poverty Among Married-Couple Families in Orangeburg County
The poverty statistics for married-couple families in Orangeburg County show that 7.4% or 857 of the total 11,640 families live below the poverty line. Families with 5 or more children have the highest poverty rate of 62.5%, comprising of 70 families. On the other hand, families with no children have the lowest poverty rate of 5.4%, which includes 464 families.
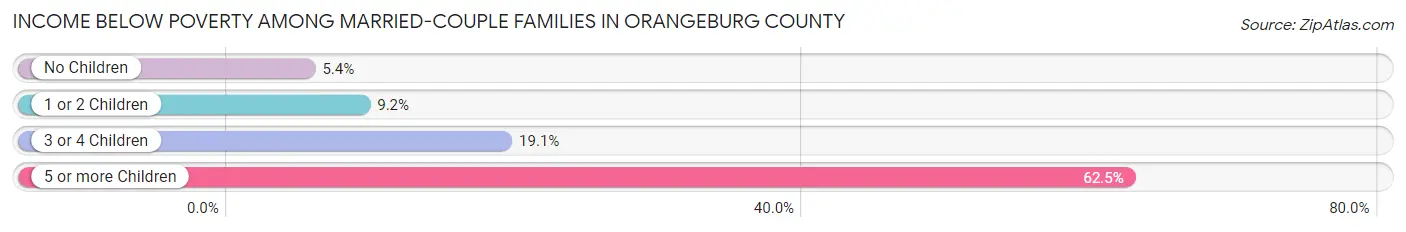
| Children | Above Poverty | Below Poverty |
| No Children | 8,147 (94.6%) | 464 (5.4%) |
| 1 or 2 Children | 2,149 (90.8%) | 218 (9.2%) |
| 3 or 4 Children | 445 (80.9%) | 105 (19.1%) |
| 5 or more Children | 42 (37.5%) | 70 (62.5%) |
| Total | 10,783 (92.6%) | 857 (7.4%) |
Income Below Poverty Among Single-Parent Households in Orangeburg County
According to the poverty data in Orangeburg County, 26.0% or 393 single-father households and 34.3% or 2,327 single-mother households are living below the poverty line. Among single-father households, those with 3 or 4 children have the highest poverty rate, with 20 households (40.8%) experiencing poverty. Likewise, among single-mother households, those with 5 or more children have the highest poverty rate, with 140 households (85.9%) falling below the poverty line.
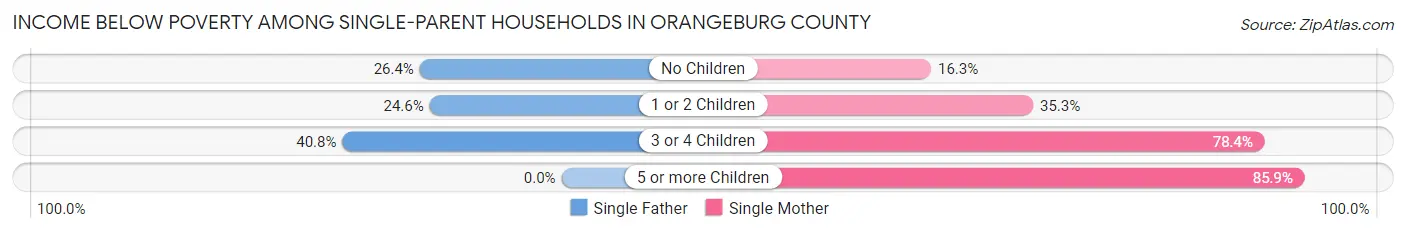
| Children | Single Father | Single Mother |
| No Children | 272 (26.4%) | 422 (16.3%) |
| 1 or 2 Children | 101 (24.6%) | 1,143 (35.3%) |
| 3 or 4 Children | 20 (40.8%) | 622 (78.4%) |
| 5 or more Children | 0 (0.0%) | 140 (85.9%) |
| Total | 393 (26.0%) | 2,327 (34.3%) |
Income Below Poverty Among Married-Couple vs Single-Parent Households in Orangeburg County
The poverty data for Orangeburg County shows that 857 of the married-couple family households (7.4%) and 2,720 of the single-parent households (32.8%) are living below the poverty level. Within the married-couple family households, those with 5 or more children have the highest poverty rate, with 70 households (62.5%) falling below the poverty line. Among the single-parent households, those with 3 or 4 children have the highest poverty rate, with 642 household (76.2%) living below poverty.
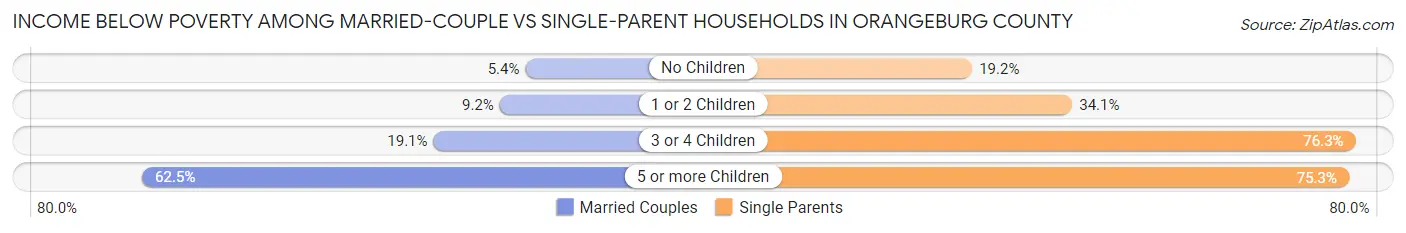
| Children | Married-Couple Families | Single-Parent Households |
| No Children | 464 (5.4%) | 694 (19.2%) |
| 1 or 2 Children | 218 (9.2%) | 1,244 (34.1%) |
| 3 or 4 Children | 105 (19.1%) | 642 (76.2%) |
| 5 or more Children | 70 (62.5%) | 140 (75.3%) |
| Total | 857 (7.4%) | 2,720 (32.8%) |
Race in Orangeburg County
The most populous races in Orangeburg County are Black / African American (51,746 | 61.5%), White / Caucasian (29,059 | 34.5%), and Hispanic or Latino (2,078 | 2.5%).
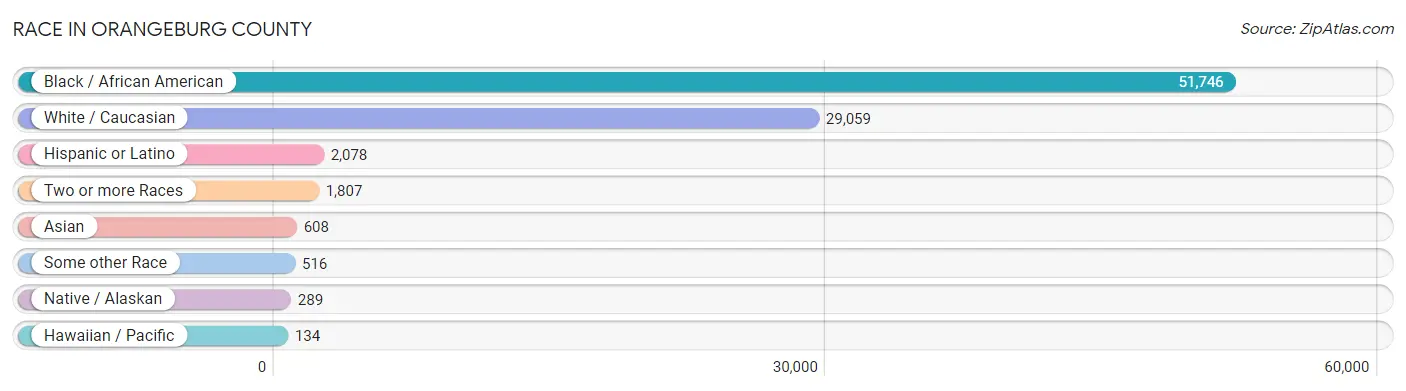
| Race | # Population | % Population |
| Asian | 608 | 0.7% |
| Black / African American | 51,746 | 61.5% |
| Hawaiian / Pacific | 134 | 0.2% |
| Hispanic or Latino | 2,078 | 2.5% |
| Native / Alaskan | 289 | 0.3% |
| White / Caucasian | 29,059 | 34.5% |
| Two or more Races | 1,807 | 2.1% |
| Some other Race | 516 | 0.6% |
| Total | 84,159 | 100.0% |
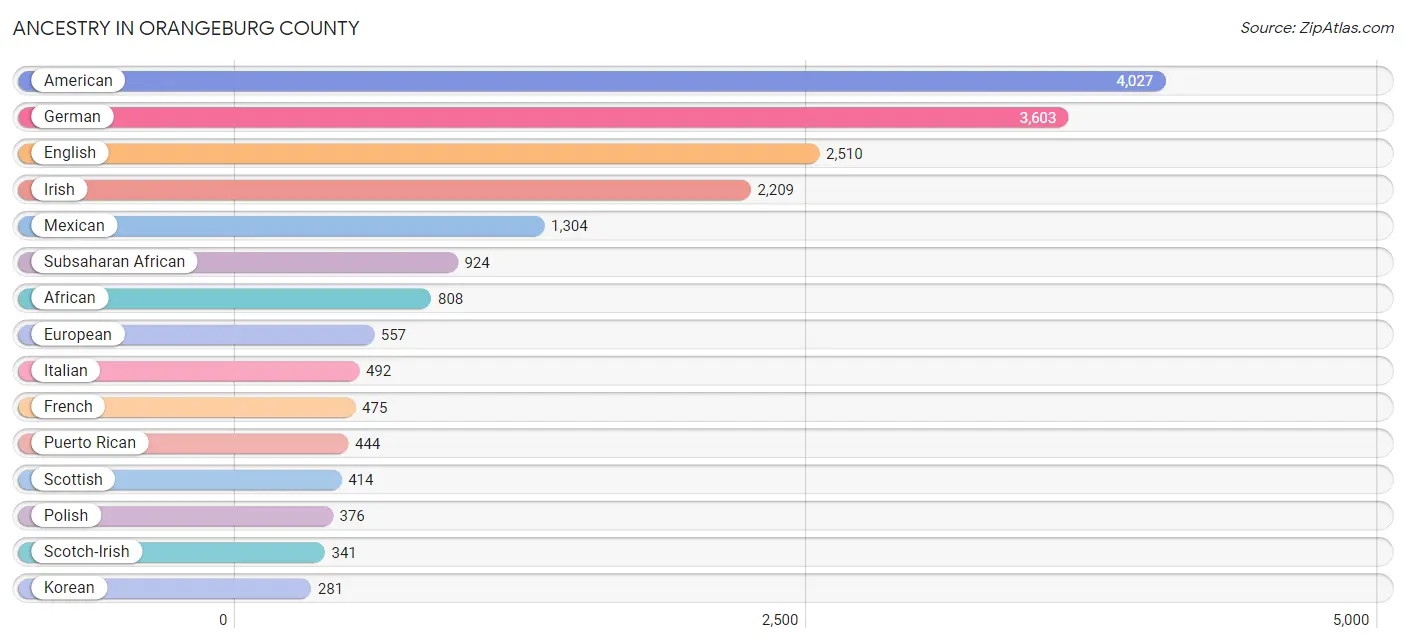
Ancestry in Orangeburg County
The most populous ancestries reported in Orangeburg County are American (4,027 | 4.8%), German (3,603 | 4.3%), English (2,510 | 3.0%), Irish (2,209 | 2.6%), and Mexican (1,304 | 1.5%), together accounting for 16.2% of all Orangeburg County residents.
| Ancestry | # Population | % Population |
| African | 808 | 1.0% |
| American | 4,027 | 4.8% |
| Apache | 21 | 0.0% |
| Arab | 266 | 0.3% |
| Armenian | 16 | 0.0% |
| Australian | 1 | 0.0% |
| Austrian | 50 | 0.1% |
| Barbadian | 21 | 0.0% |
| Belgian | 9 | 0.0% |
| Blackfeet | 8 | 0.0% |
| British | 185 | 0.2% |
| Burmese | 71 | 0.1% |
| Canadian | 1 | 0.0% |
| Carpatho Rusyn | 7 | 0.0% |
| Central American | 131 | 0.2% |
| Cherokee | 184 | 0.2% |
| Cheyenne | 7 | 0.0% |
| Chippewa | 6 | 0.0% |
| Choctaw | 8 | 0.0% |
| Colombian | 7 | 0.0% |
| Creek | 32 | 0.0% |
| Cuban | 75 | 0.1% |
| Czech | 27 | 0.0% |
| Danish | 27 | 0.0% |
| Delaware | 6 | 0.0% |
| Dominican | 52 | 0.1% |
| Dutch | 81 | 0.1% |
| Eastern European | 18 | 0.0% |
| Egyptian | 33 | 0.0% |
| English | 2,510 | 3.0% |
| European | 557 | 0.7% |
| French | 475 | 0.6% |
| French Canadian | 85 | 0.1% |
| German | 3,603 | 4.3% |
| Ghanaian | 25 | 0.0% |
| Greek | 27 | 0.0% |
| Guamanian / Chamorro | 11 | 0.0% |
| Haitian | 14 | 0.0% |
| Honduran | 95 | 0.1% |
| Hungarian | 24 | 0.0% |
| Indian (Asian) | 113 | 0.1% |
| Irish | 2,209 | 2.6% |
| Israeli | 24 | 0.0% |
| Italian | 492 | 0.6% |
| Jamaican | 25 | 0.0% |
| Japanese | 7 | 0.0% |
| Korean | 281 | 0.3% |
| Laotian | 12 | 0.0% |
| Latvian | 7 | 0.0% |
| Lebanese | 6 | 0.0% |
| Lithuanian | 16 | 0.0% |
| Lumbee | 4 | 0.0% |
| Macedonian | 11 | 0.0% |
| Mexican | 1,304 | 1.5% |
| Moroccan | 159 | 0.2% |
| Nigerian | 60 | 0.1% |
| Northern European | 21 | 0.0% |
| Norwegian | 87 | 0.1% |
| Palestinian | 8 | 0.0% |
| Panamanian | 30 | 0.0% |
| Pennsylvania German | 20 | 0.0% |
| Polish | 376 | 0.4% |
| Puerto Rican | 444 | 0.5% |
| Romanian | 4 | 0.0% |
| Russian | 88 | 0.1% |
| Salvadoran | 6 | 0.0% |
| Scandinavian | 42 | 0.1% |
| Scotch-Irish | 341 | 0.4% |
| Scottish | 414 | 0.5% |
| Senegalese | 31 | 0.0% |
| Serbian | 8 | 0.0% |
| Sioux | 165 | 0.2% |
| Slavic | 6 | 0.0% |
| Slovak | 39 | 0.1% |
| South American | 19 | 0.0% |
| Spaniard | 40 | 0.1% |
| Sri Lankan | 237 | 0.3% |
| Subsaharan African | 924 | 1.1% |
| Swedish | 105 | 0.1% |
| Swiss | 133 | 0.2% |
| Syrian | 60 | 0.1% |
| Thai | 123 | 0.2% |
| Trinidadian and Tobagonian | 2 | 0.0% |
| Ukrainian | 28 | 0.0% |
| Venezuelan | 12 | 0.0% |
| Welsh | 43 | 0.1% |
| West Indian | 94 | 0.1% | View All 87 Rows |
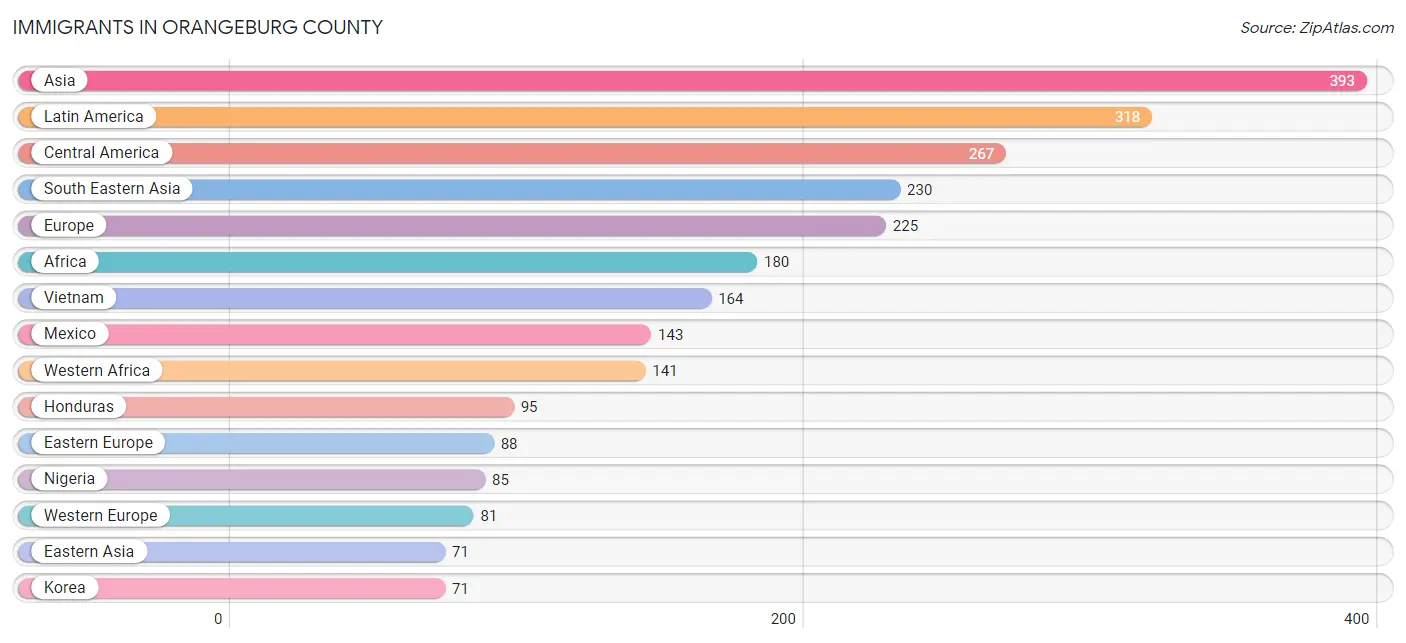
Immigrants in Orangeburg County
The most numerous immigrant groups reported in Orangeburg County came from Asia (393 | 0.5%), Latin America (318 | 0.4%), Central America (267 | 0.3%), South Eastern Asia (230 | 0.3%), and Europe (225 | 0.3%), together accounting for 1.7% of all Orangeburg County residents.
| Immigration Origin | # Population | % Population |
| Africa | 180 | 0.2% |
| Asia | 393 | 0.5% |
| Austria | 25 | 0.0% |
| Bahamas | 19 | 0.0% |
| Canada | 26 | 0.0% |
| Caribbean | 32 | 0.0% |
| Central America | 267 | 0.3% |
| Colombia | 7 | 0.0% |
| Cuba | 5 | 0.0% |
| Eastern Africa | 13 | 0.0% |
| Eastern Asia | 71 | 0.1% |
| Eastern Europe | 88 | 0.1% |
| Egypt | 26 | 0.0% |
| El Salvador | 14 | 0.0% |
| England | 11 | 0.0% |
| Europe | 225 | 0.3% |
| France | 13 | 0.0% |
| Germany | 43 | 0.1% |
| Ghana | 25 | 0.0% |
| Honduras | 95 | 0.1% |
| Hungary | 8 | 0.0% |
| India | 49 | 0.1% |
| Indonesia | 6 | 0.0% |
| Ireland | 1 | 0.0% |
| Italy | 1 | 0.0% |
| Jamaica | 8 | 0.0% |
| Korea | 71 | 0.1% |
| Latin America | 318 | 0.4% |
| Mexico | 143 | 0.2% |
| Nigeria | 85 | 0.1% |
| North Macedonia | 11 | 0.0% |
| Northern Africa | 26 | 0.0% |
| Northern Europe | 34 | 0.0% |
| Pakistan | 15 | 0.0% |
| Panama | 15 | 0.0% |
| Philippines | 53 | 0.1% |
| Romania | 33 | 0.0% |
| Russia | 21 | 0.0% |
| Senegal | 31 | 0.0% |
| South America | 19 | 0.0% |
| South Central Asia | 64 | 0.1% |
| South Eastern Asia | 230 | 0.3% |
| Southern Europe | 22 | 0.0% |
| Spain | 21 | 0.0% |
| Syria | 14 | 0.0% |
| Thailand | 7 | 0.0% |
| Turkey | 14 | 0.0% |
| Ukraine | 11 | 0.0% |
| Venezuela | 12 | 0.0% |
| Vietnam | 164 | 0.2% |
| Western Africa | 141 | 0.2% |
| Western Asia | 28 | 0.0% |
| Western Europe | 81 | 0.1% | View All 53 Rows |
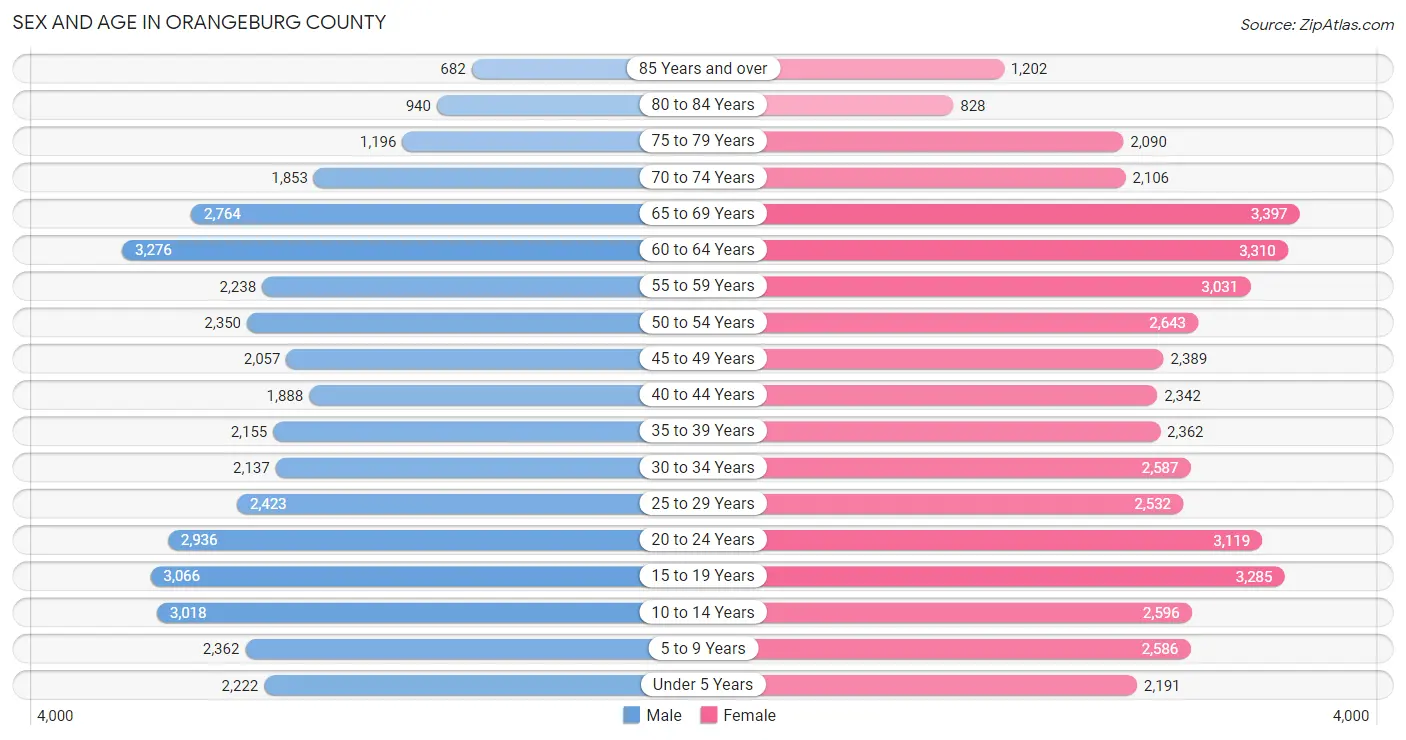
Sex and Age in Orangeburg County
Sex and Age in Orangeburg County
The most populous age groups in Orangeburg County are 60 to 64 Years (3,276 | 8.3%) for men and 65 to 69 Years (3,397 | 7.6%) for women.
| Age Bracket | Male | Female |
| Under 5 Years | 2,222 (5.6%) | 2,191 (4.9%) |
| 5 to 9 Years | 2,362 (6.0%) | 2,586 (5.8%) |
| 10 to 14 Years | 3,018 (7.6%) | 2,596 (5.8%) |
| 15 to 19 Years | 3,066 (7.7%) | 3,285 (7.4%) |
| 20 to 24 Years | 2,936 (7.4%) | 3,119 (7.0%) |
| 25 to 29 Years | 2,423 (6.1%) | 2,532 (5.7%) |
| 30 to 34 Years | 2,137 (5.4%) | 2,587 (5.8%) |
| 35 to 39 Years | 2,155 (5.4%) | 2,362 (5.3%) |
| 40 to 44 Years | 1,888 (4.8%) | 2,342 (5.2%) |
| 45 to 49 Years | 2,057 (5.2%) | 2,389 (5.4%) |
| 50 to 54 Years | 2,350 (5.9%) | 2,643 (5.9%) |
| 55 to 59 Years | 2,238 (5.7%) | 3,031 (6.8%) |
| 60 to 64 Years | 3,276 (8.3%) | 3,310 (7.4%) |
| 65 to 69 Years | 2,764 (7.0%) | 3,397 (7.6%) |
| 70 to 74 Years | 1,853 (4.7%) | 2,106 (4.7%) |
| 75 to 79 Years | 1,196 (3.0%) | 2,090 (4.7%) |
| 80 to 84 Years | 940 (2.4%) | 828 (1.9%) |
| 85 Years and over | 682 (1.7%) | 1,202 (2.7%) |
| Total | 39,563 (100.0%) | 44,596 (100.0%) |
Families and Households in Orangeburg County
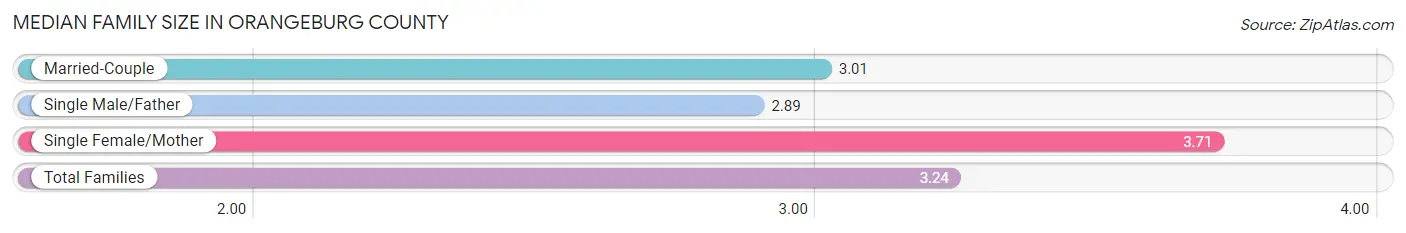
Median Family Size in Orangeburg County
The median family size in Orangeburg County is 3.24 persons per family, with single female/mother families (6,789 | 34.0%) accounting for the largest median family size of 3.71 persons per family. On the other hand, single male/father families (1,513 | 7.6%) represent the smallest median family size with 2.89 persons per family.
| Family Type | # Families | Family Size |
| Married-Couple | 11,640 (58.4%) | 3.01 |
| Single Male/Father | 1,513 (7.6%) | 2.89 |
| Single Female/Mother | 6,789 (34.0%) | 3.71 |
| Total Families | 19,942 (100.0%) | 3.24 |
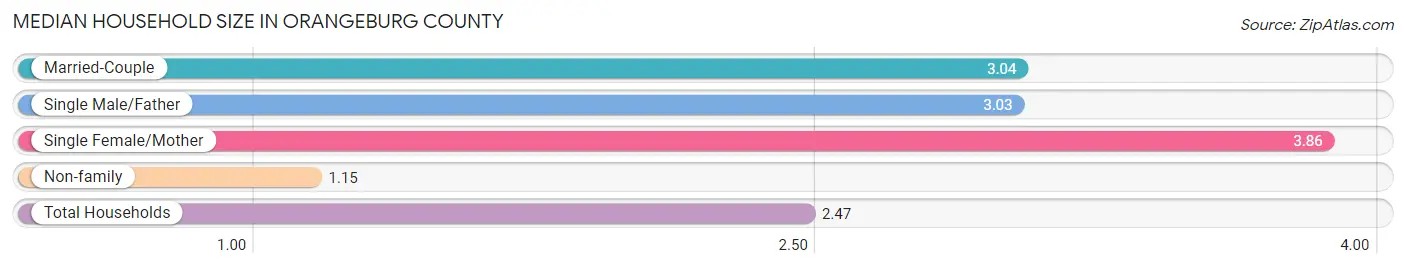
Median Household Size in Orangeburg County
The median household size in Orangeburg County is 2.47 persons per household, with single female/mother households (6,789 | 20.8%) accounting for the largest median household size of 3.86 persons per household. non-family households (12,745 | 39.0%) represent the smallest median household size with 1.15 persons per household.
| Household Type | # Households | Household Size |
| Married-Couple | 11,640 (35.6%) | 3.04 |
| Single Male/Father | 1,513 (4.6%) | 3.03 |
| Single Female/Mother | 6,789 (20.8%) | 3.86 |
| Non-family | 12,745 (39.0%) | 1.15 |
| Total Households | 32,687 (100.0%) | 2.47 |
Household Size by Marriage Status in Orangeburg County
Out of a total of 32,687 households in Orangeburg County, 19,942 (61.0%) are family households, while 12,745 (39.0%) are nonfamily households. The most numerous type of family households are 2-person households, comprising 10,769, and the most common type of nonfamily households are 1-person households, comprising 11,609.
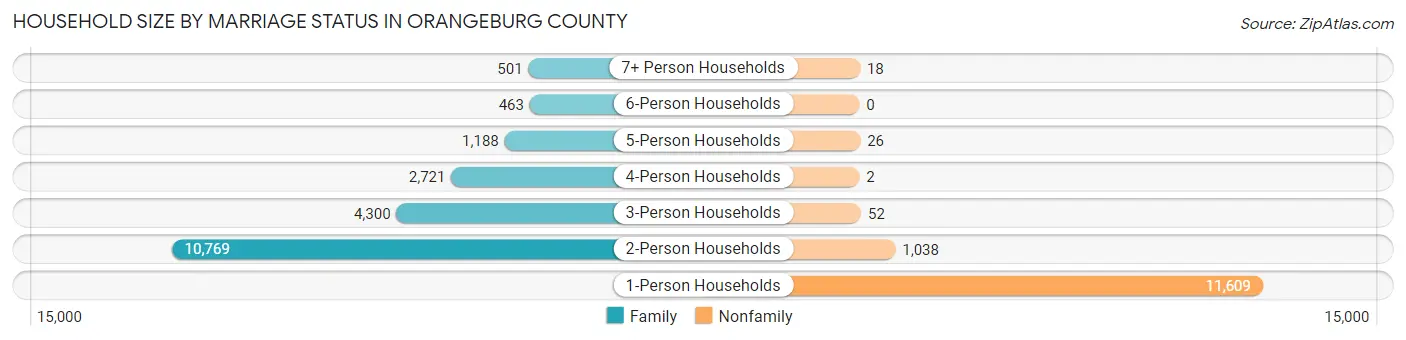
| Household Size | Family Households | Nonfamily Households |
| 1-Person Households | - | 11,609 (35.5%) |
| 2-Person Households | 10,769 (33.0%) | 1,038 (3.2%) |
| 3-Person Households | 4,300 (13.2%) | 52 (0.2%) |
| 4-Person Households | 2,721 (8.3%) | 2 (0.0%) |
| 5-Person Households | 1,188 (3.6%) | 26 (0.1%) |
| 6-Person Households | 463 (1.4%) | 0 (0.0%) |
| 7+ Person Households | 501 (1.5%) | 18 (0.1%) |
| Total | 19,942 (61.0%) | 12,745 (39.0%) |
Female Fertility in Orangeburg County
Fertility by Age in Orangeburg County
Average fertility rate in Orangeburg County is 44.0 births per 1,000 women. Women in the age bracket of 20 to 34 years have the highest fertility rate with 72.0 births per 1,000 women. Women in the age bracket of 20 to 34 years acount for 69.4% of all women with births.
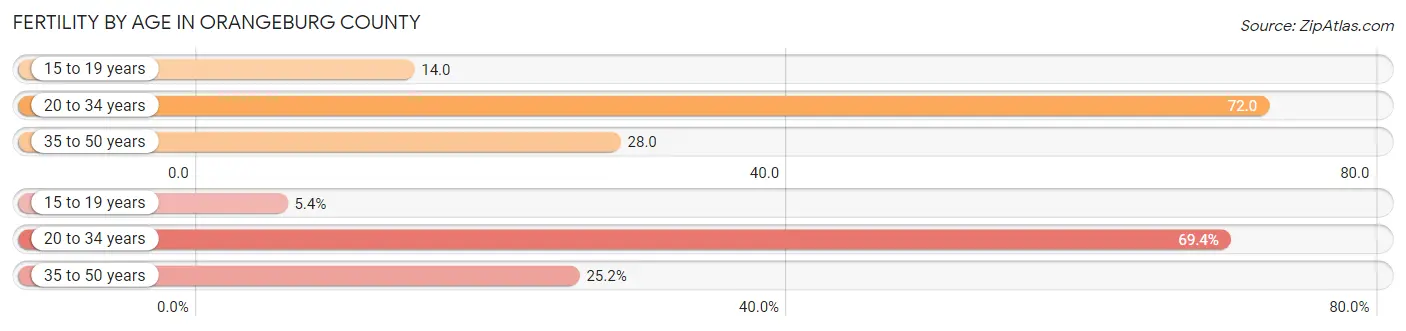
| Age Bracket | Women with Births | Births / 1,000 Women |
| 15 to 19 years | 46 (5.4%) | 14.0 |
| 20 to 34 years | 592 (69.4%) | 72.0 |
| 35 to 50 years | 215 (25.2%) | 28.0 |
| Total | 853 (100.0%) | 44.0 |
Fertility by Age by Marriage Status in Orangeburg County
33.4% of women with births (853) in Orangeburg County are married. The highest percentage of unmarried women with births falls into 15 to 19 years age bracket with 100.0% of them unmarried at the time of birth, while the lowest percentage of unmarried women with births belong to 20 to 34 years age bracket with 62.8% of them unmarried.
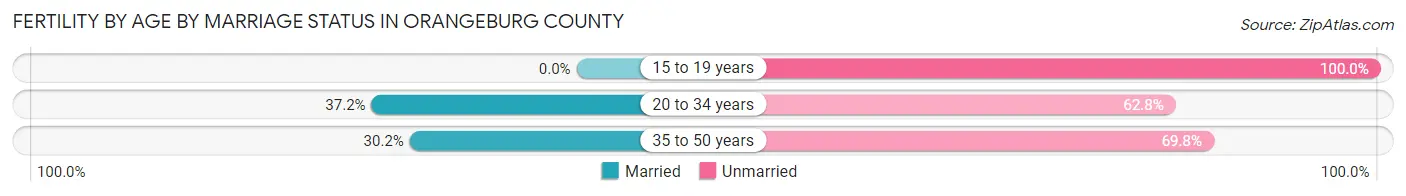
| Age Bracket | Married | Unmarried |
| 15 to 19 years | 0 (0.0%) | 46 (100.0%) |
| 20 to 34 years | 220 (37.2%) | 372 (62.8%) |
| 35 to 50 years | 65 (30.2%) | 150 (69.8%) |
| Total | 285 (33.4%) | 568 (66.6%) |
Fertility by Education in Orangeburg County
Average fertility rate in Orangeburg County is 44.0 births per 1,000 women. Women with the education attainment of graduate degree have the highest fertility rate of 66.0 births per 1,000 women, while women with the education attainment of less than high school have the lowest fertility at 17.0 births per 1,000 women. Women with the education attainment of college or associate's degree represent 44.6% of all women with births.
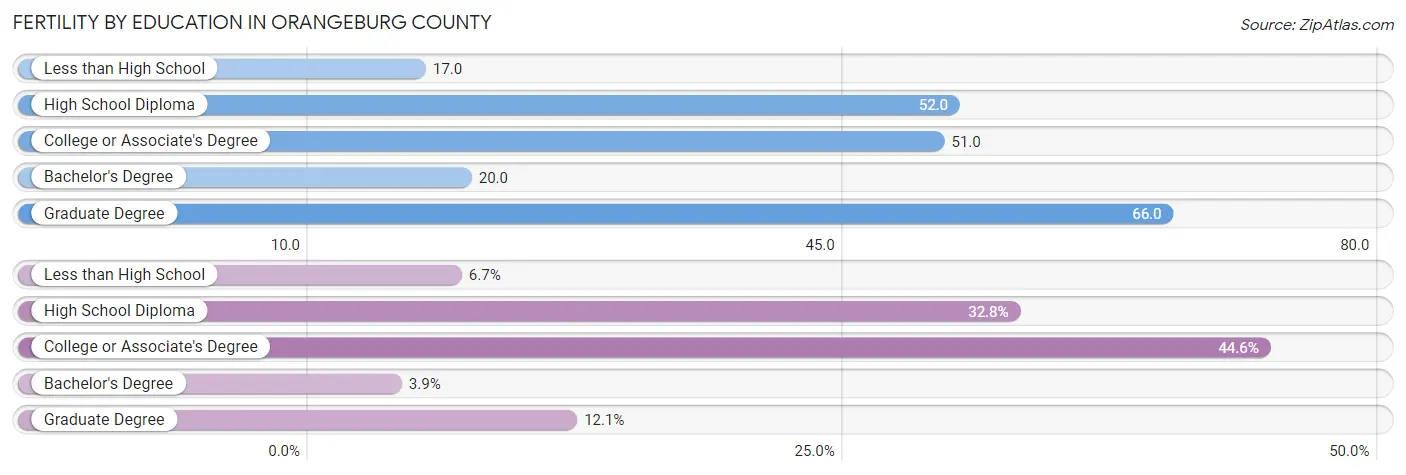
| Educational Attainment | Women with Births | Births / 1,000 Women |
| Less than High School | 57 (6.7%) | 17.0 |
| High School Diploma | 280 (32.8%) | 52.0 |
| College or Associate's Degree | 380 (44.6%) | 51.0 |
| Bachelor's Degree | 33 (3.9%) | 20.0 |
| Graduate Degree | 103 (12.1%) | 66.0 |
| Total | 853 (100.0%) | 44.0 |
Fertility by Education by Marriage Status in Orangeburg County
66.6% of women with births in Orangeburg County are unmarried. Women with the educational attainment of bachelor's degree are most likely to be married with 100.0% of them married at childbirth, while women with the educational attainment of less than high school are least likely to be married with 96.5% of them unmarried at childbirth.
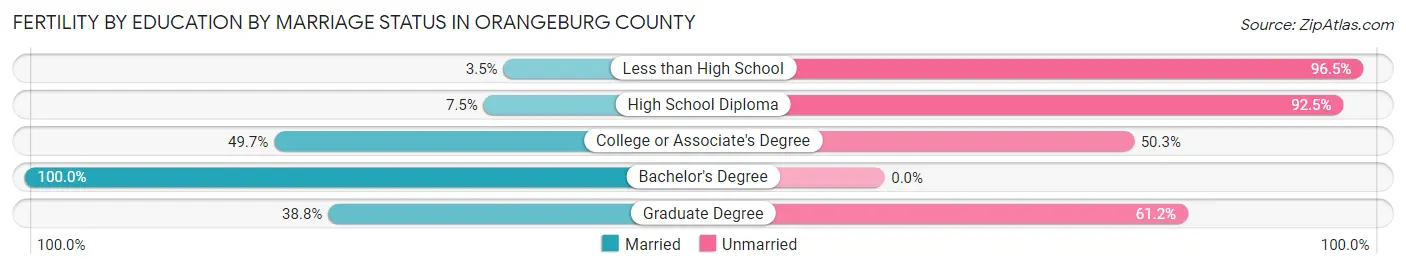
| Educational Attainment | Married | Unmarried |
| Less than High School | 2 (3.5%) | 55 (96.5%) |
| High School Diploma | 21 (7.5%) | 259 (92.5%) |
| College or Associate's Degree | 189 (49.7%) | 191 (50.3%) |
| Bachelor's Degree | 33 (100.0%) | 0 (0.0%) |
| Graduate Degree | 40 (38.8%) | 63 (61.2%) |
| Total | 285 (33.4%) | 568 (66.6%) |
Employment Characteristics in Orangeburg County
Employment by Class of Employer in Orangeburg County
Among the 31,563 employed individuals in Orangeburg County, private company employees (21,306 | 67.5%), state government employees (3,628 | 11.5%), and self-employed (not incorporated) (2,061 | 6.5%) make up the most common classes of employment.
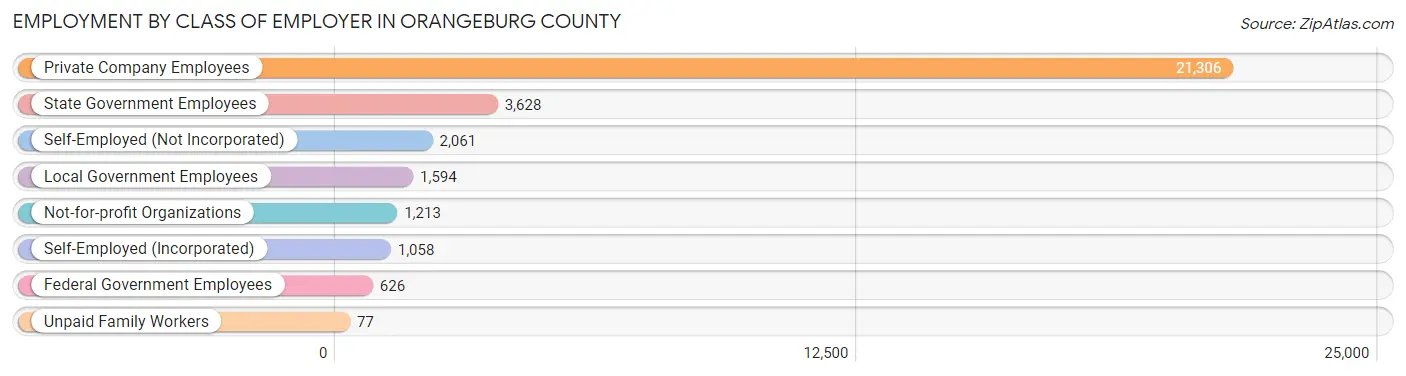
| Employer Class | # Employees | % Employees |
| Private Company Employees | 21,306 | 67.5% |
| Self-Employed (Incorporated) | 1,058 | 3.4% |
| Self-Employed (Not Incorporated) | 2,061 | 6.5% |
| Not-for-profit Organizations | 1,213 | 3.8% |
| Local Government Employees | 1,594 | 5.1% |
| State Government Employees | 3,628 | 11.5% |
| Federal Government Employees | 626 | 2.0% |
| Unpaid Family Workers | 77 | 0.2% |
| Total | 31,563 | 100.0% |
Employment Status by Age in Orangeburg County
According to the labor force statistics for Orangeburg County, out of the total population over 16 years of age (67,747), 53.0% or 35,906 individuals are in the labor force, with 9.2% or 3,303 of them unemployed. The age group with the highest labor force participation rate is 25 to 29 years, with 79.0% or 3,914 individuals in the labor force. Within the labor force, the 20 to 24 years age range has the highest percentage of unemployed individuals, with 13.6% or 513 of them being unemployed.
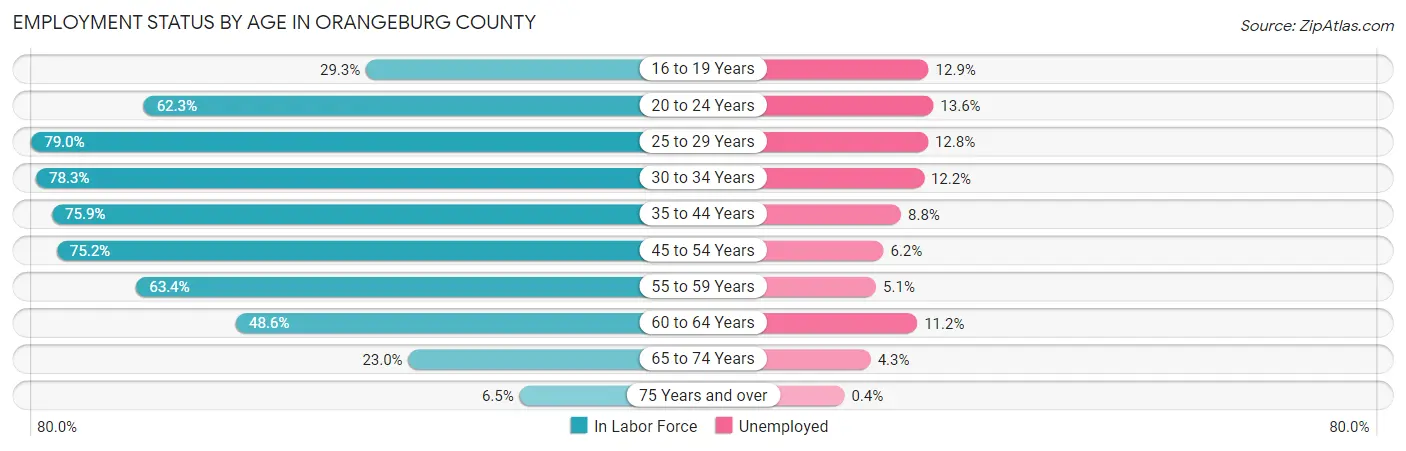
| Age Bracket | In Labor Force | Unemployed |
| 16 to 19 Years | 1,440 (29.3%) | 186 (12.9%) |
| 20 to 24 Years | 3,772 (62.3%) | 513 (13.6%) |
| 25 to 29 Years | 3,914 (79.0%) | 501 (12.8%) |
| 30 to 34 Years | 3,699 (78.3%) | 451 (12.2%) |
| 35 to 44 Years | 6,639 (75.9%) | 584 (8.8%) |
| 45 to 54 Years | 7,098 (75.2%) | 440 (6.2%) |
| 55 to 59 Years | 3,341 (63.4%) | 170 (5.1%) |
| 60 to 64 Years | 3,201 (48.6%) | 359 (11.2%) |
| 65 to 74 Years | 2,328 (23.0%) | 100 (4.3%) |
| 75 Years and over | 451 (6.5%) | 2 (0.4%) |
| Total | 35,906 (53.0%) | 3,303 (9.2%) |
Employment Status by Educational Attainment in Orangeburg County
According to labor force statistics for Orangeburg County, 70.2% of individuals (27,883) out of the total population between 25 and 64 years of age (39,720) are in the labor force, with 9.0% or 2,509 of them being unemployed. The group with the highest labor force participation rate are those with the educational attainment of bachelor's degree or higher, with 82.0% or 6,255 individuals in the labor force. Within the labor force, individuals with less than high school education have the highest percentage of unemployment, with 22.1% or 533 of them being unemployed.
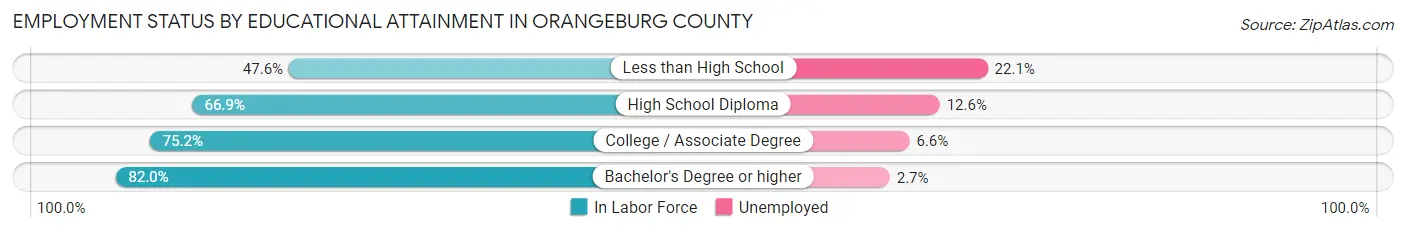
| Educational Attainment | In Labor Force | Unemployed |
| Less than High School | 2,413 (47.6%) | 1,120 (22.1%) |
| High School Diploma | 8,964 (66.9%) | 1,688 (12.6%) |
| College / Associate Degree | 10,245 (75.2%) | 899 (6.6%) |
| Bachelor's Degree or higher | 6,255 (82.0%) | 206 (2.7%) |
| Total | 27,883 (70.2%) | 3,575 (9.0%) |
Employment Occupations by Sex in Orangeburg County
Management, Business, Science and Arts Occupations
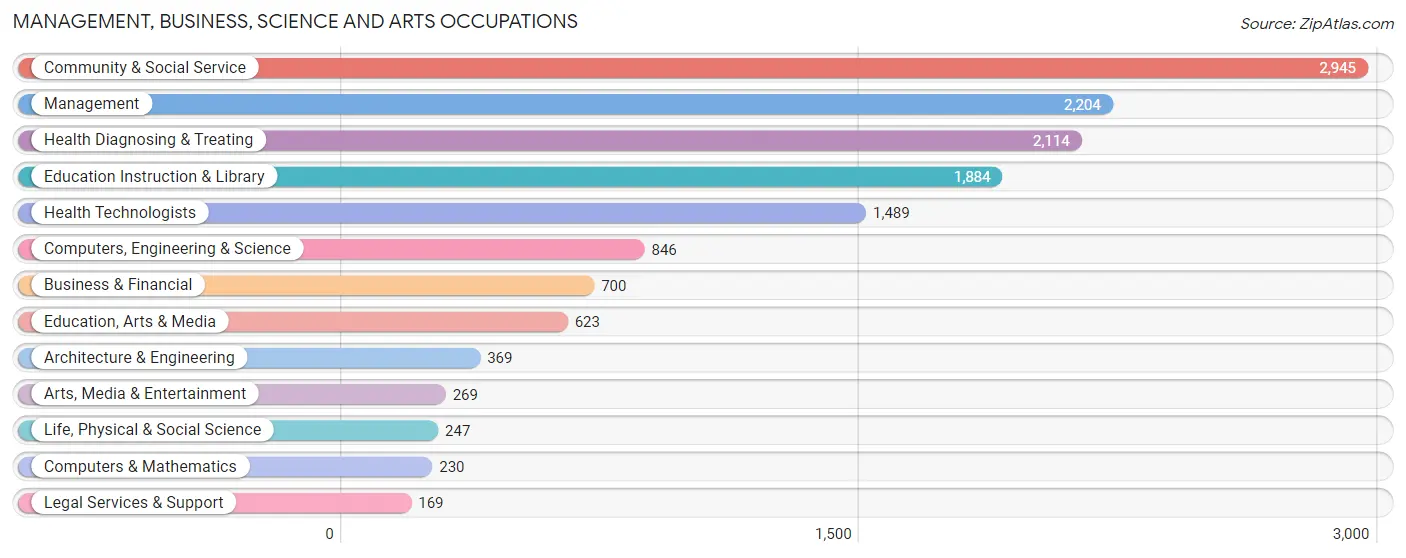
The most common Management, Business, Science and Arts occupations in Orangeburg County are Community & Social Service (2,945 | 9.0%), Management (2,204 | 6.8%), Health Diagnosing & Treating (2,114 | 6.5%), Education Instruction & Library (1,884 | 5.8%), and Health Technologists (1,489 | 4.6%).
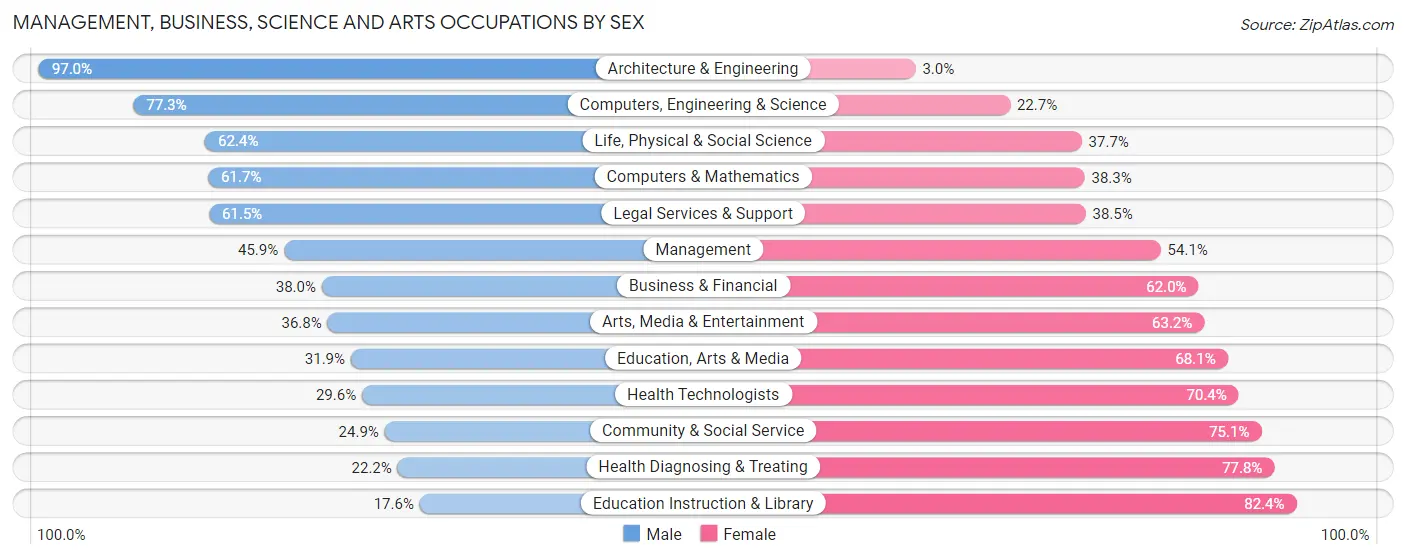
Management, Business, Science and Arts Occupations by Sex
Within the Management, Business, Science and Arts occupations in Orangeburg County, the most male-oriented occupations are Architecture & Engineering (97.0%), Computers, Engineering & Science (77.3%), and Life, Physical & Social Science (62.4%), while the most female-oriented occupations are Education Instruction & Library (82.4%), Health Diagnosing & Treating (77.8%), and Community & Social Service (75.1%).
| Occupation | Male | Female |
| Management | 1,011 (45.9%) | 1,193 (54.1%) |
| Business & Financial | 266 (38.0%) | 434 (62.0%) |
| Computers, Engineering & Science | 654 (77.3%) | 192 (22.7%) |
| Computers & Mathematics | 142 (61.7%) | 88 (38.3%) |
| Architecture & Engineering | 358 (97.0%) | 11 (3.0%) |
| Life, Physical & Social Science | 154 (62.4%) | 93 (37.7%) |
| Community & Social Service | 733 (24.9%) | 2,212 (75.1%) |
| Education, Arts & Media | 199 (31.9%) | 424 (68.1%) |
| Legal Services & Support | 104 (61.5%) | 65 (38.5%) |
| Education Instruction & Library | 331 (17.6%) | 1,553 (82.4%) |
| Arts, Media & Entertainment | 99 (36.8%) | 170 (63.2%) |
| Health Diagnosing & Treating | 469 (22.2%) | 1,645 (77.8%) |
| Health Technologists | 441 (29.6%) | 1,048 (70.4%) |
| Total (Category) | 3,133 (35.6%) | 5,676 (64.4%) |
| Total (Overall) | 15,802 (48.5%) | 16,769 (51.5%) |
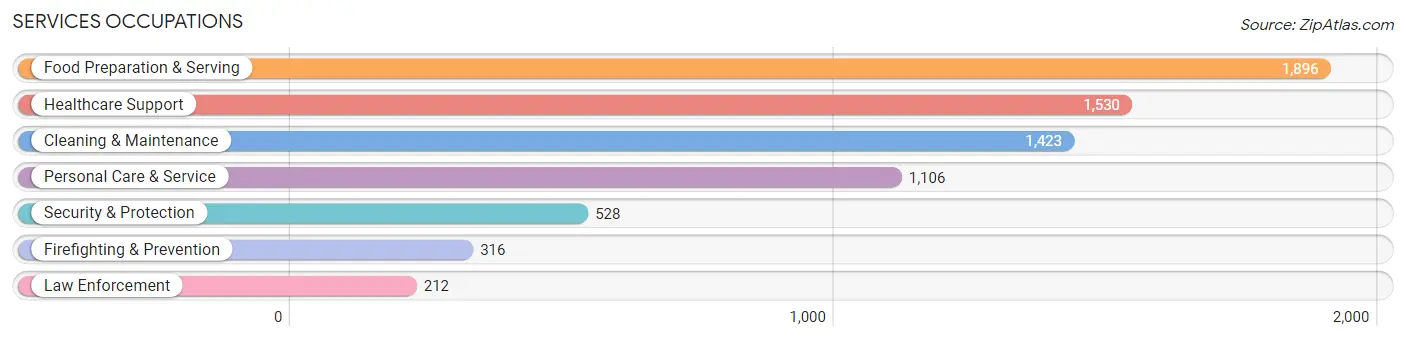
Services Occupations
The most common Services occupations in Orangeburg County are Food Preparation & Serving (1,896 | 5.8%), Healthcare Support (1,530 | 4.7%), Cleaning & Maintenance (1,423 | 4.4%), Personal Care & Service (1,106 | 3.4%), and Security & Protection (528 | 1.6%).
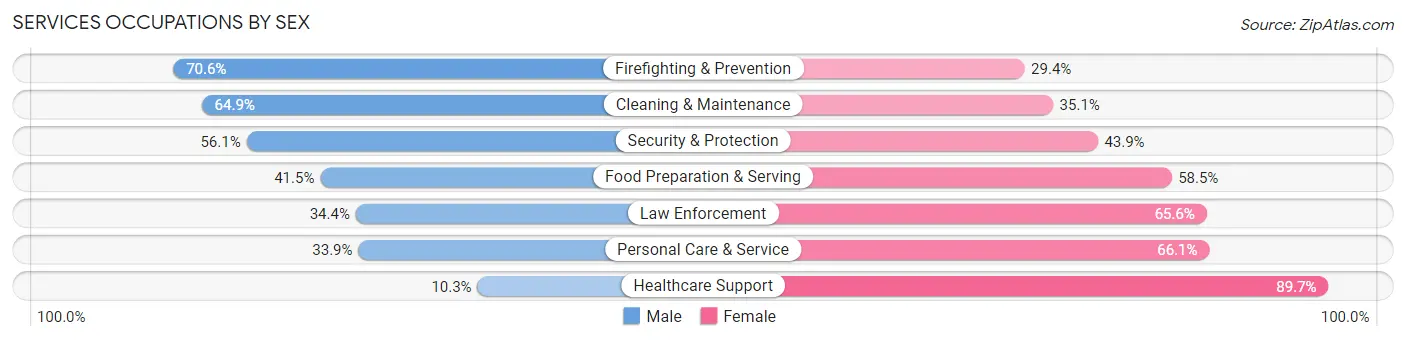
Services Occupations by Sex
Within the Services occupations in Orangeburg County, the most male-oriented occupations are Firefighting & Prevention (70.6%), Cleaning & Maintenance (64.9%), and Security & Protection (56.1%), while the most female-oriented occupations are Healthcare Support (89.7%), Personal Care & Service (66.1%), and Law Enforcement (65.6%).
| Occupation | Male | Female |
| Healthcare Support | 158 (10.3%) | 1,372 (89.7%) |
| Security & Protection | 296 (56.1%) | 232 (43.9%) |
| Firefighting & Prevention | 223 (70.6%) | 93 (29.4%) |
| Law Enforcement | 73 (34.4%) | 139 (65.6%) |
| Food Preparation & Serving | 786 (41.5%) | 1,110 (58.5%) |
| Cleaning & Maintenance | 924 (64.9%) | 499 (35.1%) |
| Personal Care & Service | 375 (33.9%) | 731 (66.1%) |
| Total (Category) | 2,539 (39.2%) | 3,944 (60.8%) |
| Total (Overall) | 15,802 (48.5%) | 16,769 (51.5%) |
Sales and Office Occupations
The most common Sales and Office occupations in Orangeburg County are Sales & Related (3,432 | 10.5%), and Office & Administration (2,918 | 9.0%).

Sales and Office Occupations by Sex

| Occupation | Male | Female |
| Sales & Related | 1,061 (30.9%) | 2,371 (69.1%) |
| Office & Administration | 374 (12.8%) | 2,544 (87.2%) |
| Total (Category) | 1,435 (22.6%) | 4,915 (77.4%) |
| Total (Overall) | 15,802 (48.5%) | 16,769 (51.5%) |
Natural Resources, Construction and Maintenance Occupations
The most common Natural Resources, Construction and Maintenance occupations in Orangeburg County are Installation, Maintenance & Repair (1,545 | 4.7%), Construction & Extraction (1,502 | 4.6%), and Farming, Fishing & Forestry (232 | 0.7%).

Natural Resources, Construction and Maintenance Occupations by Sex
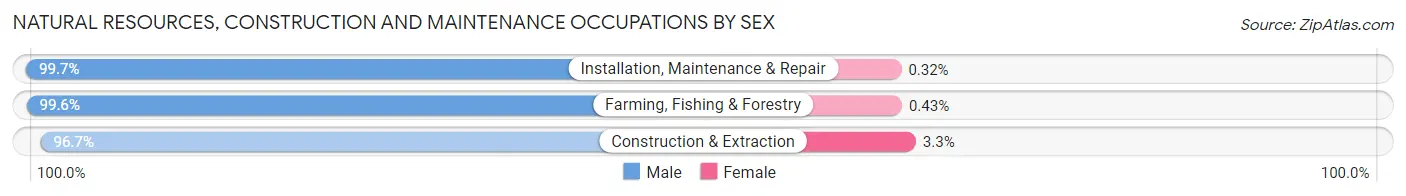
| Occupation | Male | Female |
| Farming, Fishing & Forestry | 231 (99.6%) | 1 (0.4%) |
| Construction & Extraction | 1,452 (96.7%) | 50 (3.3%) |
| Installation, Maintenance & Repair | 1,540 (99.7%) | 5 (0.3%) |
| Total (Category) | 3,223 (98.3%) | 56 (1.7%) |
| Total (Overall) | 15,802 (48.5%) | 16,769 (51.5%) |
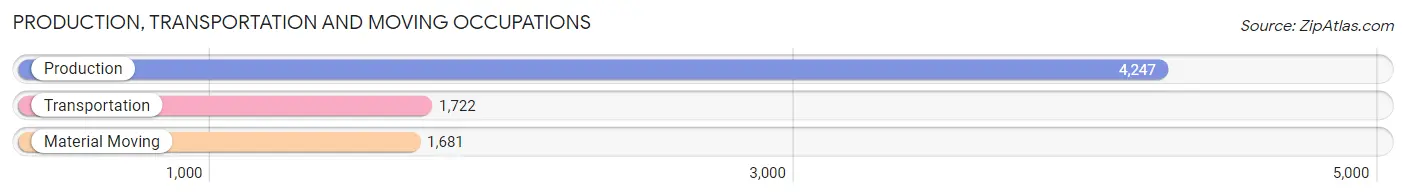
Production, Transportation and Moving Occupations
The most common Production, Transportation and Moving occupations in Orangeburg County are Production (4,247 | 13.0%), Transportation (1,722 | 5.3%), and Material Moving (1,681 | 5.2%).
Production, Transportation and Moving Occupations by Sex
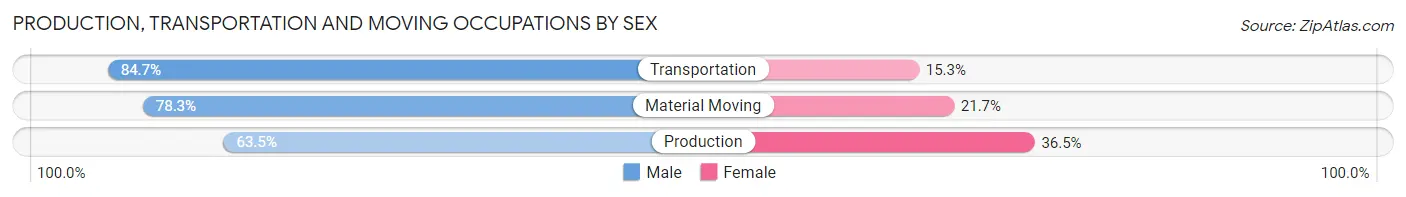
| Occupation | Male | Female |
| Production | 2,697 (63.5%) | 1,550 (36.5%) |
| Transportation | 1,459 (84.7%) | 263 (15.3%) |
| Material Moving | 1,316 (78.3%) | 365 (21.7%) |
| Total (Category) | 5,472 (71.5%) | 2,178 (28.5%) |
| Total (Overall) | 15,802 (48.5%) | 16,769 (51.5%) |
Employment Industries by Sex in Orangeburg County
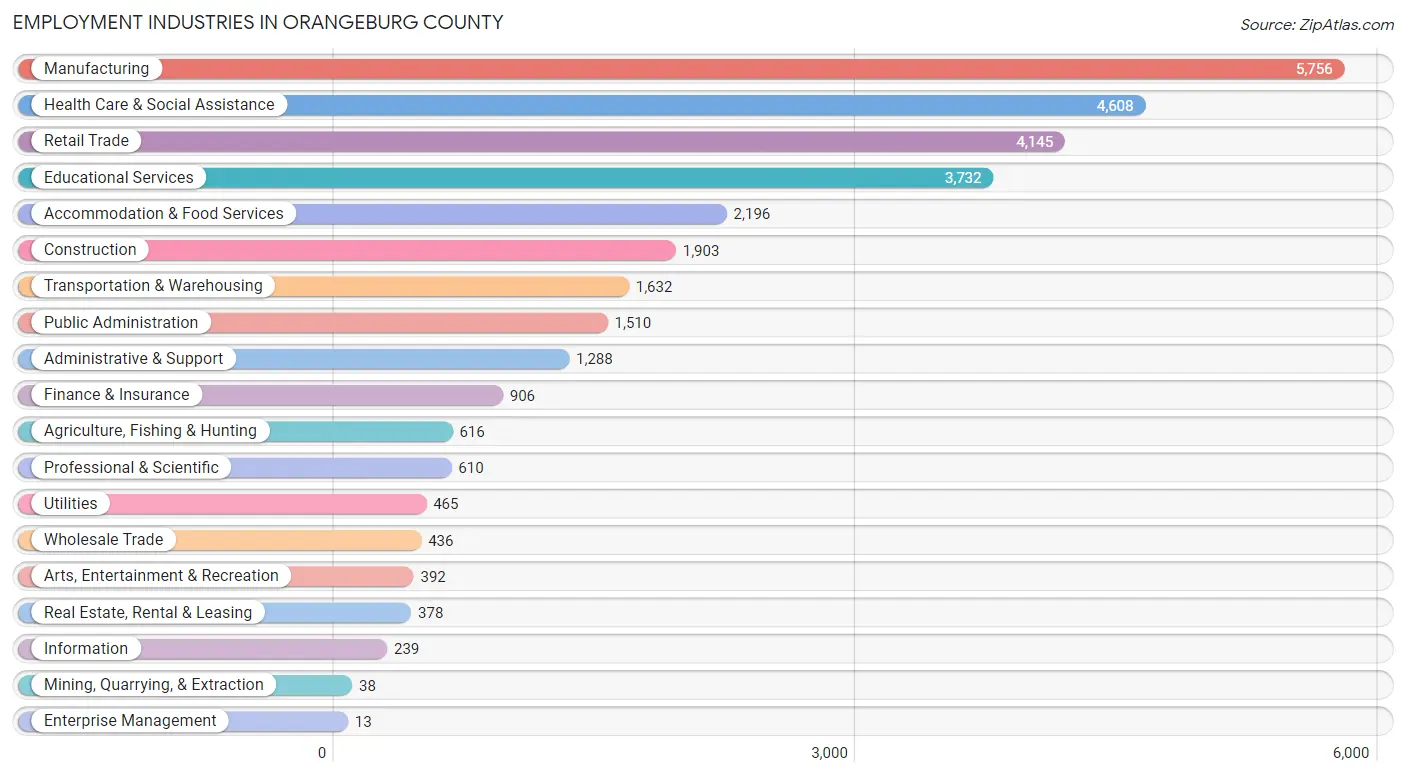
Employment Industries in Orangeburg County
The major employment industries in Orangeburg County include Manufacturing (5,756 | 17.7%), Health Care & Social Assistance (4,608 | 14.1%), Retail Trade (4,145 | 12.7%), Educational Services (3,732 | 11.5%), and Accommodation & Food Services (2,196 | 6.7%).
Employment Industries by Sex in Orangeburg County
The Orangeburg County industries that see more men than women are Mining, Quarrying, & Extraction (100.0%), Enterprise Management (100.0%), and Construction (93.2%), whereas the industries that tend to have a higher number of women are Health Care & Social Assistance (82.9%), Educational Services (74.7%), and Finance & Insurance (74.2%).
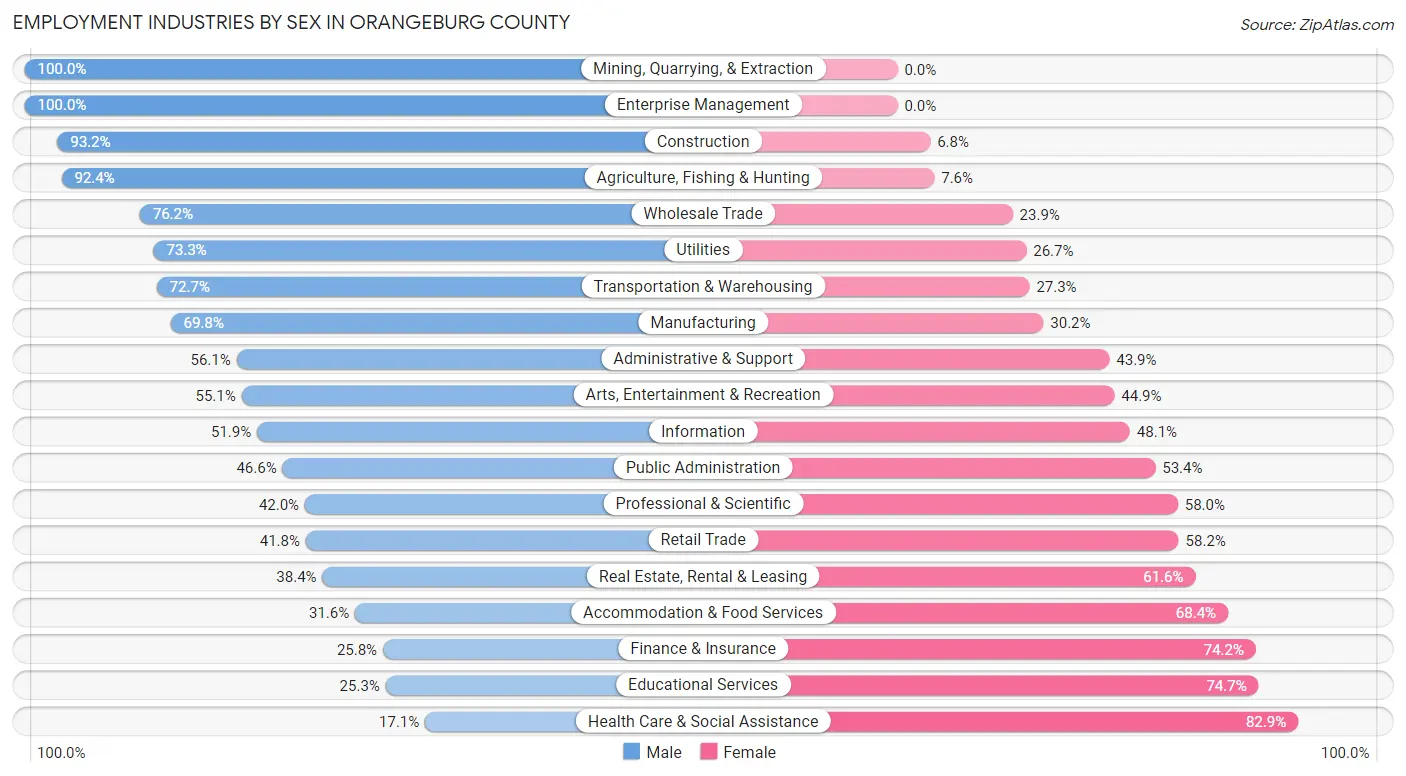
| Industry | Male | Female |
| Agriculture, Fishing & Hunting | 569 (92.4%) | 47 (7.6%) |
| Mining, Quarrying, & Extraction | 38 (100.0%) | 0 (0.0%) |
| Construction | 1,774 (93.2%) | 129 (6.8%) |
| Manufacturing | 4,017 (69.8%) | 1,739 (30.2%) |
| Wholesale Trade | 332 (76.1%) | 104 (23.8%) |
| Retail Trade | 1,732 (41.8%) | 2,413 (58.2%) |
| Transportation & Warehousing | 1,186 (72.7%) | 446 (27.3%) |
| Utilities | 341 (73.3%) | 124 (26.7%) |
| Information | 124 (51.9%) | 115 (48.1%) |
| Finance & Insurance | 234 (25.8%) | 672 (74.2%) |
| Real Estate, Rental & Leasing | 145 (38.4%) | 233 (61.6%) |
| Professional & Scientific | 256 (42.0%) | 354 (58.0%) |
| Enterprise Management | 13 (100.0%) | 0 (0.0%) |
| Administrative & Support | 723 (56.1%) | 565 (43.9%) |
| Educational Services | 943 (25.3%) | 2,789 (74.7%) |
| Health Care & Social Assistance | 788 (17.1%) | 3,820 (82.9%) |
| Arts, Entertainment & Recreation | 216 (55.1%) | 176 (44.9%) |
| Accommodation & Food Services | 694 (31.6%) | 1,502 (68.4%) |
| Public Administration | 704 (46.6%) | 806 (53.4%) |
| Total | 15,802 (48.5%) | 16,769 (51.5%) |
Education in Orangeburg County
School Enrollment in Orangeburg County
The most common levels of schooling among the 20,816 students in Orangeburg County are college / undergraduate (5,241 | 25.2%), high school (4,801 | 23.1%), and middle school (4,443 | 21.3%).
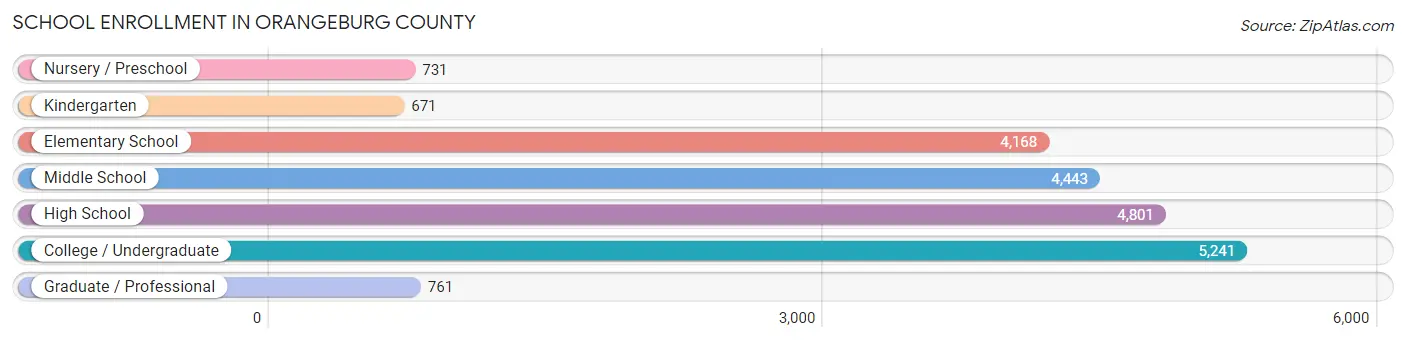
| School Level | # Students | % Students |
| Nursery / Preschool | 731 | 3.5% |
| Kindergarten | 671 | 3.2% |
| Elementary School | 4,168 | 20.0% |
| Middle School | 4,443 | 21.3% |
| High School | 4,801 | 23.1% |
| College / Undergraduate | 5,241 | 25.2% |
| Graduate / Professional | 761 | 3.7% |
| Total | 20,816 | 100.0% |
School Enrollment by Age by Funding Source in Orangeburg County
Out of a total of 20,816 students who are enrolled in schools in Orangeburg County, 3,830 (18.4%) attend a private institution, while the remaining 16,986 (81.6%) are enrolled in public schools. The age group of 35 years and over has the highest likelihood of being enrolled in private schools, with 445 (44.1% in the age bracket) enrolled. Conversely, the age group of 15 to 17 year olds has the lowest likelihood of being enrolled in a private school, with 2,704 (90.6% in the age bracket) attending a public institution.
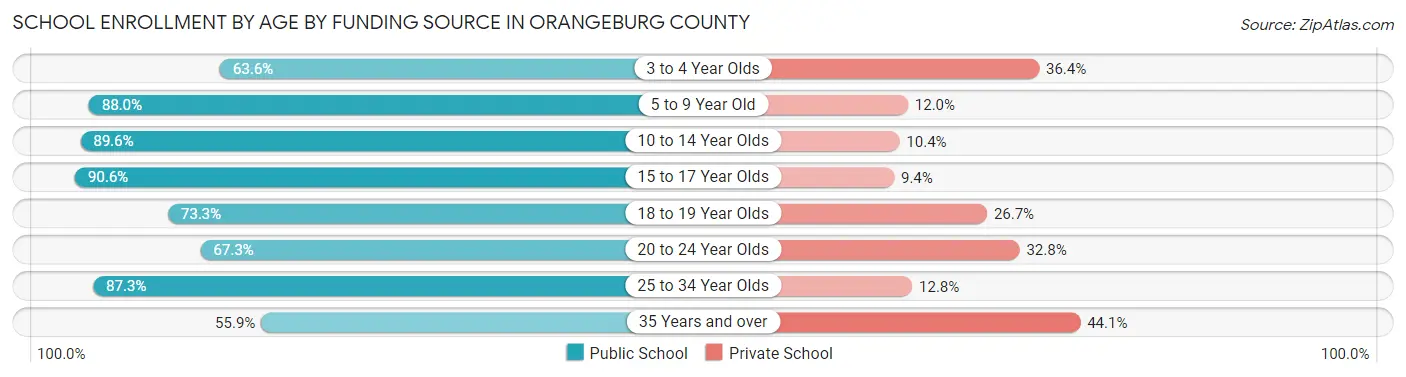
| Age Bracket | Public School | Private School |
| 3 to 4 Year Olds | 472 (63.6%) | 270 (36.4%) |
| 5 to 9 Year Old | 4,043 (88.0%) | 549 (12.0%) |
| 10 to 14 Year Olds | 4,793 (89.6%) | 555 (10.4%) |
| 15 to 17 Year Olds | 2,704 (90.6%) | 280 (9.4%) |
| 18 to 19 Year Olds | 1,890 (73.3%) | 688 (26.7%) |
| 20 to 24 Year Olds | 1,984 (67.2%) | 966 (32.8%) |
| 25 to 34 Year Olds | 534 (87.3%) | 78 (12.8%) |
| 35 Years and over | 565 (55.9%) | 445 (44.1%) |
| Total | 16,986 (81.6%) | 3,830 (18.4%) |
Educational Attainment by Field of Study in Orangeburg County
Education (2,927 | 25.6%), business (2,092 | 18.3%), science & technology (1,337 | 11.7%), arts & humanities (885 | 7.7%), and psychology (745 | 6.5%) are the most common fields of study among 11,418 individuals in Orangeburg County who have obtained a bachelor's degree or higher.
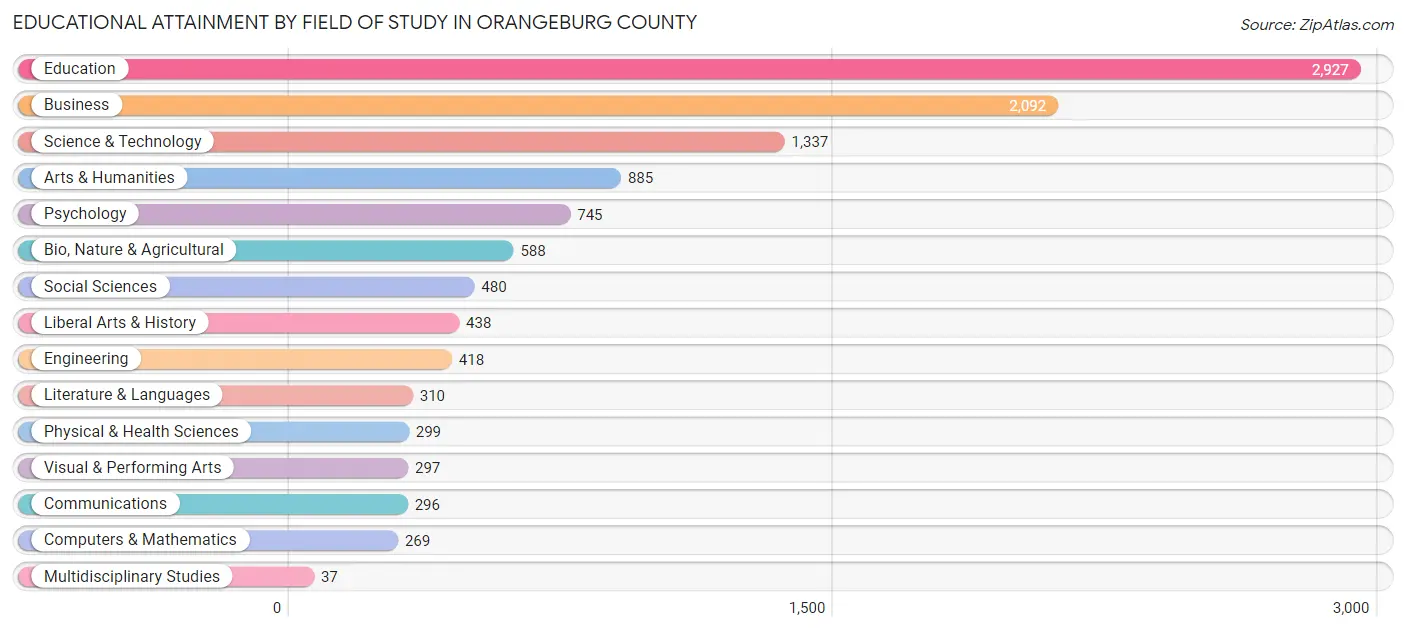
| Field of Study | # Graduates | % Graduates |
| Computers & Mathematics | 269 | 2.4% |
| Bio, Nature & Agricultural | 588 | 5.1% |
| Physical & Health Sciences | 299 | 2.6% |
| Psychology | 745 | 6.5% |
| Social Sciences | 480 | 4.2% |
| Engineering | 418 | 3.7% |
| Multidisciplinary Studies | 37 | 0.3% |
| Science & Technology | 1,337 | 11.7% |
| Business | 2,092 | 18.3% |
| Education | 2,927 | 25.6% |
| Literature & Languages | 310 | 2.7% |
| Liberal Arts & History | 438 | 3.8% |
| Visual & Performing Arts | 297 | 2.6% |
| Communications | 296 | 2.6% |
| Arts & Humanities | 885 | 7.7% |
| Total | 11,418 | 100.0% |
Transportation & Commute in Orangeburg County
Vehicle Availability by Sex in Orangeburg County
The most prevalent vehicle ownership categories in Orangeburg County are males with 2 vehicles (5,446, accounting for 36.1%) and females with 2 vehicles (5,571, making up 34.7%).
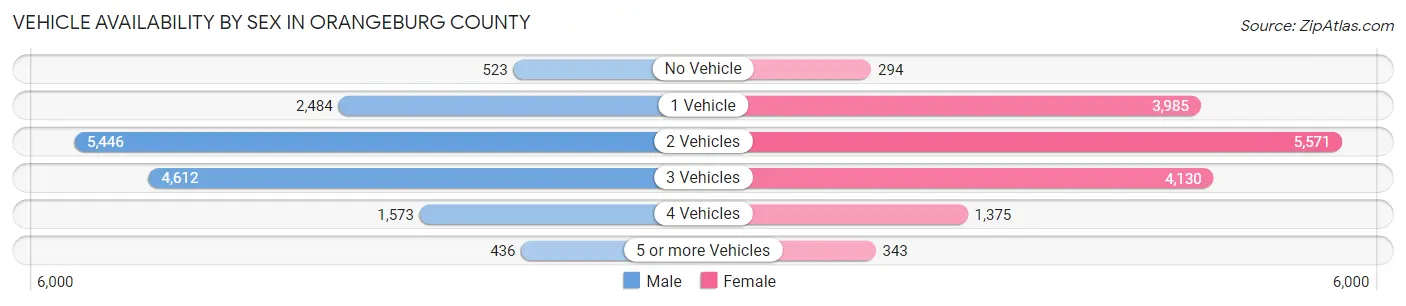
| Vehicles Available | Male | Female |
| No Vehicle | 523 (3.5%) | 294 (1.9%) |
| 1 Vehicle | 2,484 (16.5%) | 3,985 (25.4%) |
| 2 Vehicles | 5,446 (36.1%) | 5,571 (35.5%) |
| 3 Vehicles | 4,612 (30.6%) | 4,130 (26.3%) |
| 4 Vehicles | 1,573 (10.4%) | 1,375 (8.8%) |
| 5 or more Vehicles | 436 (2.9%) | 343 (2.2%) |
| Total | 15,074 (100.0%) | 15,698 (100.0%) |
Commute Time in Orangeburg County
The most frequently occuring commute durations in Orangeburg County are 10 to 14 minutes (4,813 commuters, 16.2%), 15 to 19 minutes (4,401 commuters, 14.8%), and 20 to 24 minutes (3,429 commuters, 11.5%).
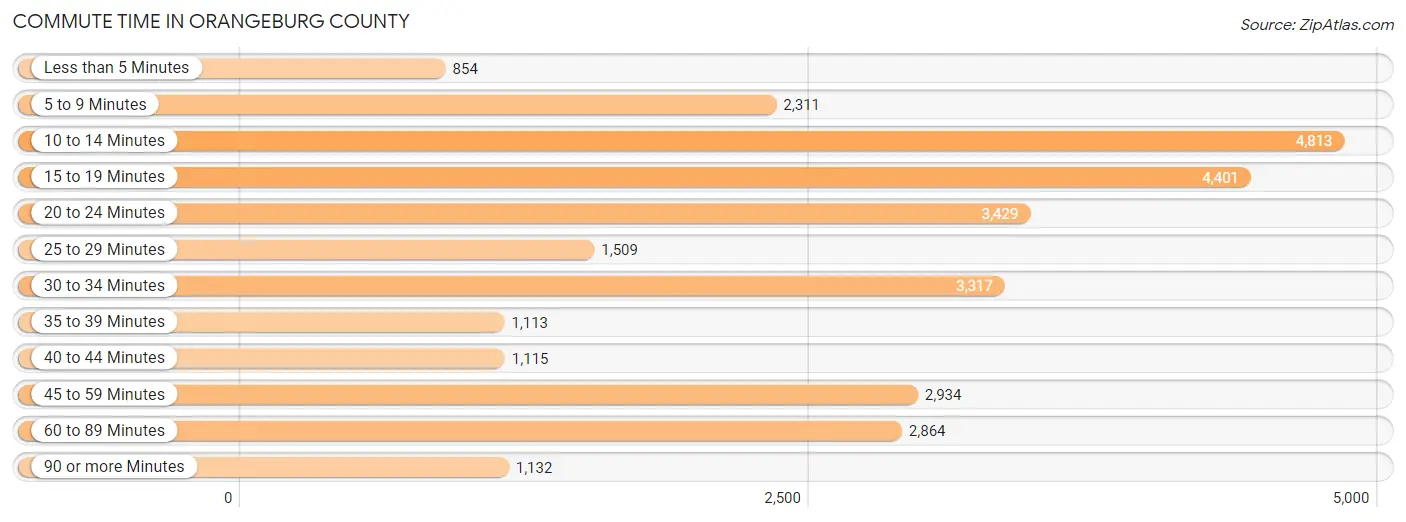
| Commute Time | # Commuters | % Commuters |
| Less than 5 Minutes | 854 | 2.9% |
| 5 to 9 Minutes | 2,311 | 7.8% |
| 10 to 14 Minutes | 4,813 | 16.2% |
| 15 to 19 Minutes | 4,401 | 14.8% |
| 20 to 24 Minutes | 3,429 | 11.5% |
| 25 to 29 Minutes | 1,509 | 5.1% |
| 30 to 34 Minutes | 3,317 | 11.1% |
| 35 to 39 Minutes | 1,113 | 3.7% |
| 40 to 44 Minutes | 1,115 | 3.7% |
| 45 to 59 Minutes | 2,934 | 9.9% |
| 60 to 89 Minutes | 2,864 | 9.6% |
| 90 or more Minutes | 1,132 | 3.8% |
Commute Time by Sex in Orangeburg County
The most common commute times in Orangeburg County are 15 to 19 minutes (2,194 commuters, 14.9%) for males and 10 to 14 minutes (2,700 commuters, 17.9%) for females.
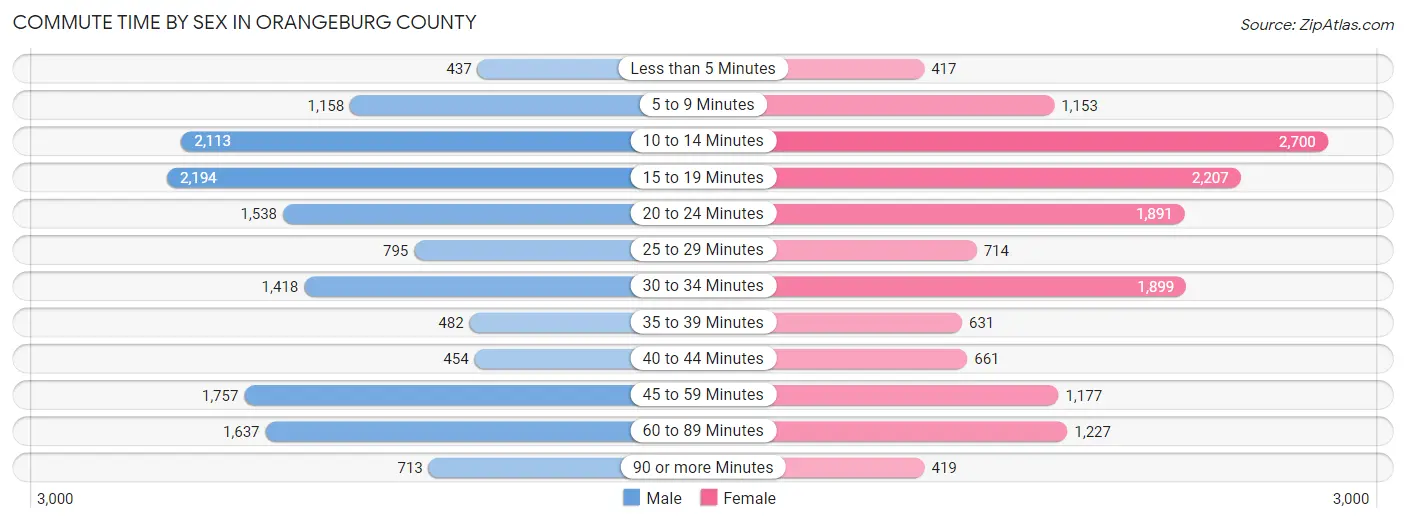
| Commute Time | Male | Female |
| Less than 5 Minutes | 437 (3.0%) | 417 (2.8%) |
| 5 to 9 Minutes | 1,158 (7.9%) | 1,153 (7.6%) |
| 10 to 14 Minutes | 2,113 (14.4%) | 2,700 (17.9%) |
| 15 to 19 Minutes | 2,194 (14.9%) | 2,207 (14.6%) |
| 20 to 24 Minutes | 1,538 (10.5%) | 1,891 (12.5%) |
| 25 to 29 Minutes | 795 (5.4%) | 714 (4.7%) |
| 30 to 34 Minutes | 1,418 (9.7%) | 1,899 (12.6%) |
| 35 to 39 Minutes | 482 (3.3%) | 631 (4.2%) |
| 40 to 44 Minutes | 454 (3.1%) | 661 (4.4%) |
| 45 to 59 Minutes | 1,757 (12.0%) | 1,177 (7.8%) |
| 60 to 89 Minutes | 1,637 (11.1%) | 1,227 (8.1%) |
| 90 or more Minutes | 713 (4.9%) | 419 (2.8%) |
Time of Departure to Work by Sex in Orangeburg County
The most frequent times of departure to work in Orangeburg County are 7:00 AM to 7:29 AM (2,013, 13.7%) for males and 7:00 AM to 7:29 AM (2,772, 18.4%) for females.
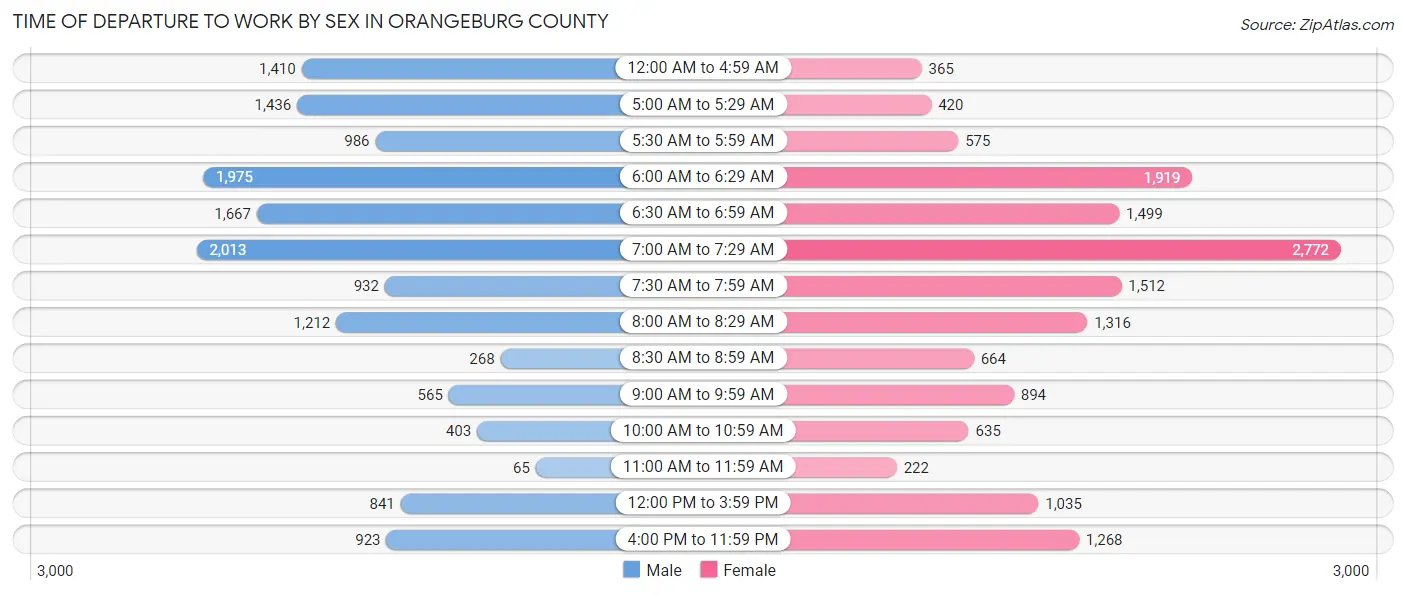
| Time of Departure | Male | Female |
| 12:00 AM to 4:59 AM | 1,410 (9.6%) | 365 (2.4%) |
| 5:00 AM to 5:29 AM | 1,436 (9.8%) | 420 (2.8%) |
| 5:30 AM to 5:59 AM | 986 (6.7%) | 575 (3.8%) |
| 6:00 AM to 6:29 AM | 1,975 (13.4%) | 1,919 (12.7%) |
| 6:30 AM to 6:59 AM | 1,667 (11.3%) | 1,499 (9.9%) |
| 7:00 AM to 7:29 AM | 2,013 (13.7%) | 2,772 (18.4%) |
| 7:30 AM to 7:59 AM | 932 (6.3%) | 1,512 (10.0%) |
| 8:00 AM to 8:29 AM | 1,212 (8.3%) | 1,316 (8.7%) |
| 8:30 AM to 8:59 AM | 268 (1.8%) | 664 (4.4%) |
| 9:00 AM to 9:59 AM | 565 (3.8%) | 894 (5.9%) |
| 10:00 AM to 10:59 AM | 403 (2.7%) | 635 (4.2%) |
| 11:00 AM to 11:59 AM | 65 (0.4%) | 222 (1.5%) |
| 12:00 PM to 3:59 PM | 841 (5.7%) | 1,035 (6.9%) |
| 4:00 PM to 11:59 PM | 923 (6.3%) | 1,268 (8.4%) |
| Total | 14,696 (100.0%) | 15,096 (100.0%) |
Housing Occupancy in Orangeburg County
Occupancy by Ownership in Orangeburg County
Of the total 32,687 dwellings in Orangeburg County, owner-occupied units account for 21,364 (65.4%), while renter-occupied units make up 11,323 (34.6%).
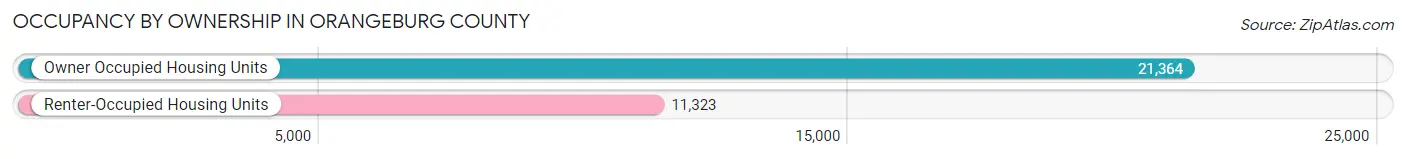
| Occupancy | # Housing Units | % Housing Units |
| Owner Occupied Housing Units | 21,364 | 65.4% |
| Renter-Occupied Housing Units | 11,323 | 34.6% |
| Total Occupied Housing Units | 32,687 | 100.0% |
Occupancy by Household Size in Orangeburg County
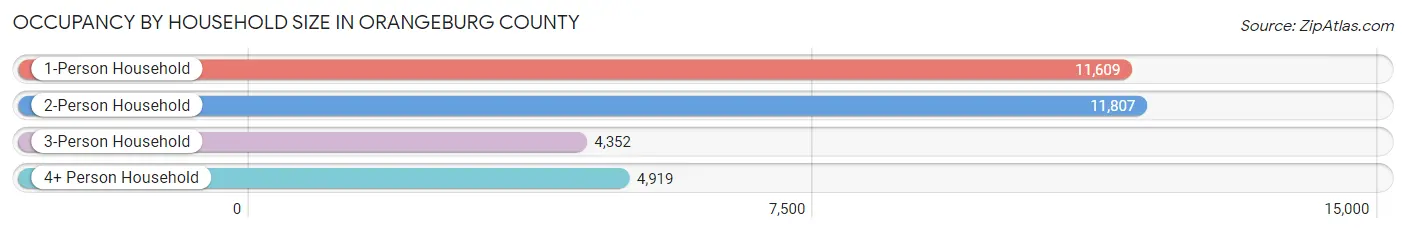
| Household Size | # Housing Units | % Housing Units |
| 1-Person Household | 11,609 | 35.5% |
| 2-Person Household | 11,807 | 36.1% |
| 3-Person Household | 4,352 | 13.3% |
| 4+ Person Household | 4,919 | 15.0% |
| Total Housing Units | 32,687 | 100.0% |
Occupancy by Ownership by Household Size in Orangeburg County
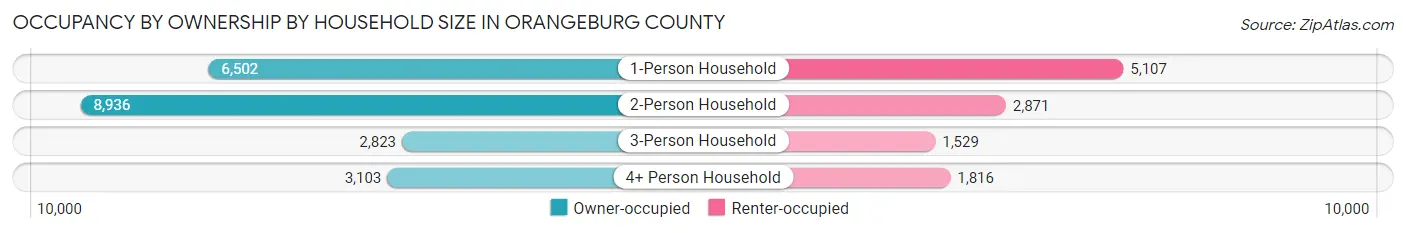
| Household Size | Owner-occupied | Renter-occupied |
| 1-Person Household | 6,502 (56.0%) | 5,107 (44.0%) |
| 2-Person Household | 8,936 (75.7%) | 2,871 (24.3%) |
| 3-Person Household | 2,823 (64.9%) | 1,529 (35.1%) |
| 4+ Person Household | 3,103 (63.1%) | 1,816 (36.9%) |
| Total Housing Units | 21,364 (65.4%) | 11,323 (34.6%) |
Occupancy by Educational Attainment in Orangeburg County
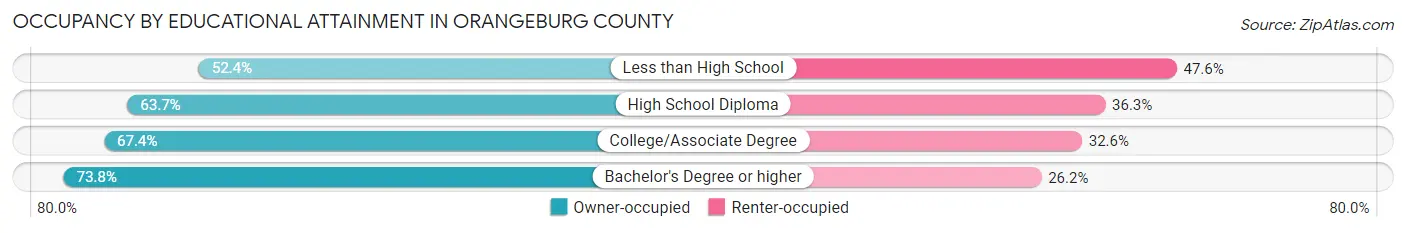
| Household Size | Owner-occupied | Renter-occupied |
| Less than High School | 2,469 (52.4%) | 2,246 (47.6%) |
| High School Diploma | 6,535 (63.7%) | 3,725 (36.3%) |
| College/Associate Degree | 7,491 (67.4%) | 3,625 (32.6%) |
| Bachelor's Degree or higher | 4,869 (73.8%) | 1,727 (26.2%) |
Occupancy by Age of Householder in Orangeburg County
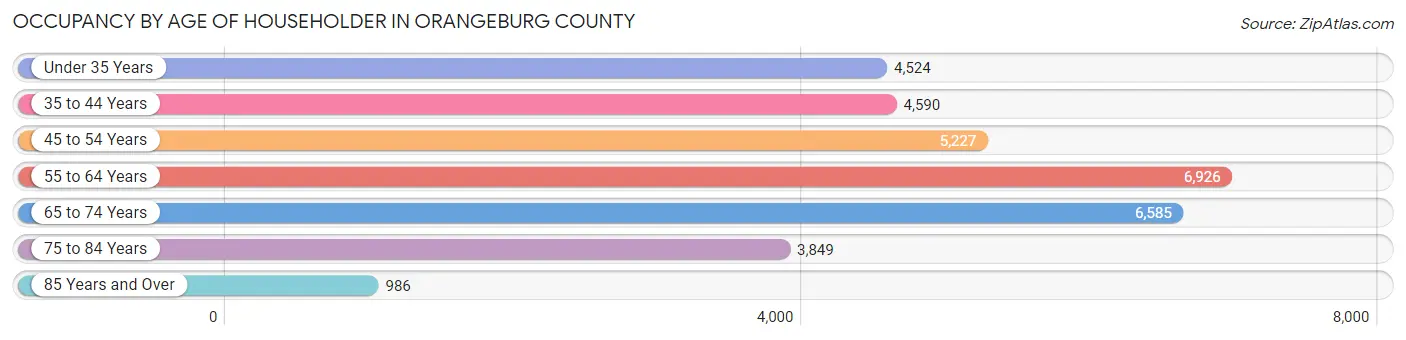
| Age Bracket | # Households | % Households |
| Under 35 Years | 4,524 | 13.8% |
| 35 to 44 Years | 4,590 | 14.0% |
| 45 to 54 Years | 5,227 | 16.0% |
| 55 to 64 Years | 6,926 | 21.2% |
| 65 to 74 Years | 6,585 | 20.2% |
| 75 to 84 Years | 3,849 | 11.8% |
| 85 Years and Over | 986 | 3.0% |
| Total | 32,687 | 100.0% |
Housing Finances in Orangeburg County
Median Income by Occupancy in Orangeburg County
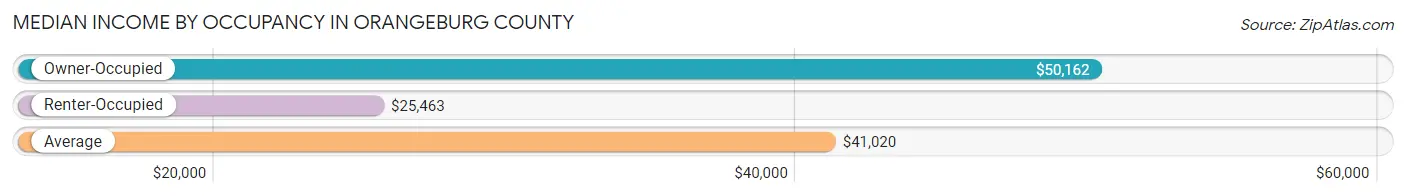
| Occupancy Type | # Households | Median Income |
| Owner-Occupied | 21,364 (65.4%) | $50,162 |
| Renter-Occupied | 11,323 (34.6%) | $25,463 |
| Average | 32,687 (100.0%) | $41,020 |
Occupancy by Householder Income Bracket in Orangeburg County
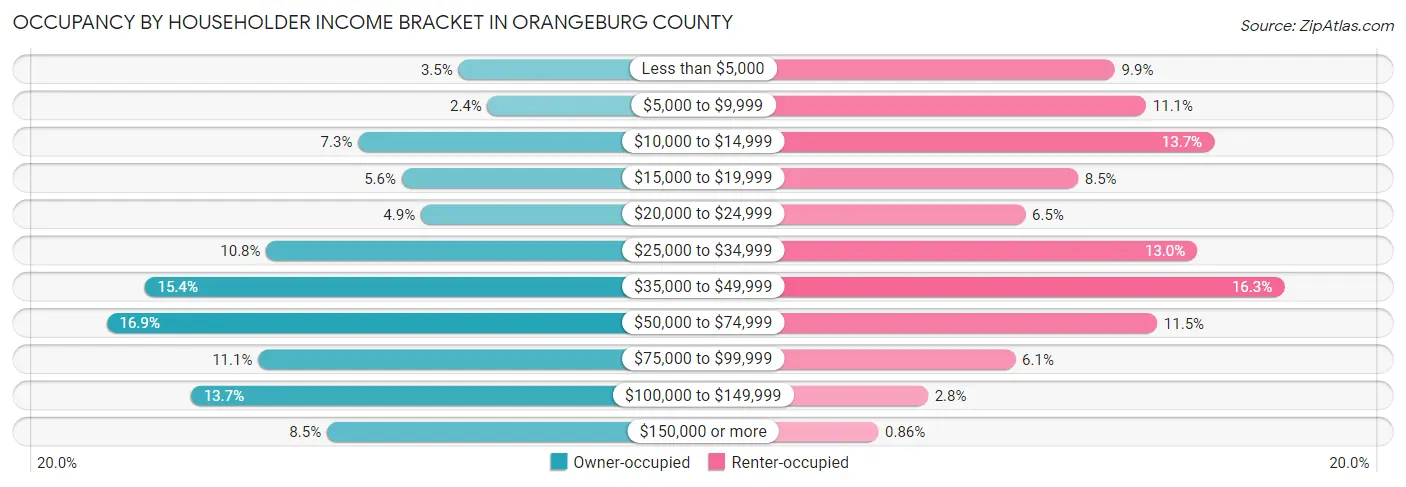
| Income Bracket | Owner-occupied | Renter-occupied |
| Less than $5,000 | 742 (3.5%) | 1,118 (9.9%) |
| $5,000 to $9,999 | 505 (2.4%) | 1,252 (11.1%) |
| $10,000 to $14,999 | 1,558 (7.3%) | 1,546 (13.7%) |
| $15,000 to $19,999 | 1,202 (5.6%) | 959 (8.5%) |
| $20,000 to $24,999 | 1,047 (4.9%) | 731 (6.5%) |
| $25,000 to $34,999 | 2,305 (10.8%) | 1,473 (13.0%) |
| $35,000 to $49,999 | 3,296 (15.4%) | 1,848 (16.3%) |
| $50,000 to $74,999 | 3,607 (16.9%) | 1,300 (11.5%) |
| $75,000 to $99,999 | 2,371 (11.1%) | 688 (6.1%) |
| $100,000 to $149,999 | 2,920 (13.7%) | 311 (2.8%) |
| $150,000 or more | 1,811 (8.5%) | 97 (0.9%) |
| Total | 21,364 (100.0%) | 11,323 (100.0%) |
Monthly Housing Cost Tiers in Orangeburg County
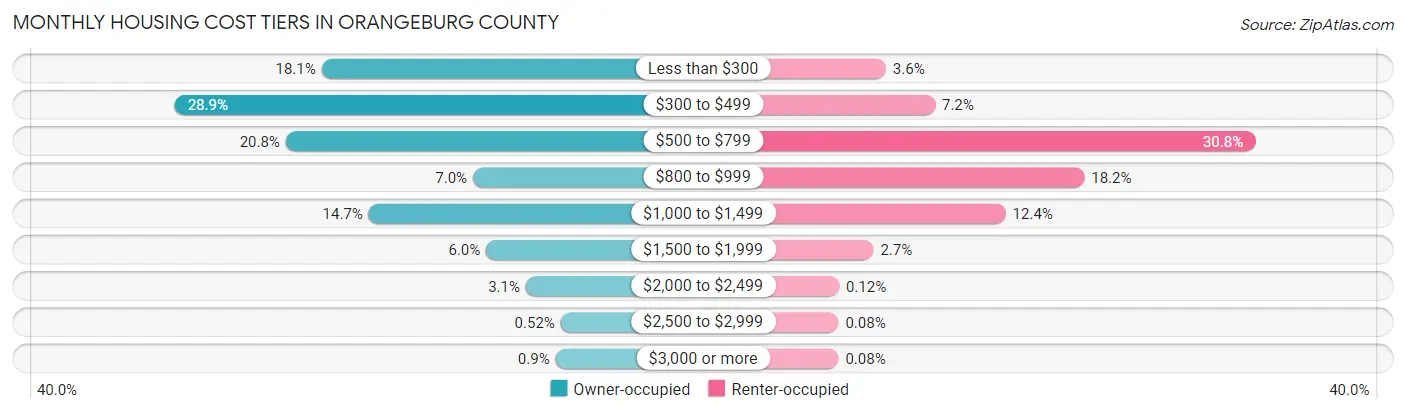
| Monthly Cost | Owner-occupied | Renter-occupied |
| Less than $300 | 3,873 (18.1%) | 404 (3.6%) |
| $300 to $499 | 6,182 (28.9%) | 814 (7.2%) |
| $500 to $799 | 4,438 (20.8%) | 3,482 (30.7%) |
| $800 to $999 | 1,491 (7.0%) | 2,059 (18.2%) |
| $1,000 to $1,499 | 3,131 (14.7%) | 1,403 (12.4%) |
| $1,500 to $1,999 | 1,283 (6.0%) | 301 (2.7%) |
| $2,000 to $2,499 | 661 (3.1%) | 14 (0.1%) |
| $2,500 to $2,999 | 112 (0.5%) | 9 (0.1%) |
| $3,000 or more | 193 (0.9%) | 9 (0.1%) |
| Total | 21,364 (100.0%) | 11,323 (100.0%) |
Physical Housing Characteristics in Orangeburg County
Housing Structures in Orangeburg County
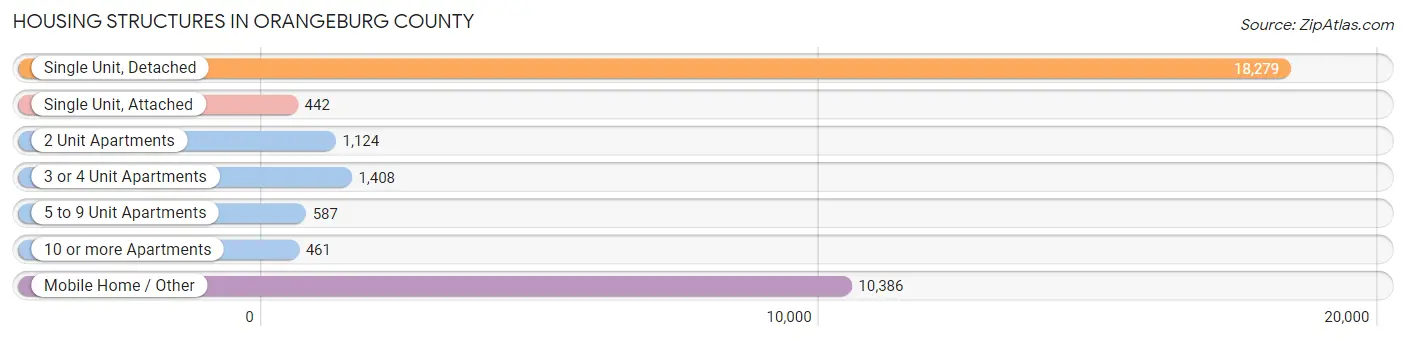
| Structure Type | # Housing Units | % Housing Units |
| Single Unit, Detached | 18,279 | 55.9% |
| Single Unit, Attached | 442 | 1.3% |
| 2 Unit Apartments | 1,124 | 3.4% |
| 3 or 4 Unit Apartments | 1,408 | 4.3% |
| 5 to 9 Unit Apartments | 587 | 1.8% |
| 10 or more Apartments | 461 | 1.4% |
| Mobile Home / Other | 10,386 | 31.8% |
| Total | 32,687 | 100.0% |
Housing Structures by Occupancy in Orangeburg County
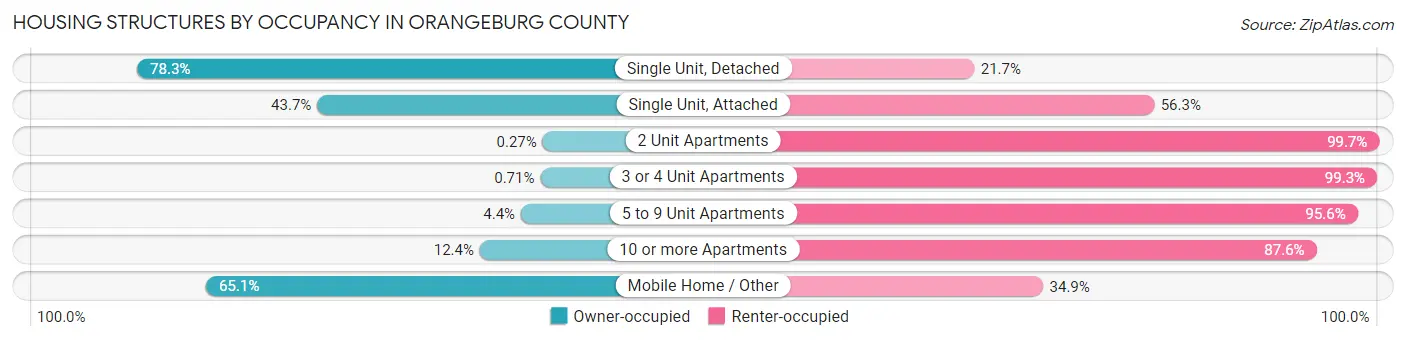
| Structure Type | Owner-occupied | Renter-occupied |
| Single Unit, Detached | 14,317 (78.3%) | 3,962 (21.7%) |
| Single Unit, Attached | 193 (43.7%) | 249 (56.3%) |
| 2 Unit Apartments | 3 (0.3%) | 1,121 (99.7%) |
| 3 or 4 Unit Apartments | 10 (0.7%) | 1,398 (99.3%) |
| 5 to 9 Unit Apartments | 26 (4.4%) | 561 (95.6%) |
| 10 or more Apartments | 57 (12.4%) | 404 (87.6%) |
| Mobile Home / Other | 6,758 (65.1%) | 3,628 (34.9%) |
| Total | 21,364 (65.4%) | 11,323 (34.6%) |
Housing Structures by Number of Rooms in Orangeburg County
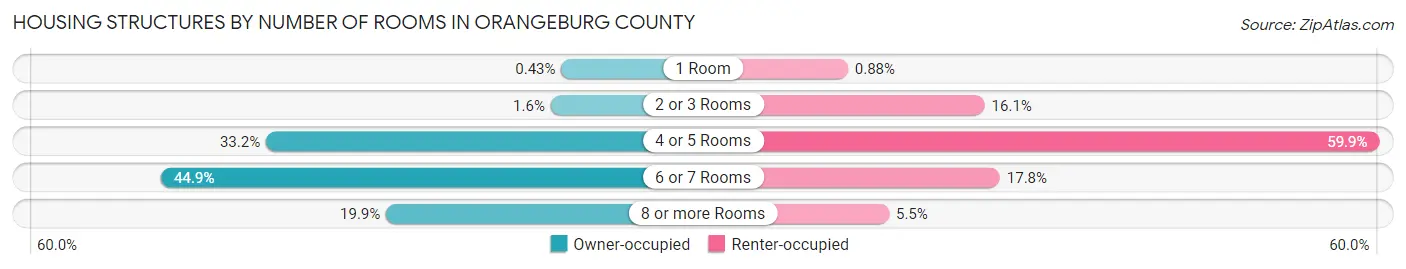
| Number of Rooms | Owner-occupied | Renter-occupied |
| 1 Room | 92 (0.4%) | 100 (0.9%) |
| 2 or 3 Rooms | 344 (1.6%) | 1,818 (16.1%) |
| 4 or 5 Rooms | 7,096 (33.2%) | 6,778 (59.9%) |
| 6 or 7 Rooms | 9,584 (44.9%) | 2,010 (17.7%) |
| 8 or more Rooms | 4,248 (19.9%) | 617 (5.4%) |
| Total | 21,364 (100.0%) | 11,323 (100.0%) |
Housing Structure by Heating Type in Orangeburg County
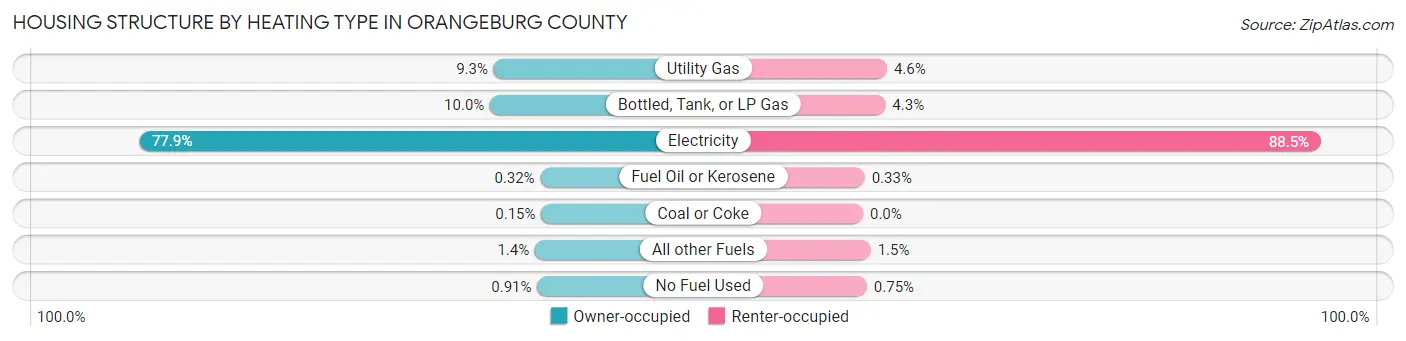
| Heating Type | Owner-occupied | Renter-occupied |
| Utility Gas | 1,993 (9.3%) | 524 (4.6%) |
| Bottled, Tank, or LP Gas | 2,144 (10.0%) | 489 (4.3%) |
| Electricity | 16,641 (77.9%) | 10,019 (88.5%) |
| Fuel Oil or Kerosene | 69 (0.3%) | 37 (0.3%) |
| Coal or Coke | 33 (0.2%) | 0 (0.0%) |
| All other Fuels | 290 (1.4%) | 169 (1.5%) |
| No Fuel Used | 194 (0.9%) | 85 (0.7%) |
| Total | 21,364 (100.0%) | 11,323 (100.0%) |
Household Vehicle Usage in Orangeburg County
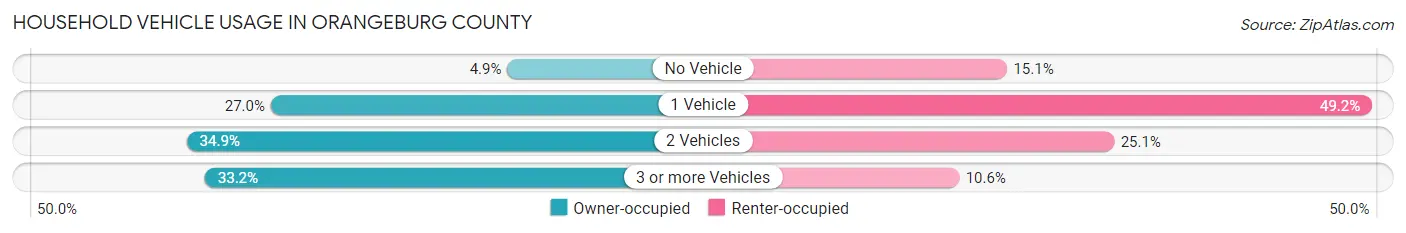
| Vehicles per Household | Owner-occupied | Renter-occupied |
| No Vehicle | 1,056 (4.9%) | 1,708 (15.1%) |
| 1 Vehicle | 5,772 (27.0%) | 5,571 (49.2%) |
| 2 Vehicles | 7,449 (34.9%) | 2,841 (25.1%) |
| 3 or more Vehicles | 7,087 (33.2%) | 1,203 (10.6%) |
| Total | 21,364 (100.0%) | 11,323 (100.0%) |
Real Estate & Mortgages in Orangeburg County
Real Estate and Mortgage Overview in Orangeburg County
| Characteristic | Without Mortgage | With Mortgage |
| Housing Units | 14,042 | 7,322 |
| Median Property Value | $86,300 | $155,200 |
| Median Household Income | $43,594 | $947 |
| Monthly Housing Costs | $402 | $164 |
| Real Estate Taxes | $511 | $714 |
Property Value by Mortgage Status in Orangeburg County
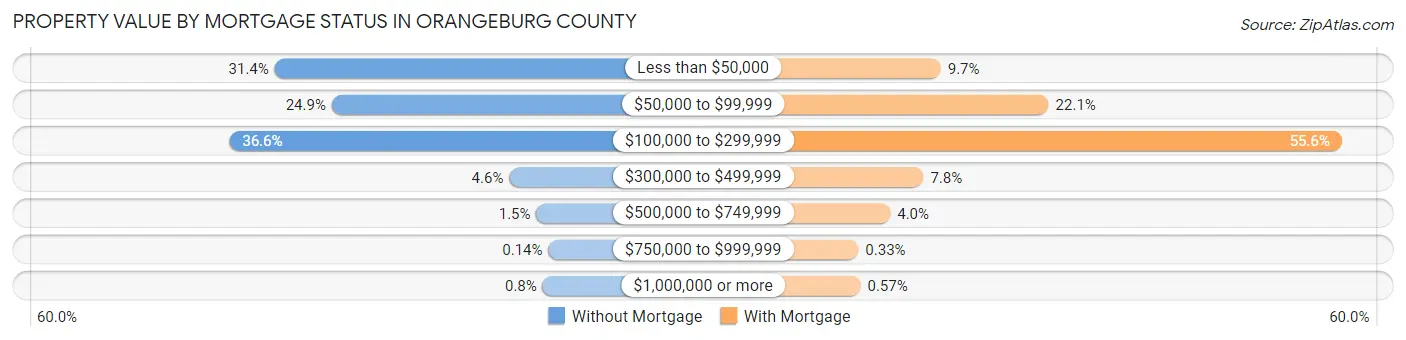
| Property Value | Without Mortgage | With Mortgage |
| Less than $50,000 | 4,414 (31.4%) | 713 (9.7%) |
| $50,000 to $99,999 | 3,497 (24.9%) | 1,616 (22.1%) |
| $100,000 to $299,999 | 5,140 (36.6%) | 4,068 (55.6%) |
| $300,000 to $499,999 | 647 (4.6%) | 568 (7.8%) |
| $500,000 to $749,999 | 212 (1.5%) | 291 (4.0%) |
| $750,000 to $999,999 | 19 (0.1%) | 24 (0.3%) |
| $1,000,000 or more | 113 (0.8%) | 42 (0.6%) |
| Total | 14,042 (100.0%) | 7,322 (100.0%) |
Household Income by Mortgage Status in Orangeburg County
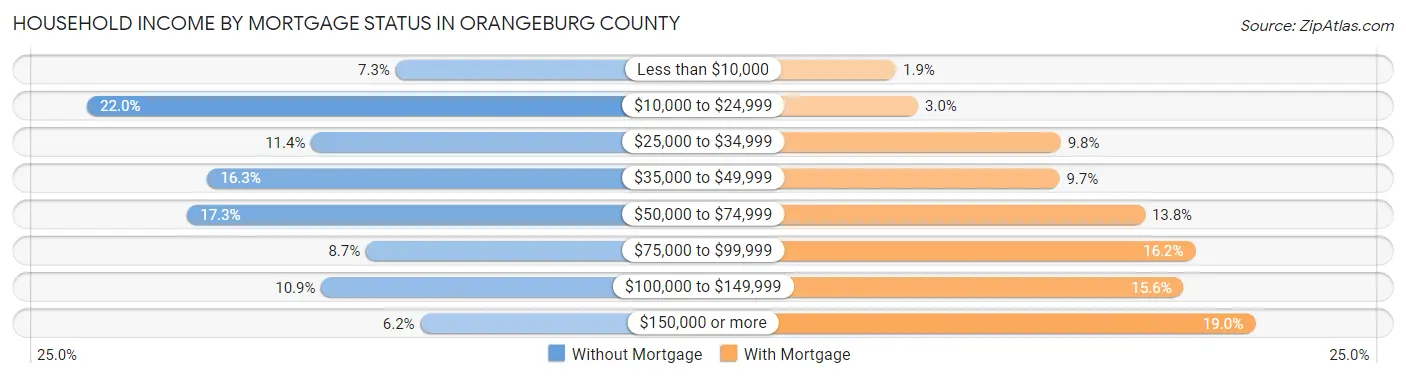
| Household Income | Without Mortgage | With Mortgage |
| Less than $10,000 | 1,029 (7.3%) | 141 (1.9%) |
| $10,000 to $24,999 | 3,092 (22.0%) | 218 (3.0%) |
| $25,000 to $34,999 | 1,594 (11.4%) | 715 (9.8%) |
| $35,000 to $49,999 | 2,287 (16.3%) | 711 (9.7%) |
| $50,000 to $74,999 | 2,422 (17.2%) | 1,009 (13.8%) |
| $75,000 to $99,999 | 1,227 (8.7%) | 1,185 (16.2%) |
| $100,000 to $149,999 | 1,527 (10.9%) | 1,144 (15.6%) |
| $150,000 or more | 864 (6.1%) | 1,393 (19.0%) |
| Total | 14,042 (100.0%) | 7,322 (100.0%) |
Property Value to Household Income Ratio in Orangeburg County
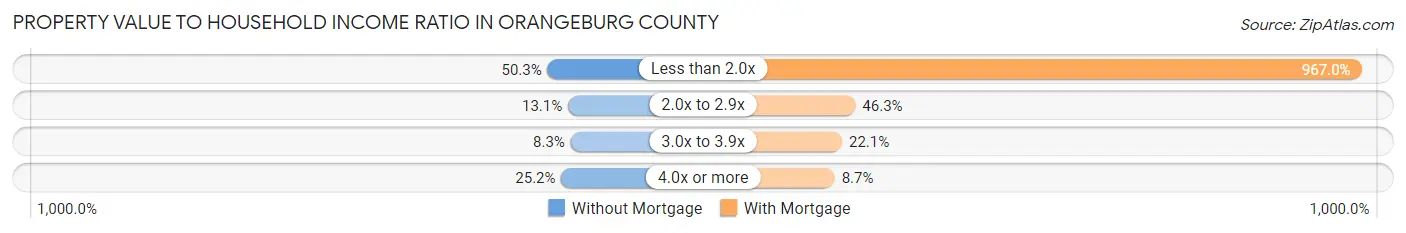
| Value-to-Income Ratio | Without Mortgage | With Mortgage |
| Less than 2.0x | 7,065 (50.3%) | 70,805 (967.0%) |
| 2.0x to 2.9x | 1,834 (13.1%) | 3,389 (46.3%) |
| 3.0x to 3.9x | 1,164 (8.3%) | 1,615 (22.1%) |
| 4.0x or more | 3,540 (25.2%) | 637 (8.7%) |
| Total | 14,042 (100.0%) | 7,322 (100.0%) |
Real Estate Taxes by Mortgage Status in Orangeburg County
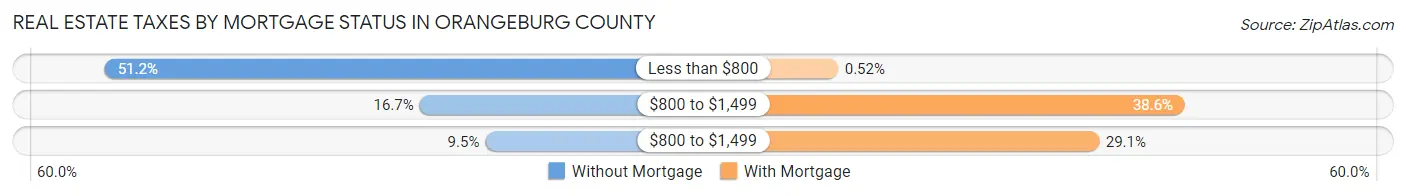
| Property Taxes | Without Mortgage | With Mortgage |
| Less than $800 | 7,192 (51.2%) | 38 (0.5%) |
| $800 to $1,499 | 2,348 (16.7%) | 2,823 (38.6%) |
| $800 to $1,499 | 1,337 (9.5%) | 2,132 (29.1%) |
| Total | 14,042 (100.0%) | 7,322 (100.0%) |
Health & Disability in Orangeburg County
Health Insurance Coverage by Age in Orangeburg County
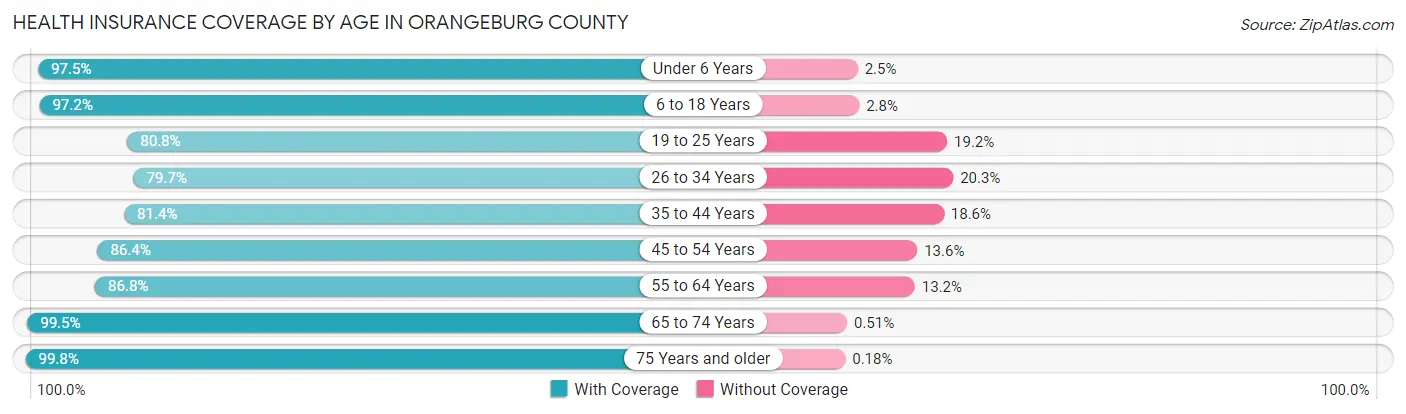
| Age Bracket | With Coverage | Without Coverage |
| Under 6 Years | 4,982 (97.5%) | 128 (2.5%) |
| 6 to 18 Years | 14,130 (97.2%) | 404 (2.8%) |
| 19 to 25 Years | 7,070 (80.8%) | 1,677 (19.2%) |
| 26 to 34 Years | 6,804 (79.7%) | 1,734 (20.3%) |
| 35 to 44 Years | 7,059 (81.4%) | 1,610 (18.6%) |
| 45 to 54 Years | 8,129 (86.4%) | 1,280 (13.6%) |
| 55 to 64 Years | 10,179 (86.8%) | 1,542 (13.2%) |
| 65 to 74 Years | 9,966 (99.5%) | 51 (0.5%) |
| 75 Years and older | 6,592 (99.8%) | 12 (0.2%) |
| Total | 74,911 (89.9%) | 8,438 (10.1%) |
Health Insurance Coverage by Citizenship Status in Orangeburg County
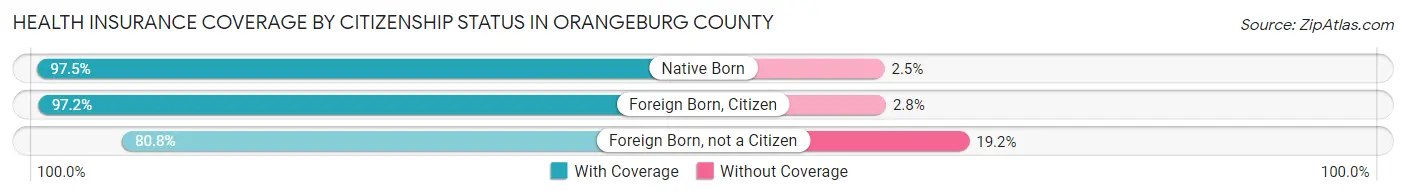
| Citizenship Status | With Coverage | Without Coverage |
| Native Born | 4,982 (97.5%) | 128 (2.5%) |
| Foreign Born, Citizen | 14,130 (97.2%) | 404 (2.8%) |
| Foreign Born, not a Citizen | 7,070 (80.8%) | 1,677 (19.2%) |
Health Insurance Coverage by Household Income in Orangeburg County
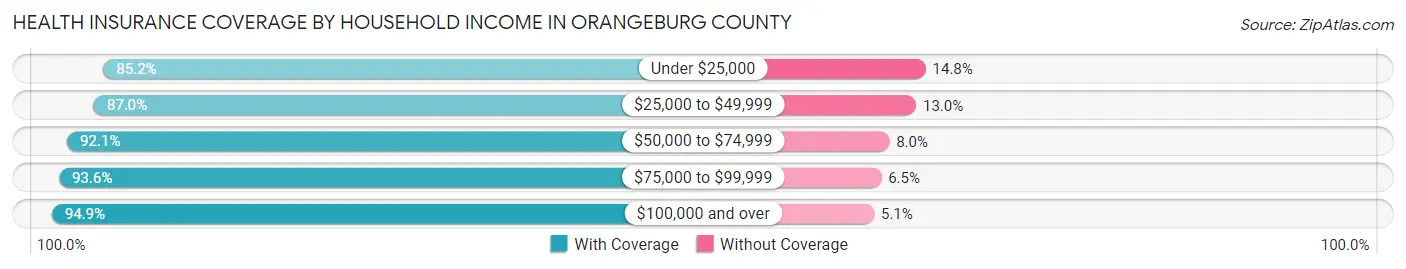
| Household Income | With Coverage | Without Coverage |
| Under $25,000 | 16,054 (85.2%) | 2,781 (14.8%) |
| $25,000 to $49,999 | 18,230 (87.0%) | 2,720 (13.0%) |
| $50,000 to $74,999 | 12,495 (92.0%) | 1,079 (8.0%) |
| $75,000 to $99,999 | 10,065 (93.5%) | 694 (6.5%) |
| $100,000 and over | 15,786 (94.9%) | 849 (5.1%) |
Public vs Private Health Insurance Coverage by Age in Orangeburg County
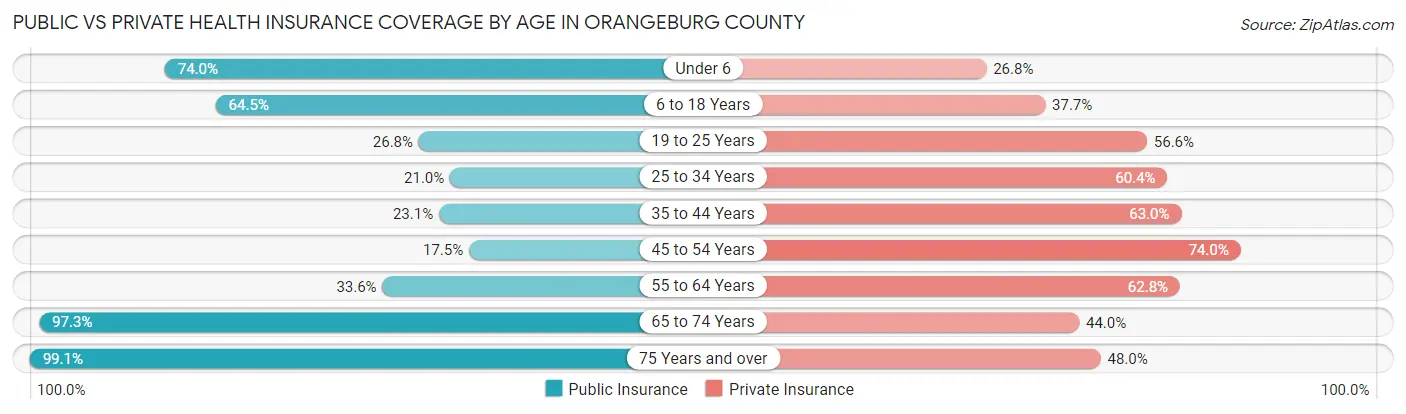
| Age Bracket | Public Insurance | Private Insurance |
| Under 6 | 3,780 (74.0%) | 1,370 (26.8%) |
| 6 to 18 Years | 9,379 (64.5%) | 5,485 (37.7%) |
| 19 to 25 Years | 2,346 (26.8%) | 4,953 (56.6%) |
| 25 to 34 Years | 1,795 (21.0%) | 5,160 (60.4%) |
| 35 to 44 Years | 2,001 (23.1%) | 5,462 (63.0%) |
| 45 to 54 Years | 1,647 (17.5%) | 6,966 (74.0%) |
| 55 to 64 Years | 3,936 (33.6%) | 7,355 (62.7%) |
| 65 to 74 Years | 9,748 (97.3%) | 4,411 (44.0%) |
| 75 Years and over | 6,541 (99.1%) | 3,172 (48.0%) |
| Total | 41,173 (49.4%) | 44,334 (53.2%) |
Disability Status by Sex by Age in Orangeburg County
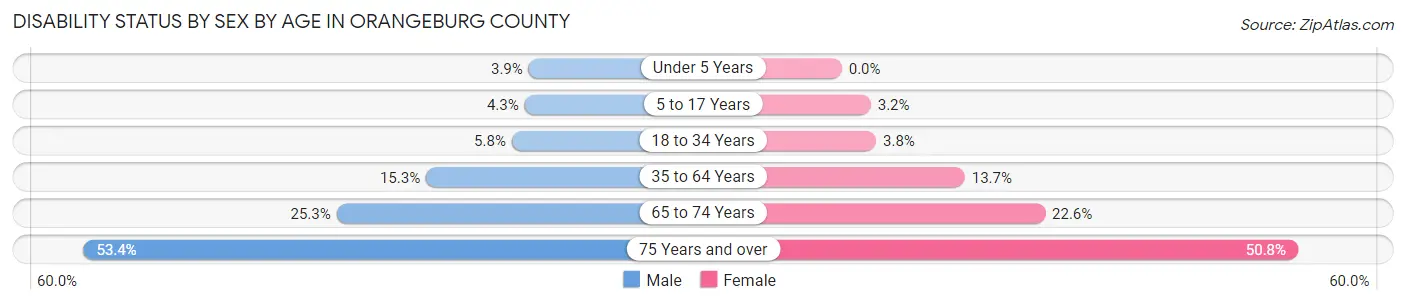
| Age Bracket | Male | Female |
| Under 5 Years | 86 (3.9%) | 0 (0.0%) |
| 5 to 17 Years | 301 (4.3%) | 218 (3.2%) |
| 18 to 34 Years | 510 (5.8%) | 379 (3.8%) |
| 35 to 64 Years | 2,112 (15.3%) | 2,191 (13.7%) |
| 65 to 74 Years | 1,156 (25.3%) | 1,232 (22.6%) |
| 75 Years and over | 1,467 (53.4%) | 1,960 (50.8%) |
Disability Class by Sex by Age in Orangeburg County
Disability Class: Hearing Difficulty
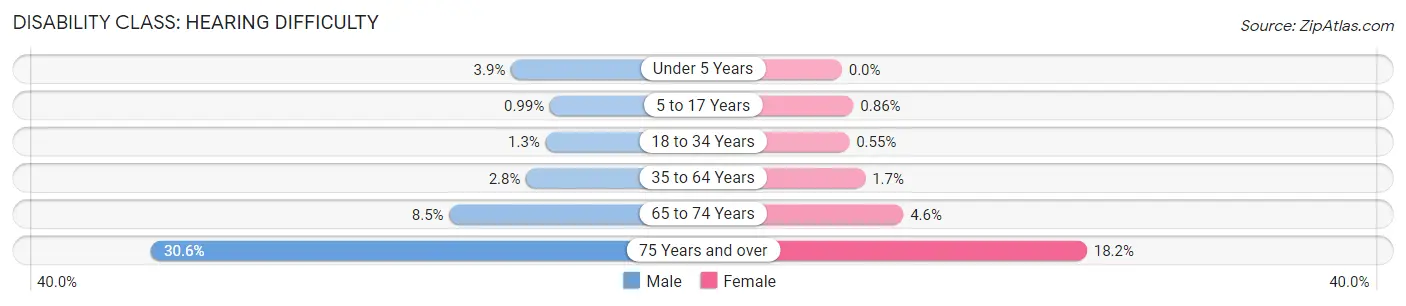
| Age Bracket | Male | Female |
| Under 5 Years | 86 (3.9%) | 0 (0.0%) |
| 5 to 17 Years | 69 (1.0%) | 58 (0.9%) |
| 18 to 34 Years | 116 (1.3%) | 55 (0.5%) |
| 35 to 64 Years | 380 (2.8%) | 278 (1.7%) |
| 65 to 74 Years | 387 (8.5%) | 248 (4.6%) |
| 75 Years and over | 840 (30.6%) | 702 (18.2%) |
Disability Class: Vision Difficulty
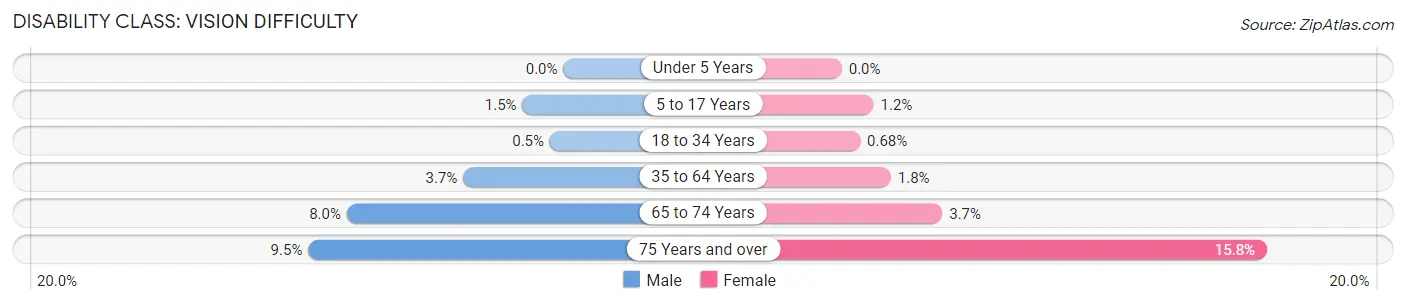
| Age Bracket | Male | Female |
| Under 5 Years | 0 (0.0%) | 0 (0.0%) |
| 5 to 17 Years | 106 (1.5%) | 80 (1.2%) |
| 18 to 34 Years | 44 (0.5%) | 67 (0.7%) |
| 35 to 64 Years | 514 (3.7%) | 291 (1.8%) |
| 65 to 74 Years | 368 (8.0%) | 203 (3.7%) |
| 75 Years and over | 260 (9.5%) | 609 (15.8%) |
Disability Class: Cognitive Difficulty
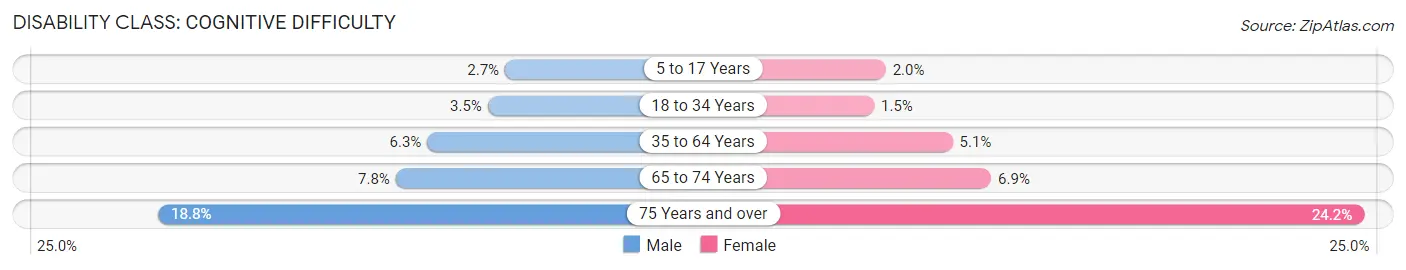
| Age Bracket | Male | Female |
| 5 to 17 Years | 189 (2.7%) | 138 (2.0%) |
| 18 to 34 Years | 311 (3.5%) | 149 (1.5%) |
| 35 to 64 Years | 872 (6.3%) | 822 (5.1%) |
| 65 to 74 Years | 356 (7.8%) | 377 (6.9%) |
| 75 Years and over | 516 (18.8%) | 935 (24.2%) |
Disability Class: Ambulatory Difficulty
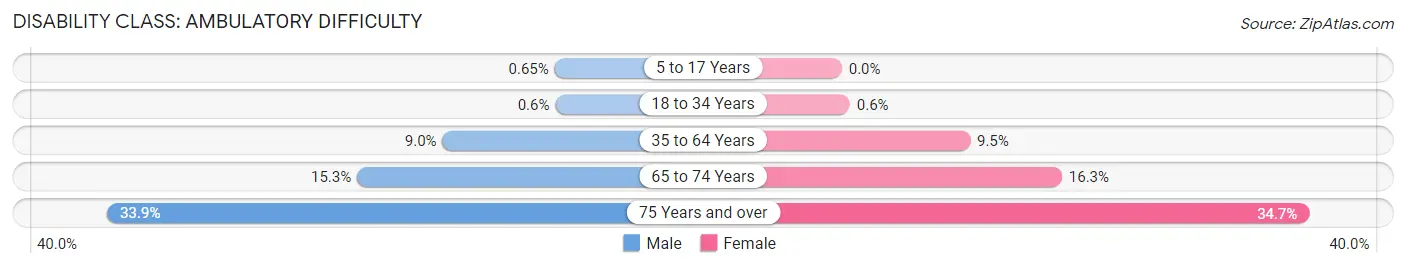
| Age Bracket | Male | Female |
| 5 to 17 Years | 45 (0.6%) | 0 (0.0%) |
| 18 to 34 Years | 53 (0.6%) | 60 (0.6%) |
| 35 to 64 Years | 1,240 (9.0%) | 1,522 (9.5%) |
| 65 to 74 Years | 701 (15.3%) | 889 (16.3%) |
| 75 Years and over | 930 (33.9%) | 1,339 (34.7%) |
Disability Class: Self-Care Difficulty
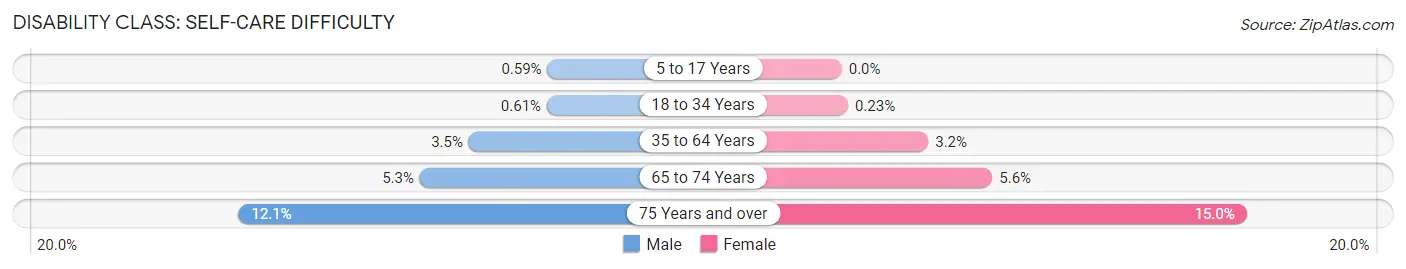
| Age Bracket | Male | Female |
| 5 to 17 Years | 41 (0.6%) | 0 (0.0%) |
| 18 to 34 Years | 54 (0.6%) | 23 (0.2%) |
| 35 to 64 Years | 484 (3.5%) | 514 (3.2%) |
| 65 to 74 Years | 244 (5.3%) | 304 (5.6%) |
| 75 Years and over | 331 (12.1%) | 580 (15.0%) |
Technology Access in Orangeburg County
Computing Device Access in Orangeburg County
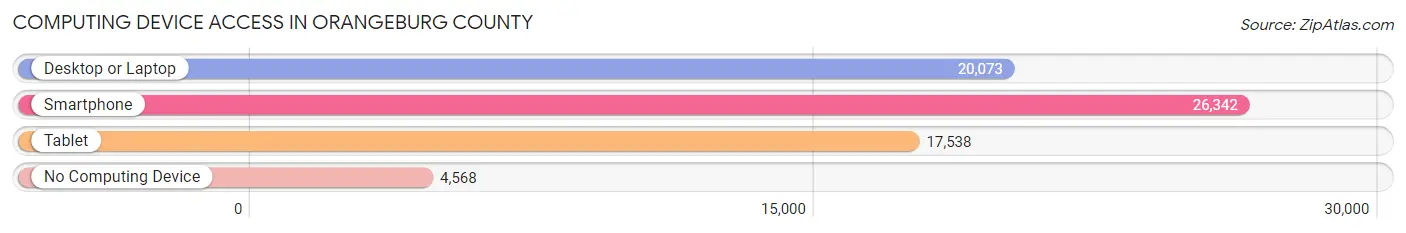
| Device Type | # Households | % Households |
| Desktop or Laptop | 20,073 | 61.4% |
| Smartphone | 26,342 | 80.6% |
| Tablet | 17,538 | 53.6% |
| No Computing Device | 4,568 | 14.0% |
| Total | 32,687 | 100.0% |
Internet Access in Orangeburg County
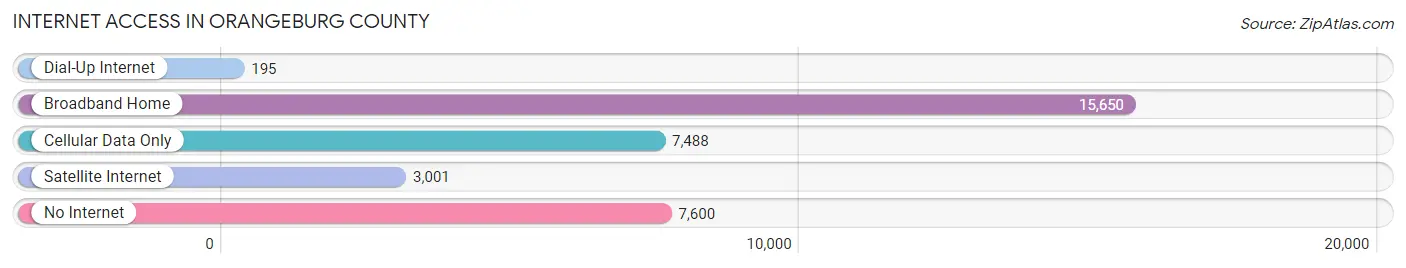
| Internet Type | # Households | % Households |
| Dial-Up Internet | 195 | 0.6% |
| Broadband Home | 15,650 | 47.9% |
| Cellular Data Only | 7,488 | 22.9% |
| Satellite Internet | 3,001 | 9.2% |
| No Internet | 7,600 | 23.3% |
| Total | 32,687 | 100.0% |
Orangeburg County Summary
Orangeburg County, South Carolina is located in the central part of the state, and is part of the Midlands region. It is bordered by Calhoun, Bamberg, and Dorchester counties to the north, Colleton County to the east, and Clarendon and Sumter counties to the south. The county seat is Orangeburg, and the county is home to a population of 92,501 people, according to the 2010 census.
History
Orangeburg County was formed in 1769 from the western part of the original Craven County. It was named for William IV, Prince of Orange, who later became King William III of England. The county was originally part of the colonial Province of South Carolina, and was one of the original seven counties of the state.
During the American Revolution, Orangeburg County was the site of several battles, including the Battle of Eutaw Springs in 1781. After the war, the county was divided into several smaller counties, including Bamberg, Calhoun, and Dorchester.
In the 19th century, Orangeburg County was a major center of cotton production, and the county was home to several large plantations. The county was also the site of several Civil War battles, including the Battle of Orangeburg in 1865.
Geography
Orangeburg County is located in the central part of South Carolina, and is part of the Midlands region. It is bordered by Calhoun, Bamberg, and Dorchester counties to the north, Colleton County to the east, and Clarendon and Sumter counties to the south. The county covers an area of 845 square miles, and is home to a population of 92,501 people, according to the 2010 census.
The county is mostly rural, with the majority of the population living in small towns and villages. The largest city in the county is Orangeburg, which is the county seat. Other towns and villages include Branchville, Elloree, Holly Hill, and Santee.
The terrain of Orangeburg County is mostly flat, with some rolling hills in the northern part of the county. The Edisto River runs through the county, and there are several small lakes and ponds. The climate is humid subtropical, with hot, humid summers and mild winters.
Economy
Orangeburg County has a diverse economy, with a mix of manufacturing, agriculture, and services. The county is home to several large manufacturing companies, including Sonoco Products Company, which produces paper and packaging products, and the Orangeburg-Calhoun Technical College, which provides technical and vocational training.
Agriculture is also an important part of the county's economy, with the main crops being cotton, soybeans, corn, and peanuts. The county is also home to several large poultry farms, and is a major producer of eggs and poultry products.
The county is also home to several large retail stores, including Walmart, Lowe's, and Target. The county is also home to several colleges and universities, including South Carolina State University, Claflin University, and Orangeburg-Calhoun Technical College.
Demographics
As of the 2010 census, Orangeburg County had a population of 92,501 people. The racial makeup of the county was 57.3% African American, 37.7% White, 0.5% Native American, 0.7% Asian, 0.1% Pacific Islander, and 3.7% from other races. Hispanic or Latino of any race were 2.2% of the population.
The median household income in the county was $35,945, and the median family income was $44,919. The per capita income was $17,945. About 22.2% of the population was below the poverty line.
Common Questions
What is Per Capita Income in Orangeburg County?
Per Capita income in Orangeburg County is $23,636.
What is the Median Family Income in Orangeburg County?
Median Family Income in Orangeburg County is $53,849.
What is the Median Household income in Orangeburg County?
Median Household Income in Orangeburg County is $41,020.
What is Income or Wage Gap in Orangeburg County?
Income or Wage Gap in Orangeburg County is 20.0%.
Women in Orangeburg County earn 80.0 cents for every dollar earned by a man.
What is Family Income Deficit in Orangeburg County?
Family Income Deficit in Orangeburg County is $11,278.
Families that are below poverty line in Orangeburg County earn $11,278 less on average than the poverty threshold level.
What is Inequality or Gini Index in Orangeburg County?
Inequality or Gini Index in Orangeburg County is 0.48.
What is the Total Population of Orangeburg County?
Total Population of Orangeburg County is 84,159.
What is the Total Male Population of Orangeburg County?
Total Male Population of Orangeburg County is 39,563.
What is the Total Female Population of Orangeburg County?
Total Female Population of Orangeburg County is 44,596.
What is the Ratio of Males per 100 Females in Orangeburg County?
There are 88.71 Males per 100 Females in Orangeburg County.
What is the Ratio of Females per 100 Males in Orangeburg County?
There are 112.72 Females per 100 Males in Orangeburg County.
What is the Median Population Age in Orangeburg County?
Median Population Age in Orangeburg County is 40.5 Years.
What is the Average Family Size in Orangeburg County
Average Family Size in Orangeburg County is 3.2 People.
What is the Average Household Size in Orangeburg County
Average Household Size in Orangeburg County is 2.5 People.
How Large is the Labor Force in Orangeburg County?
There are 35,906 People in the Labor Forcein in Orangeburg County.
What is the Percentage of People in the Labor Force in Orangeburg County?
53.0% of People are in the Labor Force in Orangeburg County.
What is the Unemployment Rate in Orangeburg County?
Unemployment Rate in Orangeburg County is 9.2%.