Cities with the Largest Cambodian Community in the United States
RELATED REPORTS & OPTIONS
Cambodian
United States
Compare Cities
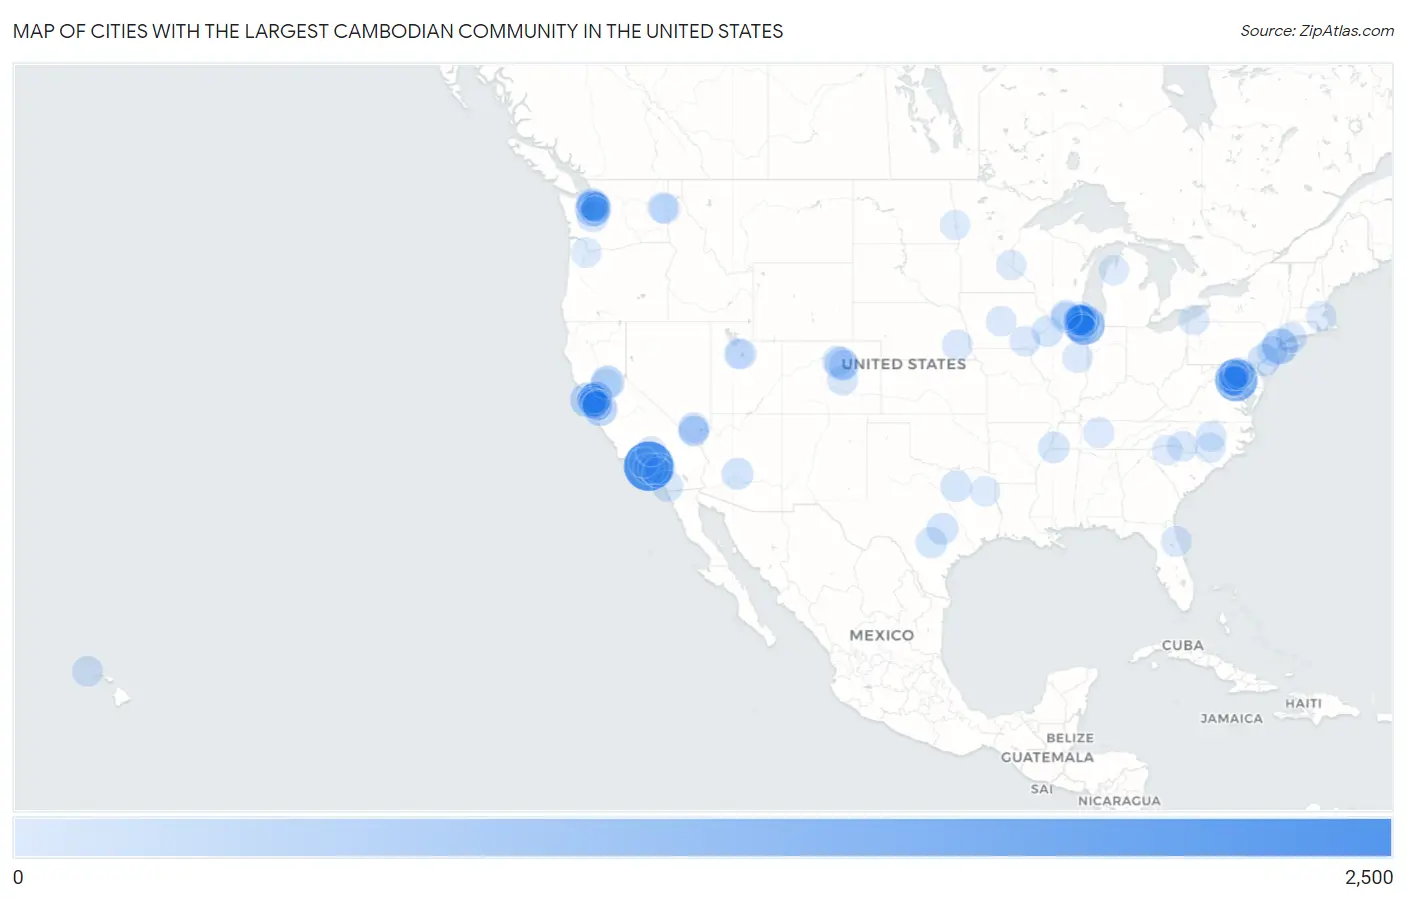
Map of Cities with the Largest Cambodian Community in the United States
0
2,500
Cities with the Largest Cambodian Community in the United States
| City | Cambodian | vs State | vs National | |
| 1. | Los Angeles | 2,204 | 8,150(27.04%)#1 | 33,559(6.57%)#1 |
| 2. | Arlington | 1,402 | 2,791(50.23%)#1 | 33,559(4.18%)#2 |
| 3. | Chicago | 1,087 | 6,404(16.97%)#1 | 33,559(3.24%)#3 |
| 4. | New York | 624 | 885(70.51%)#1 | 33,559(1.86%)#4 |
| 5. | Seattle | 558 | 2,565(21.75%)#1 | 33,559(1.66%)#5 |
| 6. | San Francisco | 538 | 8,150(6.60%)#2 | 33,559(1.60%)#6 |
| 7. | San Jose | 507 | 8,150(6.22%)#3 | 33,559(1.51%)#7 |
| 8. | Oakland | 429 | 8,150(5.26%)#4 | 33,559(1.28%)#8 |
| 9. | Roseville | 421 | 8,150(5.17%)#5 | 33,559(1.25%)#9 |
| 10. | Edmonds | 413 | 2,565(16.10%)#2 | 33,559(1.23%)#10 |
| 11. | Mount Prospect | 364 | 6,404(5.68%)#2 | 33,559(1.08%)#11 |
| 12. | Sicklerville | 363 | 1,274(28.49%)#1 | 33,559(1.08%)#12 |
| 13. | Denver | 348 | 1,071(32.49%)#1 | 33,559(1.04%)#13 |
| 14. | Alameda | 316 | 8,150(3.88%)#6 | 33,559(0.94%)#14 |
| 15. | Glenview | 274 | 6,404(4.28%)#3 | 33,559(0.82%)#15 |
| 16. | Philadelphia | 263 | 930(28.28%)#1 | 33,559(0.78%)#16 |
| 17. | Walnut Creek | 247 | 8,150(3.03%)#7 | 33,559(0.74%)#17 |
| 18. | Elk Grove Village | 233 | 6,404(3.64%)#4 | 33,559(0.69%)#18 |
| 19. | Gaithersburg | 230 | 842(27.32%)#1 | 33,559(0.69%)#19 |
| 20. | Pleasant Hill | 224 | 8,150(2.75%)#8 | 33,559(0.67%)#20 |
| 21. | Federal Way | 214 | 2,565(8.34%)#3 | 33,559(0.64%)#21 |
| 22. | Skokie | 213 | 6,404(3.33%)#5 | 33,559(0.63%)#22 |
| 23. | Phoenix | 206 | 341(60.41%)#1 | 33,559(0.61%)#23 |
| 24. | Austin | 197 | 1,061(18.57%)#1 | 33,559(0.59%)#24 |
| 25. | Niles | 193 | 6,404(3.01%)#6 | 33,559(0.58%)#25 |
| 26. | Schaumburg | 192 | 6,404(3.00%)#7 | 33,559(0.57%)#26 |
| 27. | Vernon Hills | 180 | 6,404(2.81%)#8 | 33,559(0.54%)#27 |
| 28. | San Antonio | 178 | 1,061(16.78%)#2 | 33,559(0.53%)#28 |
| 29. | Mcnair | 178 | 2,791(6.38%)#2 | 33,559(0.53%)#29 |
| 30. | Naperville | 175 | 6,404(2.73%)#9 | 33,559(0.52%)#30 |
| 31. | Shoreline | 175 | 2,565(6.82%)#4 | 33,559(0.52%)#31 |
| 32. | Rolling Meadows | 169 | 6,404(2.64%)#10 | 33,559(0.50%)#32 |
| 33. | Memphis | 166 | 367(45.23%)#1 | 33,559(0.49%)#33 |
| 34. | Rockford | 163 | 6,404(2.55%)#11 | 33,559(0.49%)#34 |
| 35. | Dallas | 162 | 1,061(15.27%)#3 | 33,559(0.48%)#35 |
| 36. | East Moline | 155 | 6,404(2.42%)#12 | 33,559(0.46%)#36 |
| 37. | San Diego | 152 | 8,150(1.87%)#9 | 33,559(0.45%)#37 |
| 38. | Hoffman Estates | 145 | 6,404(2.26%)#13 | 33,559(0.43%)#38 |
| 39. | Redondo Beach | 142 | 8,150(1.74%)#10 | 33,559(0.42%)#39 |
| 40. | Westminster | 141 | 1,071(13.17%)#2 | 33,559(0.42%)#40 |
| 41. | Arlington Heights | 139 | 6,404(2.17%)#14 | 33,559(0.41%)#41 |
| 42. | San Leandro | 134 | 8,150(1.64%)#11 | 33,559(0.40%)#42 |
| 43. | Daly City | 132 | 8,150(1.62%)#12 | 33,559(0.39%)#43 |
| 44. | Corona | 127 | 8,150(1.56%)#13 | 33,559(0.38%)#44 |
| 45. | Fair Oaks | 127 | 2,791(4.55%)#3 | 33,559(0.38%)#45 |
| 46. | Centreville | 124 | 2,791(4.44%)#4 | 33,559(0.37%)#46 |
| 47. | Colorado Springs | 120 | 1,071(11.20%)#3 | 33,559(0.36%)#47 |
| 48. | Fremont | 115 | 8,150(1.41%)#14 | 33,559(0.34%)#48 |
| 49. | Bridgeport | 115 | 342(33.63%)#1 | 33,559(0.34%)#49 |
| 50. | Urban Honolulu | 114 | 293(38.91%)#1 | 33,559(0.34%)#50 |
| 51. | Brentwood | 113 | 367(30.79%)#2 | 33,559(0.34%)#51 |
| 52. | Lincoln | 111 | 195(56.92%)#1 | 33,559(0.33%)#52 |
| 53. | Lynnwood | 110 | 2,565(4.29%)#5 | 33,559(0.33%)#53 |
| 54. | Saratoga Springs | 105 | 499(21.04%)#1 | 33,559(0.31%)#54 |
| 55. | Spokane | 102 | 2,565(3.98%)#6 | 33,559(0.30%)#55 |
| 56. | Aurora | 101 | 1,071(9.43%)#4 | 33,559(0.30%)#56 |
| 57. | Merrifield | 101 | 2,791(3.62%)#5 | 33,559(0.30%)#57 |
| 58. | Fairfield | 101 | 219(46.12%)#1 | 33,559(0.30%)#58 |
| 59. | Champaign | 100 | 6,404(1.56%)#15 | 33,559(0.30%)#59 |
| 60. | Three Bridges | 100 | 1,274(7.85%)#2 | 33,559(0.30%)#60 |
| 61. | Palm Coast | 97 | 390(24.87%)#1 | 33,559(0.29%)#61 |
| 62. | Bolingbrook | 95 | 6,404(1.48%)#16 | 33,559(0.28%)#62 |
| 63. | Franklin Park | 91 | 1,274(7.14%)#3 | 33,559(0.27%)#63 |
| 64. | Mantua | 91 | 2,791(3.26%)#6 | 33,559(0.27%)#64 |
| 65. | Sierra Ridge | 91 | 1,071(8.50%)#5 | 33,559(0.27%)#65 |
| 66. | Spring Valley | 89 | 309(28.80%)#1 | 33,559(0.27%)#66 |
| 67. | Albany | 88 | 8,150(1.08%)#15 | 33,559(0.26%)#67 |
| 68. | Las Vegas | 86 | 309(27.83%)#2 | 33,559(0.26%)#68 |
| 69. | Cary | 86 | 645(13.33%)#1 | 33,559(0.26%)#69 |
| 70. | Buena Park | 86 | 8,150(1.06%)#16 | 33,559(0.26%)#70 |
| 71. | Spokane Valley | 85 | 2,565(3.31%)#7 | 33,559(0.25%)#71 |
| 72. | Orland Park | 83 | 6,404(1.30%)#17 | 33,559(0.25%)#72 |
| 73. | Antelope | 82 | 8,150(1.01%)#17 | 33,559(0.24%)#73 |
| 74. | Enterprise | 81 | 309(26.21%)#3 | 33,559(0.24%)#74 |
| 75. | Alexandria | 81 | 2,791(2.90%)#7 | 33,559(0.24%)#75 |
| 76. | Charlotte | 79 | 645(12.25%)#2 | 33,559(0.24%)#76 |
| 77. | Bothell | 79 | 2,565(3.08%)#8 | 33,559(0.24%)#77 |
| 78. | Ames | 78 | 219(35.62%)#2 | 33,559(0.23%)#78 |
| 79. | Simi Valley | 76 | 8,150(0.93%)#18 | 33,559(0.23%)#79 |
| 80. | Woodbury | 76 | 270(28.15%)#1 | 33,559(0.23%)#80 |
| 81. | Longview | 75 | 1,061(7.07%)#4 | 33,559(0.22%)#81 |
| 82. | Ellicott City | 75 | 842(8.91%)#2 | 33,559(0.22%)#82 |
| 83. | Machesney Park | 73 | 6,404(1.14%)#18 | 33,559(0.22%)#83 |
| 84. | Brookline | 72 | 665(10.83%)#1 | 33,559(0.21%)#84 |
| 85. | Chums Corner | 72 | 282(25.53%)#1 | 33,559(0.21%)#85 |
| 86. | Mountain View | 71 | 8,150(0.87%)#19 | 33,559(0.21%)#86 |
| 87. | Redmond | 71 | 2,565(2.77%)#9 | 33,559(0.21%)#87 |
| 88. | Newark | 70 | 8,150(0.86%)#20 | 33,559(0.21%)#88 |
| 89. | Fayetteville | 69 | 645(10.70%)#3 | 33,559(0.21%)#89 |
| 90. | Eagle Mountain | 69 | 499(13.83%)#2 | 33,559(0.21%)#90 |
| 91. | Cedar Hills | 69 | 281(24.56%)#1 | 33,559(0.21%)#91 |
| 92. | Foster City | 66 | 8,150(0.81%)#21 | 33,559(0.20%)#92 |
| 93. | Germantown | 65 | 842(7.72%)#3 | 33,559(0.19%)#93 |
| 94. | Columbia | 63 | 842(7.48%)#4 | 33,559(0.19%)#94 |
| 95. | Newcastle | 63 | 2,565(2.46%)#10 | 33,559(0.19%)#95 |
| 96. | Irvine | 62 | 8,150(0.76%)#22 | 33,559(0.18%)#96 |
| 97. | Fargo | 62 | 80(77.50%)#1 | 33,559(0.18%)#97 |
| 98. | Rosamond | 62 | 8,150(0.76%)#23 | 33,559(0.18%)#98 |
| 99. | Spartanburg | 61 | 166(36.75%)#1 | 33,559(0.18%)#99 |
| 100. | Erie | 60 | 930(6.45%)#2 | 33,559(0.18%)#100 |
Common Questions
What are the Top 10 Cities with the Largest Cambodian Community in the United States?
Top 10 Cities with the Largest Cambodian Community in the United States are:
What city has the Largest Cambodian Community in the United States?
Los Angeles has the Largest Cambodian Community in the United States with 2,204.
What is the Total Cambodian Population in the United States?
Total Cambodian Population in the United States is 33,559.