Cities with the Most Immigrants from West Indies in the United States
RELATED REPORTS & OPTIONS
West Indies
United States
Compare Cities
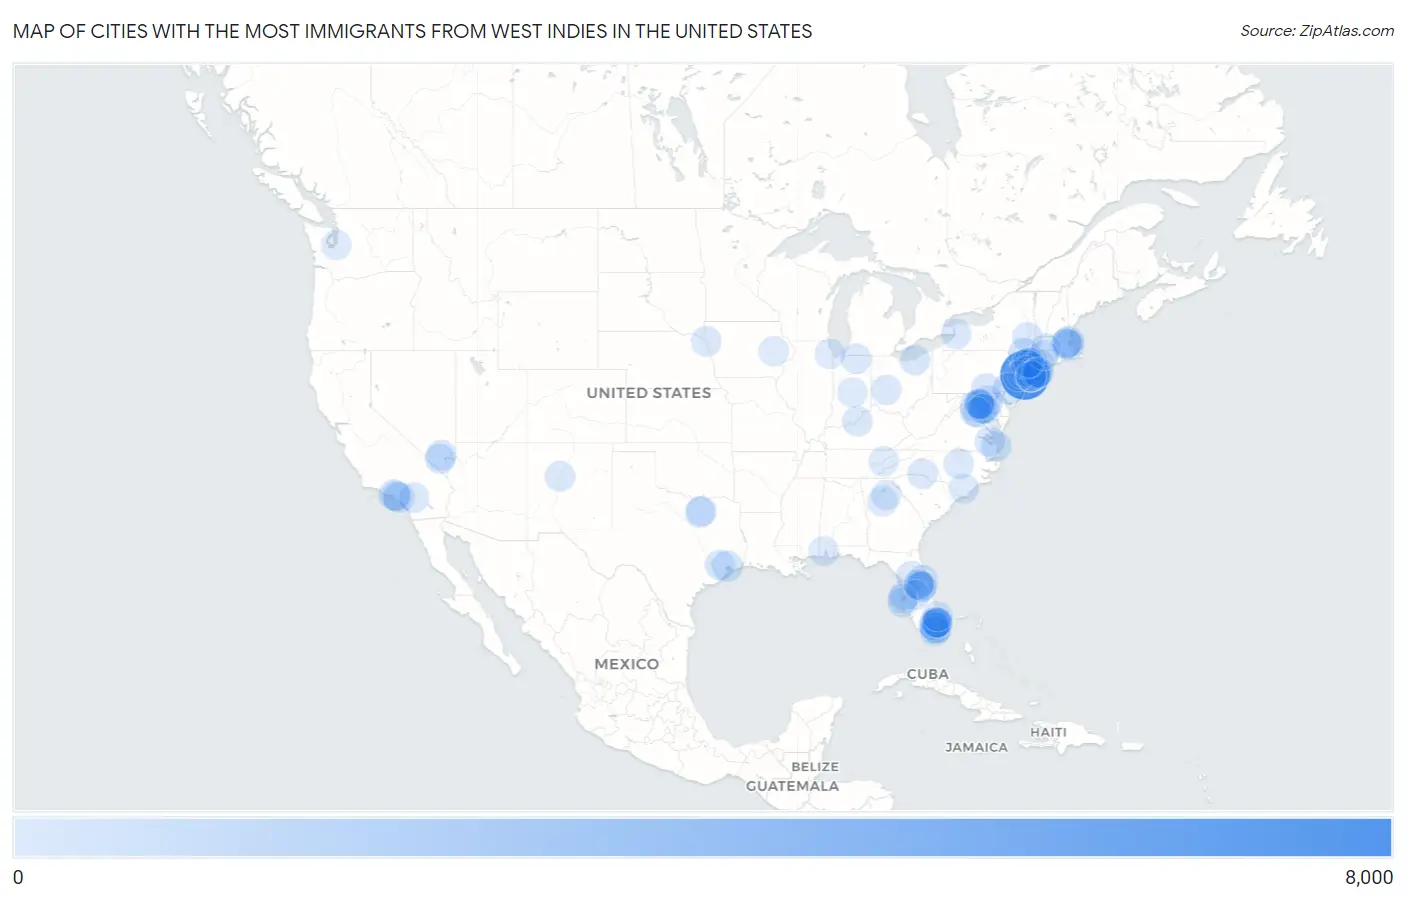
Map of Cities with the Most Immigrants from West Indies in the United States
0
8,000
Cities with the Most Immigrants from West Indies in the United States
| City | West Indies | vs State | vs National | |
| 1. | New York | 6,103 | 8,227(74.18%)#1 | 20,386(29.94%)#1 |
| 2. | Philadelphia | 488 | 797(61.23%)#1 | 20,386(2.39%)#2 |
| 3. | Tillson | 441 | 8,227(5.36%)#2 | 20,386(2.16%)#3 |
| 4. | Baltimore | 384 | 920(41.74%)#1 | 20,386(1.88%)#4 |
| 5. | Los Angeles | 311 | 1,019(30.52%)#1 | 20,386(1.53%)#5 |
| 6. | Lynn | 293 | 925(31.68%)#1 | 20,386(1.44%)#6 |
| 7. | Buena Park | 276 | 1,019(27.09%)#2 | 20,386(1.35%)#7 |
| 8. | Baytown | 274 | 962(28.48%)#1 | 20,386(1.34%)#8 |
| 9. | Freeport | 258 | 8,227(3.14%)#3 | 20,386(1.27%)#9 |
| 10. | Stamford | 257 | 811(31.69%)#1 | 20,386(1.26%)#10 |
| 11. | Boston | 209 | 925(22.59%)#2 | 20,386(1.03%)#11 |
| 12. | Cleveland | 167 | 228(73.25%)#1 | 20,386(0.82%)#12 |
| 13. | Virginia Beach | 161 | 767(20.99%)#1 | 20,386(0.79%)#13 |
| 14. | Sunrise | 152 | 2,367(6.42%)#1 | 20,386(0.75%)#14 |
| 15. | Chelsea | 152 | 925(16.43%)#3 | 20,386(0.75%)#15 |
| 16. | Trumbull Center | 143 | 811(17.63%)#2 | 20,386(0.70%)#16 |
| 17. | Mount Vernon | 128 | 8,227(1.56%)#4 | 20,386(0.63%)#17 |
| 18. | York | 124 | 797(15.56%)#2 | 20,386(0.61%)#18 |
| 19. | Bergenfield Borough | 124 | 753(16.47%)#1 | 20,386(0.61%)#19 |
| 20. | Newport News | 111 | 767(14.47%)#2 | 20,386(0.54%)#20 |
| 21. | Buffalo | 106 | 8,227(1.29%)#5 | 20,386(0.52%)#21 |
| 22. | Hallandale Beach | 106 | 2,367(4.48%)#2 | 20,386(0.52%)#22 |
| 23. | Albuquerque | 100 | 100(100.00%)#1 | 20,386(0.49%)#23 |
| 24. | Shively | 99 | 99(100.00%)#1 | 20,386(0.49%)#24 |
| 25. | Milford City Balance | 92 | 811(11.34%)#3 | 20,386(0.45%)#25 |
| 26. | Rockville Centre | 92 | 8,227(1.12%)#6 | 20,386(0.45%)#26 |
| 27. | Houston | 91 | 962(9.46%)#2 | 20,386(0.45%)#27 |
| 28. | Albany | 87 | 8,227(1.06%)#7 | 20,386(0.43%)#28 |
| 29. | Danbury | 87 | 811(10.73%)#4 | 20,386(0.43%)#29 |
| 30. | Tampa | 86 | 2,367(3.63%)#3 | 20,386(0.42%)#30 |
| 31. | Coral Springs | 85 | 2,367(3.59%)#4 | 20,386(0.42%)#31 |
| 32. | Sioux City | 84 | 124(67.74%)#1 | 20,386(0.41%)#32 |
| 33. | East Orange | 84 | 753(11.16%)#2 | 20,386(0.41%)#33 |
| 34. | East Riverdale | 83 | 920(9.02%)#2 | 20,386(0.41%)#34 |
| 35. | Ashburn | 82 | 767(10.69%)#3 | 20,386(0.40%)#35 |
| 36. | Roosevelt | 79 | 8,227(0.96%)#8 | 20,386(0.39%)#36 |
| 37. | North Las Vegas | 78 | 210(37.14%)#1 | 20,386(0.38%)#37 |
| 38. | North Lauderdale | 76 | 2,367(3.21%)#5 | 20,386(0.37%)#38 |
| 39. | Englewood | 74 | 753(9.83%)#3 | 20,386(0.36%)#39 |
| 40. | Westbury | 74 | 8,227(0.90%)#9 | 20,386(0.36%)#40 |
| 41. | Cambridge | 71 | 925(7.68%)#4 | 20,386(0.35%)#41 |
| 42. | Carrollton | 70 | 962(7.28%)#3 | 20,386(0.34%)#42 |
| 43. | Westview | 69 | 2,367(2.92%)#6 | 20,386(0.34%)#43 |
| 44. | Gastonia | 67 | 254(26.38%)#1 | 20,386(0.33%)#44 |
| 45. | Manassas | 66 | 767(8.60%)#4 | 20,386(0.32%)#45 |
| 46. | North Amityville | 66 | 8,227(0.80%)#10 | 20,386(0.32%)#46 |
| 47. | Pompano Beach | 65 | 2,367(2.75%)#7 | 20,386(0.32%)#47 |
| 48. | Springfield | 64 | 925(6.92%)#5 | 20,386(0.31%)#48 |
| 49. | Plainfield | 62 | 753(8.23%)#4 | 20,386(0.30%)#49 |
| 50. | Roselle Park Borough | 62 | 753(8.23%)#5 | 20,386(0.30%)#50 |
| 51. | Springfield | 61 | 228(26.75%)#2 | 20,386(0.30%)#51 |
| 52. | Silver Springs Shores | 61 | 2,367(2.58%)#8 | 20,386(0.30%)#52 |
| 53. | Beaumont | 59 | 1,019(5.79%)#3 | 20,386(0.29%)#53 |
| 54. | Orlando | 57 | 2,367(2.41%)#9 | 20,386(0.28%)#54 |
| 55. | Lynwood | 57 | 1,019(5.59%)#4 | 20,386(0.28%)#55 |
| 56. | Centereach | 56 | 8,227(0.68%)#11 | 20,386(0.27%)#56 |
| 57. | Peekskill | 56 | 8,227(0.68%)#12 | 20,386(0.27%)#57 |
| 58. | Lake Arbor | 56 | 920(6.09%)#3 | 20,386(0.27%)#58 |
| 59. | Lauderdale Lakes | 55 | 2,367(2.32%)#10 | 20,386(0.27%)#59 |
| 60. | Goshen | 53 | 109(48.62%)#1 | 20,386(0.26%)#60 |
| 61. | Raleigh | 52 | 254(20.47%)#2 | 20,386(0.26%)#61 |
| 62. | North Potomac | 52 | 920(5.65%)#4 | 20,386(0.26%)#62 |
| 63. | Paradise | 51 | 210(24.29%)#2 | 20,386(0.25%)#63 |
| 64. | Deltona | 51 | 2,367(2.15%)#11 | 20,386(0.25%)#64 |
| 65. | Country Club | 50 | 2,367(2.11%)#12 | 20,386(0.25%)#65 |
| 66. | Westwood Lakes | 50 | 2,367(2.11%)#13 | 20,386(0.25%)#66 |
| 67. | Mobile | 49 | 111(44.14%)#1 | 20,386(0.24%)#67 |
| 68. | Aspen Hill | 49 | 920(5.33%)#5 | 20,386(0.24%)#68 |
| 69. | Coram | 48 | 8,227(0.58%)#13 | 20,386(0.24%)#69 |
| 70. | Conyers | 48 | 808(5.94%)#1 | 20,386(0.24%)#70 |
| 71. | Chicago | 47 | 114(41.23%)#1 | 20,386(0.23%)#71 |
| 72. | Alafaya | 47 | 2,367(1.99%)#14 | 20,386(0.23%)#72 |
| 73. | Germantown | 47 | 920(5.11%)#6 | 20,386(0.23%)#73 |
| 74. | Tacoma | 46 | 93(49.46%)#1 | 20,386(0.23%)#74 |
| 75. | Baldwin | 44 | 8,227(0.53%)#14 | 20,386(0.22%)#75 |
| 76. | Winder | 44 | 808(5.45%)#2 | 20,386(0.22%)#76 |
| 77. | South Apopka | 44 | 2,367(1.86%)#15 | 20,386(0.22%)#77 |
| 78. | Indianapolis | 43 | 109(39.45%)#2 | 20,386(0.21%)#78 |
| 79. | Bound Brook Borough | 43 | 753(5.71%)#6 | 20,386(0.21%)#79 |
| 80. | Vauxhall | 43 | 753(5.71%)#7 | 20,386(0.21%)#80 |
| 81. | Margate | 42 | 2,367(1.77%)#16 | 20,386(0.21%)#81 |
| 82. | Azalea Park | 42 | 2,367(1.77%)#17 | 20,386(0.21%)#82 |
| 83. | Clifton Heights Borough | 42 | 797(5.27%)#3 | 20,386(0.21%)#83 |
| 84. | Plano | 41 | 962(4.26%)#4 | 20,386(0.20%)#84 |
| 85. | Cedar Rapids | 40 | 124(32.26%)#2 | 20,386(0.20%)#85 |
| 86. | Weston | 40 | 2,367(1.69%)#18 | 20,386(0.20%)#86 |
| 87. | Central Islip | 40 | 8,227(0.49%)#15 | 20,386(0.20%)#87 |
| 88. | Hartford | 39 | 811(4.81%)#5 | 20,386(0.19%)#88 |
| 89. | Winter Haven | 39 | 2,367(1.65%)#19 | 20,386(0.19%)#89 |
| 90. | Lake Ridge | 39 | 767(5.08%)#5 | 20,386(0.19%)#90 |
| 91. | Mahopac | 39 | 8,227(0.47%)#16 | 20,386(0.19%)#91 |
| 92. | Knoxville | 38 | 83(45.78%)#1 | 20,386(0.19%)#92 |
| 93. | Deerfield Beach | 38 | 2,367(1.61%)#20 | 20,386(0.19%)#93 |
| 94. | Bradenton | 38 | 2,367(1.61%)#21 | 20,386(0.19%)#94 |
| 95. | Greenacres | 38 | 2,367(1.61%)#22 | 20,386(0.19%)#95 |
| 96. | Montgomery Village | 38 | 920(4.13%)#7 | 20,386(0.19%)#96 |
| 97. | East Arcadia | 38 | 254(14.96%)#3 | 20,386(0.19%)#97 |
| 98. | Washington | 37 | 37(100.00%)#1 | 20,386(0.18%)#98 |
| 99. | St Petersburg | 37 | 2,367(1.56%)#23 | 20,386(0.18%)#99 |
| 100. | Pine Hills | 37 | 2,367(1.56%)#24 | 20,386(0.18%)#100 |
Common Questions
What are the Top 10 Cities with the Most Immigrants from West Indies in the United States?
Top 10 Cities with the Most Immigrants from West Indies in the United States are:
What city has the Most Immigrants from West Indies in the United States?
New York has the Most Immigrants from West Indies in the United States with 6,103.
What is the Total Immigrants from West Indies in the United States?
Total Immigrants from West Indies in the United States is 20,386.