Chesterfield County, SC Map & Demographics
Chesterfield County Overview
$26,435
PER CAPITA INCOME
$59,486
AVG FAMILY INCOME
$46,326
AVG HOUSEHOLD INCOME
30.4%
WAGE / INCOME GAP [ % ]
69.6¢/ $1
WAGE / INCOME GAP [ $ ]
$10,344
FAMILY INCOME DEFICIT
0.47
INEQUALITY / GINI INDEX
43,536
TOTAL POPULATION
21,350
MALE POPULATION
22,186
FEMALE POPULATION
96.23
MALES / 100 FEMALES
103.92
FEMALES / 100 MALES
42.6
MEDIAN AGE
3.1
AVG FAMILY SIZE
2.5
AVG HOUSEHOLD SIZE
19,914
LABOR FORCE [ PEOPLE ]
56.8%
PERCENT IN LABOR FORCE
8.7%
UNEMPLOYMENT RATE
Chesterfield County Area Codes
Income in Chesterfield County
Income Overview in Chesterfield County
Per Capita Income in Chesterfield County is $26,435, while median incomes of families and households are $59,486 and $46,326 respectively.
| Characteristic | Number | Measure |
| Per Capita Income | 43,536 | $26,435 |
| Median Family Income | 11,081 | $59,486 |
| Mean Family Income | 11,081 | $73,587 |
| Median Household Income | 17,116 | $46,326 |
| Mean Household Income | 17,116 | $64,325 |
| Income Deficit | 11,081 | $10,344 |
| Wage / Income Gap (%) | 43,536 | 30.41% |
| Wage / Income Gap ($) | 43,536 | 69.59¢ per $1 |
| Gini / Inequality Index | 43,536 | 0.47 |
Earnings by Sex in Chesterfield County
Average Earnings in Chesterfield County are $33,719, $40,004 for men and $27,839 for women, a difference of 30.4%.
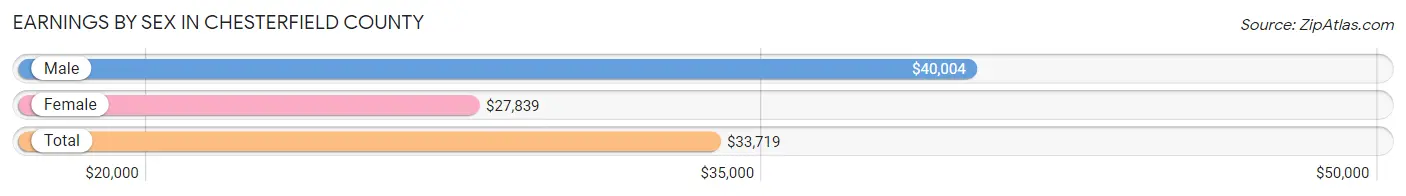
| Sex | Number | Average Earnings |
| Male | 11,228 (54.9%) | $40,004 |
| Female | 9,238 (45.1%) | $27,839 |
| Total | 20,466 (100.0%) | $33,719 |
Earnings by Sex by Income Bracket in Chesterfield County
The most common earnings brackets in Chesterfield County are $100,000+ for men (972 | 8.7%) and $25,000 to $29,999 for women (1,043 | 11.3%).
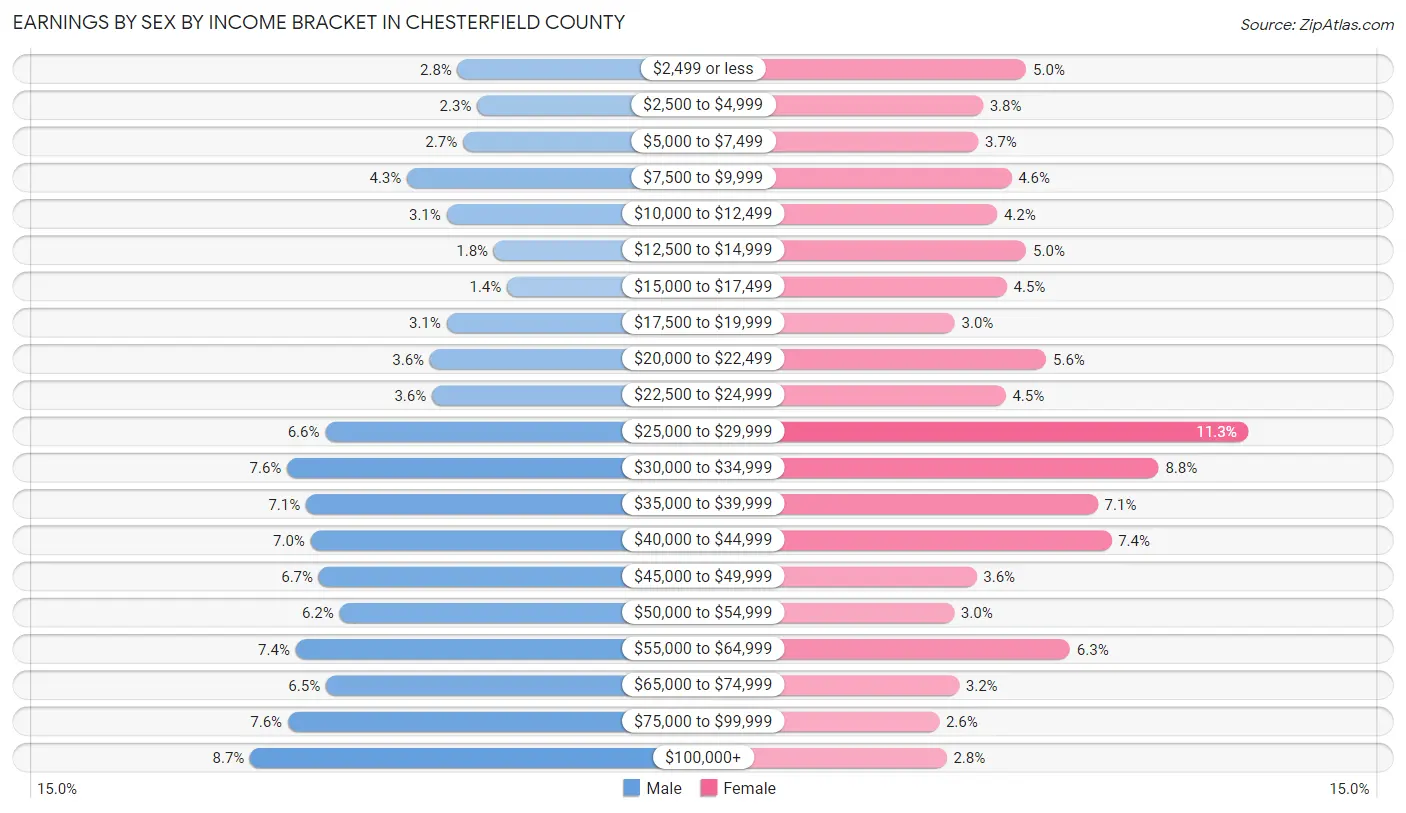
| Income | Male | Female |
| $2,499 or less | 318 (2.8%) | 466 (5.0%) |
| $2,500 to $4,999 | 256 (2.3%) | 353 (3.8%) |
| $5,000 to $7,499 | 301 (2.7%) | 341 (3.7%) |
| $7,500 to $9,999 | 477 (4.3%) | 427 (4.6%) |
| $10,000 to $12,499 | 352 (3.1%) | 390 (4.2%) |
| $12,500 to $14,999 | 203 (1.8%) | 466 (5.0%) |
| $15,000 to $17,499 | 162 (1.4%) | 415 (4.5%) |
| $17,500 to $19,999 | 353 (3.1%) | 280 (3.0%) |
| $20,000 to $22,499 | 405 (3.6%) | 517 (5.6%) |
| $22,500 to $24,999 | 399 (3.5%) | 412 (4.5%) |
| $25,000 to $29,999 | 735 (6.6%) | 1,043 (11.3%) |
| $30,000 to $34,999 | 856 (7.6%) | 809 (8.8%) |
| $35,000 to $39,999 | 796 (7.1%) | 651 (7.0%) |
| $40,000 to $44,999 | 782 (7.0%) | 686 (7.4%) |
| $45,000 to $49,999 | 756 (6.7%) | 336 (3.6%) |
| $50,000 to $54,999 | 690 (6.1%) | 278 (3.0%) |
| $55,000 to $64,999 | 829 (7.4%) | 579 (6.3%) |
| $65,000 to $74,999 | 733 (6.5%) | 291 (3.2%) |
| $75,000 to $99,999 | 853 (7.6%) | 239 (2.6%) |
| $100,000+ | 972 (8.7%) | 259 (2.8%) |
| Total | 11,228 (100.0%) | 9,238 (100.0%) |
Earnings by Sex by Educational Attainment in Chesterfield County
Average earnings in Chesterfield County are $42,691 for men and $29,988 for women, a difference of 29.8%. Men with an educational attainment of graduate degree enjoy the highest average annual earnings of $64,784, while those with less than high school education earn the least with $33,579. Women with an educational attainment of graduate degree earn the most with the average annual earnings of $59,107, while those with less than high school education have the smallest earnings of $14,215.
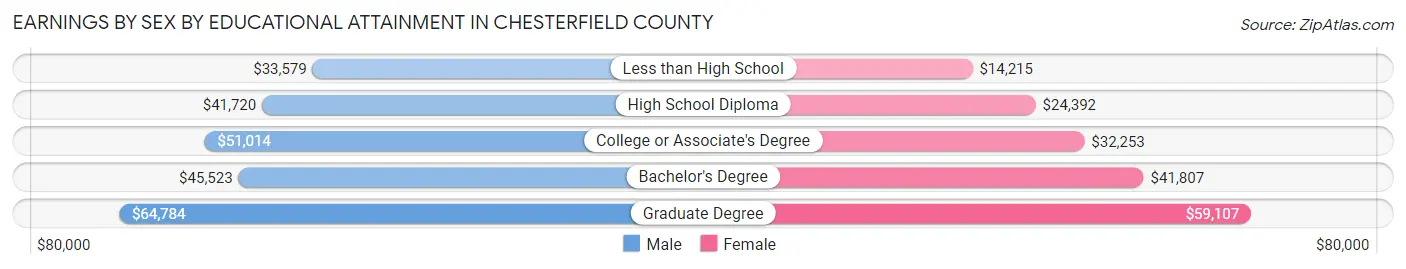
| Educational Attainment | Male Income | Female Income |
| Less than High School | $33,579 | $14,215 |
| High School Diploma | $41,720 | $24,392 |
| College or Associate's Degree | $51,014 | $32,253 |
| Bachelor's Degree | $45,523 | $41,807 |
| Graduate Degree | $64,784 | $59,107 |
| Total | $42,691 | $29,988 |
Family Income in Chesterfield County
Family Income Brackets in Chesterfield County
According to the Chesterfield County family income data, there are 1,972 families falling into the $35,000 to $49,999 income range, which is the most common income bracket and makes up 17.8% of all families. Conversely, the $200,000+ income bracket is the least frequent group with only 310 families (2.8%) belonging to this category.
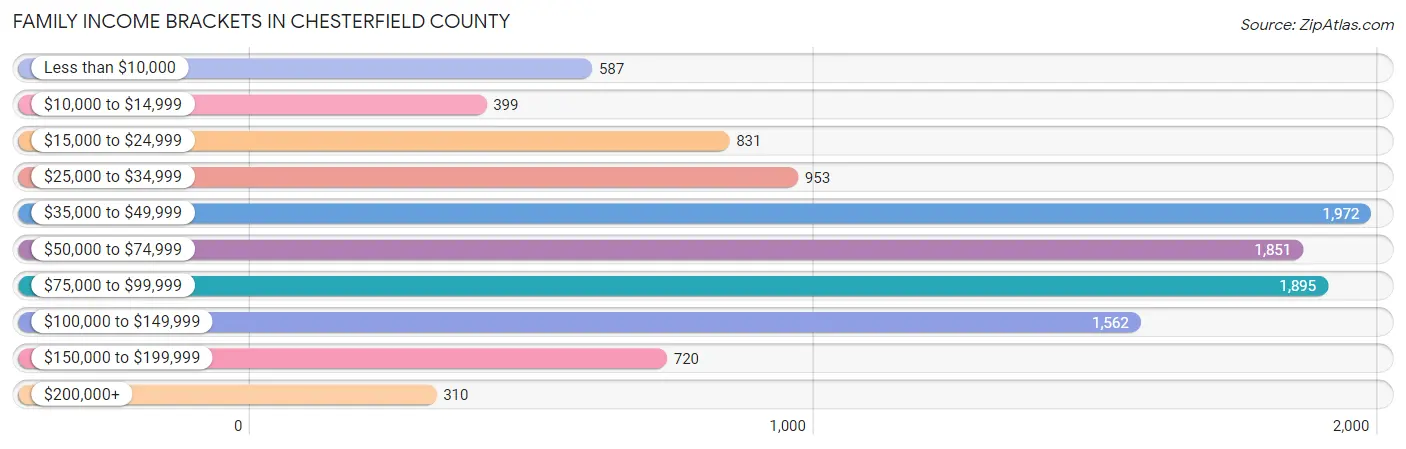
| Income Bracket | # Families | % Families |
| Less than $10,000 | 587 | 5.3% |
| $10,000 to $14,999 | 399 | 3.6% |
| $15,000 to $24,999 | 831 | 7.5% |
| $25,000 to $34,999 | 953 | 8.6% |
| $35,000 to $49,999 | 1,972 | 17.8% |
| $50,000 to $74,999 | 1,851 | 16.7% |
| $75,000 to $99,999 | 1,895 | 17.1% |
| $100,000 to $149,999 | 1,562 | 14.1% |
| $150,000 to $199,999 | 720 | 6.5% |
| $200,000+ | 310 | 2.8% |
Family Income by Famaliy Size in Chesterfield County
4-person families (1,924 | 17.4%) account for the highest median family income in Chesterfield County with $78,581 per family, while 2-person families (5,230 | 47.2%) have the highest median income of $23,302 per family member.
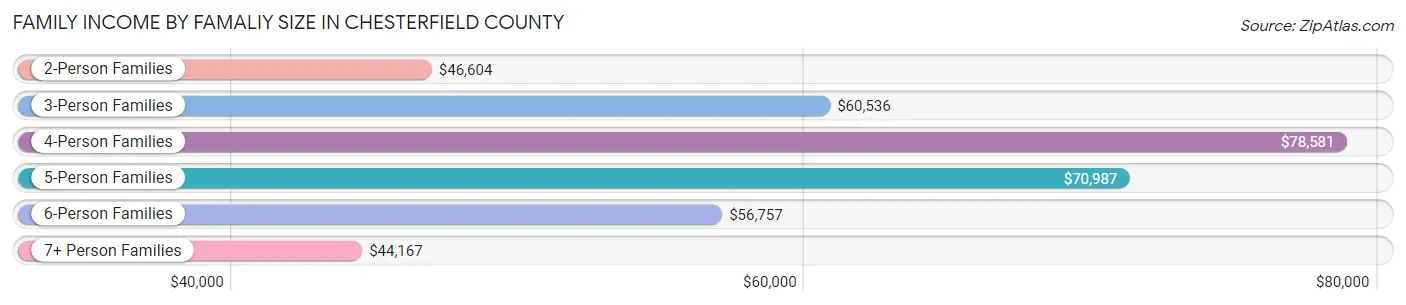
| Income Bracket | # Families | Median Income |
| 2-Person Families | 5,230 (47.2%) | $46,604 |
| 3-Person Families | 2,816 (25.4%) | $60,536 |
| 4-Person Families | 1,924 (17.4%) | $78,581 |
| 5-Person Families | 619 (5.6%) | $70,987 |
| 6-Person Families | 302 (2.7%) | $56,757 |
| 7+ Person Families | 190 (1.7%) | $44,167 |
| Total | 11,081 (100.0%) | $59,486 |
Family Income by Number of Earners in Chesterfield County
The median family income in Chesterfield County is $59,486, with families comprising 3+ earners (983) having the highest median family income of $111,908, while families with no earners (2,159) have the lowest median family income of $29,380, accounting for 8.9% and 19.5% of families, respectively.
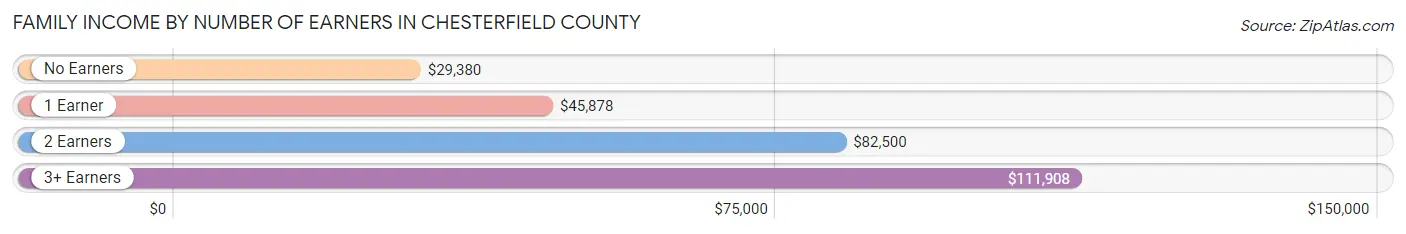
| Number of Earners | # Families | Median Income |
| No Earners | 2,159 (19.5%) | $29,380 |
| 1 Earner | 3,895 (35.1%) | $45,878 |
| 2 Earners | 4,044 (36.5%) | $82,500 |
| 3+ Earners | 983 (8.9%) | $111,908 |
| Total | 11,081 (100.0%) | $59,486 |
Household Income in Chesterfield County
Household Income Brackets in Chesterfield County
With 2,807 households falling in the category, the $50,000 to $74,999 income range is the most frequent in Chesterfield County, accounting for 16.4% of all households. In contrast, only 428 households (2.5%) fall into the $200,000+ income bracket, making it the least populous group.
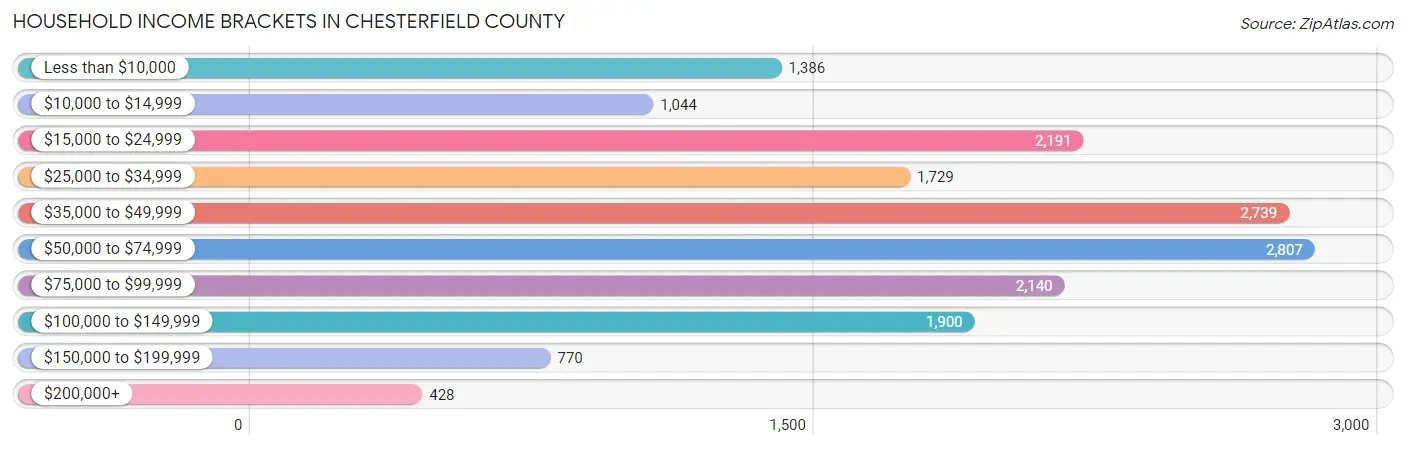
| Income Bracket | # Households | % Households |
| Less than $10,000 | 1,386 | 8.1% |
| $10,000 to $14,999 | 1,044 | 6.1% |
| $15,000 to $24,999 | 2,191 | 12.8% |
| $25,000 to $34,999 | 1,729 | 10.1% |
| $35,000 to $49,999 | 2,739 | 16.0% |
| $50,000 to $74,999 | 2,807 | 16.4% |
| $75,000 to $99,999 | 2,140 | 12.5% |
| $100,000 to $149,999 | 1,900 | 11.1% |
| $150,000 to $199,999 | 770 | 4.5% |
| $200,000+ | 428 | 2.5% |
Household Income by Householder Age in Chesterfield County
The median household income in Chesterfield County is $46,326, with the highest median household income of $57,784 found in the 25 to 44 years age bracket for the primary householder. A total of 4,342 households (25.4%) fall into this category. Meanwhile, the 65+ years age bracket for the primary householder has the lowest median household income of $38,577, with 5,052 households (29.5%) in this group.
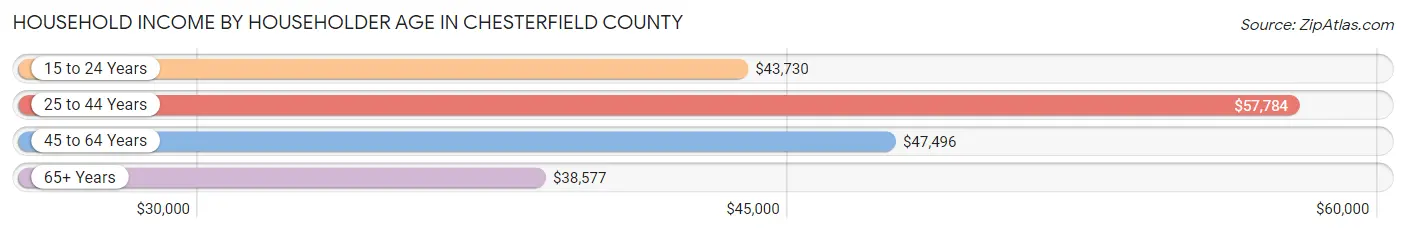
| Income Bracket | # Households | Median Income |
| 15 to 24 Years | 395 (2.3%) | $43,730 |
| 25 to 44 Years | 4,342 (25.4%) | $57,784 |
| 45 to 64 Years | 7,327 (42.8%) | $47,496 |
| 65+ Years | 5,052 (29.5%) | $38,577 |
| Total | 17,116 (100.0%) | $46,326 |
Poverty in Chesterfield County
Income Below Poverty by Sex and Age in Chesterfield County
With 19.2% poverty level for males and 21.4% for females among the residents of Chesterfield County, 15 year old males and 16 and 17 year old females are the most vulnerable to poverty, with 80 males (40.2%) and 183 females (42.5%) in their respective age groups living below the poverty level.
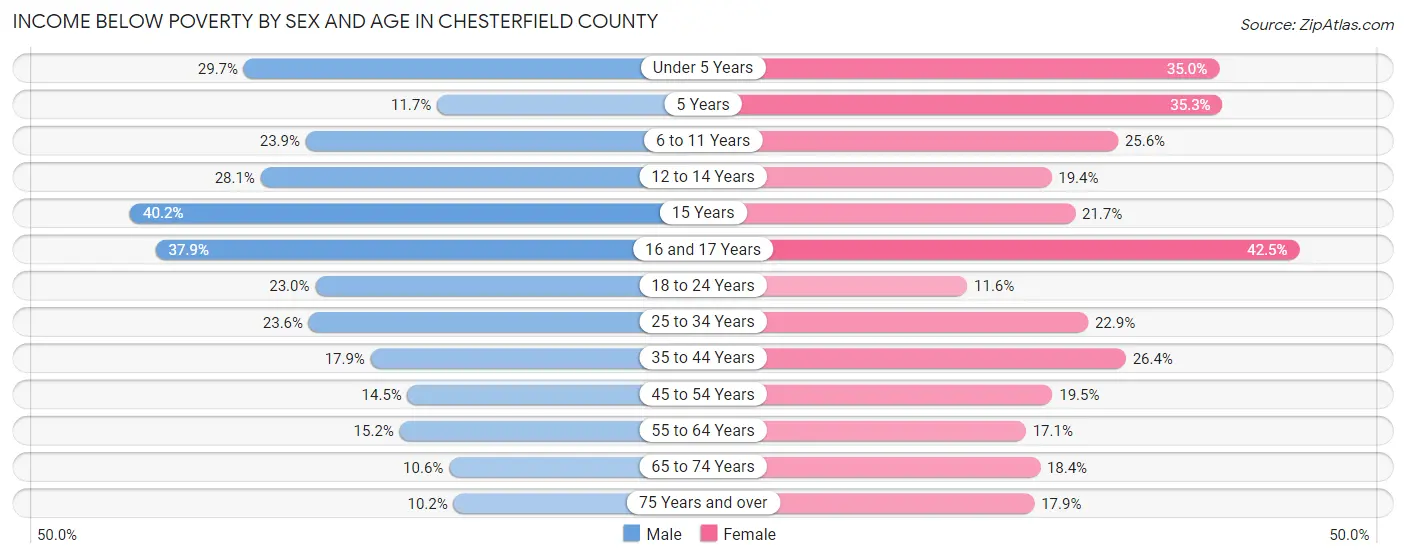
| Age Bracket | Male | Female |
| Under 5 Years | 349 (29.6%) | 382 (35.0%) |
| 5 Years | 32 (11.7%) | 83 (35.3%) |
| 6 to 11 Years | 365 (23.9%) | 485 (25.6%) |
| 12 to 14 Years | 252 (28.1%) | 133 (19.4%) |
| 15 Years | 80 (40.2%) | 76 (21.6%) |
| 16 and 17 Years | 260 (37.9%) | 183 (42.5%) |
| 18 to 24 Years | 410 (23.0%) | 196 (11.6%) |
| 25 to 34 Years | 607 (23.6%) | 595 (22.9%) |
| 35 to 44 Years | 396 (17.9%) | 646 (26.4%) |
| 45 to 54 Years | 453 (14.4%) | 581 (19.5%) |
| 55 to 64 Years | 460 (15.2%) | 540 (17.1%) |
| 65 to 74 Years | 248 (10.6%) | 495 (18.4%) |
| 75 Years and over | 121 (10.2%) | 310 (17.9%) |
| Total | 4,033 (19.2%) | 4,705 (21.4%) |
Income Above Poverty by Sex and Age in Chesterfield County
According to the poverty statistics in Chesterfield County, males aged 75 years and over and females aged 18 to 24 years are the age groups that are most secure financially, with 89.8% of males and 88.4% of females in these age groups living above the poverty line.
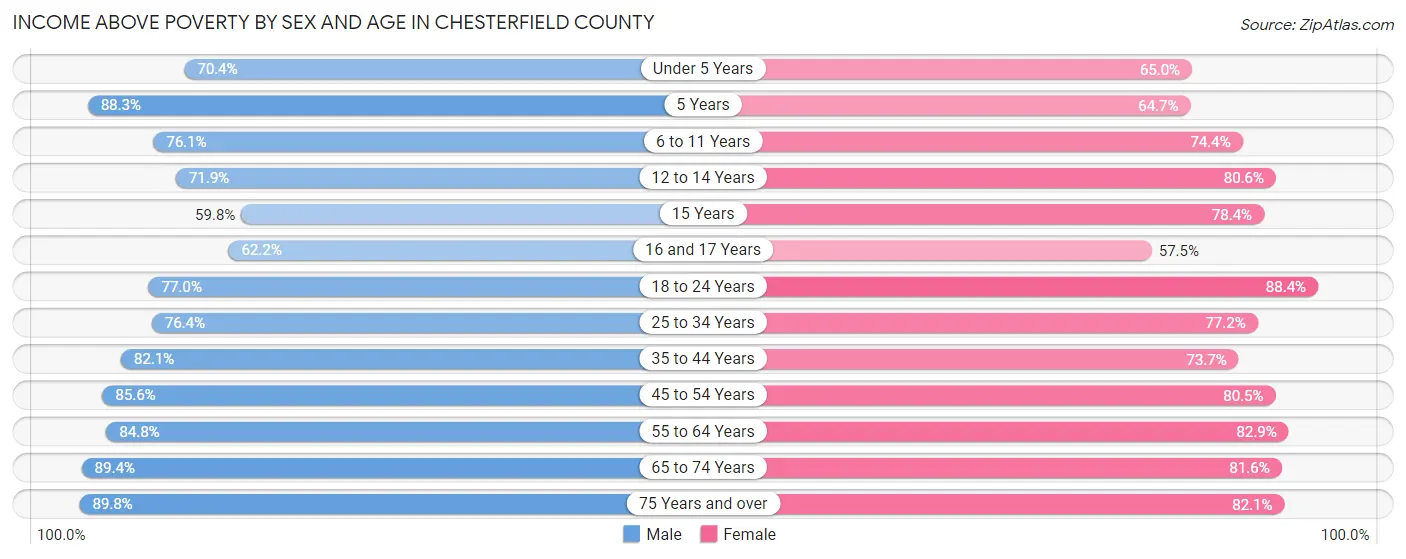
| Age Bracket | Male | Female |
| Under 5 Years | 828 (70.4%) | 709 (65.0%) |
| 5 Years | 241 (88.3%) | 152 (64.7%) |
| 6 to 11 Years | 1,162 (76.1%) | 1,407 (74.4%) |
| 12 to 14 Years | 645 (71.9%) | 551 (80.6%) |
| 15 Years | 119 (59.8%) | 275 (78.3%) |
| 16 and 17 Years | 427 (62.2%) | 248 (57.5%) |
| 18 to 24 Years | 1,371 (77.0%) | 1,490 (88.4%) |
| 25 to 34 Years | 1,963 (76.4%) | 2,009 (77.1%) |
| 35 to 44 Years | 1,819 (82.1%) | 1,806 (73.7%) |
| 45 to 54 Years | 2,682 (85.6%) | 2,393 (80.5%) |
| 55 to 64 Years | 2,568 (84.8%) | 2,624 (82.9%) |
| 65 to 74 Years | 2,092 (89.4%) | 2,196 (81.6%) |
| 75 Years and over | 1,067 (89.8%) | 1,426 (82.1%) |
| Total | 16,984 (80.8%) | 17,286 (78.6%) |
Income Below Poverty Among Married-Couple Families in Chesterfield County
The poverty statistics for married-couple families in Chesterfield County show that 8.7% or 635 of the total 7,308 families live below the poverty line. Families with 5 or more children have the highest poverty rate of 100.0%, comprising of 35 families. On the other hand, families with 1 or 2 children have the lowest poverty rate of 5.2%, which includes 113 families.
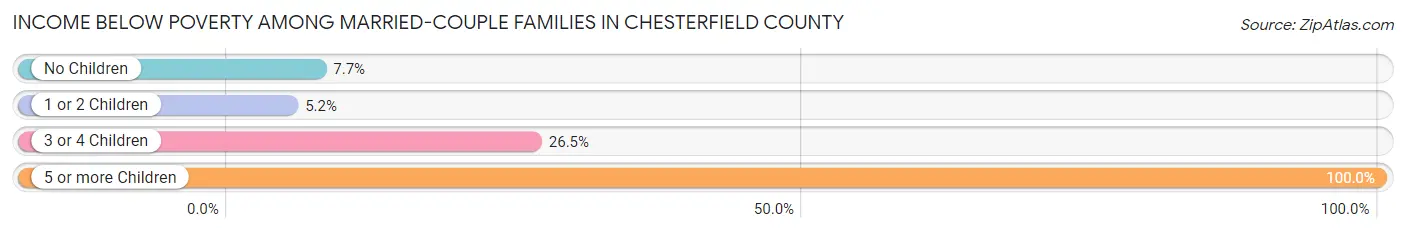
| Children | Above Poverty | Below Poverty |
| No Children | 4,261 (92.3%) | 355 (7.7%) |
| 1 or 2 Children | 2,045 (94.8%) | 113 (5.2%) |
| 3 or 4 Children | 367 (73.6%) | 132 (26.5%) |
| 5 or more Children | 0 (0.0%) | 35 (100.0%) |
| Total | 6,673 (91.3%) | 635 (8.7%) |
Income Below Poverty Among Single-Parent Households in Chesterfield County
According to the poverty data in Chesterfield County, 14.0% or 155 single-father households and 36.6% or 975 single-mother households are living below the poverty line. Among single-father households, those with 1 or 2 children have the highest poverty rate, with 120 households (23.0%) experiencing poverty. Likewise, among single-mother households, those with 3 or 4 children have the highest poverty rate, with 213 households (58.4%) falling below the poverty line.
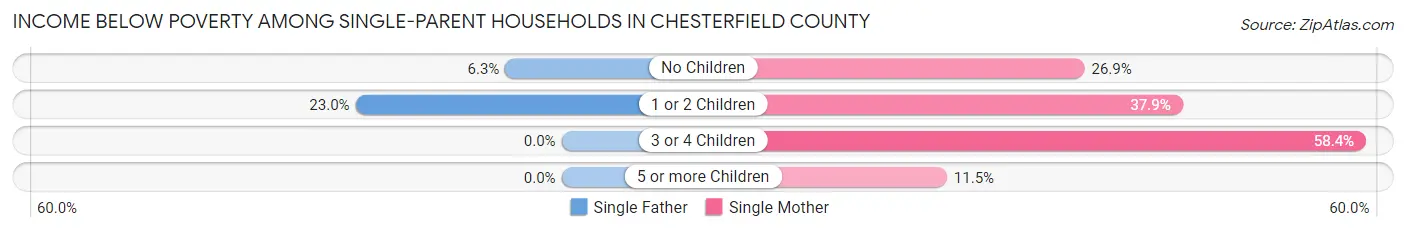
| Children | Single Father | Single Mother |
| No Children | 35 (6.3%) | 249 (26.9%) |
| 1 or 2 Children | 120 (23.0%) | 510 (37.9%) |
| 3 or 4 Children | 0 (0.0%) | 213 (58.4%) |
| 5 or more Children | 0 (0.0%) | 3 (11.5%) |
| Total | 155 (14.0%) | 975 (36.6%) |
Income Below Poverty Among Married-Couple vs Single-Parent Households in Chesterfield County
The poverty data for Chesterfield County shows that 635 of the married-couple family households (8.7%) and 1,130 of the single-parent households (29.9%) are living below the poverty level. Within the married-couple family households, those with 5 or more children have the highest poverty rate, with 35 households (100.0%) falling below the poverty line. Among the single-parent households, those with 3 or 4 children have the highest poverty rate, with 213 household (53.5%) living below poverty.
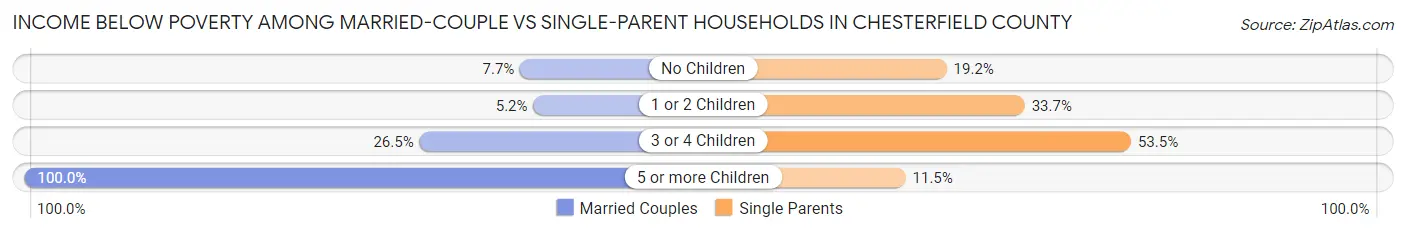
| Children | Married-Couple Families | Single-Parent Households |
| No Children | 355 (7.7%) | 284 (19.2%) |
| 1 or 2 Children | 113 (5.2%) | 630 (33.7%) |
| 3 or 4 Children | 132 (26.5%) | 213 (53.5%) |
| 5 or more Children | 35 (100.0%) | 3 (11.5%) |
| Total | 635 (8.7%) | 1,130 (29.9%) |
Race in Chesterfield County
The most populous races in Chesterfield County are White / Caucasian (26,955 | 61.9%), Black / African American (13,402 | 30.8%), and Two or more Races (2,221 | 5.1%).
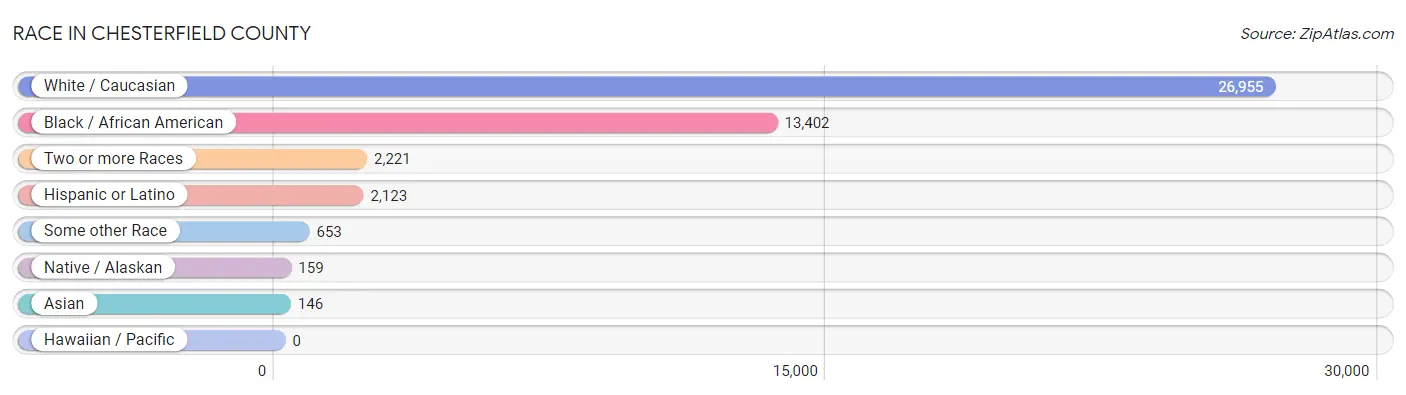
| Race | # Population | % Population |
| Asian | 146 | 0.3% |
| Black / African American | 13,402 | 30.8% |
| Hawaiian / Pacific | 0 | 0.0% |
| Hispanic or Latino | 2,123 | 4.9% |
| Native / Alaskan | 159 | 0.4% |
| White / Caucasian | 26,955 | 61.9% |
| Two or more Races | 2,221 | 5.1% |
| Some other Race | 653 | 1.5% |
| Total | 43,536 | 100.0% |
Ancestry in Chesterfield County
The most populous ancestries reported in Chesterfield County are English (4,432 | 10.2%), American (3,125 | 7.2%), Irish (2,425 | 5.6%), German (1,854 | 4.3%), and Mexican (1,599 | 3.7%), together accounting for 30.9% of all Chesterfield County residents.
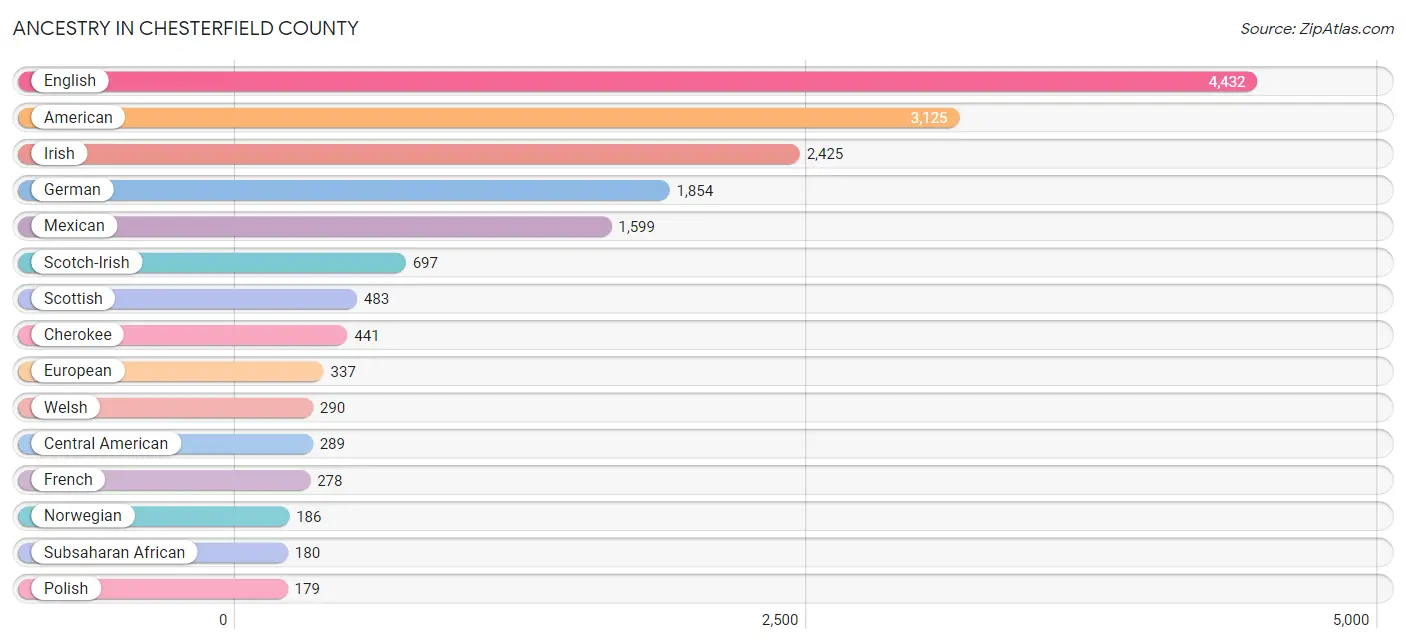
| Ancestry | # Population | % Population |
| African | 148 | 0.3% |
| Alaskan Athabascan | 42 | 0.1% |
| American | 3,125 | 7.2% |
| Austrian | 2 | 0.0% |
| Bhutanese | 21 | 0.1% |
| Blackfeet | 18 | 0.0% |
| British | 55 | 0.1% |
| Burmese | 18 | 0.0% |
| Central American | 289 | 0.7% |
| Central American Indian | 53 | 0.1% |
| Cherokee | 441 | 1.0% |
| Costa Rican | 56 | 0.1% |
| Cree | 25 | 0.1% |
| Cuban | 9 | 0.0% |
| Czech | 3 | 0.0% |
| Danish | 51 | 0.1% |
| Dominican | 7 | 0.0% |
| Dutch | 119 | 0.3% |
| Eastern European | 11 | 0.0% |
| English | 4,432 | 10.2% |
| European | 337 | 0.8% |
| Finnish | 4 | 0.0% |
| French | 278 | 0.6% |
| French Canadian | 9 | 0.0% |
| German | 1,854 | 4.3% |
| Guamanian / Chamorro | 19 | 0.0% |
| Guatemalan | 133 | 0.3% |
| Hungarian | 22 | 0.1% |
| Indian (Asian) | 19 | 0.0% |
| Iranian | 45 | 0.1% |
| Irish | 2,425 | 5.6% |
| Israeli | 5 | 0.0% |
| Italian | 152 | 0.4% |
| Jamaican | 9 | 0.0% |
| Korean | 146 | 0.3% |
| Lumbee | 176 | 0.4% |
| Malaysian | 46 | 0.1% |
| Mexican | 1,599 | 3.7% |
| Mexican American Indian | 40 | 0.1% |
| Native Hawaiian | 66 | 0.2% |
| Nicaraguan | 23 | 0.1% |
| Nigerian | 26 | 0.1% |
| Northern European | 58 | 0.1% |
| Norwegian | 186 | 0.4% |
| Paiute | 11 | 0.0% |
| Pennsylvania German | 11 | 0.0% |
| Polish | 179 | 0.4% |
| Portuguese | 61 | 0.1% |
| Puerto Rican | 140 | 0.3% |
| Romanian | 27 | 0.1% |
| Russian | 15 | 0.0% |
| Salvadoran | 77 | 0.2% |
| Scandinavian | 19 | 0.0% |
| Scotch-Irish | 697 | 1.6% |
| Scottish | 483 | 1.1% |
| Seminole | 21 | 0.1% |
| Sioux | 2 | 0.0% |
| Slovak | 9 | 0.0% |
| South African | 3 | 0.0% |
| South American | 2 | 0.0% |
| Spanish | 31 | 0.1% |
| Subsaharan African | 180 | 0.4% |
| Swedish | 14 | 0.0% |
| Swiss | 30 | 0.1% |
| Uruguayan | 2 | 0.0% |
| Welsh | 290 | 0.7% |
| Yugoslavian | 7 | 0.0% | View All 67 Rows |
Immigrants in Chesterfield County
The most numerous immigrant groups reported in Chesterfield County came from Latin America (997 | 2.3%), Central America (995 | 2.3%), Mexico (819 | 1.9%), Asia (148 | 0.3%), and Philippines (109 | 0.3%), together accounting for 7.1% of all Chesterfield County residents.
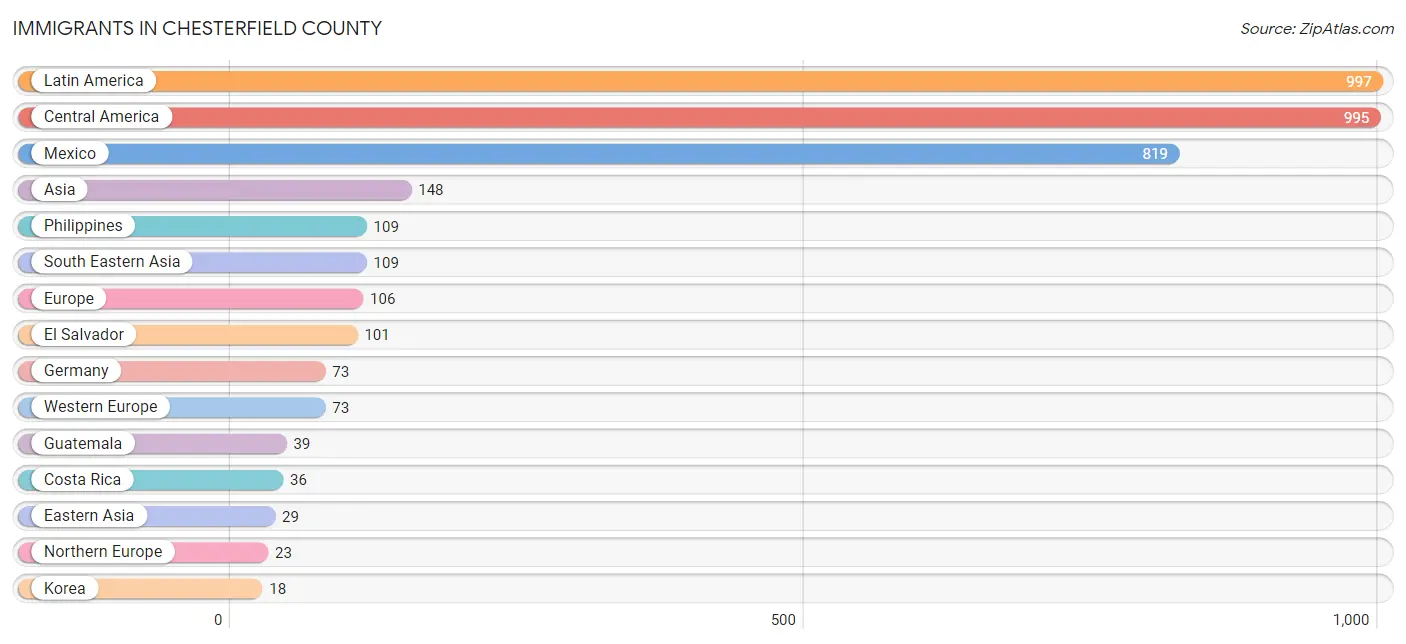
| Immigration Origin | # Population | % Population |
| Africa | 3 | 0.0% |
| Asia | 148 | 0.3% |
| Canada | 7 | 0.0% |
| Central America | 995 | 2.3% |
| China | 11 | 0.0% |
| Costa Rica | 36 | 0.1% |
| Denmark | 5 | 0.0% |
| Eastern Asia | 29 | 0.1% |
| Eastern Europe | 10 | 0.0% |
| El Salvador | 101 | 0.2% |
| Europe | 106 | 0.2% |
| Germany | 73 | 0.2% |
| Guatemala | 39 | 0.1% |
| Korea | 18 | 0.0% |
| Latin America | 997 | 2.3% |
| Mexico | 819 | 1.9% |
| Moldova | 10 | 0.0% |
| Northern Europe | 23 | 0.1% |
| Philippines | 109 | 0.3% |
| South Africa | 3 | 0.0% |
| South America | 2 | 0.0% |
| South Central Asia | 10 | 0.0% |
| South Eastern Asia | 109 | 0.3% |
| Taiwan | 9 | 0.0% |
| Uruguay | 2 | 0.0% |
| Uzbekistan | 10 | 0.0% |
| Western Europe | 73 | 0.2% | View All 27 Rows |
Sex and Age in Chesterfield County
Sex and Age in Chesterfield County
The most populous age groups in Chesterfield County are 55 to 59 Years (1,913 | 9.0%) for men and 60 to 64 Years (1,719 | 7.7%) for women.
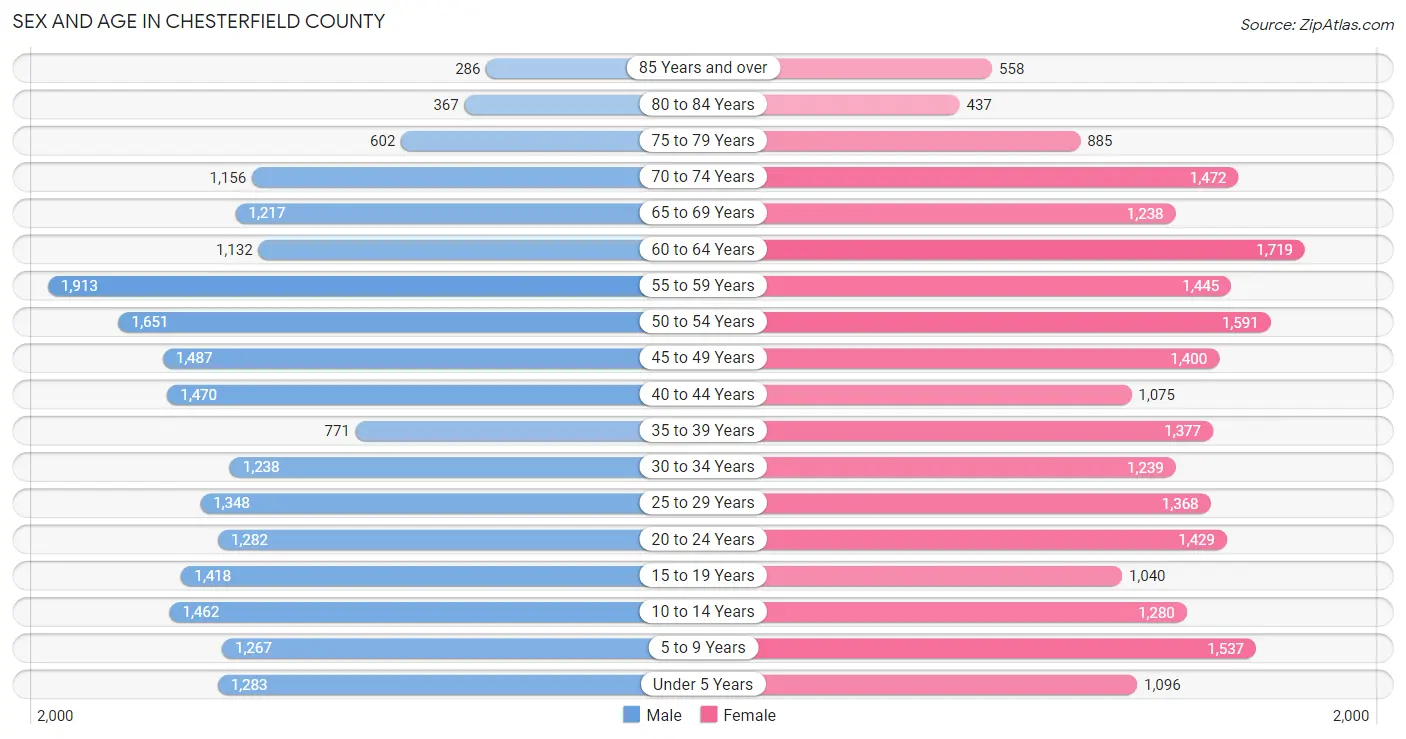
| Age Bracket | Male | Female |
| Under 5 Years | 1,283 (6.0%) | 1,096 (4.9%) |
| 5 to 9 Years | 1,267 (5.9%) | 1,537 (6.9%) |
| 10 to 14 Years | 1,462 (6.9%) | 1,280 (5.8%) |
| 15 to 19 Years | 1,418 (6.6%) | 1,040 (4.7%) |
| 20 to 24 Years | 1,282 (6.0%) | 1,429 (6.4%) |
| 25 to 29 Years | 1,348 (6.3%) | 1,368 (6.2%) |
| 30 to 34 Years | 1,238 (5.8%) | 1,239 (5.6%) |
| 35 to 39 Years | 771 (3.6%) | 1,377 (6.2%) |
| 40 to 44 Years | 1,470 (6.9%) | 1,075 (4.9%) |
| 45 to 49 Years | 1,487 (7.0%) | 1,400 (6.3%) |
| 50 to 54 Years | 1,651 (7.7%) | 1,591 (7.2%) |
| 55 to 59 Years | 1,913 (9.0%) | 1,445 (6.5%) |
| 60 to 64 Years | 1,132 (5.3%) | 1,719 (7.7%) |
| 65 to 69 Years | 1,217 (5.7%) | 1,238 (5.6%) |
| 70 to 74 Years | 1,156 (5.4%) | 1,472 (6.6%) |
| 75 to 79 Years | 602 (2.8%) | 885 (4.0%) |
| 80 to 84 Years | 367 (1.7%) | 437 (2.0%) |
| 85 Years and over | 286 (1.3%) | 558 (2.5%) |
| Total | 21,350 (100.0%) | 22,186 (100.0%) |
Families and Households in Chesterfield County
Median Family Size in Chesterfield County
The median family size in Chesterfield County is 3.13 persons per family, with single female/mother families (2,663 | 24.0%) accounting for the largest median family size of 3.55 persons per family. On the other hand, single male/father families (1,110 | 10.0%) represent the smallest median family size with 2.50 persons per family.
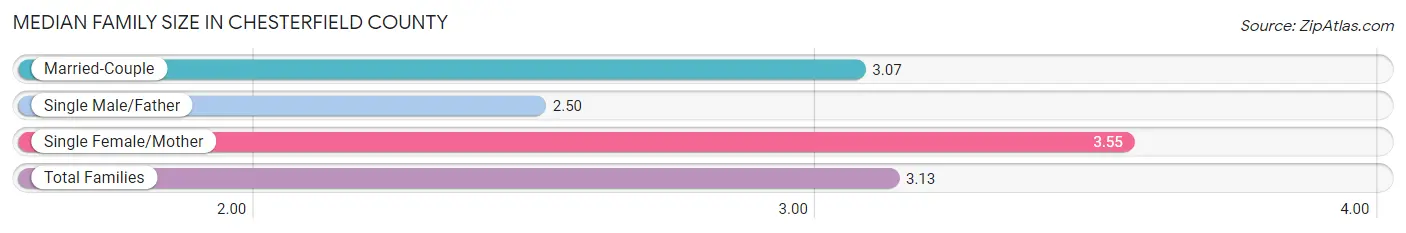
| Family Type | # Families | Family Size |
| Married-Couple | 7,308 (65.9%) | 3.07 |
| Single Male/Father | 1,110 (10.0%) | 2.50 |
| Single Female/Mother | 2,663 (24.0%) | 3.55 |
| Total Families | 11,081 (100.0%) | 3.13 |
Median Household Size in Chesterfield County
The median household size in Chesterfield County is 2.49 persons per household, with single female/mother households (2,663 | 15.6%) accounting for the largest median household size of 3.72 persons per household. non-family households (6,035 | 35.3%) represent the smallest median household size with 1.13 persons per household.
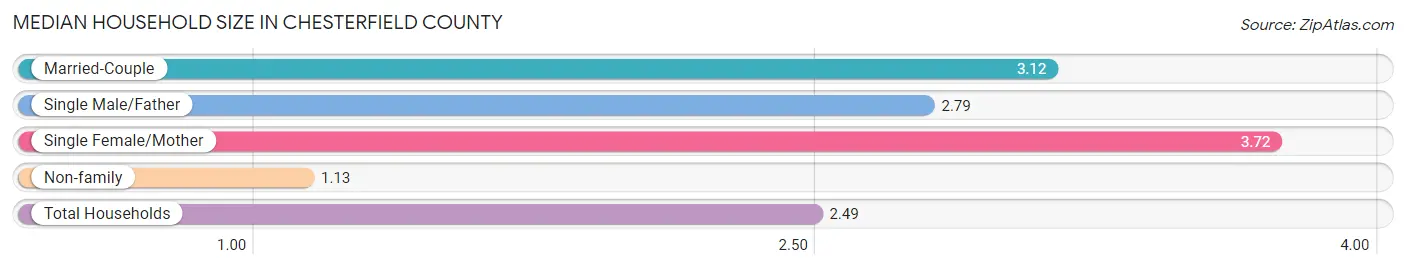
| Household Type | # Households | Household Size |
| Married-Couple | 7,308 (42.7%) | 3.12 |
| Single Male/Father | 1,110 (6.5%) | 2.79 |
| Single Female/Mother | 2,663 (15.6%) | 3.72 |
| Non-family | 6,035 (35.3%) | 1.13 |
| Total Households | 17,116 (100.0%) | 2.49 |
Household Size by Marriage Status in Chesterfield County
Out of a total of 17,116 households in Chesterfield County, 11,081 (64.7%) are family households, while 6,035 (35.3%) are nonfamily households. The most numerous type of family households are 2-person households, comprising 4,922, and the most common type of nonfamily households are 1-person households, comprising 5,416.
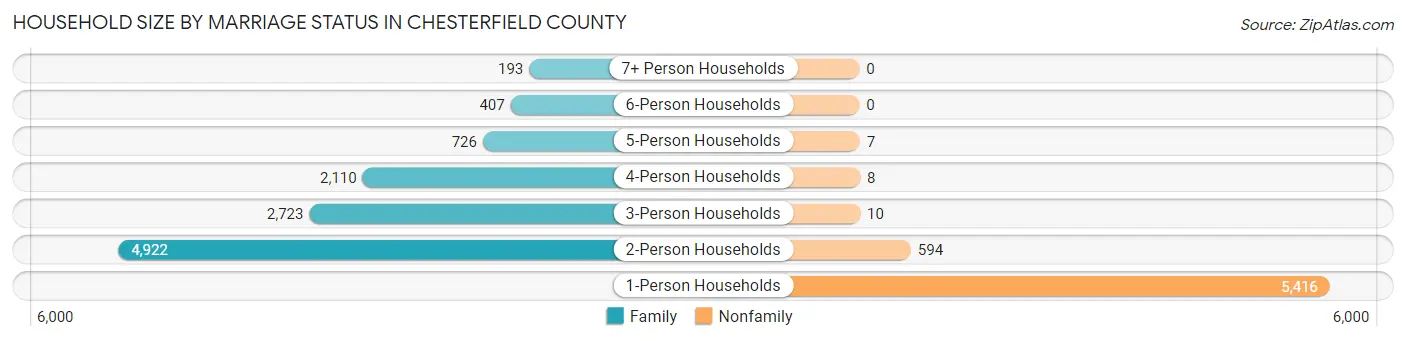
| Household Size | Family Households | Nonfamily Households |
| 1-Person Households | - | 5,416 (31.6%) |
| 2-Person Households | 4,922 (28.8%) | 594 (3.5%) |
| 3-Person Households | 2,723 (15.9%) | 10 (0.1%) |
| 4-Person Households | 2,110 (12.3%) | 8 (0.1%) |
| 5-Person Households | 726 (4.2%) | 7 (0.0%) |
| 6-Person Households | 407 (2.4%) | 0 (0.0%) |
| 7+ Person Households | 193 (1.1%) | 0 (0.0%) |
| Total | 11,081 (64.7%) | 6,035 (35.3%) |
Female Fertility in Chesterfield County
Fertility by Age in Chesterfield County
Average fertility rate in Chesterfield County is 66.0 births per 1,000 women. Women in the age bracket of 20 to 34 years have the highest fertility rate with 112.0 births per 1,000 women. Women in the age bracket of 20 to 34 years acount for 74.3% of all women with births.
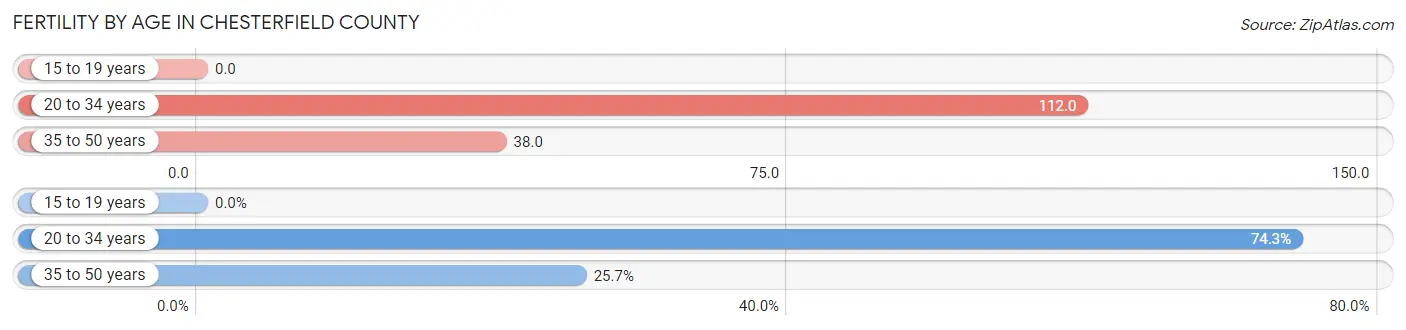
| Age Bracket | Women with Births | Births / 1,000 Women |
| 15 to 19 years | 0 (0.0%) | 0.0 |
| 20 to 34 years | 454 (74.3%) | 112.0 |
| 35 to 50 years | 157 (25.7%) | 38.0 |
| Total | 611 (100.0%) | 66.0 |
Fertility by Age by Marriage Status in Chesterfield County
42.6% of women with births (611) in Chesterfield County are married. The highest percentage of unmarried women with births falls into 20 to 34 years age bracket with 68.9% of them unmarried at the time of birth, while the lowest percentage of unmarried women with births belong to 35 to 50 years age bracket with 24.2% of them unmarried.
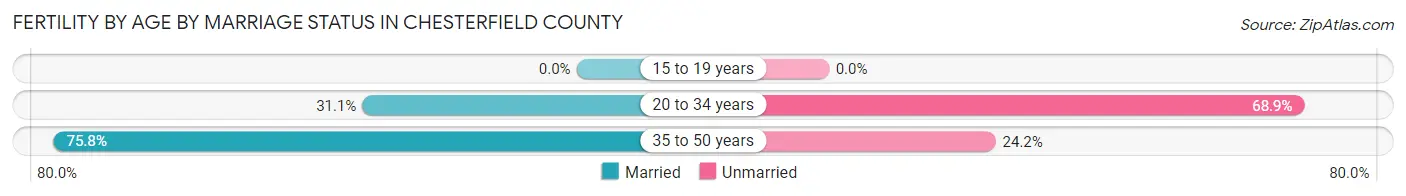
| Age Bracket | Married | Unmarried |
| 15 to 19 years | 0 (0.0%) | 0 (0.0%) |
| 20 to 34 years | 141 (31.1%) | 313 (68.9%) |
| 35 to 50 years | 119 (75.8%) | 38 (24.2%) |
| Total | 260 (42.5%) | 351 (57.5%) |
Fertility by Education in Chesterfield County
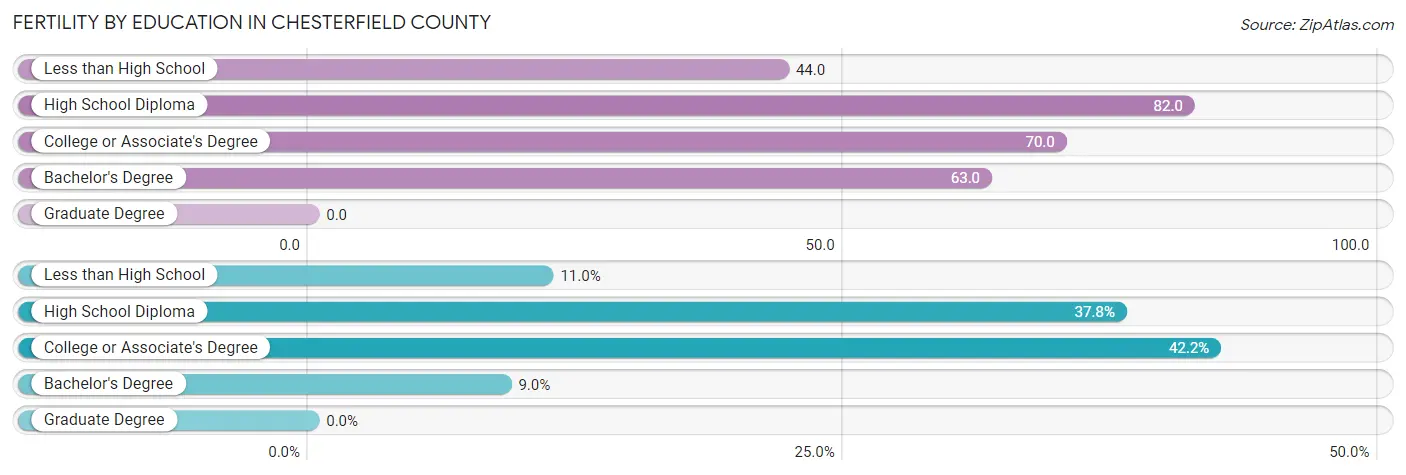
| Educational Attainment | Women with Births | Births / 1,000 Women |
| Less than High School | 67 (11.0%) | 44.0 |
| High School Diploma | 231 (37.8%) | 82.0 |
| College or Associate's Degree | 258 (42.2%) | 70.0 |
| Bachelor's Degree | 55 (9.0%) | 63.0 |
| Graduate Degree | 0 (0.0%) | 0.0 |
| Total | 611 (100.0%) | 66.0 |
Fertility by Education by Marriage Status in Chesterfield County
57.5% of women with births in Chesterfield County are unmarried. Women with the educational attainment of college or associate's degree are most likely to be married with 58.1% of them married at childbirth, while women with the educational attainment of high school diploma are least likely to be married with 72.7% of them unmarried at childbirth.
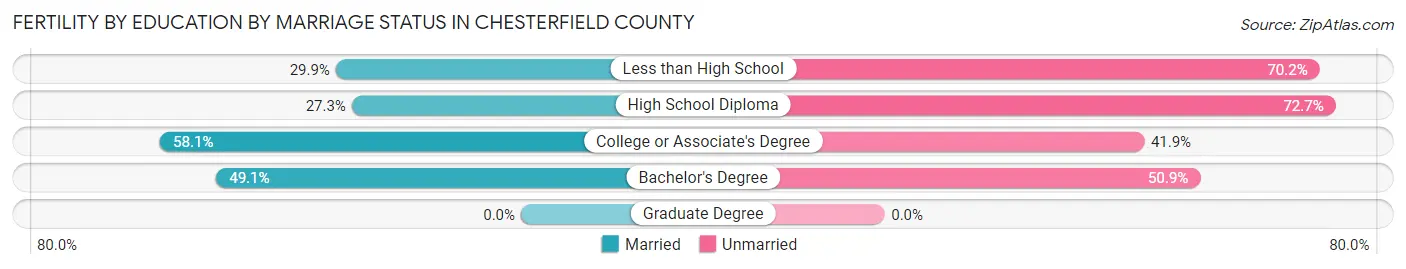
| Educational Attainment | Married | Unmarried |
| Less than High School | 20 (29.8%) | 47 (70.2%) |
| High School Diploma | 63 (27.3%) | 168 (72.7%) |
| College or Associate's Degree | 150 (58.1%) | 108 (41.9%) |
| Bachelor's Degree | 27 (49.1%) | 28 (50.9%) |
| Graduate Degree | 0 (0.0%) | 0 (0.0%) |
| Total | 260 (42.5%) | 351 (57.5%) |
Employment Characteristics in Chesterfield County
Employment by Class of Employer in Chesterfield County
Among the 17,675 employed individuals in Chesterfield County, private company employees (12,495 | 70.7%), local government employees (1,398 | 7.9%), and not-for-profit organizations (1,089 | 6.2%) make up the most common classes of employment.
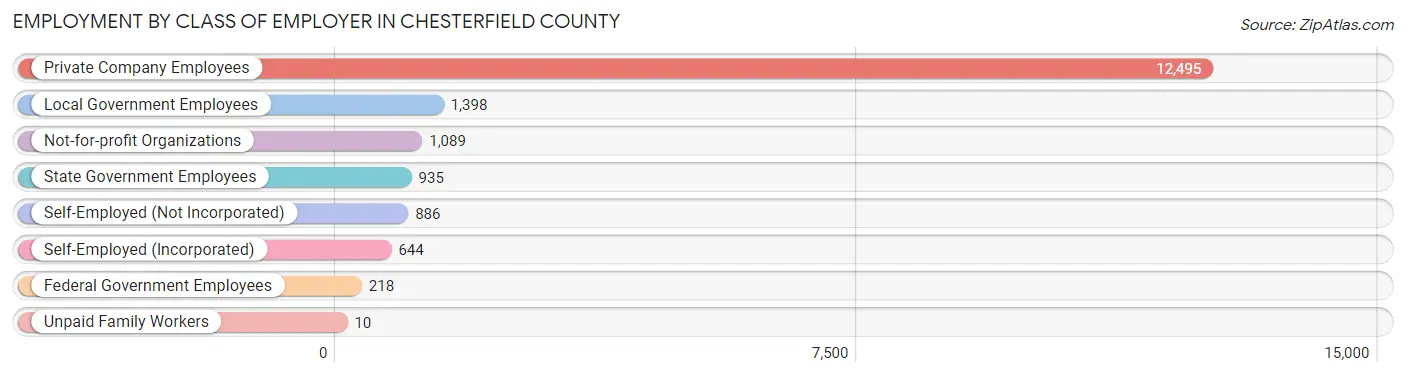
| Employer Class | # Employees | % Employees |
| Private Company Employees | 12,495 | 70.7% |
| Self-Employed (Incorporated) | 644 | 3.6% |
| Self-Employed (Not Incorporated) | 886 | 5.0% |
| Not-for-profit Organizations | 1,089 | 6.2% |
| Local Government Employees | 1,398 | 7.9% |
| State Government Employees | 935 | 5.3% |
| Federal Government Employees | 218 | 1.2% |
| Unpaid Family Workers | 10 | 0.1% |
| Total | 17,675 | 100.0% |
Employment Status by Age in Chesterfield County
According to the labor force statistics for Chesterfield County, out of the total population over 16 years of age (35,059), 56.8% or 19,914 individuals are in the labor force, with 8.7% or 1,733 of them unemployed. The age group with the highest labor force participation rate is 30 to 34 years, with 84.9% or 2,103 individuals in the labor force. Within the labor force, the 16 to 19 years age range has the highest percentage of unemployed individuals, with 16.1% or 120 of them being unemployed.
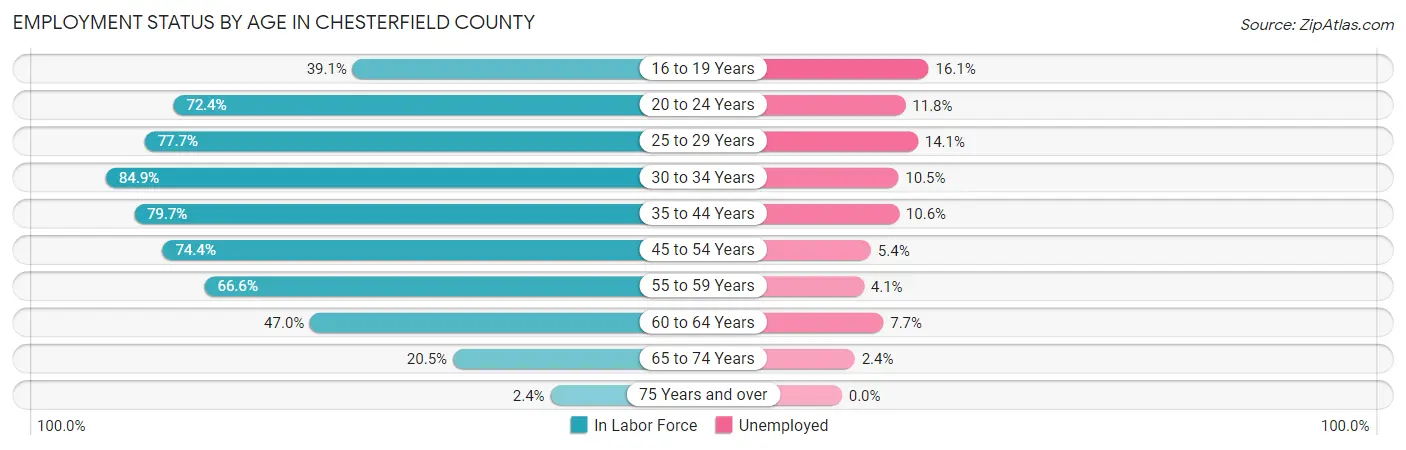
| Age Bracket | In Labor Force | Unemployed |
| 16 to 19 Years | 745 (39.1%) | 120 (16.1%) |
| 20 to 24 Years | 1,963 (72.4%) | 232 (11.8%) |
| 25 to 29 Years | 2,110 (77.7%) | 298 (14.1%) |
| 30 to 34 Years | 2,103 (84.9%) | 221 (10.5%) |
| 35 to 44 Years | 3,740 (79.7%) | 396 (10.6%) |
| 45 to 54 Years | 4,560 (74.4%) | 246 (5.4%) |
| 55 to 59 Years | 2,236 (66.6%) | 92 (4.1%) |
| 60 to 64 Years | 1,340 (47.0%) | 103 (7.7%) |
| 65 to 74 Years | 1,042 (20.5%) | 25 (2.4%) |
| 75 Years and over | 75 (2.4%) | 0 (0.0%) |
| Total | 19,914 (56.8%) | 1,733 (8.7%) |
Employment Status by Educational Attainment in Chesterfield County
According to labor force statistics for Chesterfield County, 72.4% of individuals (16,090) out of the total population between 25 and 64 years of age (22,224) are in the labor force, with 8.4% or 1,352 of them being unemployed. The group with the highest labor force participation rate are those with the educational attainment of bachelor's degree or higher, with 88.2% or 2,455 individuals in the labor force. Within the labor force, individuals with high school diploma education have the highest percentage of unemployment, with 9.4% or 611 of them being unemployed.
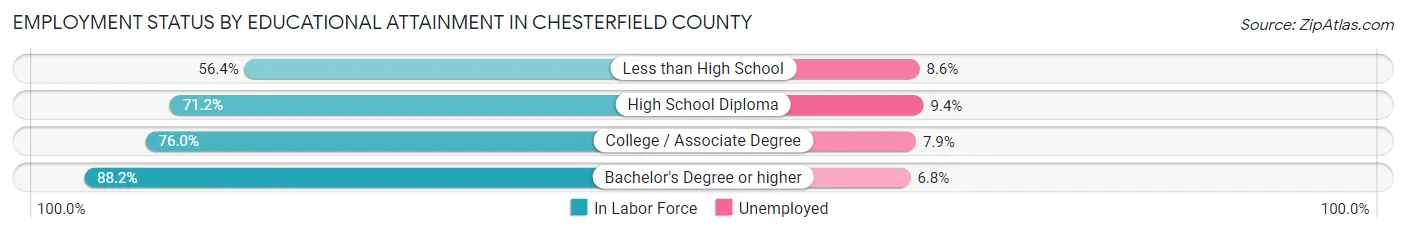
| Educational Attainment | In Labor Force | Unemployed |
| Less than High School | 2,019 (56.4%) | 308 (8.6%) |
| High School Diploma | 6,497 (71.2%) | 858 (9.4%) |
| College / Associate Degree | 5,119 (76.0%) | 532 (7.9%) |
| Bachelor's Degree or higher | 2,455 (88.2%) | 189 (6.8%) |
| Total | 16,090 (72.4%) | 1,867 (8.4%) |
Employment Occupations by Sex in Chesterfield County
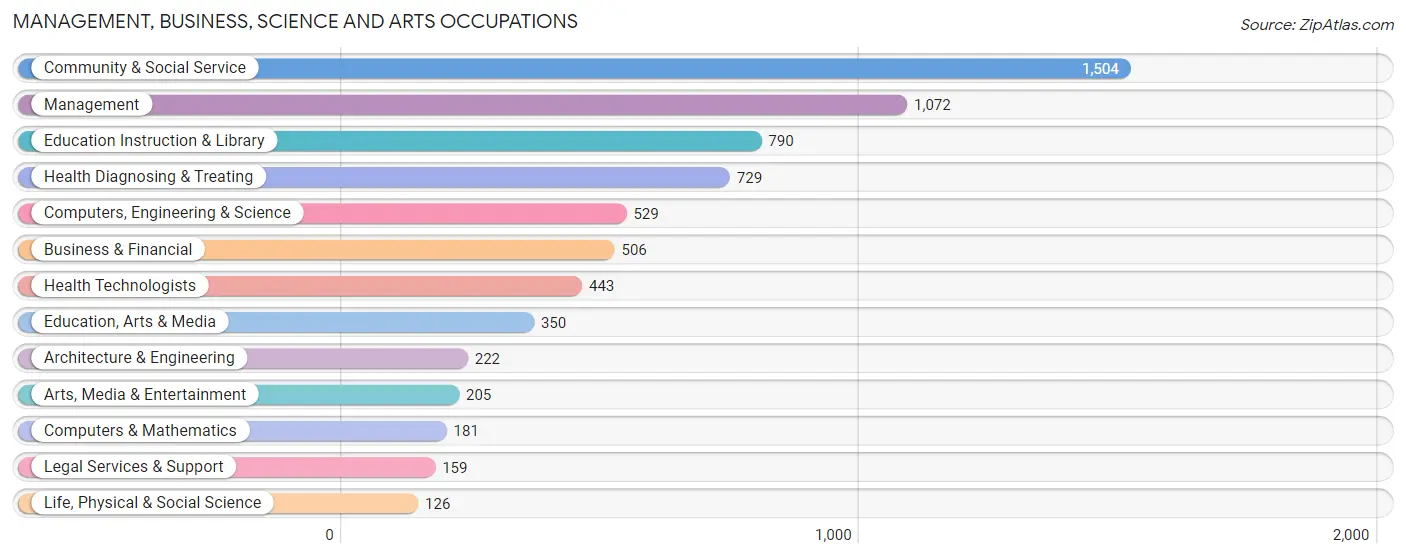
Management, Business, Science and Arts Occupations
The most common Management, Business, Science and Arts occupations in Chesterfield County are Community & Social Service (1,504 | 8.3%), Management (1,072 | 5.9%), Education Instruction & Library (790 | 4.3%), Health Diagnosing & Treating (729 | 4.0%), and Computers, Engineering & Science (529 | 2.9%).
Management, Business, Science and Arts Occupations by Sex
Within the Management, Business, Science and Arts occupations in Chesterfield County, the most male-oriented occupations are Architecture & Engineering (86.9%), Computers, Engineering & Science (77.1%), and Life, Physical & Social Science (77.0%), while the most female-oriented occupations are Health Technologists (91.2%), Health Diagnosing & Treating (89.3%), and Education Instruction & Library (80.1%).
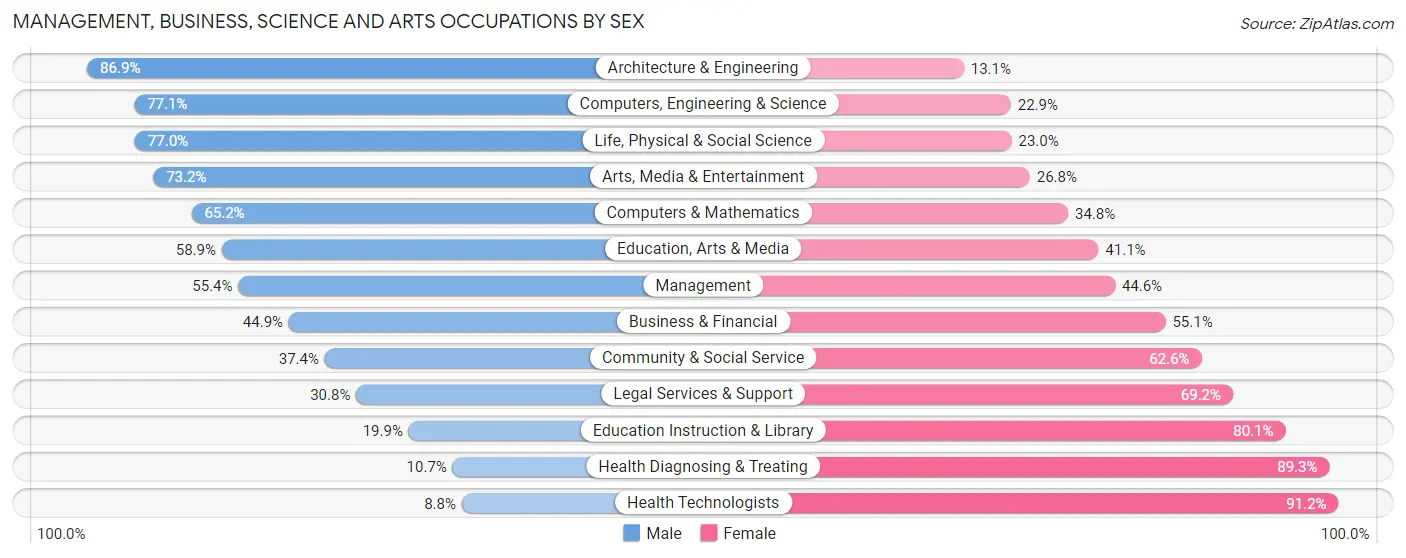
| Occupation | Male | Female |
| Management | 594 (55.4%) | 478 (44.6%) |
| Business & Financial | 227 (44.9%) | 279 (55.1%) |
| Computers, Engineering & Science | 408 (77.1%) | 121 (22.9%) |
| Computers & Mathematics | 118 (65.2%) | 63 (34.8%) |
| Architecture & Engineering | 193 (86.9%) | 29 (13.1%) |
| Life, Physical & Social Science | 97 (77.0%) | 29 (23.0%) |
| Community & Social Service | 562 (37.4%) | 942 (62.6%) |
| Education, Arts & Media | 206 (58.9%) | 144 (41.1%) |
| Legal Services & Support | 49 (30.8%) | 110 (69.2%) |
| Education Instruction & Library | 157 (19.9%) | 633 (80.1%) |
| Arts, Media & Entertainment | 150 (73.2%) | 55 (26.8%) |
| Health Diagnosing & Treating | 78 (10.7%) | 651 (89.3%) |
| Health Technologists | 39 (8.8%) | 404 (91.2%) |
| Total (Category) | 1,869 (43.1%) | 2,471 (56.9%) |
| Total (Overall) | 10,053 (55.4%) | 8,089 (44.6%) |
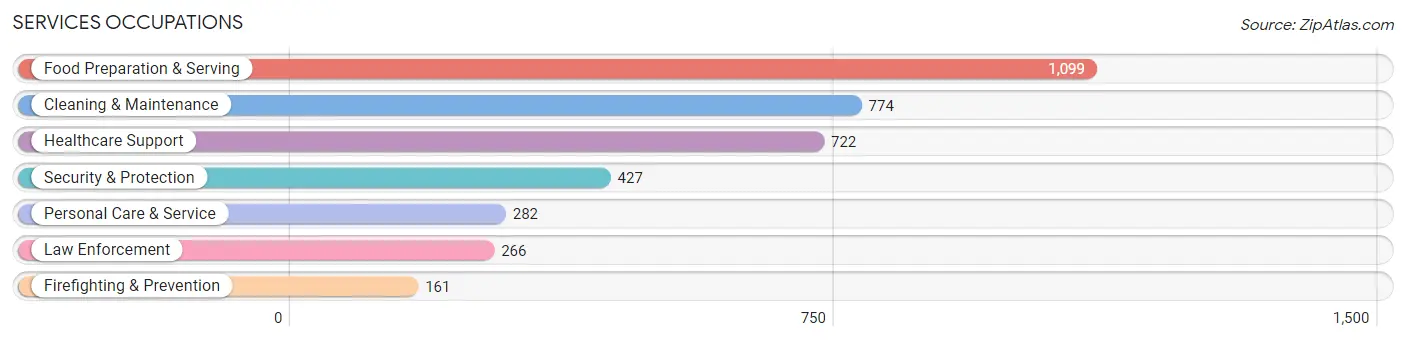
Services Occupations
The most common Services occupations in Chesterfield County are Food Preparation & Serving (1,099 | 6.1%), Cleaning & Maintenance (774 | 4.3%), Healthcare Support (722 | 4.0%), Security & Protection (427 | 2.4%), and Personal Care & Service (282 | 1.5%).
Services Occupations by Sex
Within the Services occupations in Chesterfield County, the most male-oriented occupations are Firefighting & Prevention (95.7%), Security & Protection (87.8%), and Law Enforcement (83.1%), while the most female-oriented occupations are Personal Care & Service (98.9%), Healthcare Support (95.8%), and Food Preparation & Serving (77.2%).
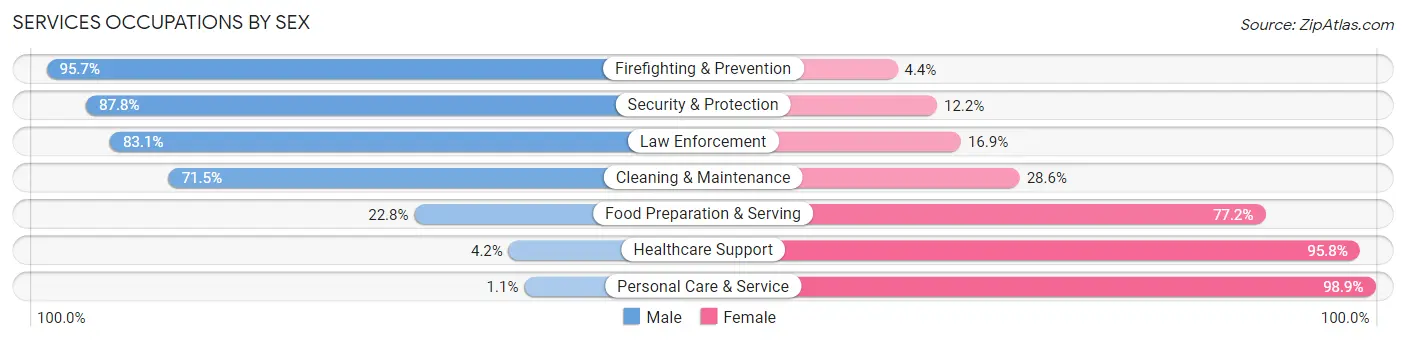
| Occupation | Male | Female |
| Healthcare Support | 30 (4.2%) | 692 (95.8%) |
| Security & Protection | 375 (87.8%) | 52 (12.2%) |
| Firefighting & Prevention | 154 (95.7%) | 7 (4.3%) |
| Law Enforcement | 221 (83.1%) | 45 (16.9%) |
| Food Preparation & Serving | 251 (22.8%) | 848 (77.2%) |
| Cleaning & Maintenance | 553 (71.5%) | 221 (28.5%) |
| Personal Care & Service | 3 (1.1%) | 279 (98.9%) |
| Total (Category) | 1,212 (36.7%) | 2,092 (63.3%) |
| Total (Overall) | 10,053 (55.4%) | 8,089 (44.6%) |
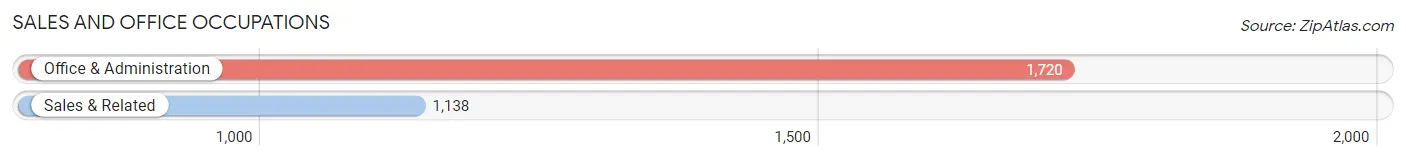
Sales and Office Occupations
The most common Sales and Office occupations in Chesterfield County are Office & Administration (1,720 | 9.5%), and Sales & Related (1,138 | 6.3%).
Sales and Office Occupations by Sex
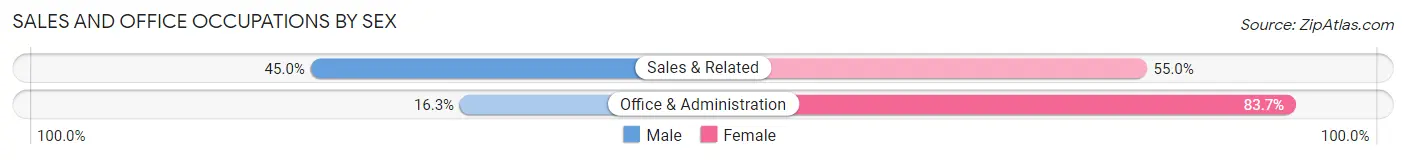
| Occupation | Male | Female |
| Sales & Related | 512 (45.0%) | 626 (55.0%) |
| Office & Administration | 280 (16.3%) | 1,440 (83.7%) |
| Total (Category) | 792 (27.7%) | 2,066 (72.3%) |
| Total (Overall) | 10,053 (55.4%) | 8,089 (44.6%) |
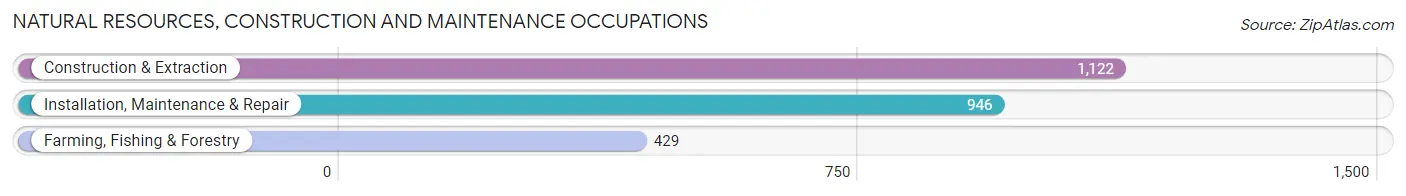
Natural Resources, Construction and Maintenance Occupations
The most common Natural Resources, Construction and Maintenance occupations in Chesterfield County are Construction & Extraction (1,122 | 6.2%), Installation, Maintenance & Repair (946 | 5.2%), and Farming, Fishing & Forestry (429 | 2.4%).
Natural Resources, Construction and Maintenance Occupations by Sex
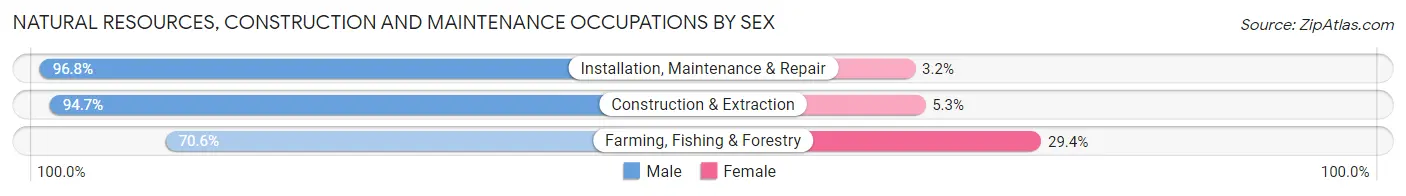
| Occupation | Male | Female |
| Farming, Fishing & Forestry | 303 (70.6%) | 126 (29.4%) |
| Construction & Extraction | 1,063 (94.7%) | 59 (5.3%) |
| Installation, Maintenance & Repair | 916 (96.8%) | 30 (3.2%) |
| Total (Category) | 2,282 (91.4%) | 215 (8.6%) |
| Total (Overall) | 10,053 (55.4%) | 8,089 (44.6%) |
Production, Transportation and Moving Occupations
The most common Production, Transportation and Moving occupations in Chesterfield County are Production (2,804 | 15.5%), Material Moving (1,529 | 8.4%), and Transportation (810 | 4.5%).
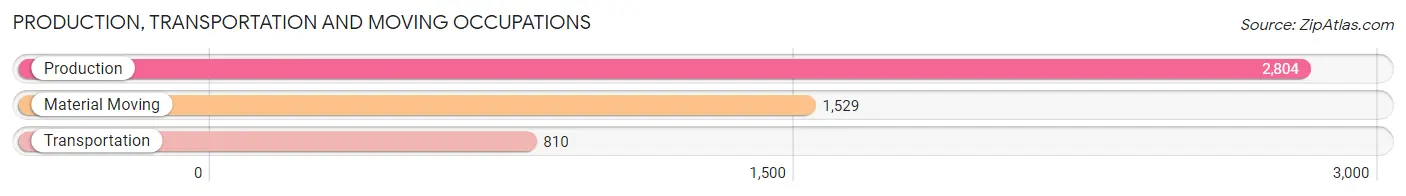
Production, Transportation and Moving Occupations by Sex
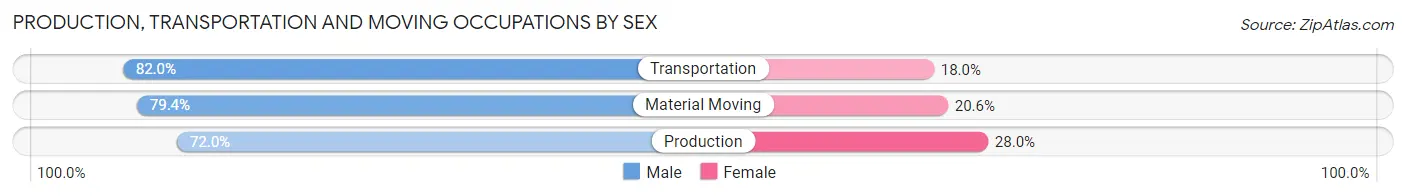
| Occupation | Male | Female |
| Production | 2,020 (72.0%) | 784 (28.0%) |
| Transportation | 664 (82.0%) | 146 (18.0%) |
| Material Moving | 1,214 (79.4%) | 315 (20.6%) |
| Total (Category) | 3,898 (75.8%) | 1,245 (24.2%) |
| Total (Overall) | 10,053 (55.4%) | 8,089 (44.6%) |
Employment Industries by Sex in Chesterfield County
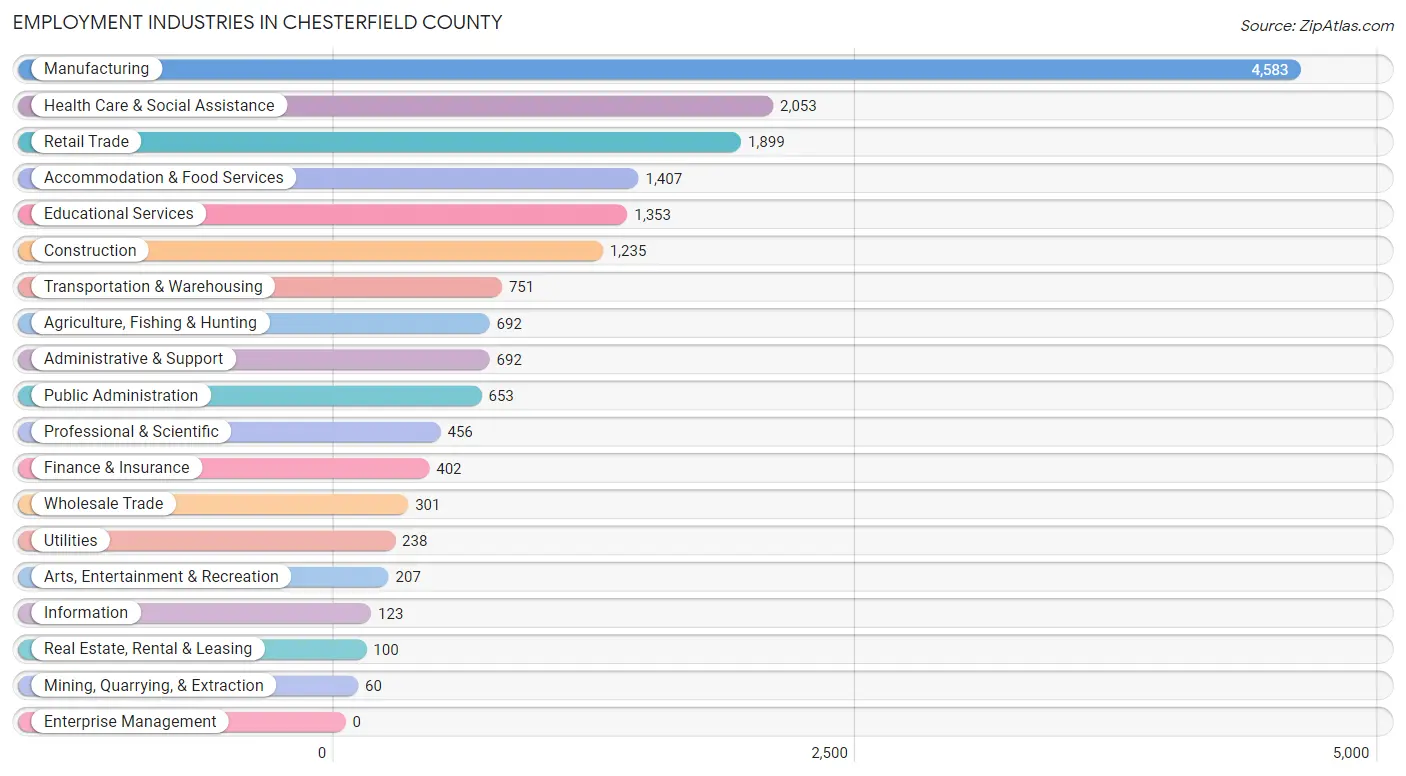
Employment Industries in Chesterfield County
The major employment industries in Chesterfield County include Manufacturing (4,583 | 25.3%), Health Care & Social Assistance (2,053 | 11.3%), Retail Trade (1,899 | 10.5%), Accommodation & Food Services (1,407 | 7.8%), and Educational Services (1,353 | 7.5%).
Employment Industries by Sex in Chesterfield County
The Chesterfield County industries that see more men than women are Mining, Quarrying, & Extraction (100.0%), Construction (91.7%), and Utilities (82.4%), whereas the industries that tend to have a higher number of women are Health Care & Social Assistance (88.2%), Educational Services (77.2%), and Accommodation & Food Services (70.4%).
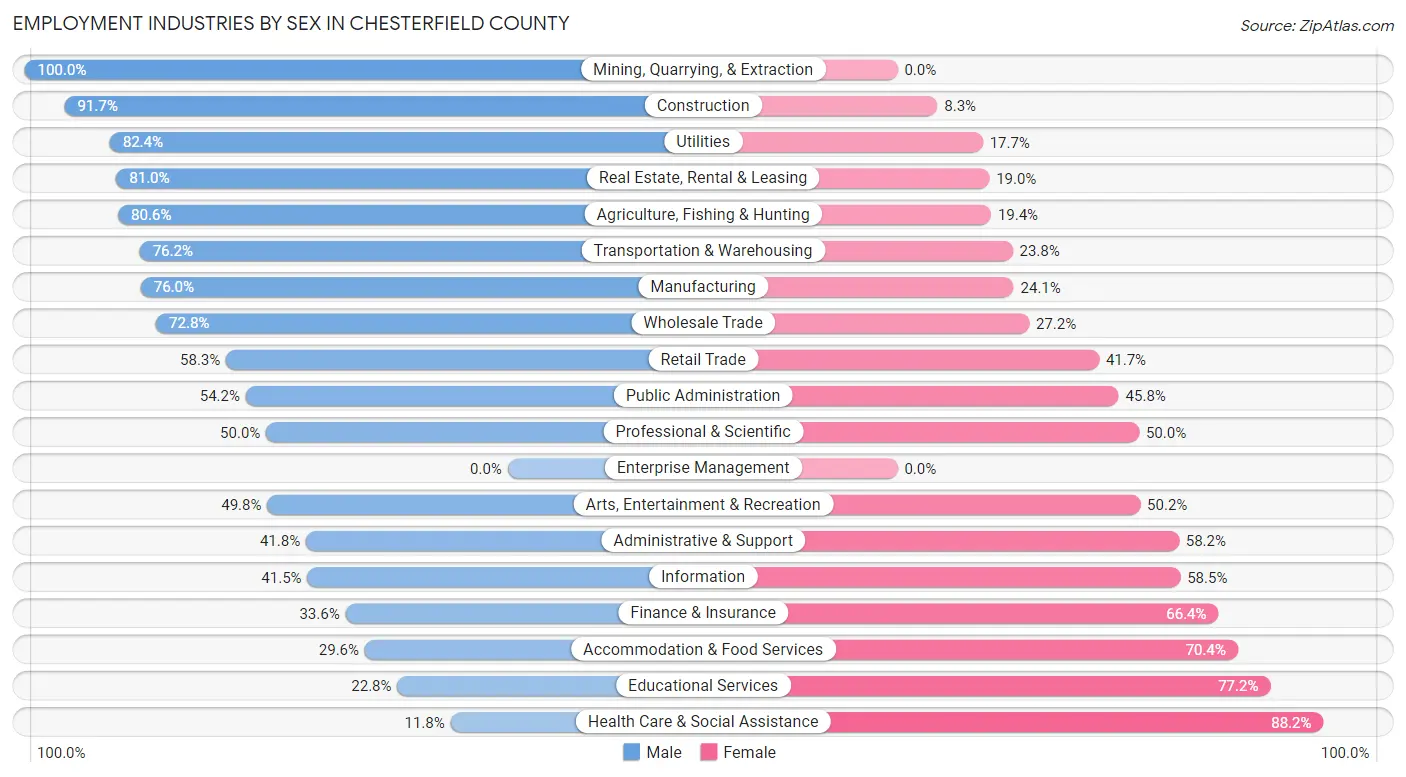
| Industry | Male | Female |
| Agriculture, Fishing & Hunting | 558 (80.6%) | 134 (19.4%) |
| Mining, Quarrying, & Extraction | 60 (100.0%) | 0 (0.0%) |
| Construction | 1,133 (91.7%) | 102 (8.3%) |
| Manufacturing | 3,481 (75.9%) | 1,102 (24.0%) |
| Wholesale Trade | 219 (72.8%) | 82 (27.2%) |
| Retail Trade | 1,107 (58.3%) | 792 (41.7%) |
| Transportation & Warehousing | 572 (76.2%) | 179 (23.8%) |
| Utilities | 196 (82.4%) | 42 (17.6%) |
| Information | 51 (41.5%) | 72 (58.5%) |
| Finance & Insurance | 135 (33.6%) | 267 (66.4%) |
| Real Estate, Rental & Leasing | 81 (81.0%) | 19 (19.0%) |
| Professional & Scientific | 228 (50.0%) | 228 (50.0%) |
| Enterprise Management | 0 (0.0%) | 0 (0.0%) |
| Administrative & Support | 289 (41.8%) | 403 (58.2%) |
| Educational Services | 309 (22.8%) | 1,044 (77.2%) |
| Health Care & Social Assistance | 243 (11.8%) | 1,810 (88.2%) |
| Arts, Entertainment & Recreation | 103 (49.8%) | 104 (50.2%) |
| Accommodation & Food Services | 416 (29.6%) | 991 (70.4%) |
| Public Administration | 354 (54.2%) | 299 (45.8%) |
| Total | 10,053 (55.4%) | 8,089 (44.6%) |
Education in Chesterfield County
School Enrollment in Chesterfield County
The most common levels of schooling among the 9,180 students in Chesterfield County are middle school (2,364 | 25.8%), elementary school (2,187 | 23.8%), and high school (2,091 | 22.8%).
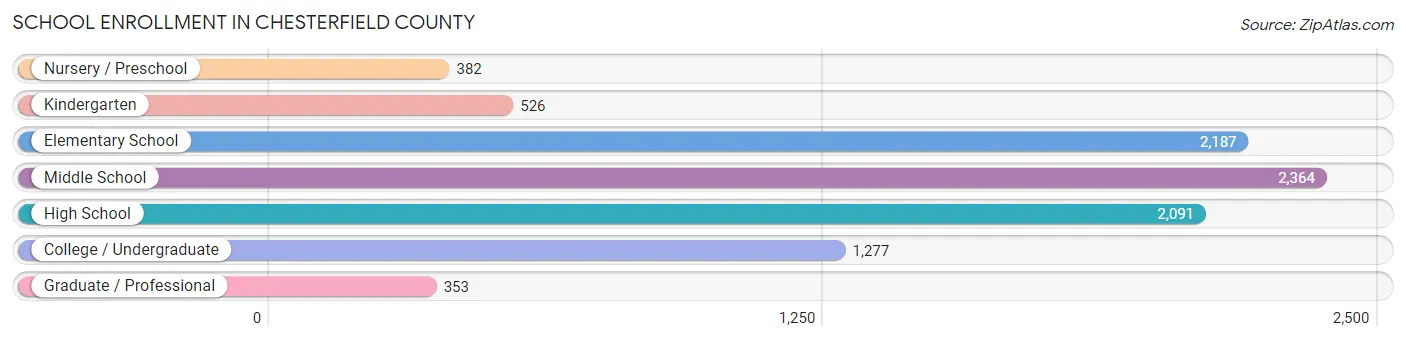
| School Level | # Students | % Students |
| Nursery / Preschool | 382 | 4.2% |
| Kindergarten | 526 | 5.7% |
| Elementary School | 2,187 | 23.8% |
| Middle School | 2,364 | 25.8% |
| High School | 2,091 | 22.8% |
| College / Undergraduate | 1,277 | 13.9% |
| Graduate / Professional | 353 | 3.8% |
| Total | 9,180 | 100.0% |
School Enrollment by Age by Funding Source in Chesterfield County
Out of a total of 9,180 students who are enrolled in schools in Chesterfield County, 1,368 (14.9%) attend a private institution, while the remaining 7,812 (85.1%) are enrolled in public schools. The age group of 35 years and over has the highest likelihood of being enrolled in private schools, with 187 (49.1% in the age bracket) enrolled. Conversely, the age group of 18 to 19 year olds has the lowest likelihood of being enrolled in a private school, with 445 (99.8% in the age bracket) attending a public institution.
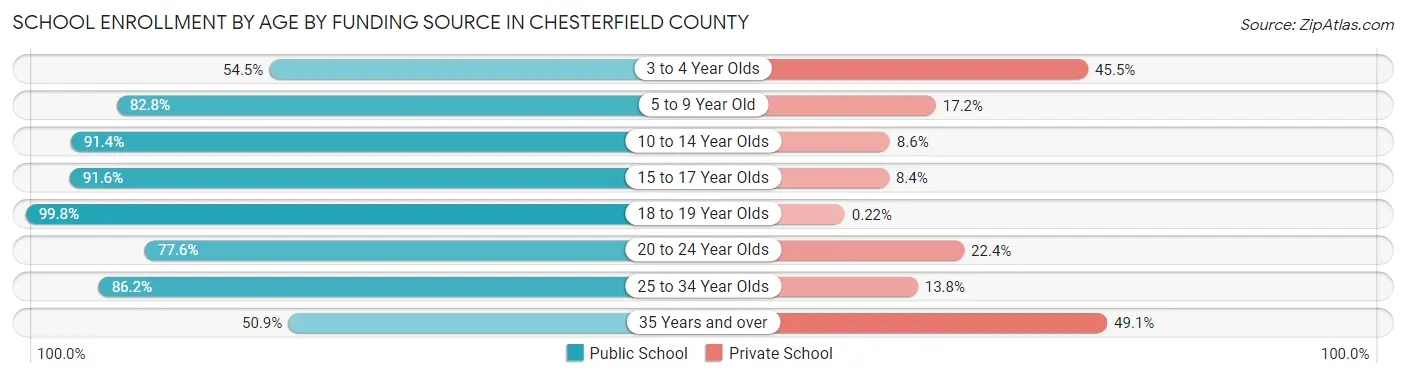
| Age Bracket | Public School | Private School |
| 3 to 4 Year Olds | 177 (54.5%) | 148 (45.5%) |
| 5 to 9 Year Old | 2,233 (82.8%) | 463 (17.2%) |
| 10 to 14 Year Olds | 2,472 (91.4%) | 233 (8.6%) |
| 15 to 17 Year Olds | 1,378 (91.6%) | 127 (8.4%) |
| 18 to 19 Year Olds | 445 (99.8%) | 1 (0.2%) |
| 20 to 24 Year Olds | 477 (77.6%) | 138 (22.4%) |
| 25 to 34 Year Olds | 437 (86.2%) | 70 (13.8%) |
| 35 Years and over | 194 (50.9%) | 187 (49.1%) |
| Total | 7,812 (85.1%) | 1,368 (14.9%) |
Educational Attainment by Field of Study in Chesterfield County
Education (1,070 | 26.6%), business (613 | 15.2%), science & technology (419 | 10.4%), psychology (315 | 7.8%), and arts & humanities (314 | 7.8%) are the most common fields of study among 4,026 individuals in Chesterfield County who have obtained a bachelor's degree or higher.
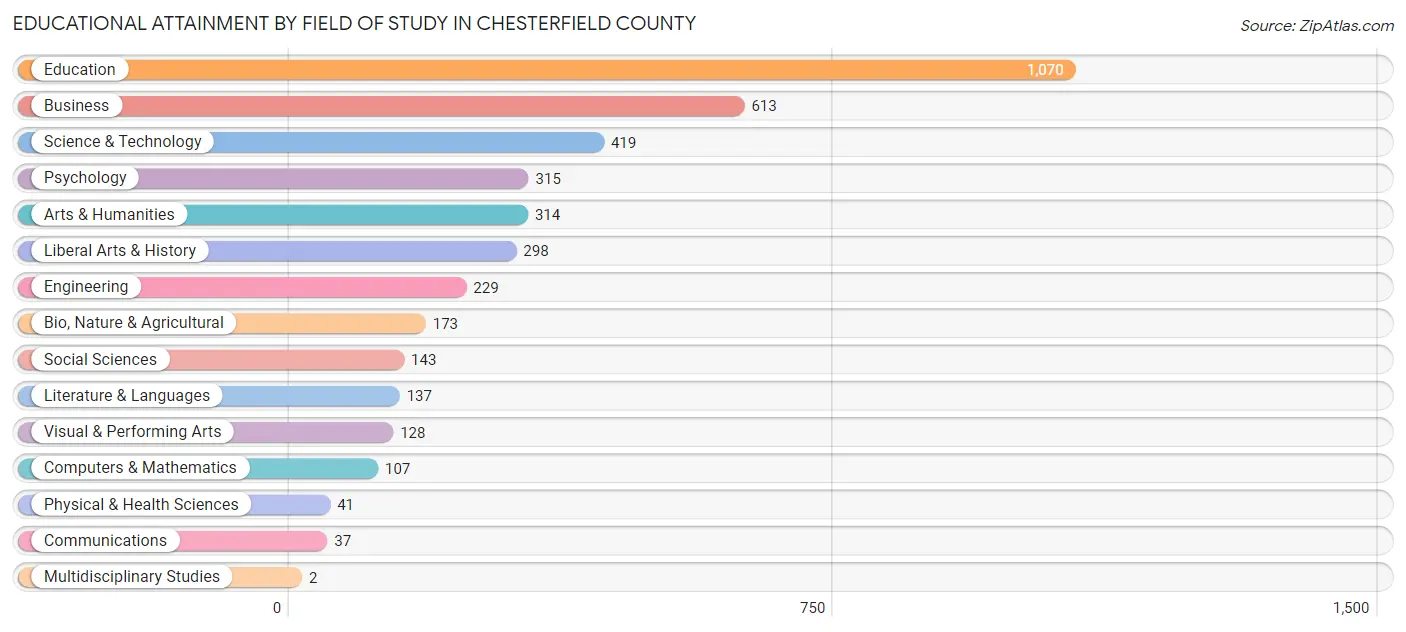
| Field of Study | # Graduates | % Graduates |
| Computers & Mathematics | 107 | 2.7% |
| Bio, Nature & Agricultural | 173 | 4.3% |
| Physical & Health Sciences | 41 | 1.0% |
| Psychology | 315 | 7.8% |
| Social Sciences | 143 | 3.5% |
| Engineering | 229 | 5.7% |
| Multidisciplinary Studies | 2 | 0.1% |
| Science & Technology | 419 | 10.4% |
| Business | 613 | 15.2% |
| Education | 1,070 | 26.6% |
| Literature & Languages | 137 | 3.4% |
| Liberal Arts & History | 298 | 7.4% |
| Visual & Performing Arts | 128 | 3.2% |
| Communications | 37 | 0.9% |
| Arts & Humanities | 314 | 7.8% |
| Total | 4,026 | 100.0% |
Transportation & Commute in Chesterfield County
Vehicle Availability by Sex in Chesterfield County
The most prevalent vehicle ownership categories in Chesterfield County are males with 2 vehicles (3,704, accounting for 38.1%) and females with 2 vehicles (2,643, making up 47.2%).
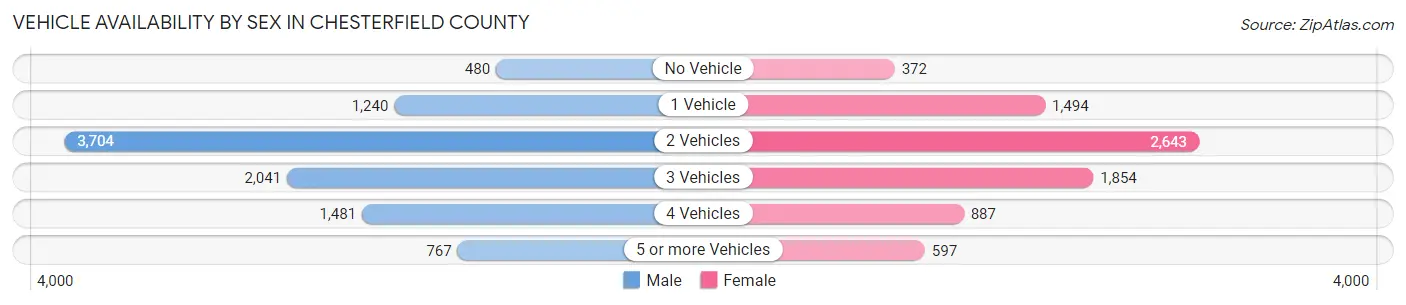
| Vehicles Available | Male | Female |
| No Vehicle | 480 (4.9%) | 372 (4.7%) |
| 1 Vehicle | 1,240 (12.8%) | 1,494 (19.0%) |
| 2 Vehicles | 3,704 (38.1%) | 2,643 (33.7%) |
| 3 Vehicles | 2,041 (21.0%) | 1,854 (23.6%) |
| 4 Vehicles | 1,481 (15.2%) | 887 (11.3%) |
| 5 or more Vehicles | 767 (7.9%) | 597 (7.6%) |
| Total | 9,713 (100.0%) | 7,847 (100.0%) |
Commute Time in Chesterfield County
The most frequently occuring commute durations in Chesterfield County are 15 to 19 minutes (2,730 commuters, 15.7%), 10 to 14 minutes (2,691 commuters, 15.4%), and 20 to 24 minutes (2,243 commuters, 12.9%).
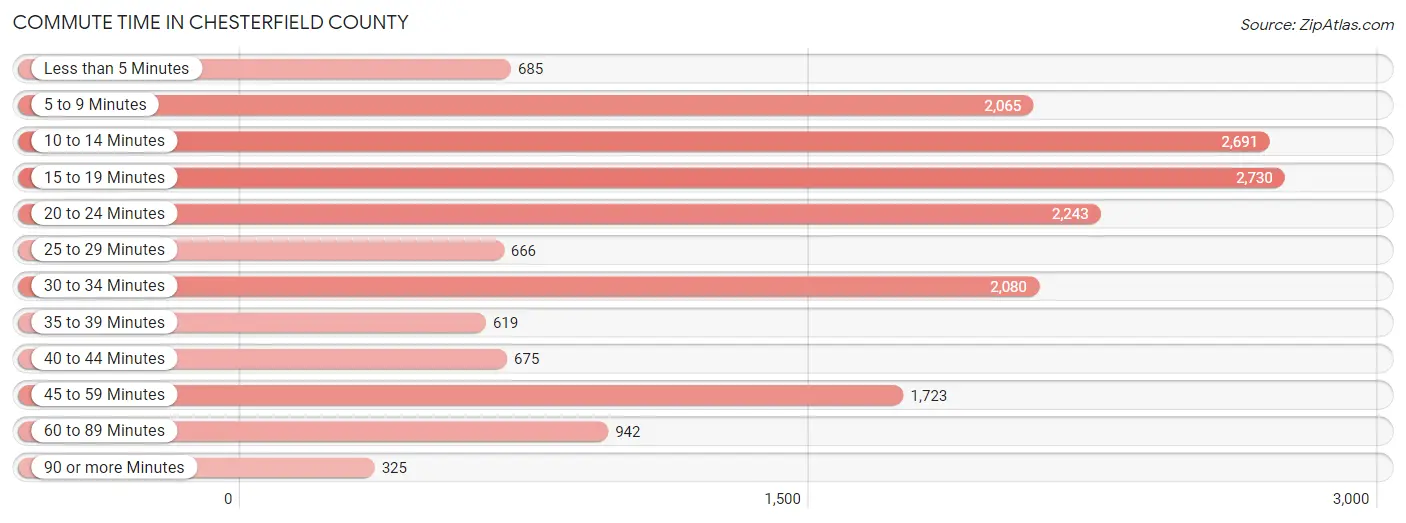
| Commute Time | # Commuters | % Commuters |
| Less than 5 Minutes | 685 | 3.9% |
| 5 to 9 Minutes | 2,065 | 11.8% |
| 10 to 14 Minutes | 2,691 | 15.4% |
| 15 to 19 Minutes | 2,730 | 15.7% |
| 20 to 24 Minutes | 2,243 | 12.9% |
| 25 to 29 Minutes | 666 | 3.8% |
| 30 to 34 Minutes | 2,080 | 11.9% |
| 35 to 39 Minutes | 619 | 3.5% |
| 40 to 44 Minutes | 675 | 3.9% |
| 45 to 59 Minutes | 1,723 | 9.9% |
| 60 to 89 Minutes | 942 | 5.4% |
| 90 or more Minutes | 325 | 1.9% |
Commute Time by Sex in Chesterfield County
The most common commute times in Chesterfield County are 15 to 19 minutes (1,612 commuters, 16.7%) for males and 10 to 14 minutes (1,249 commuters, 16.1%) for females.
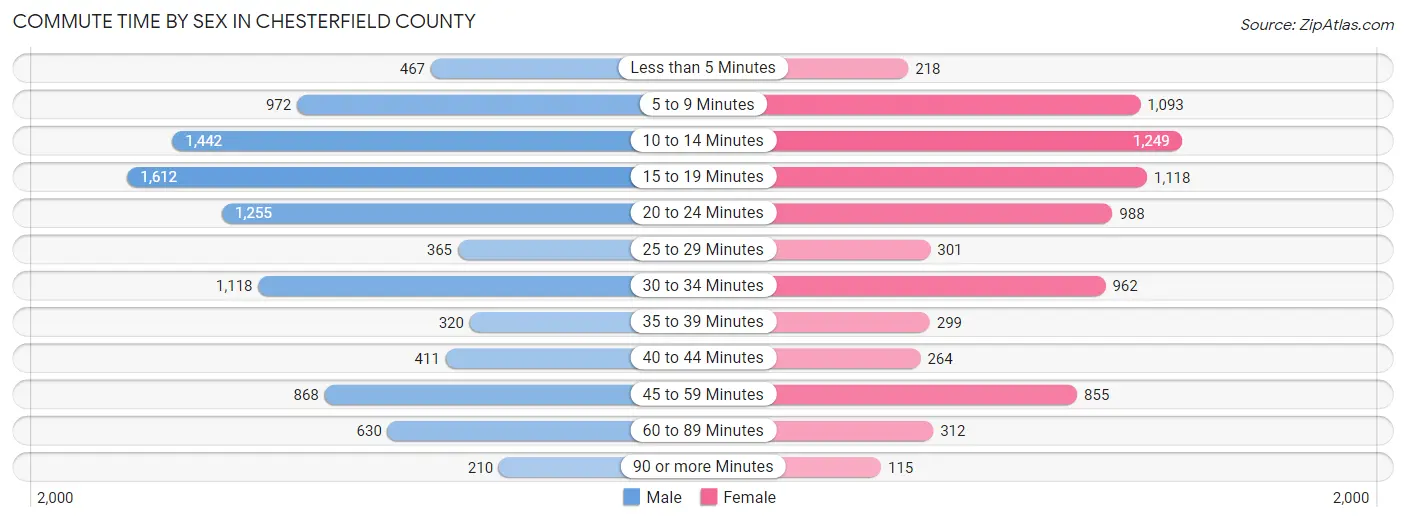
| Commute Time | Male | Female |
| Less than 5 Minutes | 467 (4.8%) | 218 (2.8%) |
| 5 to 9 Minutes | 972 (10.1%) | 1,093 (14.1%) |
| 10 to 14 Minutes | 1,442 (14.9%) | 1,249 (16.1%) |
| 15 to 19 Minutes | 1,612 (16.7%) | 1,118 (14.4%) |
| 20 to 24 Minutes | 1,255 (13.0%) | 988 (12.7%) |
| 25 to 29 Minutes | 365 (3.8%) | 301 (3.9%) |
| 30 to 34 Minutes | 1,118 (11.6%) | 962 (12.4%) |
| 35 to 39 Minutes | 320 (3.3%) | 299 (3.8%) |
| 40 to 44 Minutes | 411 (4.3%) | 264 (3.4%) |
| 45 to 59 Minutes | 868 (9.0%) | 855 (11.0%) |
| 60 to 89 Minutes | 630 (6.5%) | 312 (4.0%) |
| 90 or more Minutes | 210 (2.2%) | 115 (1.5%) |
Time of Departure to Work by Sex in Chesterfield County
The most frequent times of departure to work in Chesterfield County are 7:30 AM to 7:59 AM (1,204, 12.4%) for males and 7:30 AM to 7:59 AM (1,404, 18.1%) for females.
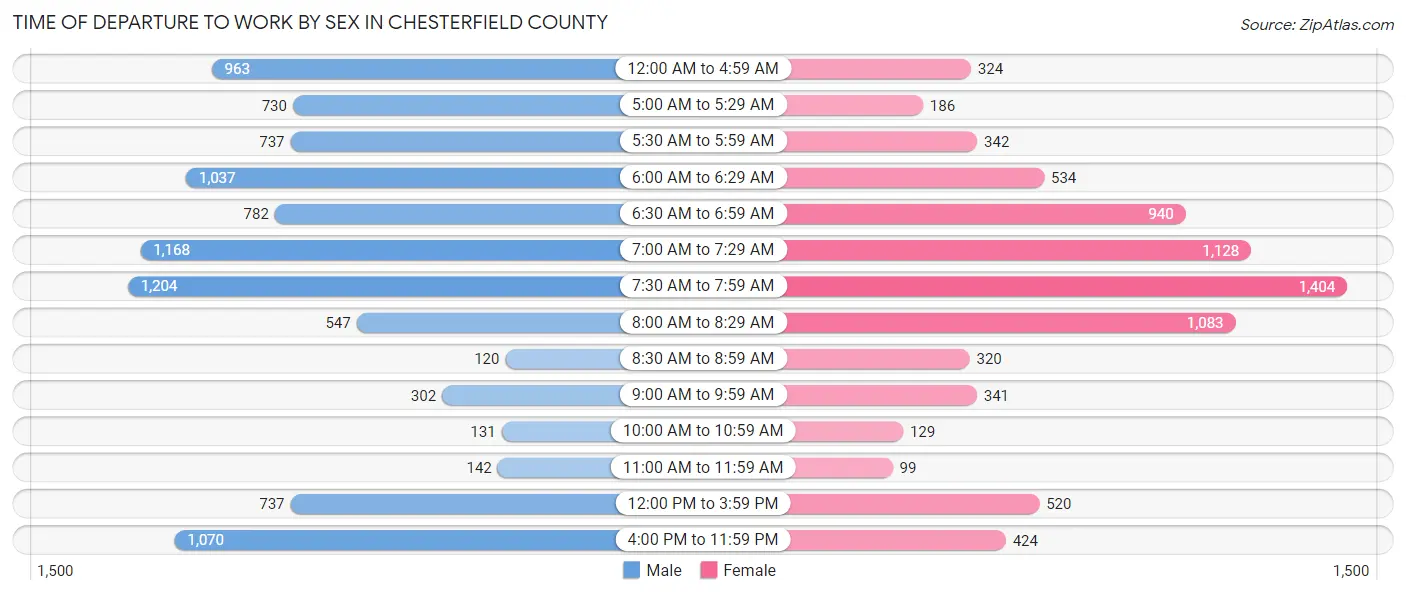
| Time of Departure | Male | Female |
| 12:00 AM to 4:59 AM | 963 (10.0%) | 324 (4.2%) |
| 5:00 AM to 5:29 AM | 730 (7.5%) | 186 (2.4%) |
| 5:30 AM to 5:59 AM | 737 (7.6%) | 342 (4.4%) |
| 6:00 AM to 6:29 AM | 1,037 (10.7%) | 534 (6.9%) |
| 6:30 AM to 6:59 AM | 782 (8.1%) | 940 (12.1%) |
| 7:00 AM to 7:29 AM | 1,168 (12.1%) | 1,128 (14.5%) |
| 7:30 AM to 7:59 AM | 1,204 (12.4%) | 1,404 (18.1%) |
| 8:00 AM to 8:29 AM | 547 (5.7%) | 1,083 (13.9%) |
| 8:30 AM to 8:59 AM | 120 (1.2%) | 320 (4.1%) |
| 9:00 AM to 9:59 AM | 302 (3.1%) | 341 (4.4%) |
| 10:00 AM to 10:59 AM | 131 (1.3%) | 129 (1.7%) |
| 11:00 AM to 11:59 AM | 142 (1.5%) | 99 (1.3%) |
| 12:00 PM to 3:59 PM | 737 (7.6%) | 520 (6.7%) |
| 4:00 PM to 11:59 PM | 1,070 (11.1%) | 424 (5.4%) |
| Total | 9,670 (100.0%) | 7,774 (100.0%) |
Housing Occupancy in Chesterfield County
Occupancy by Ownership in Chesterfield County
Of the total 17,116 dwellings in Chesterfield County, owner-occupied units account for 12,342 (72.1%), while renter-occupied units make up 4,774 (27.9%).
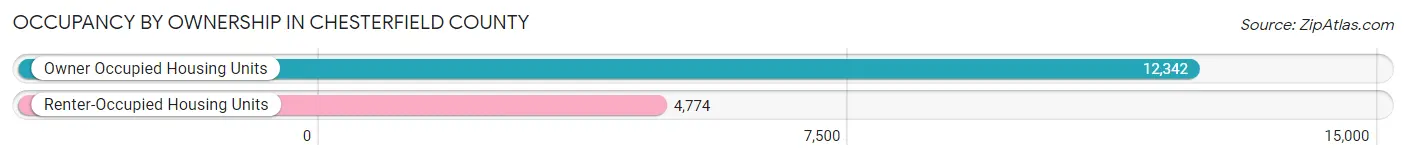
| Occupancy | # Housing Units | % Housing Units |
| Owner Occupied Housing Units | 12,342 | 72.1% |
| Renter-Occupied Housing Units | 4,774 | 27.9% |
| Total Occupied Housing Units | 17,116 | 100.0% |
Occupancy by Household Size in Chesterfield County
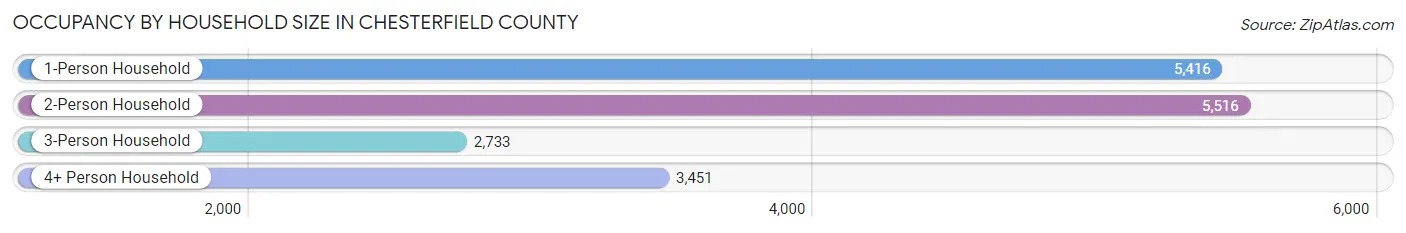
| Household Size | # Housing Units | % Housing Units |
| 1-Person Household | 5,416 | 31.6% |
| 2-Person Household | 5,516 | 32.2% |
| 3-Person Household | 2,733 | 16.0% |
| 4+ Person Household | 3,451 | 20.2% |
| Total Housing Units | 17,116 | 100.0% |
Occupancy by Ownership by Household Size in Chesterfield County
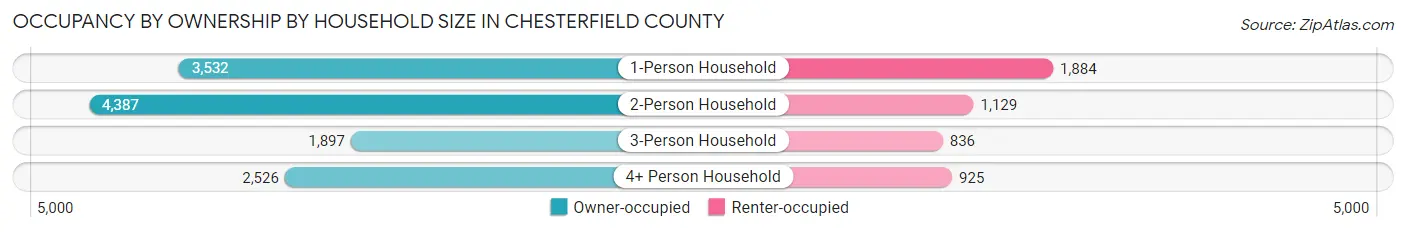
| Household Size | Owner-occupied | Renter-occupied |
| 1-Person Household | 3,532 (65.2%) | 1,884 (34.8%) |
| 2-Person Household | 4,387 (79.5%) | 1,129 (20.5%) |
| 3-Person Household | 1,897 (69.4%) | 836 (30.6%) |
| 4+ Person Household | 2,526 (73.2%) | 925 (26.8%) |
| Total Housing Units | 12,342 (72.1%) | 4,774 (27.9%) |
Occupancy by Educational Attainment in Chesterfield County

| Household Size | Owner-occupied | Renter-occupied |
| Less than High School | 2,029 (63.5%) | 1,165 (36.5%) |
| High School Diploma | 4,681 (74.0%) | 1,644 (26.0%) |
| College/Associate Degree | 3,915 (73.6%) | 1,402 (26.4%) |
| Bachelor's Degree or higher | 1,717 (75.3%) | 563 (24.7%) |
Occupancy by Age of Householder in Chesterfield County
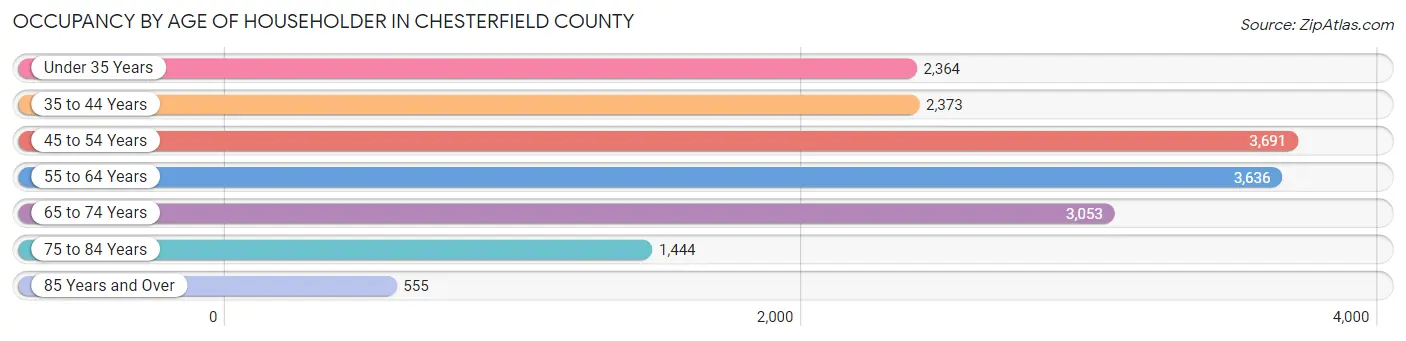
| Age Bracket | # Households | % Households |
| Under 35 Years | 2,364 | 13.8% |
| 35 to 44 Years | 2,373 | 13.9% |
| 45 to 54 Years | 3,691 | 21.6% |
| 55 to 64 Years | 3,636 | 21.2% |
| 65 to 74 Years | 3,053 | 17.8% |
| 75 to 84 Years | 1,444 | 8.4% |
| 85 Years and Over | 555 | 3.2% |
| Total | 17,116 | 100.0% |
Housing Finances in Chesterfield County
Median Income by Occupancy in Chesterfield County
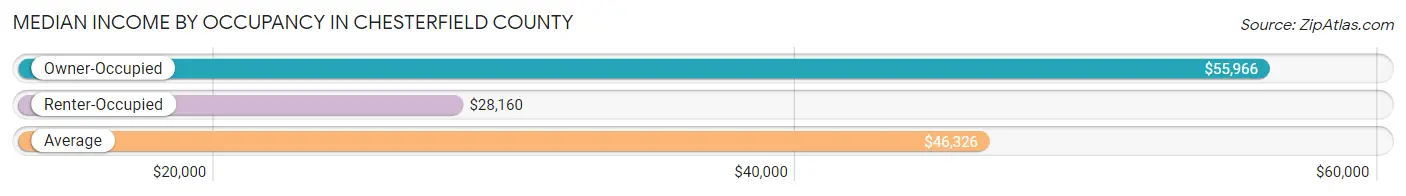
| Occupancy Type | # Households | Median Income |
| Owner-Occupied | 12,342 (72.1%) | $55,966 |
| Renter-Occupied | 4,774 (27.9%) | $28,160 |
| Average | 17,116 (100.0%) | $46,326 |
Occupancy by Householder Income Bracket in Chesterfield County
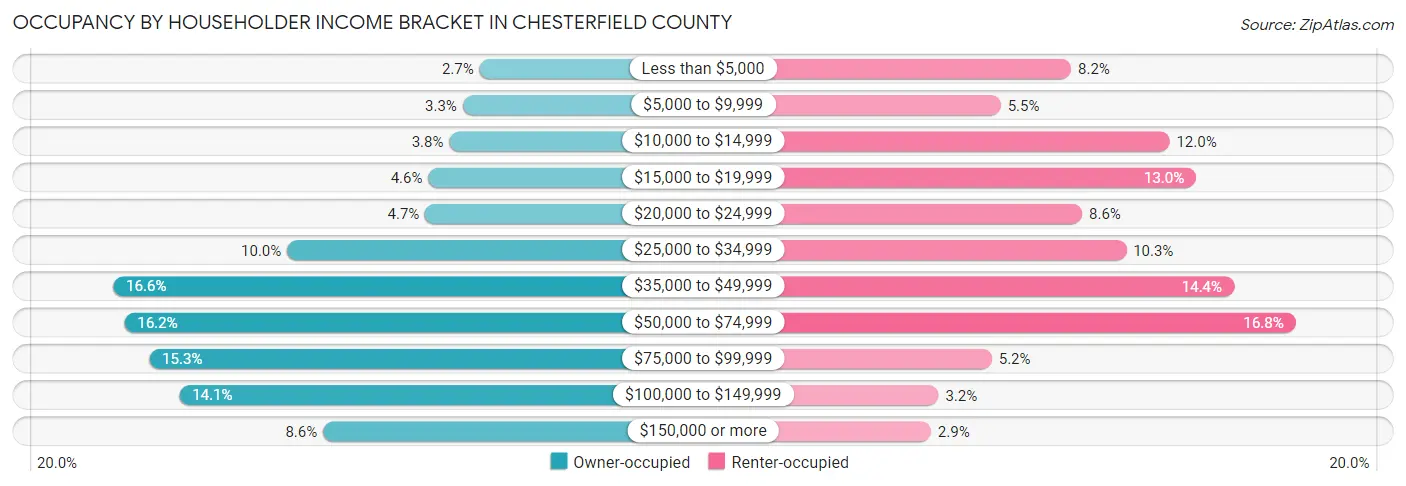
| Income Bracket | Owner-occupied | Renter-occupied |
| Less than $5,000 | 329 (2.7%) | 392 (8.2%) |
| $5,000 to $9,999 | 409 (3.3%) | 264 (5.5%) |
| $10,000 to $14,999 | 472 (3.8%) | 571 (12.0%) |
| $15,000 to $19,999 | 570 (4.6%) | 619 (13.0%) |
| $20,000 to $24,999 | 585 (4.7%) | 412 (8.6%) |
| $25,000 to $34,999 | 1,234 (10.0%) | 492 (10.3%) |
| $35,000 to $49,999 | 2,053 (16.6%) | 688 (14.4%) |
| $50,000 to $74,999 | 2,000 (16.2%) | 800 (16.8%) |
| $75,000 to $99,999 | 1,883 (15.3%) | 248 (5.2%) |
| $100,000 to $149,999 | 1,742 (14.1%) | 151 (3.2%) |
| $150,000 or more | 1,065 (8.6%) | 137 (2.9%) |
| Total | 12,342 (100.0%) | 4,774 (100.0%) |
Monthly Housing Cost Tiers in Chesterfield County
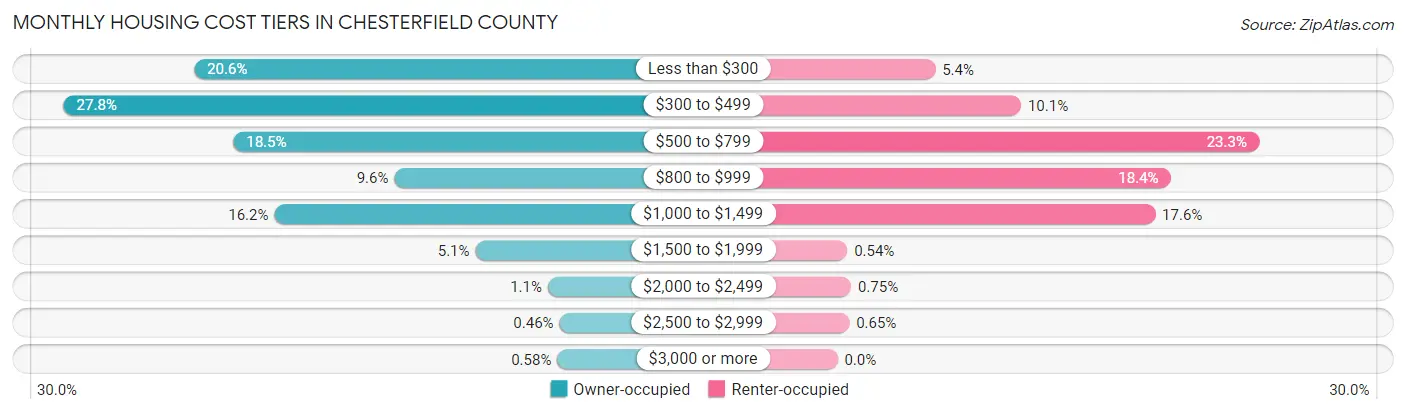
| Monthly Cost | Owner-occupied | Renter-occupied |
| Less than $300 | 2,548 (20.6%) | 258 (5.4%) |
| $300 to $499 | 3,436 (27.8%) | 484 (10.1%) |
| $500 to $799 | 2,280 (18.5%) | 1,111 (23.3%) |
| $800 to $999 | 1,182 (9.6%) | 878 (18.4%) |
| $1,000 to $1,499 | 2,001 (16.2%) | 838 (17.5%) |
| $1,500 to $1,999 | 630 (5.1%) | 26 (0.5%) |
| $2,000 to $2,499 | 136 (1.1%) | 36 (0.7%) |
| $2,500 to $2,999 | 57 (0.5%) | 31 (0.6%) |
| $3,000 or more | 72 (0.6%) | 0 (0.0%) |
| Total | 12,342 (100.0%) | 4,774 (100.0%) |
Physical Housing Characteristics in Chesterfield County
Housing Structures in Chesterfield County
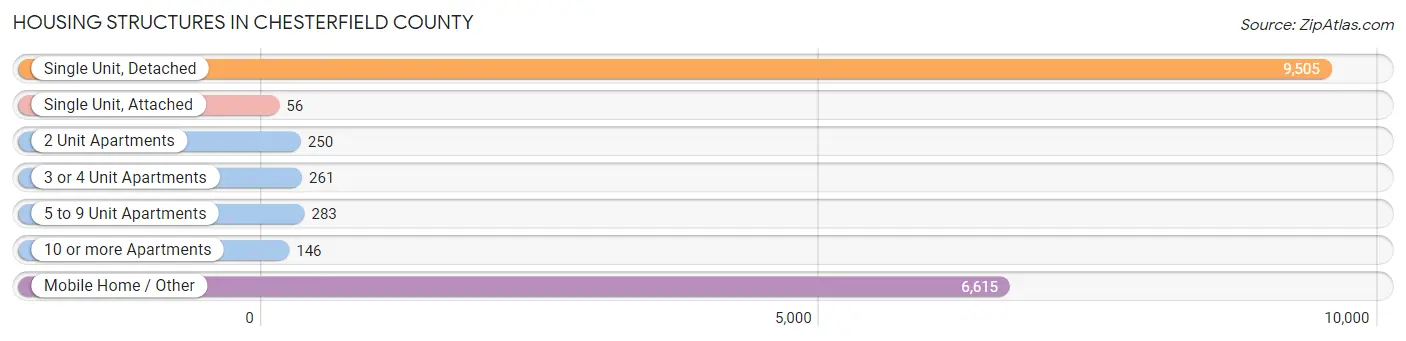
| Structure Type | # Housing Units | % Housing Units |
| Single Unit, Detached | 9,505 | 55.5% |
| Single Unit, Attached | 56 | 0.3% |
| 2 Unit Apartments | 250 | 1.5% |
| 3 or 4 Unit Apartments | 261 | 1.5% |
| 5 to 9 Unit Apartments | 283 | 1.7% |
| 10 or more Apartments | 146 | 0.9% |
| Mobile Home / Other | 6,615 | 38.7% |
| Total | 17,116 | 100.0% |
Housing Structures by Occupancy in Chesterfield County
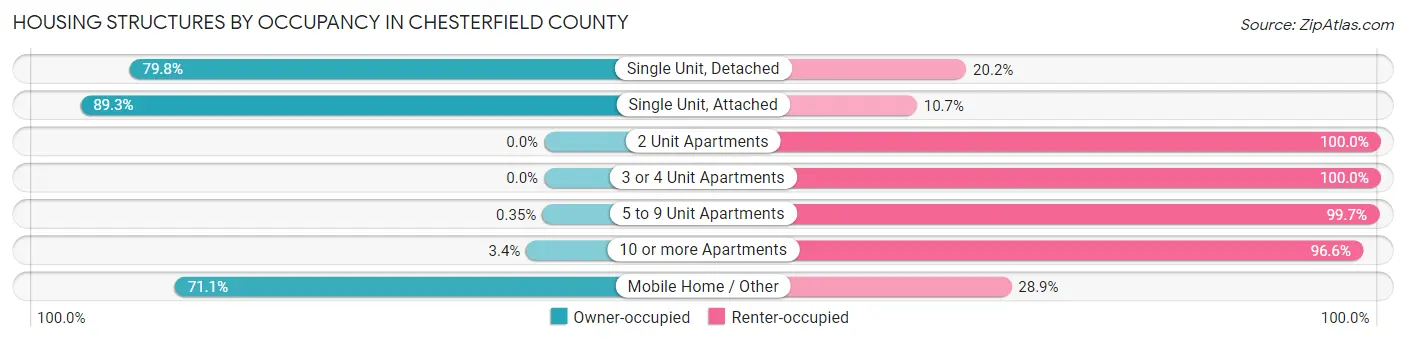
| Structure Type | Owner-occupied | Renter-occupied |
| Single Unit, Detached | 7,584 (79.8%) | 1,921 (20.2%) |
| Single Unit, Attached | 50 (89.3%) | 6 (10.7%) |
| 2 Unit Apartments | 0 (0.0%) | 250 (100.0%) |
| 3 or 4 Unit Apartments | 0 (0.0%) | 261 (100.0%) |
| 5 to 9 Unit Apartments | 1 (0.4%) | 282 (99.7%) |
| 10 or more Apartments | 5 (3.4%) | 141 (96.6%) |
| Mobile Home / Other | 4,702 (71.1%) | 1,913 (28.9%) |
| Total | 12,342 (72.1%) | 4,774 (27.9%) |
Housing Structures by Number of Rooms in Chesterfield County
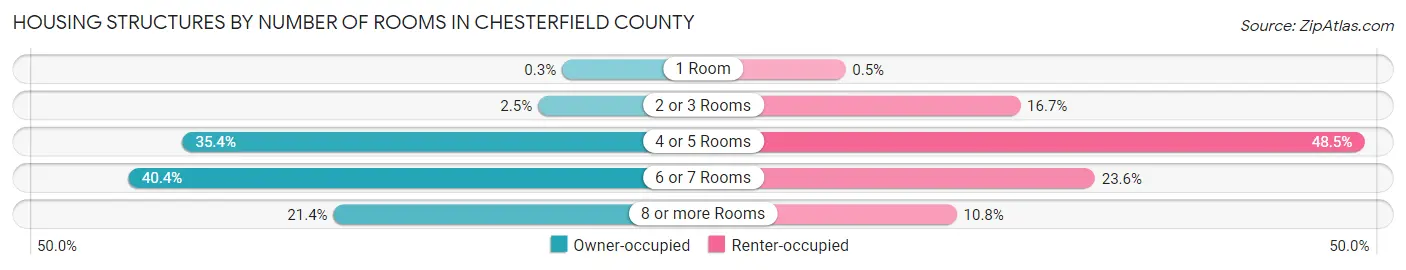
| Number of Rooms | Owner-occupied | Renter-occupied |
| 1 Room | 37 (0.3%) | 24 (0.5%) |
| 2 or 3 Rooms | 311 (2.5%) | 796 (16.7%) |
| 4 or 5 Rooms | 4,368 (35.4%) | 2,314 (48.5%) |
| 6 or 7 Rooms | 4,980 (40.4%) | 1,125 (23.6%) |
| 8 or more Rooms | 2,646 (21.4%) | 515 (10.8%) |
| Total | 12,342 (100.0%) | 4,774 (100.0%) |
Housing Structure by Heating Type in Chesterfield County
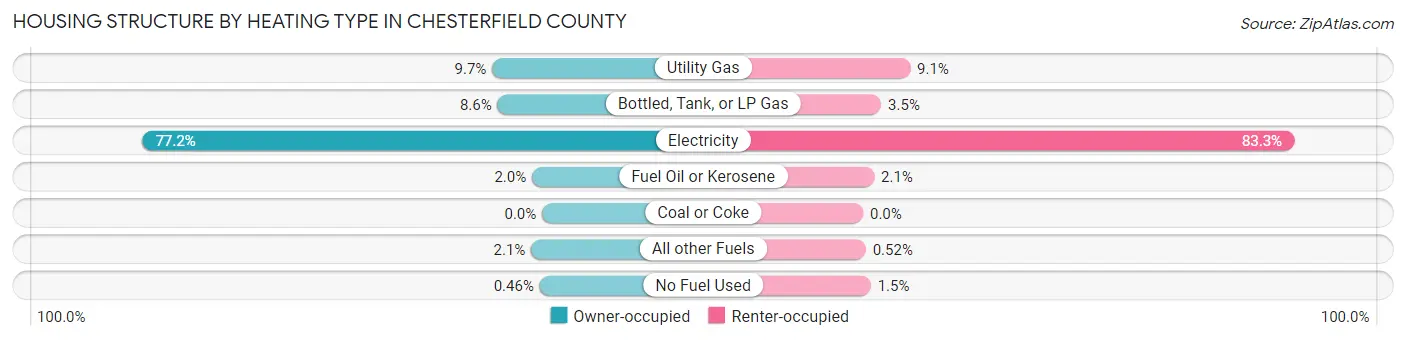
| Heating Type | Owner-occupied | Renter-occupied |
| Utility Gas | 1,191 (9.7%) | 434 (9.1%) |
| Bottled, Tank, or LP Gas | 1,063 (8.6%) | 167 (3.5%) |
| Electricity | 9,530 (77.2%) | 3,975 (83.3%) |
| Fuel Oil or Kerosene | 241 (1.9%) | 102 (2.1%) |
| Coal or Coke | 0 (0.0%) | 0 (0.0%) |
| All other Fuels | 260 (2.1%) | 25 (0.5%) |
| No Fuel Used | 57 (0.5%) | 71 (1.5%) |
| Total | 12,342 (100.0%) | 4,774 (100.0%) |
Household Vehicle Usage in Chesterfield County
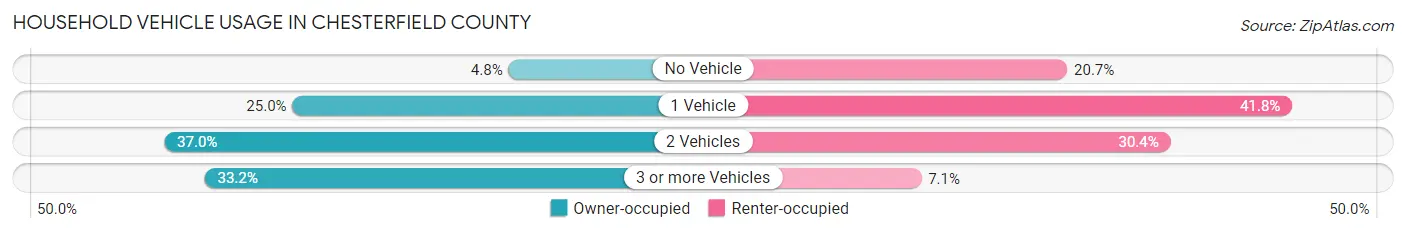
| Vehicles per Household | Owner-occupied | Renter-occupied |
| No Vehicle | 596 (4.8%) | 990 (20.7%) |
| 1 Vehicle | 3,086 (25.0%) | 1,993 (41.7%) |
| 2 Vehicles | 4,563 (37.0%) | 1,451 (30.4%) |
| 3 or more Vehicles | 4,097 (33.2%) | 340 (7.1%) |
| Total | 12,342 (100.0%) | 4,774 (100.0%) |
Real Estate & Mortgages in Chesterfield County
Real Estate and Mortgage Overview in Chesterfield County
| Characteristic | Without Mortgage | With Mortgage |
| Housing Units | 7,349 | 4,993 |
| Median Property Value | $73,300 | $123,700 |
| Median Household Income | $43,429 | $641 |
| Monthly Housing Costs | $357 | $66 |
| Real Estate Taxes | $364 | $329 |
Property Value by Mortgage Status in Chesterfield County
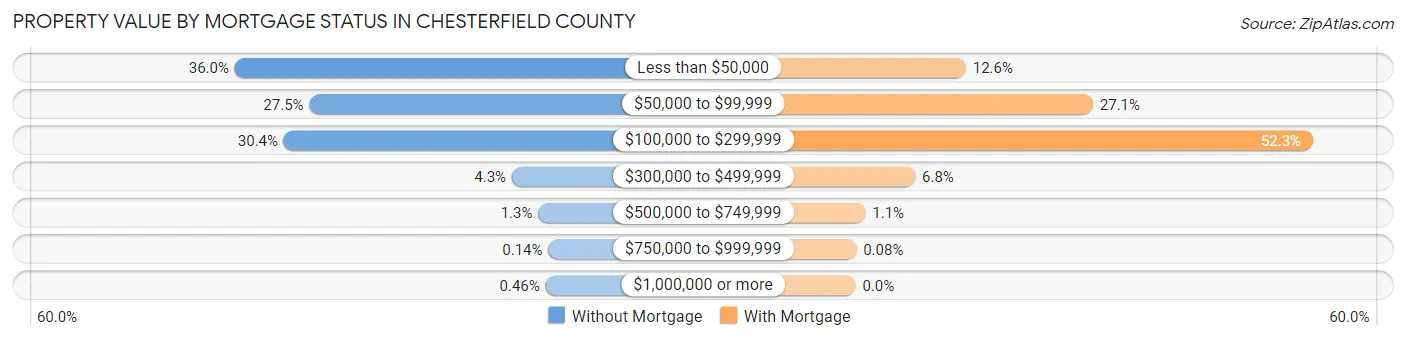
| Property Value | Without Mortgage | With Mortgage |
| Less than $50,000 | 2,644 (36.0%) | 629 (12.6%) |
| $50,000 to $99,999 | 2,017 (27.5%) | 1,354 (27.1%) |
| $100,000 to $299,999 | 2,232 (30.4%) | 2,610 (52.3%) |
| $300,000 to $499,999 | 317 (4.3%) | 340 (6.8%) |
| $500,000 to $749,999 | 95 (1.3%) | 56 (1.1%) |
| $750,000 to $999,999 | 10 (0.1%) | 4 (0.1%) |
| $1,000,000 or more | 34 (0.5%) | 0 (0.0%) |
| Total | 7,349 (100.0%) | 4,993 (100.0%) |
Household Income by Mortgage Status in Chesterfield County
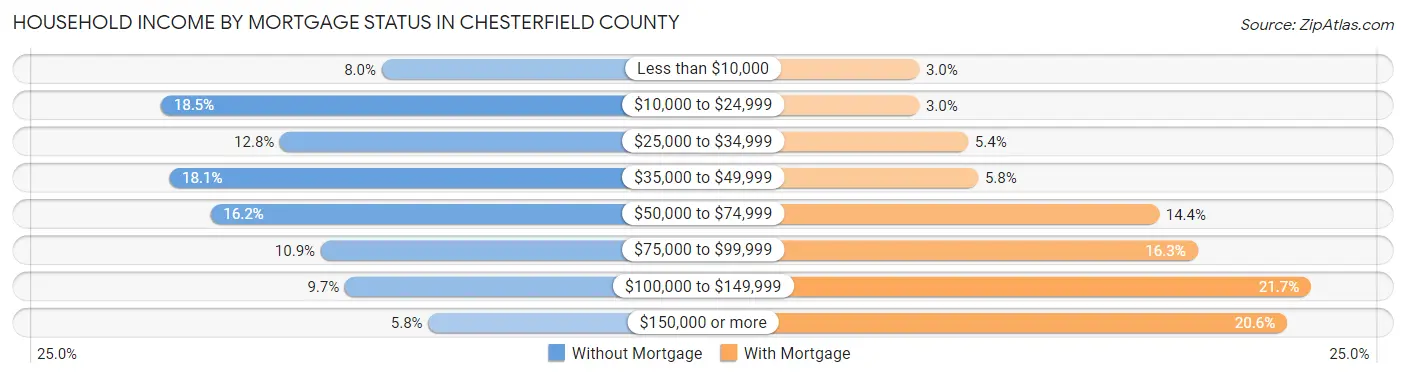
| Household Income | Without Mortgage | With Mortgage |
| Less than $10,000 | 587 (8.0%) | 151 (3.0%) |
| $10,000 to $24,999 | 1,360 (18.5%) | 151 (3.0%) |
| $25,000 to $34,999 | 943 (12.8%) | 267 (5.3%) |
| $35,000 to $49,999 | 1,332 (18.1%) | 291 (5.8%) |
| $50,000 to $74,999 | 1,187 (16.2%) | 721 (14.4%) |
| $75,000 to $99,999 | 800 (10.9%) | 813 (16.3%) |
| $100,000 to $149,999 | 716 (9.7%) | 1,083 (21.7%) |
| $150,000 or more | 424 (5.8%) | 1,026 (20.5%) |
| Total | 7,349 (100.0%) | 4,993 (100.0%) |
Property Value to Household Income Ratio in Chesterfield County
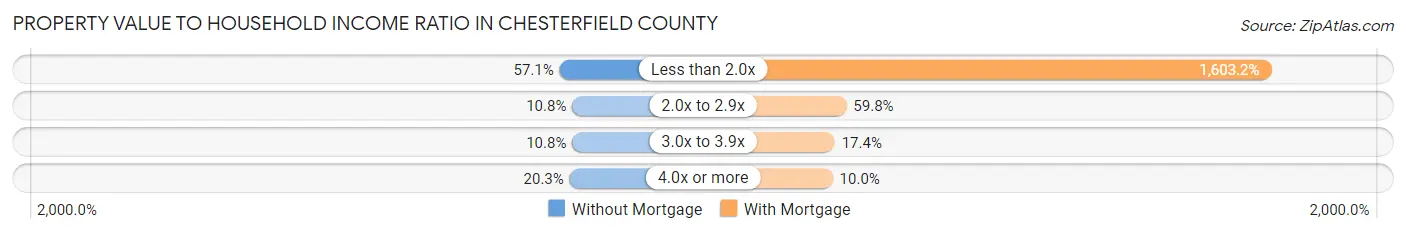
| Value-to-Income Ratio | Without Mortgage | With Mortgage |
| Less than 2.0x | 4,193 (57.1%) | 80,046 (1,603.2%) |
| 2.0x to 2.9x | 793 (10.8%) | 2,987 (59.8%) |
| 3.0x to 3.9x | 795 (10.8%) | 871 (17.4%) |
| 4.0x or more | 1,492 (20.3%) | 498 (10.0%) |
| Total | 7,349 (100.0%) | 4,993 (100.0%) |
Real Estate Taxes by Mortgage Status in Chesterfield County
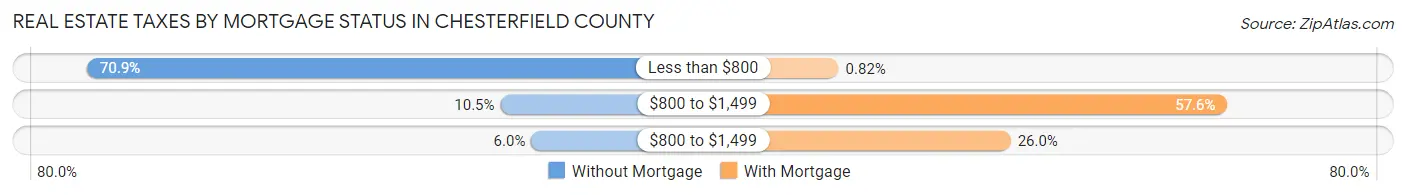
| Property Taxes | Without Mortgage | With Mortgage |
| Less than $800 | 5,210 (70.9%) | 41 (0.8%) |
| $800 to $1,499 | 770 (10.5%) | 2,876 (57.6%) |
| $800 to $1,499 | 439 (6.0%) | 1,296 (26.0%) |
| Total | 7,349 (100.0%) | 4,993 (100.0%) |
Health & Disability in Chesterfield County
Health Insurance Coverage by Age in Chesterfield County
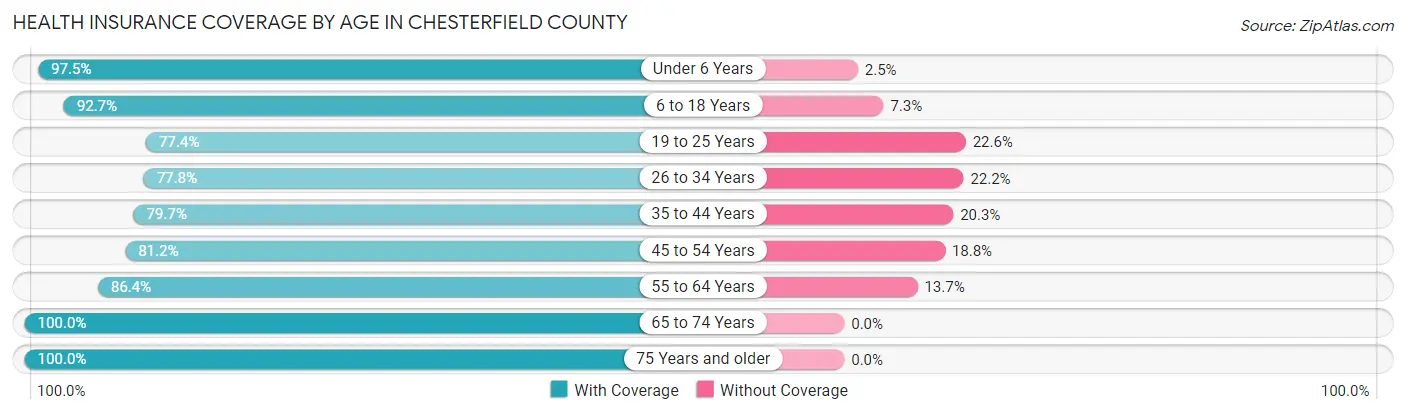
| Age Bracket | With Coverage | Without Coverage |
| Under 6 Years | 2,814 (97.5%) | 73 (2.5%) |
| 6 to 18 Years | 6,673 (92.7%) | 526 (7.3%) |
| 19 to 25 Years | 2,662 (77.4%) | 779 (22.6%) |
| 26 to 34 Years | 3,643 (77.8%) | 1,041 (22.2%) |
| 35 to 44 Years | 3,719 (79.7%) | 948 (20.3%) |
| 45 to 54 Years | 4,943 (81.2%) | 1,142 (18.8%) |
| 55 to 64 Years | 5,347 (86.4%) | 845 (13.7%) |
| 65 to 74 Years | 5,031 (100.0%) | 0 (0.0%) |
| 75 Years and older | 2,924 (100.0%) | 0 (0.0%) |
| Total | 37,756 (87.6%) | 5,354 (12.4%) |
Health Insurance Coverage by Citizenship Status in Chesterfield County
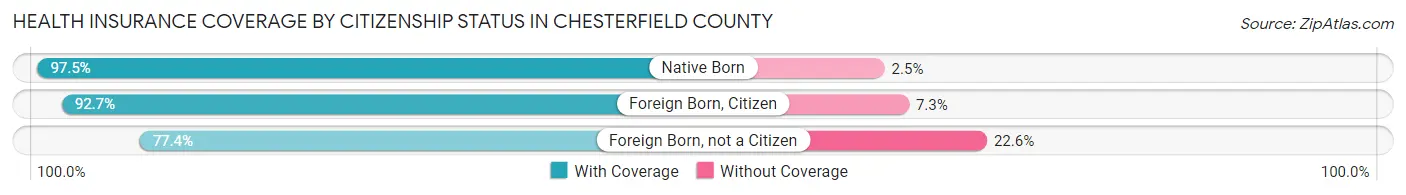
| Citizenship Status | With Coverage | Without Coverage |
| Native Born | 2,814 (97.5%) | 73 (2.5%) |
| Foreign Born, Citizen | 6,673 (92.7%) | 526 (7.3%) |
| Foreign Born, not a Citizen | 2,662 (77.4%) | 779 (22.6%) |
Health Insurance Coverage by Household Income in Chesterfield County
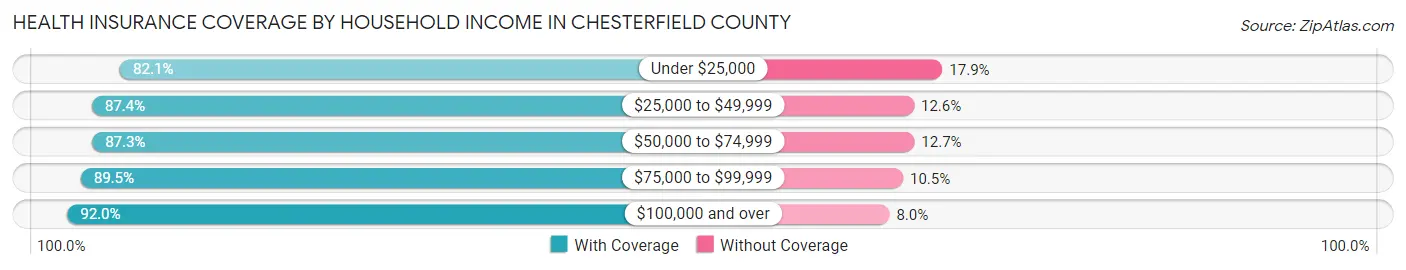
| Household Income | With Coverage | Without Coverage |
| Under $25,000 | 7,019 (82.1%) | 1,531 (17.9%) |
| $25,000 to $49,999 | 9,181 (87.4%) | 1,323 (12.6%) |
| $50,000 to $74,999 | 6,319 (87.3%) | 917 (12.7%) |
| $75,000 to $99,999 | 5,527 (89.5%) | 651 (10.5%) |
| $100,000 and over | 9,257 (92.0%) | 805 (8.0%) |
Public vs Private Health Insurance Coverage by Age in Chesterfield County
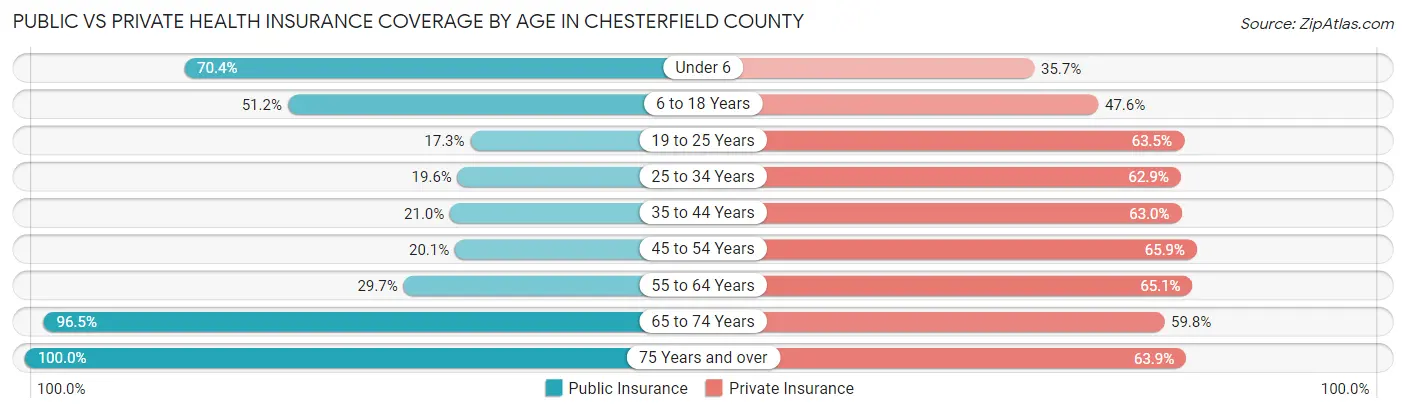
| Age Bracket | Public Insurance | Private Insurance |
| Under 6 | 2,032 (70.4%) | 1,030 (35.7%) |
| 6 to 18 Years | 3,683 (51.2%) | 3,424 (47.6%) |
| 19 to 25 Years | 594 (17.3%) | 2,184 (63.5%) |
| 25 to 34 Years | 919 (19.6%) | 2,946 (62.9%) |
| 35 to 44 Years | 981 (21.0%) | 2,941 (63.0%) |
| 45 to 54 Years | 1,223 (20.1%) | 4,010 (65.9%) |
| 55 to 64 Years | 1,837 (29.7%) | 4,030 (65.1%) |
| 65 to 74 Years | 4,854 (96.5%) | 3,009 (59.8%) |
| 75 Years and over | 2,923 (100.0%) | 1,868 (63.9%) |
| Total | 19,046 (44.2%) | 25,442 (59.0%) |
Disability Status by Sex by Age in Chesterfield County
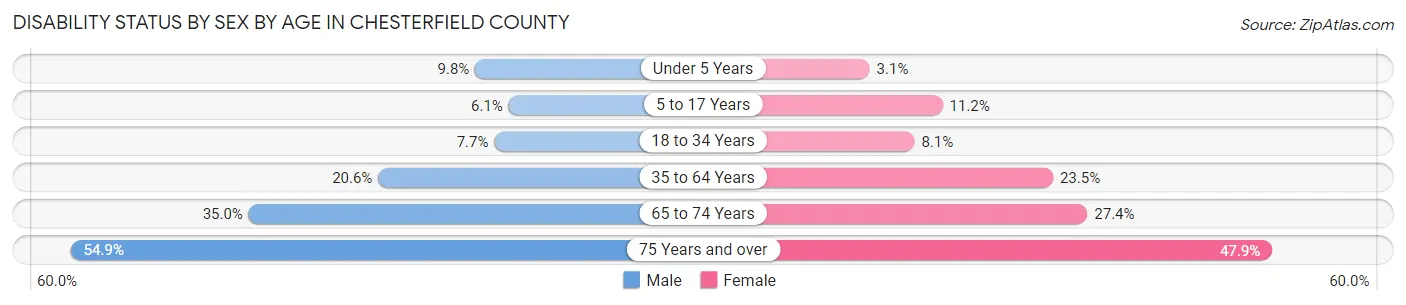
| Age Bracket | Male | Female |
| Under 5 Years | 126 (9.8%) | 34 (3.1%) |
| 5 to 17 Years | 220 (6.1%) | 404 (11.2%) |
| 18 to 34 Years | 333 (7.7%) | 347 (8.1%) |
| 35 to 64 Years | 1,723 (20.6%) | 2,020 (23.5%) |
| 65 to 74 Years | 820 (35.0%) | 736 (27.4%) |
| 75 Years and over | 652 (54.9%) | 832 (47.9%) |
Disability Class by Sex by Age in Chesterfield County
Disability Class: Hearing Difficulty
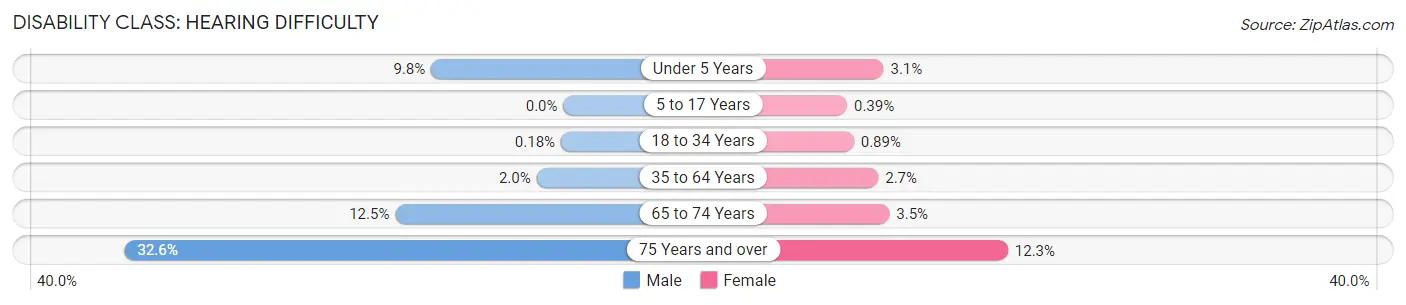
| Age Bracket | Male | Female |
| Under 5 Years | 126 (9.8%) | 34 (3.1%) |
| 5 to 17 Years | 0 (0.0%) | 14 (0.4%) |
| 18 to 34 Years | 8 (0.2%) | 38 (0.9%) |
| 35 to 64 Years | 166 (2.0%) | 233 (2.7%) |
| 65 to 74 Years | 292 (12.5%) | 95 (3.5%) |
| 75 Years and over | 387 (32.6%) | 214 (12.3%) |
Disability Class: Vision Difficulty
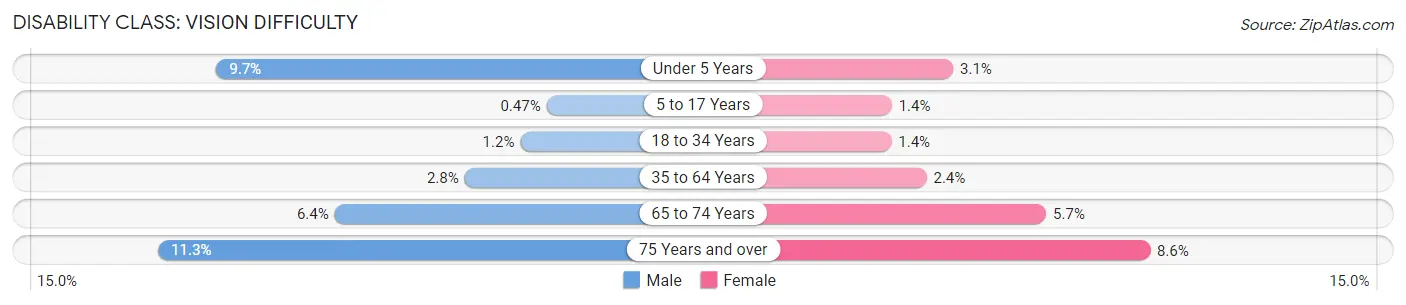
| Age Bracket | Male | Female |
| Under 5 Years | 124 (9.7%) | 34 (3.1%) |
| 5 to 17 Years | 17 (0.5%) | 50 (1.4%) |
| 18 to 34 Years | 52 (1.2%) | 59 (1.4%) |
| 35 to 64 Years | 230 (2.8%) | 203 (2.4%) |
| 65 to 74 Years | 149 (6.4%) | 153 (5.7%) |
| 75 Years and over | 134 (11.3%) | 149 (8.6%) |
Disability Class: Cognitive Difficulty
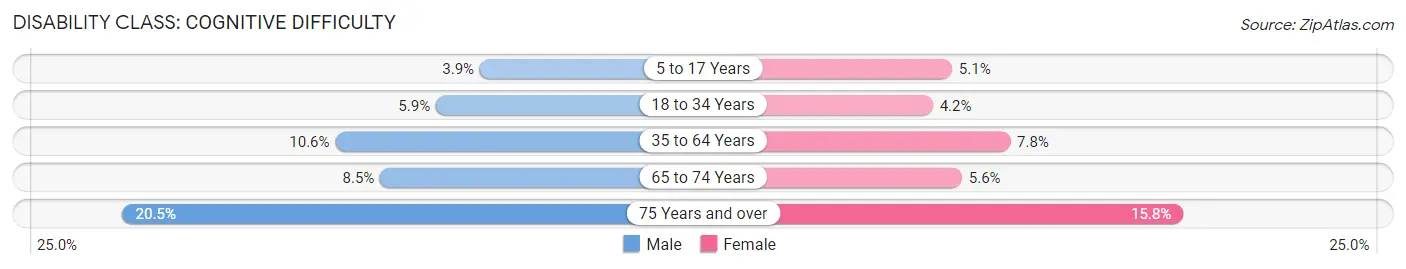
| Age Bracket | Male | Female |
| 5 to 17 Years | 140 (3.9%) | 184 (5.1%) |
| 18 to 34 Years | 256 (5.9%) | 181 (4.2%) |
| 35 to 64 Years | 884 (10.6%) | 671 (7.8%) |
| 65 to 74 Years | 199 (8.5%) | 150 (5.6%) |
| 75 Years and over | 243 (20.4%) | 275 (15.8%) |
Disability Class: Ambulatory Difficulty
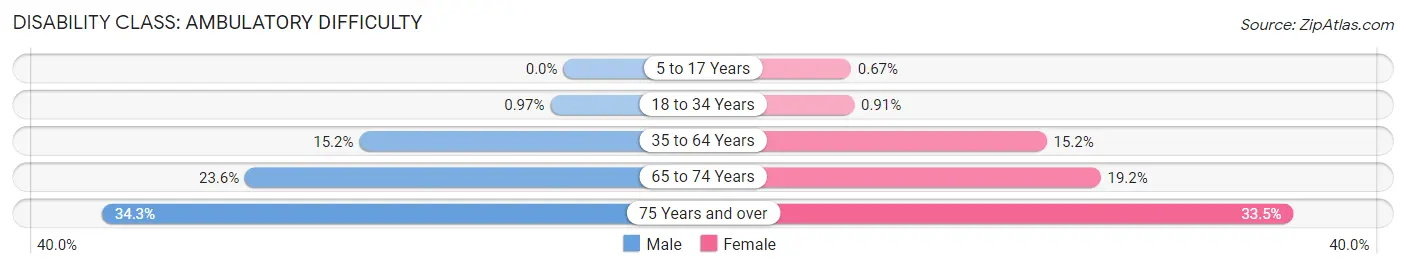
| Age Bracket | Male | Female |
| 5 to 17 Years | 0 (0.0%) | 24 (0.7%) |
| 18 to 34 Years | 42 (1.0%) | 39 (0.9%) |
| 35 to 64 Years | 1,266 (15.1%) | 1,306 (15.2%) |
| 65 to 74 Years | 553 (23.6%) | 517 (19.2%) |
| 75 Years and over | 407 (34.3%) | 582 (33.5%) |
Disability Class: Self-Care Difficulty
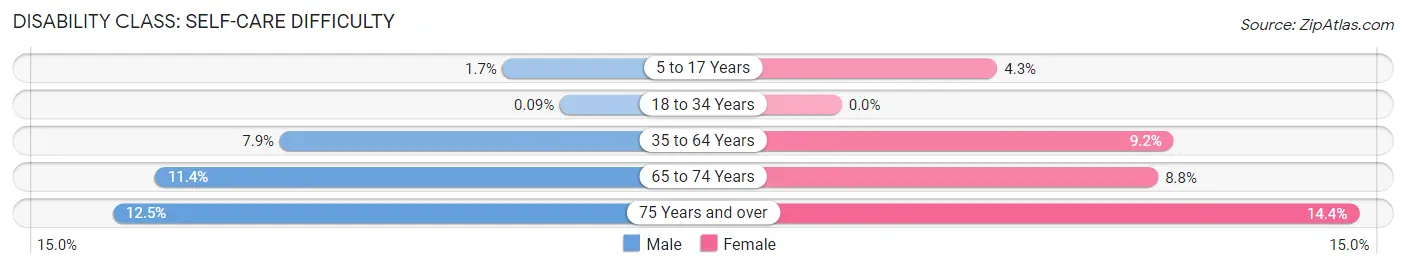
| Age Bracket | Male | Female |
| 5 to 17 Years | 61 (1.7%) | 156 (4.3%) |
| 18 to 34 Years | 4 (0.1%) | 0 (0.0%) |
| 35 to 64 Years | 659 (7.9%) | 794 (9.2%) |
| 65 to 74 Years | 266 (11.4%) | 237 (8.8%) |
| 75 Years and over | 149 (12.5%) | 250 (14.4%) |
Technology Access in Chesterfield County
Computing Device Access in Chesterfield County
| Device Type | # Households | % Households |
| Desktop or Laptop | 10,664 | 62.3% |
| Smartphone | 13,230 | 77.3% |
| Tablet | 8,292 | 48.4% |
| No Computing Device | 2,545 | 14.9% |
| Total | 17,116 | 100.0% |
Internet Access in Chesterfield County
| Internet Type | # Households | % Households |
| Dial-Up Internet | 7 | 0.0% |
| Broadband Home | 10,373 | 60.6% |
| Cellular Data Only | 1,971 | 11.5% |
| Satellite Internet | 1,341 | 7.8% |
| No Internet | 3,929 | 23.0% |
| Total | 17,116 | 100.0% |
Chesterfield County Summary
Chesterfield County is located in the Pee Dee region of South Carolina, and is bordered by North Carolina to the north, Marlboro County to the east, Darlington County to the south, and Lancaster County to the west. The county seat is Chesterfield, and the county has a population of 46,734 as of the 2010 census.
History
Chesterfield County was formed in 1785 from parts of Marlboro and Cheraw Districts. It was named for Philip Stanhope, 4th Earl of Chesterfield, who was a British statesman and diplomat. The county was originally part of the Cheraw District, which was established in 1768.
The county was the site of several battles during the Revolutionary War, including the Battle of Hanging Rock in 1780. The county was also the site of the Battle of Cheraw in 1776, which was a major victory for the British.
The county was also the site of the Battle of Blackstock's Plantation in 1780, which was a major victory for the American forces.
The county was also the site of the Battle of Camden in 1780, which was a major victory for the British.
The county was also the site of the Battle of Eutaw Springs in 1781, which was a major victory for the American forces.
The county was also the site of the Battle of Fishing Creek in 1780, which was a major victory for the American forces.
The county was also the site of the Battle of Hanging Rock in 1780, which was a major victory for the American forces.
The county was also the site of the Battle of Kings Mountain in 1780, which was a major victory for the American forces.
The county was also the site of the Battle of Rocky Mount in 1780, which was a major victory for the American forces.
The county was also the site of the Battle of Waxhaws in 1780, which was a major victory for the British.
The county was also the site of the Battle of Wetzell's Mill in 1781, which was a major victory for the American forces.
Geography
Chesterfield County is located in the Pee Dee region of South Carolina, and is bordered by North Carolina to the north, Marlboro County to the east, Darlington County to the south, and Lancaster County to the west. The county has a total area of 545 square miles, of which 543 square miles is land and 2 square miles is water. The county is located in the Pee Dee River basin, and is drained by the Pee Dee, Lynches, and Great Pee Dee Rivers.
The county is mostly flat, with some rolling hills in the northern part of the county. The highest point in the county is located in the northern part of the county, and is approximately 400 feet above sea level.
Economy
The economy of Chesterfield County is largely based on agriculture, with tobacco, cotton, soybeans, and corn being the main crops. The county also has a large timber industry, and is home to several large paper mills.
The county is also home to several manufacturing companies, including a large textile mill, a furniture factory, and a plastics plant.
The county is also home to several large retail stores including Walmart Lowe s and Home Depot
Demographics
As of the 2010 census, the population of Chesterfield County was 46,734. The racial makeup of the county was 68.3% White, 28.2% African American, 0.4% Native American, 0.7% Asian, 0.1% Pacific Islander, 0.7% from other races, and 1.6% from two or more races. Hispanic or Latino of any race were 2.2% of the population.
The median income for a household in the county was $35,945, and the median income for a family was $43,945. The per capita income for the county was $17,845. About 17.2% of families and 21.3% of the population were below the poverty line, including 28.3% of those under age 18 and 16.2% of those age 65 or over.
Common Questions
What is Per Capita Income in Chesterfield County?
Per Capita income in Chesterfield County is $26,435.
What is the Median Family Income in Chesterfield County?
Median Family Income in Chesterfield County is $59,486.
What is the Median Household income in Chesterfield County?
Median Household Income in Chesterfield County is $46,326.
What is Income or Wage Gap in Chesterfield County?
Income or Wage Gap in Chesterfield County is 30.4%.
Women in Chesterfield County earn 69.6 cents for every dollar earned by a man.
What is Family Income Deficit in Chesterfield County?
Family Income Deficit in Chesterfield County is $10,344.
Families that are below poverty line in Chesterfield County earn $10,344 less on average than the poverty threshold level.
What is Inequality or Gini Index in Chesterfield County?
Inequality or Gini Index in Chesterfield County is 0.47.
What is the Total Population of Chesterfield County?
Total Population of Chesterfield County is 43,536.
What is the Total Male Population of Chesterfield County?
Total Male Population of Chesterfield County is 21,350.
What is the Total Female Population of Chesterfield County?
Total Female Population of Chesterfield County is 22,186.
What is the Ratio of Males per 100 Females in Chesterfield County?
There are 96.23 Males per 100 Females in Chesterfield County.
What is the Ratio of Females per 100 Males in Chesterfield County?
There are 103.92 Females per 100 Males in Chesterfield County.
What is the Median Population Age in Chesterfield County?
Median Population Age in Chesterfield County is 42.6 Years.
What is the Average Family Size in Chesterfield County
Average Family Size in Chesterfield County is 3.1 People.
What is the Average Household Size in Chesterfield County
Average Household Size in Chesterfield County is 2.5 People.
How Large is the Labor Force in Chesterfield County?
There are 19,914 People in the Labor Forcein in Chesterfield County.
What is the Percentage of People in the Labor Force in Chesterfield County?
56.8% of People are in the Labor Force in Chesterfield County.
What is the Unemployment Rate in Chesterfield County?
Unemployment Rate in Chesterfield County is 8.7%.