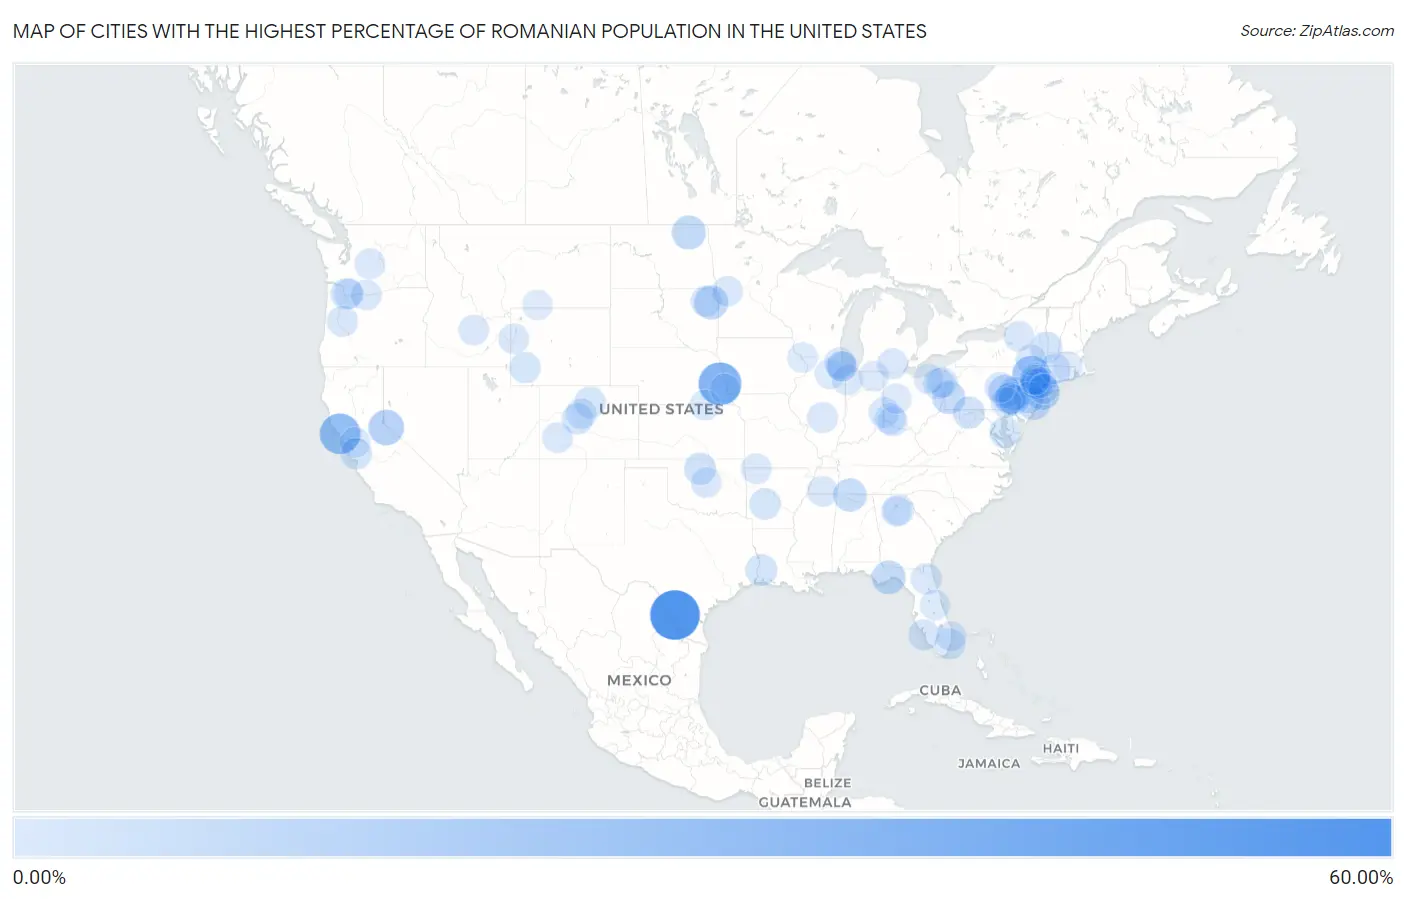
Cities with the Highest Percentage of Romanian Population in the United States
RELATED REPORTS & OPTIONS
Romanian
United States
Compare Cities
Map of Cities with the Highest Percentage of Romanian Population in the United States
0.00%
60.00%
Cities with the Highest Percentage of Romanian Population in the United States
| City | Romanian | vs State | vs National | |
| 1. | Botines | 53.85% | 0.061%(+53.8)#1 | 0.14%(+53.7)#1 |
| 2. | Wann | 35.48% | 0.043%(+35.4)#1 | 0.14%(+35.3)#2 |
| 3. | Sereno Del Mar | 29.59% | 0.15%(+29.4)#1 | 0.14%(+29.5)#3 |
| 4. | Bloomingburg | 23.18% | 0.26%(+22.9)#1 | 0.14%(+23.0)#4 |
| 5. | Alpine Village | 16.36% | 0.15%(+16.2)#2 | 0.14%(+16.2)#5 |
| 6. | Hewlett Bay Park | 13.88% | 0.26%(+13.6)#2 | 0.14%(+13.7)#6 |
| 7. | Loma | 12.50% | 0.11%(+12.4)#1 | 0.14%(+12.4)#7 |
| 8. | Marvin | 12.50% | 0.029%(+12.5)#1 | 0.14%(+12.4)#8 |
| 9. | Trexlertown | 12.10% | 0.14%(+12.0)#1 | 0.14%(+12.0)#9 |
| 10. | Sopchoppy | 11.74% | 0.17%(+11.6)#1 | 0.14%(+11.6)#10 |
| 11. | Kaser | 11.56% | 0.26%(+11.3)#3 | 0.14%(+11.4)#11 |
| 12. | Lester | 10.64% | 0.037%(+10.6)#1 | 0.14%(+10.5)#12 |
| 13. | Noblestown | 10.53% | 0.14%(+10.4)#2 | 0.14%(+10.4)#13 |
| 14. | Forestville | 9.76% | 0.14%(+9.62)#3 | 0.14%(+9.62)#14 |
| 15. | Cedar Glen West | 9.30% | 0.21%(+9.09)#1 | 0.14%(+9.16)#15 |
| 16. | Alsace Manor | 7.98% | 0.14%(+7.84)#4 | 0.14%(+7.84)#16 |
| 17. | Bier | 7.48% | 0.11%(+7.36)#1 | 0.14%(+7.34)#17 |
| 18. | Breckenridge | 7.32% | 0.040%(+7.28)#1 | 0.14%(+7.18)#18 |
| 19. | South Blooming Grove | 6.84% | 0.26%(+6.58)#4 | 0.14%(+6.70)#19 |
| 20. | Oretta | 6.68% | 0.050%(+6.63)#1 | 0.14%(+6.54)#20 |
| 21. | Renaissance At Monroe | 6.66% | 0.21%(+6.45)#2 | 0.14%(+6.52)#21 |
| 22. | Allenhurst Borough | 6.55% | 0.21%(+6.34)#3 | 0.14%(+6.41)#22 |
| 23. | Cambridge | 6.53% | 0.26%(+6.27)#5 | 0.14%(+6.39)#23 |
| 24. | East Rocky Hill | 6.33% | 0.21%(+6.12)#4 | 0.14%(+6.19)#24 |
| 25. | Bark Ranch | 6.20% | 0.11%(+6.09)#1 | 0.14%(+6.06)#25 |
| 26. | Rockwell | 5.97% | 0.046%(+5.92)#1 | 0.14%(+5.83)#26 |
| 27. | Pennwyn | 5.88% | 0.14%(+5.75)#5 | 0.14%(+5.74)#27 |
| 28. | Red Hill | 5.88% | 0.14%(+5.75)#6 | 0.14%(+5.74)#28 |
| 29. | Barberton | 5.81% | 0.26%(+5.55)#1 | 0.14%(+5.68)#29 |
| 30. | Burbank | 5.75% | 0.15%(+5.60)#3 | 0.14%(+5.61)#30 |
| 31. | Leadville North | 5.74% | 0.11%(+5.63)#2 | 0.14%(+5.60)#31 |
| 32. | Stratford Downtown | 5.64% | 0.19%(+5.45)#1 | 0.14%(+5.51)#32 |
| 33. | New Baltimore | 5.58% | 0.26%(+5.32)#6 | 0.14%(+5.44)#33 |
| 34. | Lake Milton | 5.54% | 0.22%(+5.32)#1 | 0.14%(+5.41)#34 |
| 35. | Taylors Island | 5.50% | 0.11%(+5.39)#2 | 0.14%(+5.37)#35 |
| 36. | Fontenelle | 5.41% | 0.067%(+5.34)#1 | 0.14%(+5.27)#36 |
| 37. | Golden Beach | 5.29% | 0.17%(+5.12)#2 | 0.14%(+5.15)#37 |
| 38. | Oakland Cdp Lawrence County | 5.24% | 0.14%(+5.10)#7 | 0.14%(+5.10)#38 |
| 39. | South Pottstown | 5.21% | 0.14%(+5.07)#8 | 0.14%(+5.07)#39 |
| 40. | Penney Farms | 5.13% | 0.17%(+4.96)#3 | 0.14%(+4.99)#40 |
| 41. | Pekin | 5.11% | 0.22%(+4.89)#2 | 0.14%(+4.98)#41 |
| 42. | Prattsville | 5.10% | 0.26%(+4.84)#7 | 0.14%(+4.96)#42 |
| 43. | Waubay | 4.87% | 0.029%(+4.84)#2 | 0.14%(+4.73)#43 |
| 44. | Punta Rassa | 4.82% | 0.17%(+4.65)#4 | 0.14%(+4.68)#44 |
| 45. | Benton Borough | 4.78% | 0.14%(+4.65)#9 | 0.14%(+4.64)#45 |
| 46. | Crawfordsville | 4.76% | 0.24%(+4.53)#1 | 0.14%(+4.62)#46 |
| 47. | Harmonyville | 4.59% | 0.12%(+4.46)#1 | 0.14%(+4.45)#47 |
| 48. | Trappe Borough | 4.53% | 0.14%(+4.39)#10 | 0.14%(+4.39)#48 |
| 49. | Weston | 4.52% | 0.19%(+4.32)#2 | 0.14%(+4.38)#49 |
| 50. | Wassaic | 4.51% | 0.26%(+4.24)#8 | 0.14%(+4.37)#50 |
| 51. | Topstone | 4.49% | 0.19%(+4.30)#3 | 0.14%(+4.36)#51 |
| 52. | Oconee | 4.47% | 0.27%(+4.20)#1 | 0.14%(+4.33)#52 |
| 53. | Napoleon | 4.41% | 0.25%(+4.16)#1 | 0.14%(+4.27)#53 |
| 54. | Mettawa | 4.33% | 0.27%(+4.06)#2 | 0.14%(+4.19)#54 |
| 55. | Hickory Valley | 4.32% | 0.065%(+4.25)#1 | 0.14%(+4.18)#55 |
| 56. | North Gate | 4.22% | 0.15%(+4.07)#4 | 0.14%(+4.08)#56 |
| 57. | Dallesport | 4.21% | 0.26%(+3.95)#2 | 0.14%(+4.07)#57 |
| 58. | South Cle Elum | 4.20% | 0.26%(+3.94)#3 | 0.14%(+4.06)#58 |
| 59. | Cadyville | 4.19% | 0.26%(+3.93)#9 | 0.14%(+4.05)#59 |
| 60. | Rockledge Borough | 4.15% | 0.14%(+4.02)#11 | 0.14%(+4.02)#60 |
| 61. | Beaver | 4.08% | 0.046%(+4.04)#2 | 0.14%(+3.94)#61 |
| 62. | Mahaska | 4.08% | 0.038%(+4.04)#1 | 0.14%(+3.94)#62 |
| 63. | Breckenridge | 4.07% | 0.11%(+3.96)#3 | 0.14%(+3.93)#63 |
| 64. | Concorde Hills | 4.05% | 0.22%(+3.83)#3 | 0.14%(+3.91)#64 |
| 65. | Barnes Lake | 4.02% | 0.25%(+3.77)#2 | 0.14%(+3.88)#65 |
| 66. | Loghill Village | 4.01% | 0.11%(+3.90)#4 | 0.14%(+3.87)#66 |
| 67. | Viola | 4.01% | 0.26%(+3.75)#10 | 0.14%(+3.87)#67 |
| 68. | Lake Dalecarlia | 4.01% | 0.12%(+3.89)#1 | 0.14%(+3.87)#68 |
| 69. | Tariffville | 3.99% | 0.19%(+3.80)#4 | 0.14%(+3.85)#69 |
| 70. | South Park | 3.95% | 0.067%(+3.88)#2 | 0.14%(+3.81)#70 |
| 71. | Mackay | 3.92% | 0.13%(+3.79)#1 | 0.14%(+3.78)#71 |
| 72. | Hoschton | 3.84% | 0.11%(+3.73)#1 | 0.14%(+3.70)#72 |
| 73. | Mckinley Heights | 3.84% | 0.22%(+3.62)#4 | 0.14%(+3.70)#73 |
| 74. | Hoffman | 3.82% | 0.10%(+3.72)#1 | 0.14%(+3.68)#74 |
| 75. | Clark Borough | 3.81% | 0.14%(+3.68)#12 | 0.14%(+3.67)#75 |
| 76. | Leola | 3.79% | 0.14%(+3.65)#13 | 0.14%(+3.65)#76 |
| 77. | Arcadia | 3.77% | 0.040%(+3.73)#2 | 0.14%(+3.63)#77 |
| 78. | Chappaqua | 3.77% | 0.26%(+3.51)#11 | 0.14%(+3.63)#78 |
| 79. | Lincolnwood | 3.75% | 0.27%(+3.49)#3 | 0.14%(+3.61)#79 |
| 80. | Port Leyden | 3.75% | 0.26%(+3.49)#12 | 0.14%(+3.61)#80 |
| 81. | Riverside | 3.75% | 0.14%(+3.61)#14 | 0.14%(+3.61)#81 |
| 82. | College Corner | 3.73% | 0.22%(+3.51)#5 | 0.14%(+3.59)#82 |
| 83. | Nehawka | 3.72% | 0.043%(+3.68)#2 | 0.14%(+3.58)#83 |
| 84. | Sandwich | 3.71% | 0.27%(+3.44)#4 | 0.14%(+3.57)#84 |
| 85. | Topeka | 3.71% | 0.12%(+3.59)#2 | 0.14%(+3.57)#85 |
| 86. | Batavia | 3.68% | 0.22%(+3.46)#6 | 0.14%(+3.55)#86 |
| 87. | Hockinson | 3.65% | 0.26%(+3.39)#4 | 0.14%(+3.51)#87 |
| 88. | Kiryas Joel | 3.50% | 0.26%(+3.24)#13 | 0.14%(+3.36)#88 |
| 89. | Highland Beach | 3.50% | 0.17%(+3.33)#5 | 0.14%(+3.36)#89 |
| 90. | Maverick Mountain | 3.45% | 0.100%(+3.35)#1 | 0.14%(+3.31)#90 |
| 91. | Old Brookville | 3.44% | 0.26%(+3.17)#14 | 0.14%(+3.30)#91 |
| 92. | De Graff | 3.42% | 0.22%(+3.20)#7 | 0.14%(+3.28)#92 |
| 93. | Seven Hills | 3.42% | 0.22%(+3.19)#8 | 0.14%(+3.28)#93 |
| 94. | Quinebaug | 3.38% | 0.19%(+3.19)#5 | 0.14%(+3.24)#94 |
| 95. | Menominee | 3.37% | 0.27%(+3.10)#5 | 0.14%(+3.23)#95 |
| 96. | Morton Grove | 3.36% | 0.27%(+3.09)#6 | 0.14%(+3.22)#96 |
| 97. | Dacula | 3.34% | 0.11%(+3.23)#2 | 0.14%(+3.21)#97 |
| 98. | Walnut Grove Cdp Sumner County | 3.33% | 0.065%(+3.27)#2 | 0.14%(+3.19)#98 |
| 99. | Bearcreek | 3.31% | 0.100%(+3.21)#2 | 0.14%(+3.17)#99 |
| 100. | Lake Mary Jane | 3.30% | 0.17%(+3.13)#6 | 0.14%(+3.16)#100 |
Common Questions
What are the Top 10 Cities with the Highest Percentage of Romanian Population in the United States?
Top 10 Cities with the Highest Percentage of Romanian Population in the United States are:
#1
53.85%
#2
35.48%
#3
29.59%
#4
23.18%
#5
16.36%
#6
13.88%
#7
12.50%
#8
12.50%
#9
12.10%
#10
11.74%
What city has the Highest Percentage of Romanian Population in the United States?
Botines has the Highest Percentage of Romanian Population in the United States with 53.85%.
What is the Percentage of Romanian Population in the United States?
Percentage of Romanian Population in the United States is 0.14%.