Cities with the Highest Percentage of Albanian Population in the United States
RELATED REPORTS & OPTIONS
Albanian
United States
Compare Cities
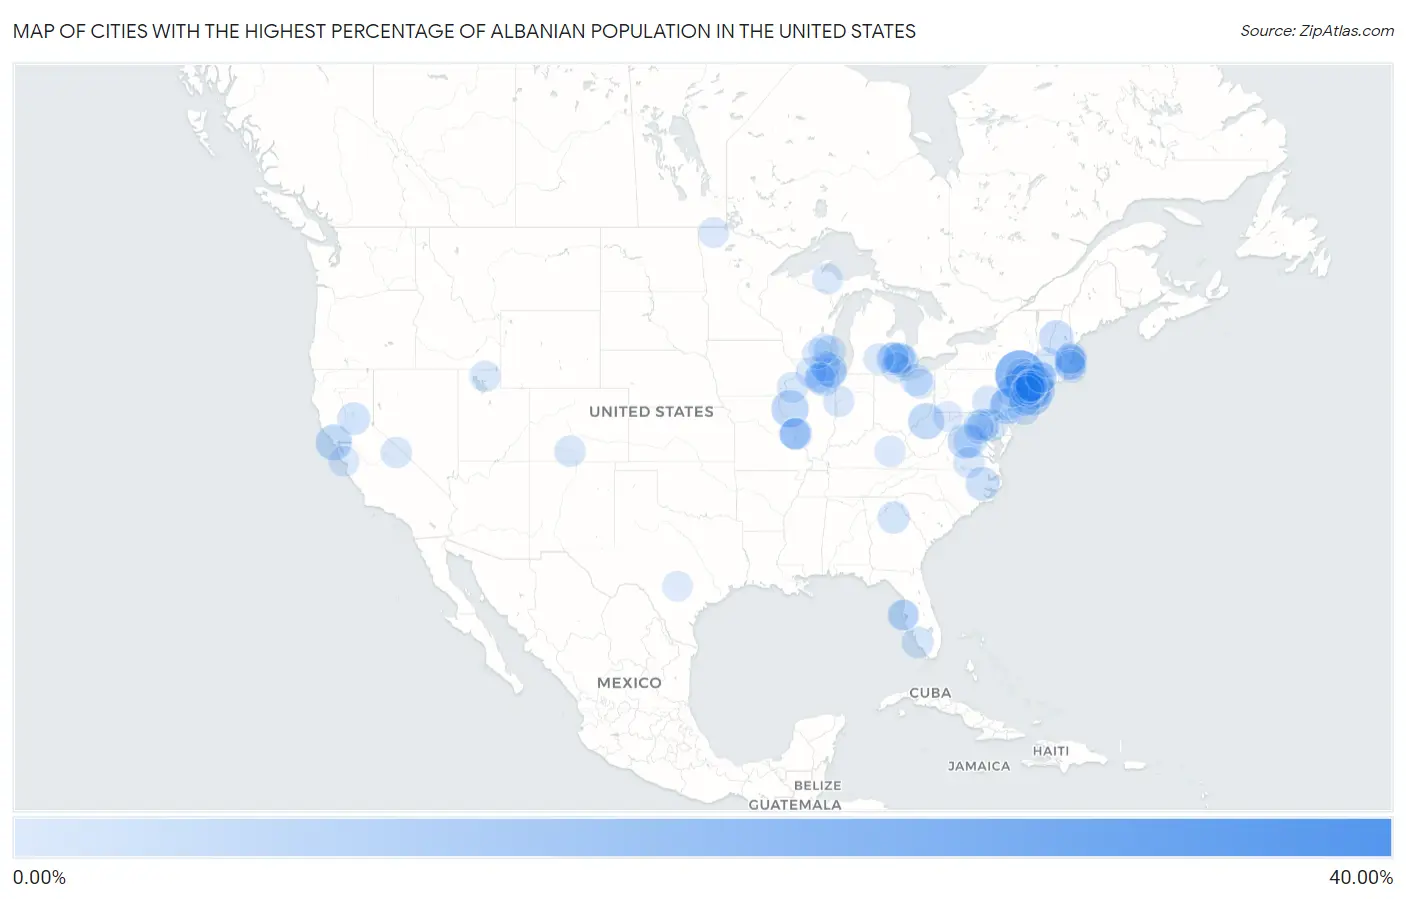
Map of Cities with the Highest Percentage of Albanian Population in the United States
0.00%
40.00%
Cities with the Highest Percentage of Albanian Population in the United States
| City | Albanian | vs State | vs National | |
| 1. | Foster | 30.50% | 0.0093%(+30.5)#1 | 0.066%(+30.4)#1 |
| 2. | Woodridge | 18.16% | 0.28%(+17.9)#1 | 0.066%(+18.1)#2 |
| 3. | Warwick | 8.82% | 0.28%(+8.55)#2 | 0.066%(+8.76)#3 |
| 4. | Barnum Island | 8.41% | 0.28%(+8.14)#3 | 0.066%(+8.35)#4 |
| 5. | Knollcrest | 7.62% | 0.33%(+7.29)#1 | 0.066%(+7.55)#5 |
| 6. | Versailles | 7.59% | 0.11%(+7.48)#1 | 0.066%(+7.52)#6 |
| 7. | East Vineland | 7.50% | 0.16%(+7.34)#1 | 0.066%(+7.44)#7 |
| 8. | Georgetown | 7.37% | 0.33%(+7.04)#2 | 0.066%(+7.30)#8 |
| 9. | Cairo | 6.71% | 0.0032%(+6.70)#1 | 0.066%(+6.64)#9 |
| 10. | Shenorock | 6.64% | 0.28%(+6.36)#4 | 0.066%(+6.57)#10 |
| 11. | Point Reyes Station | 6.53% | 0.013%(+6.51)#1 | 0.066%(+6.46)#11 |
| 12. | Berwyn | 6.32% | 0.078%(+6.25)#1 | 0.066%(+6.26)#12 |
| 13. | Walker Valley | 6.18% | 0.28%(+5.90)#5 | 0.066%(+6.11)#13 |
| 14. | Lebanon Borough | 6.17% | 0.16%(+6.01)#2 | 0.066%(+6.10)#14 |
| 15. | Northport | 5.92% | 0.28%(+5.64)#6 | 0.066%(+5.85)#15 |
| 16. | Roslyn Estates | 5.63% | 0.28%(+5.35)#7 | 0.066%(+5.56)#16 |
| 17. | Piney Mountain | 5.47% | 0.037%(+5.43)#1 | 0.066%(+5.40)#17 |
| 18. | Canaan | 5.20% | 0.13%(+5.07)#1 | 0.066%(+5.14)#18 |
| 19. | Botsford | 5.08% | 0.33%(+4.75)#3 | 0.066%(+5.01)#19 |
| 20. | Schiller Park | 4.92% | 0.11%(+4.81)#2 | 0.066%(+4.86)#20 |
| 21. | Florida | 4.80% | 0.28%(+4.52)#8 | 0.066%(+4.73)#21 |
| 22. | Bear Grass | 4.65% | 0.015%(+4.64)#1 | 0.066%(+4.59)#22 |
| 23. | Blue Ridge Shores | 4.20% | 0.037%(+4.17)#2 | 0.066%(+4.14)#23 |
| 24. | Trooper | 4.03% | 0.078%(+3.95)#2 | 0.066%(+3.96)#24 |
| 25. | Balmville | 4.02% | 0.28%(+3.74)#9 | 0.066%(+3.95)#25 |
| 26. | Pompton Lakes Borough | 3.90% | 0.16%(+3.74)#3 | 0.066%(+3.83)#26 |
| 27. | Crownsville | 3.89% | 0.031%(+3.86)#1 | 0.066%(+3.82)#27 |
| 28. | Bangor | 3.76% | 0.013%(+3.75)#2 | 0.066%(+3.69)#28 |
| 29. | Holiday Heights | 3.76% | 0.16%(+3.59)#4 | 0.066%(+3.69)#29 |
| 30. | Haledon Borough | 3.72% | 0.16%(+3.56)#5 | 0.066%(+3.66)#30 |
| 31. | Village Of Grosse Pointe Shores | 3.72% | 0.26%(+3.46)#1 | 0.066%(+3.65)#31 |
| 32. | Oakville | 3.64% | 0.33%(+3.32)#4 | 0.066%(+3.58)#32 |
| 33. | Minooka | 3.64% | 0.11%(+3.53)#3 | 0.066%(+3.58)#33 |
| 34. | Fraser | 3.62% | 0.26%(+3.36)#2 | 0.066%(+3.55)#34 |
| 35. | Fairview Cdp Westchester County | 3.52% | 0.28%(+3.25)#10 | 0.066%(+3.46)#35 |
| 36. | Bella Villa | 3.45% | 0.034%(+3.42)#1 | 0.066%(+3.39)#36 |
| 37. | Pleasantville | 3.42% | 0.28%(+3.14)#11 | 0.066%(+3.35)#37 |
| 38. | Dobbs Ferry | 3.39% | 0.28%(+3.12)#12 | 0.066%(+3.33)#38 |
| 39. | North Chevy Chase | 3.38% | 0.031%(+3.35)#2 | 0.066%(+3.31)#39 |
| 40. | Bishop | 3.29% | 0.015%(+3.27)#1 | 0.066%(+3.22)#40 |
| 41. | Strathmore | 3.27% | 0.16%(+3.11)#6 | 0.066%(+3.21)#41 |
| 42. | Mount Kisco | 3.26% | 0.28%(+2.98)#13 | 0.066%(+3.19)#42 |
| 43. | Wixom | 3.25% | 0.26%(+2.99)#3 | 0.066%(+3.19)#43 |
| 44. | Chelsea Cove | 3.24% | 0.28%(+2.97)#14 | 0.066%(+3.18)#44 |
| 45. | Brookfield | 3.23% | 0.16%(+3.07)#7 | 0.066%(+3.16)#45 |
| 46. | Winthrop Town | 3.18% | 0.30%(+2.87)#1 | 0.066%(+3.11)#46 |
| 47. | Valley Cottage | 3.13% | 0.28%(+2.86)#15 | 0.066%(+3.07)#47 |
| 48. | Vineyards | 3.12% | 0.078%(+3.05)#1 | 0.066%(+3.06)#48 |
| 49. | South Milwaukee | 3.02% | 0.080%(+2.94)#1 | 0.066%(+2.96)#49 |
| 50. | Rocky River | 3.02% | 0.030%(+2.99)#1 | 0.066%(+2.95)#50 |
| 51. | Hastings On Hudson | 2.99% | 0.28%(+2.72)#16 | 0.066%(+2.93)#51 |
| 52. | Topsfield | 2.93% | 0.30%(+2.63)#2 | 0.066%(+2.86)#52 |
| 53. | Lodi Borough | 2.76% | 0.16%(+2.59)#8 | 0.066%(+2.69)#53 |
| 54. | Newark | 2.68% | 0.11%(+2.57)#4 | 0.066%(+2.62)#54 |
| 55. | Alexis | 2.66% | 0.11%(+2.54)#5 | 0.066%(+2.59)#55 |
| 56. | Chalfant | 2.64% | 0.013%(+2.63)#3 | 0.066%(+2.58)#56 |
| 57. | Kenbridge | 2.59% | 0.037%(+2.55)#3 | 0.066%(+2.53)#57 |
| 58. | Attica | 2.58% | 0.0093%(+2.57)#2 | 0.066%(+2.51)#58 |
| 59. | Thornwood | 2.57% | 0.28%(+2.29)#17 | 0.066%(+2.50)#59 |
| 60. | Sterling Heights | 2.55% | 0.26%(+2.29)#4 | 0.066%(+2.48)#60 |
| 61. | Monte Vista | 2.52% | 0.018%(+2.50)#1 | 0.066%(+2.46)#61 |
| 62. | St George | 2.51% | 0.034%(+2.47)#2 | 0.066%(+2.44)#62 |
| 63. | Elmwood Park Borough | 2.48% | 0.16%(+2.32)#9 | 0.066%(+2.41)#63 |
| 64. | Lordship | 2.44% | 0.33%(+2.12)#5 | 0.066%(+2.38)#64 |
| 65. | Belleair Bluffs | 2.42% | 0.078%(+2.35)#2 | 0.066%(+2.36)#65 |
| 66. | Swampscott | 2.42% | 0.30%(+2.12)#3 | 0.066%(+2.35)#66 |
| 67. | Loudonville | 2.41% | 0.28%(+2.14)#18 | 0.066%(+2.35)#67 |
| 68. | Gibraltar | 2.38% | 0.26%(+2.12)#5 | 0.066%(+2.32)#68 |
| 69. | Elwood | 2.38% | 0.013%(+2.36)#1 | 0.066%(+2.31)#69 |
| 70. | Ashton | 2.35% | 0.11%(+2.24)#6 | 0.066%(+2.29)#70 |
| 71. | Green Park | 2.34% | 0.034%(+2.31)#3 | 0.066%(+2.28)#71 |
| 72. | Progress | 2.32% | 0.078%(+2.25)#3 | 0.066%(+2.26)#72 |
| 73. | Lyons | 2.32% | 0.11%(+2.21)#7 | 0.066%(+2.25)#73 |
| 74. | Orchard Lake Village | 2.31% | 0.26%(+2.05)#6 | 0.066%(+2.24)#74 |
| 75. | Mount Hermon | 2.30% | 0.013%(+2.29)#4 | 0.066%(+2.23)#75 |
| 76. | Garfield | 2.27% | 0.16%(+2.11)#10 | 0.066%(+2.21)#76 |
| 77. | Abington | 2.25% | 0.30%(+1.95)#4 | 0.066%(+2.19)#77 |
| 78. | Michigamme | 2.21% | 0.26%(+1.95)#7 | 0.066%(+2.15)#78 |
| 79. | Mason | 2.16% | 0.26%(+1.90)#8 | 0.066%(+2.09)#79 |
| 80. | Fox River Grove | 2.15% | 0.11%(+2.04)#8 | 0.066%(+2.09)#80 |
| 81. | Beattyville | 2.15% | 0.031%(+2.12)#1 | 0.066%(+2.08)#81 |
| 82. | Peabody | 2.14% | 0.30%(+1.83)#5 | 0.066%(+2.07)#82 |
| 83. | Hatfield | 2.10% | 0.30%(+1.80)#6 | 0.066%(+2.04)#83 |
| 84. | South Highpoint | 2.10% | 0.078%(+2.03)#3 | 0.066%(+2.04)#84 |
| 85. | Whitewater | 2.09% | 0.080%(+2.01)#2 | 0.066%(+2.02)#85 |
| 86. | Badger | 2.07% | 0.014%(+2.06)#1 | 0.066%(+2.01)#86 |
| 87. | Dulles Town Center | 2.06% | 0.037%(+2.02)#4 | 0.066%(+1.99)#87 |
| 88. | Avon By The Sea Borough | 2.01% | 0.16%(+1.85)#11 | 0.066%(+1.94)#88 |
| 89. | Fair Lakes | 2.01% | 0.037%(+1.97)#5 | 0.066%(+1.94)#89 |
| 90. | Waterbury | 1.98% | 0.33%(+1.65)#6 | 0.066%(+1.91)#90 |
| 91. | Quincy | 1.95% | 0.30%(+1.65)#7 | 0.066%(+1.88)#91 |
| 92. | Cross Mountain | 1.95% | 0.018%(+1.93)#1 | 0.066%(+1.88)#92 |
| 93. | Oceanville | 1.94% | 0.16%(+1.77)#12 | 0.066%(+1.87)#93 |
| 94. | Little Ferry Borough | 1.94% | 0.16%(+1.77)#13 | 0.066%(+1.87)#94 |
| 95. | Peninsula | 1.90% | 0.030%(+1.87)#2 | 0.066%(+1.83)#95 |
| 96. | Greencastle Borough | 1.89% | 0.078%(+1.81)#4 | 0.066%(+1.82)#96 |
| 97. | Hartland | 1.89% | 0.080%(+1.81)#3 | 0.066%(+1.82)#97 |
| 98. | Millington | 1.80% | 0.11%(+1.69)#9 | 0.066%(+1.74)#98 |
| 99. | Albright | 1.80% | 0.0032%(+1.80)#2 | 0.066%(+1.74)#99 |
| 100. | Hawthorne Borough | 1.79% | 0.16%(+1.63)#14 | 0.066%(+1.73)#100 |
Common Questions
What are the Top 10 Cities with the Highest Percentage of Albanian Population in the United States?
Top 10 Cities with the Highest Percentage of Albanian Population in the United States are:
#1
18.16%
#2
8.82%
#3
8.41%
#4
7.59%
#5
7.37%
#6
6.71%
#7
6.64%
#8
6.53%
#9
6.32%
#10
6.18%
What city has the Highest Percentage of Albanian Population in the United States?
Woodridge has the Highest Percentage of Albanian Population in the United States with 18.16%.
What is the Percentage of Albanian Population in the United States?
Percentage of Albanian Population in the United States is 0.066%.