Cities with the Most Immigrants from Sweden in the United States
RELATED REPORTS & OPTIONS
Sweden
United States
Compare Cities
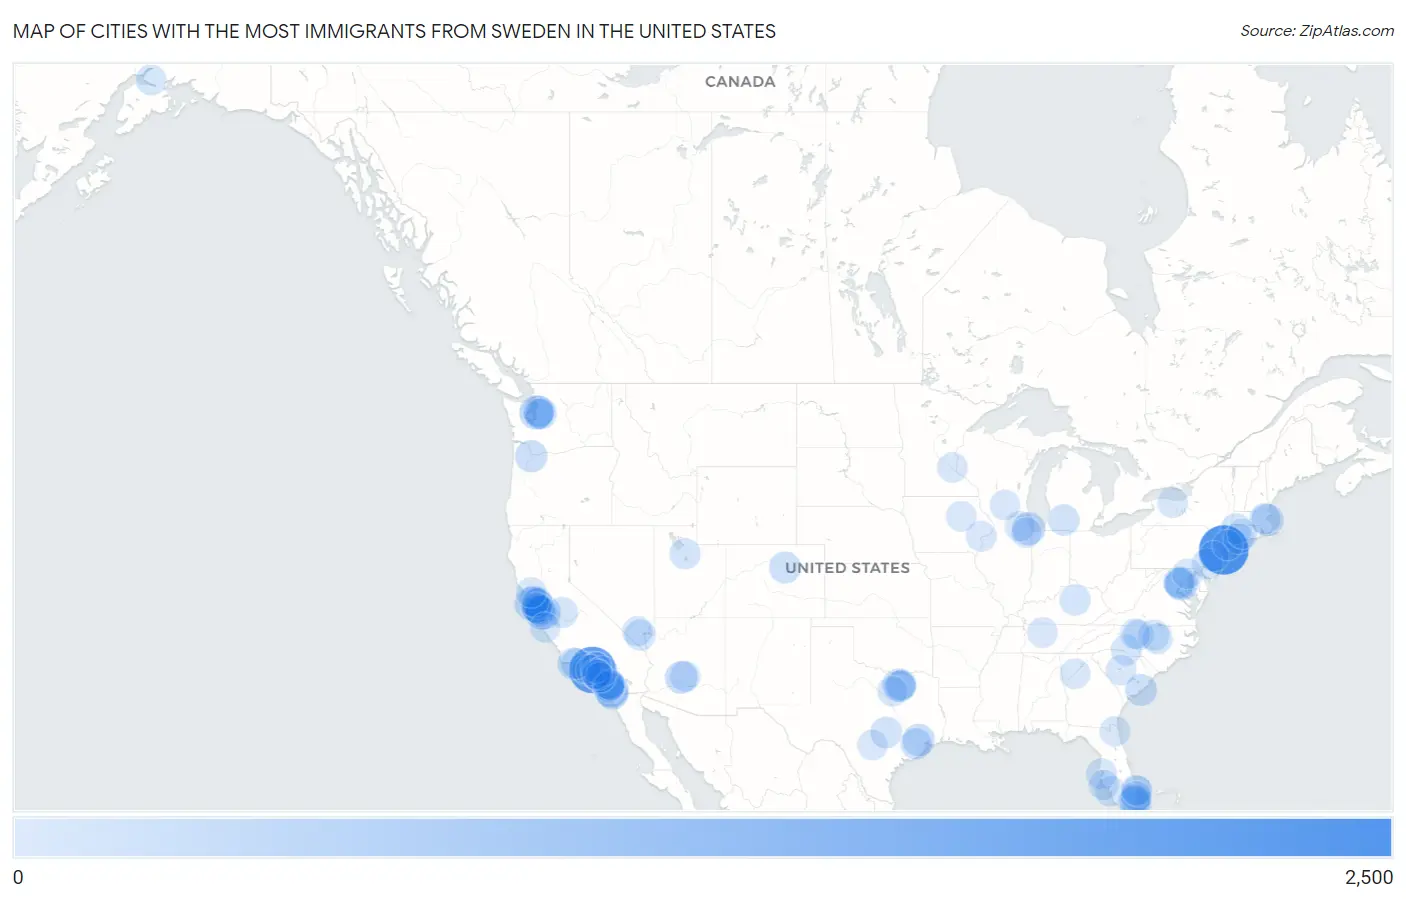
Map of Cities with the Most Immigrants from Sweden in the United States
0
2,500
Cities with the Most Immigrants from Sweden in the United States
| City | Sweden | vs State | vs National | |
| 1. | New York | 2,307 | 3,808(60.58%)#1 | 46,845(4.92%)#1 |
| 2. | Los Angeles | 1,971 | 12,221(16.13%)#1 | 46,845(4.21%)#2 |
| 3. | San Diego | 586 | 12,221(4.80%)#2 | 46,845(1.25%)#3 |
| 4. | Seattle | 469 | 2,194(21.38%)#1 | 46,845(1.00%)#4 |
| 5. | San Jose | 456 | 12,221(3.73%)#3 | 46,845(0.97%)#5 |
| 6. | San Francisco | 435 | 12,221(3.56%)#4 | 46,845(0.93%)#6 |
| 7. | Washington | 405 | 405(100.00%)#1 | 46,845(0.86%)#7 |
| 8. | Chicago | 362 | 1,187(30.50%)#1 | 46,845(0.77%)#8 |
| 9. | Frisco | 339 | 2,851(11.89%)#1 | 46,845(0.72%)#9 |
| 10. | Phoenix | 302 | 950(31.79%)#1 | 46,845(0.64%)#10 |
| 11. | Boston | 286 | 1,519(18.83%)#1 | 46,845(0.61%)#11 |
| 12. | Portland | 280 | 708(39.55%)#1 | 46,845(0.60%)#12 |
| 13. | Houston | 279 | 2,851(9.79%)#2 | 46,845(0.60%)#13 |
| 14. | Santa Barbara | 273 | 12,221(2.23%)#5 | 46,845(0.58%)#14 |
| 15. | Carlsbad | 252 | 12,221(2.06%)#6 | 46,845(0.54%)#15 |
| 16. | Mount Pleasant | 231 | 707(32.67%)#1 | 46,845(0.49%)#16 |
| 17. | Denver | 224 | 1,074(20.86%)#1 | 46,845(0.48%)#17 |
| 18. | Los Gatos | 221 | 12,221(1.81%)#7 | 46,845(0.47%)#18 |
| 19. | Chula Vista | 216 | 12,221(1.77%)#8 | 46,845(0.46%)#19 |
| 20. | Irvine | 208 | 12,221(1.70%)#9 | 46,845(0.44%)#20 |
| 21. | Glendale | 203 | 12,221(1.66%)#10 | 46,845(0.43%)#21 |
| 22. | Oakland | 196 | 12,221(1.60%)#11 | 46,845(0.42%)#22 |
| 23. | Sugar Land | 192 | 2,851(6.73%)#3 | 46,845(0.41%)#23 |
| 24. | Kirkland | 189 | 2,194(8.61%)#2 | 46,845(0.40%)#24 |
| 25. | Austin | 180 | 2,851(6.31%)#4 | 46,845(0.38%)#25 |
| 26. | Palo Alto | 177 | 12,221(1.45%)#12 | 46,845(0.38%)#26 |
| 27. | Battle Creek | 174 | 751(23.17%)#1 | 46,845(0.37%)#27 |
| 28. | Plano | 164 | 2,851(5.75%)#5 | 46,845(0.35%)#28 |
| 29. | Del Mar | 157 | 12,221(1.28%)#13 | 46,845(0.34%)#29 |
| 30. | Sammamish | 147 | 2,194(6.70%)#3 | 46,845(0.31%)#30 |
| 31. | Vista | 144 | 12,221(1.18%)#14 | 46,845(0.31%)#31 |
| 32. | Encinitas | 142 | 12,221(1.16%)#15 | 46,845(0.30%)#32 |
| 33. | Cambridge | 141 | 1,519(9.28%)#2 | 46,845(0.30%)#33 |
| 34. | Philadelphia | 140 | 1,115(12.56%)#1 | 46,845(0.30%)#34 |
| 35. | Lexington | 140 | 227(61.67%)#1 | 46,845(0.30%)#35 |
| 36. | Miami Beach | 138 | 4,700(2.94%)#1 | 46,845(0.29%)#36 |
| 37. | Draper | 136 | 483(28.16%)#1 | 46,845(0.29%)#37 |
| 38. | Torrington | 136 | 943(14.42%)#1 | 46,845(0.29%)#38 |
| 39. | Malibu | 135 | 12,221(1.10%)#16 | 46,845(0.29%)#39 |
| 40. | Henderson | 134 | 492(27.24%)#1 | 46,845(0.29%)#40 |
| 41. | Thousand Oaks | 132 | 12,221(1.08%)#17 | 46,845(0.28%)#41 |
| 42. | Durham | 128 | 1,544(8.29%)#1 | 46,845(0.27%)#42 |
| 43. | Sunnyvale | 128 | 12,221(1.05%)#18 | 46,845(0.27%)#43 |
| 44. | Menlo Park | 128 | 12,221(1.05%)#19 | 46,845(0.27%)#44 |
| 45. | Berkeley | 127 | 12,221(1.04%)#20 | 46,845(0.27%)#45 |
| 46. | State College Borough | 125 | 1,115(11.21%)#2 | 46,845(0.27%)#46 |
| 47. | St Petersburg | 124 | 4,700(2.64%)#2 | 46,845(0.26%)#47 |
| 48. | Mclean | 124 | 1,352(9.17%)#1 | 46,845(0.26%)#48 |
| 49. | Davie | 120 | 4,700(2.55%)#3 | 46,845(0.26%)#49 |
| 50. | Alameda | 118 | 12,221(0.97%)#21 | 46,845(0.25%)#50 |
| 51. | Scottsdale | 115 | 950(12.11%)#2 | 46,845(0.25%)#51 |
| 52. | Fort Lauderdale | 115 | 4,700(2.45%)#4 | 46,845(0.25%)#52 |
| 53. | Merced | 114 | 12,221(0.93%)#22 | 46,845(0.24%)#53 |
| 54. | Pembroke Pines | 111 | 4,700(2.36%)#5 | 46,845(0.24%)#54 |
| 55. | Belmont | 109 | 12,221(0.89%)#23 | 46,845(0.23%)#55 |
| 56. | Arlington | 108 | 1,352(7.99%)#2 | 46,845(0.23%)#56 |
| 57. | Carpinteria | 108 | 12,221(0.88%)#24 | 46,845(0.23%)#57 |
| 58. | Raleigh | 106 | 1,544(6.87%)#2 | 46,845(0.23%)#58 |
| 59. | Mountain View | 105 | 12,221(0.86%)#25 | 46,845(0.22%)#59 |
| 60. | Charlotte | 100 | 1,544(6.48%)#3 | 46,845(0.21%)#60 |
| 61. | Anchorage | 99 | 192(51.56%)#1 | 46,845(0.21%)#61 |
| 62. | High Point | 99 | 1,544(6.41%)#4 | 46,845(0.21%)#62 |
| 63. | Princeton | 95 | 1,054(9.01%)#1 | 46,845(0.20%)#63 |
| 64. | Muscatine | 95 | 321(29.60%)#1 | 46,845(0.20%)#64 |
| 65. | Lexington | 94 | 707(13.30%)#2 | 46,845(0.20%)#65 |
| 66. | Helotes | 92 | 2,851(3.23%)#6 | 46,845(0.20%)#66 |
| 67. | Cape Coral | 91 | 4,700(1.94%)#6 | 46,845(0.19%)#67 |
| 68. | Rochester | 90 | 3,808(2.36%)#2 | 46,845(0.19%)#68 |
| 69. | Palm Beach | 90 | 4,700(1.91%)#7 | 46,845(0.19%)#69 |
| 70. | South Venice | 88 | 4,700(1.87%)#8 | 46,845(0.19%)#70 |
| 71. | Santa Monica | 87 | 12,221(0.71%)#26 | 46,845(0.19%)#71 |
| 72. | Jacksonville | 86 | 4,700(1.83%)#9 | 46,845(0.18%)#72 |
| 73. | West Palm Beach | 86 | 4,700(1.83%)#10 | 46,845(0.18%)#73 |
| 74. | Winston Salem | 85 | 1,544(5.51%)#5 | 46,845(0.18%)#74 |
| 75. | Allen | 84 | 2,851(2.95%)#7 | 46,845(0.18%)#75 |
| 76. | South Elgin | 83 | 1,187(6.99%)#2 | 46,845(0.18%)#76 |
| 77. | Mill Valley | 82 | 12,221(0.67%)#27 | 46,845(0.18%)#77 |
| 78. | San Mateo | 81 | 12,221(0.66%)#28 | 46,845(0.17%)#78 |
| 79. | Nashville | 80 | 474(16.88%)#1 | 46,845(0.17%)#79 |
| 80. | St Paul | 80 | 526(15.21%)#1 | 46,845(0.17%)#80 |
| 81. | New Haven | 78 | 943(8.27%)#2 | 46,845(0.17%)#81 |
| 82. | Palos Park | 78 | 1,187(6.57%)#3 | 46,845(0.17%)#82 |
| 83. | Santa Rosa | 77 | 12,221(0.63%)#29 | 46,845(0.16%)#83 |
| 84. | Pasadena | 77 | 12,221(0.63%)#30 | 46,845(0.16%)#84 |
| 85. | Chino Hills | 77 | 12,221(0.63%)#31 | 46,845(0.16%)#85 |
| 86. | Carney | 77 | 789(9.76%)#1 | 46,845(0.16%)#86 |
| 87. | Scarsdale | 76 | 3,808(2.00%)#3 | 46,845(0.16%)#87 |
| 88. | Fort Worth | 75 | 2,851(2.63%)#8 | 46,845(0.16%)#88 |
| 89. | Madison | 75 | 493(15.21%)#1 | 46,845(0.16%)#89 |
| 90. | San Marcos | 75 | 12,221(0.61%)#32 | 46,845(0.16%)#90 |
| 91. | Newport Beach | 75 | 12,221(0.61%)#33 | 46,845(0.16%)#91 |
| 92. | Carmel Valley Village | 75 | 12,221(0.61%)#34 | 46,845(0.16%)#92 |
| 93. | Atlanta | 74 | 838(8.83%)#1 | 46,845(0.16%)#93 |
| 94. | Middletown | 73 | 943(7.74%)#3 | 46,845(0.16%)#94 |
| 95. | Cedar Falls | 73 | 321(22.74%)#2 | 46,845(0.16%)#95 |
| 96. | Las Vegas | 72 | 492(14.63%)#2 | 46,845(0.15%)#96 |
| 97. | Boca Raton | 72 | 4,700(1.53%)#11 | 46,845(0.15%)#97 |
| 98. | Long Beach | 71 | 12,221(0.58%)#35 | 46,845(0.15%)#98 |
| 99. | Huntington Beach | 71 | 12,221(0.58%)#36 | 46,845(0.15%)#99 |
| 100. | Bellevue | 71 | 2,194(3.24%)#4 | 46,845(0.15%)#100 |
Common Questions
What are the Top 10 Cities with the Most Immigrants from Sweden in the United States?
Top 10 Cities with the Most Immigrants from Sweden in the United States are:
What city has the Most Immigrants from Sweden in the United States?
New York has the Most Immigrants from Sweden in the United States with 2,307.
What is the Total Immigrants from Sweden in the United States?
Total Immigrants from Sweden in the United States is 46,845.