Cities with the Highest Percentage of Immigrants from Ukraine in the United States
RELATED REPORTS & OPTIONS
Ukraine
United States
Compare Cities
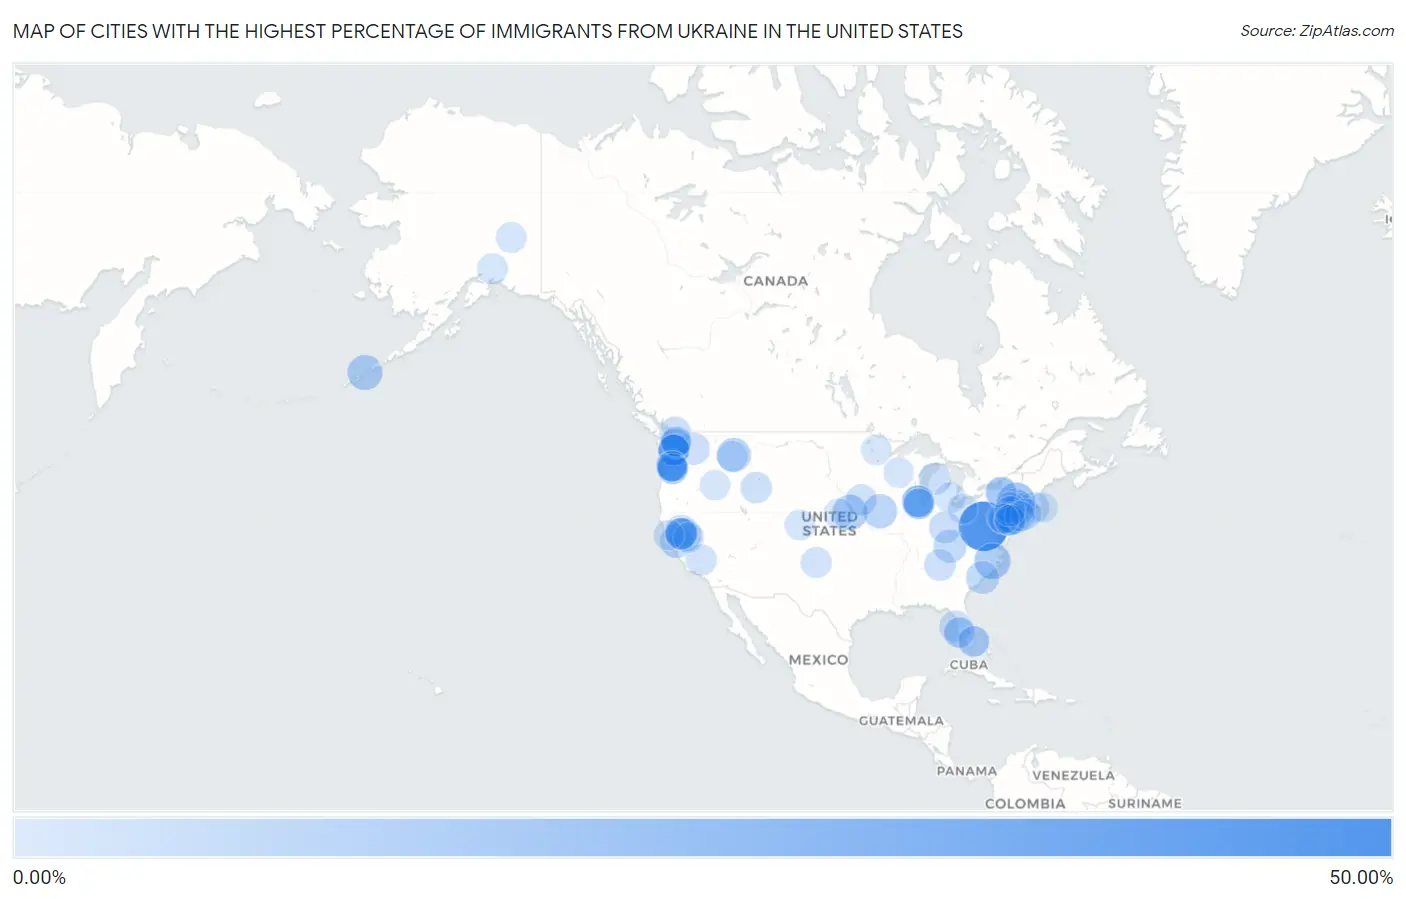
Map of Cities with the Highest Percentage of Immigrants from Ukraine in the United States
0.00%
50.00%
Cities with the Highest Percentage of Immigrants from Ukraine in the United States
| City | Ukraine | vs State | vs National | |
| 1. | Spring Gap | 50.00% | 0.10%(+49.9)#1 | 0.12%(+49.9)#1 |
| 2. | Hunter | 19.67% | 0.39%(+19.3)#1 | 0.12%(+19.6)#2 |
| 3. | Bell Arthur | 16.50% | 0.063%(+16.4)#1 | 0.12%(+16.4)#3 |
| 4. | Lebanon Borough | 15.29% | 0.25%(+15.0)#1 | 0.12%(+15.2)#4 |
| 5. | Akutan | 14.05% | 0.14%(+13.9)#1 | 0.12%(+13.9)#5 |
| 6. | Benedict | 13.87% | 0.062%(+13.8)#1 | 0.12%(+13.8)#6 |
| 7. | Turah | 11.59% | 0.052%(+11.5)#1 | 0.12%(+11.5)#7 |
| 8. | Williamson | 11.51% | 0.026%(+11.5)#1 | 0.12%(+11.4)#8 |
| 9. | North Gate | 9.22% | 0.15%(+9.07)#1 | 0.12%(+9.11)#9 |
| 10. | Ivyland Borough | 8.91% | 0.15%(+8.76)#1 | 0.12%(+8.79)#10 |
| 11. | Buckhorn | 8.82% | 0.034%(+8.79)#1 | 0.12%(+8.71)#11 |
| 12. | River Pines | 8.42% | 0.15%(+8.26)#2 | 0.12%(+8.30)#12 |
| 13. | Forestbrook | 8.30% | 0.075%(+8.22)#1 | 0.12%(+8.18)#13 |
| 14. | Sheridan | 7.73% | 0.15%(+7.58)#3 | 0.12%(+7.62)#14 |
| 15. | Connecticut Farms | 6.56% | 0.25%(+6.31)#2 | 0.12%(+6.44)#15 |
| 16. | Lakeview | 6.49% | 0.47%(+6.03)#1 | 0.12%(+6.38)#16 |
| 17. | Antelope | 6.46% | 0.15%(+6.31)#4 | 0.12%(+6.35)#17 |
| 18. | Solvay | 6.30% | 0.39%(+5.90)#2 | 0.12%(+6.18)#18 |
| 19. | Buckley | 6.18% | 0.068%(+6.11)#1 | 0.12%(+6.06)#19 |
| 20. | Mckinley | 6.13% | 0.15%(+5.98)#2 | 0.12%(+6.02)#20 |
| 21. | Kings Mills | 6.13% | 0.081%(+6.04)#1 | 0.12%(+6.01)#21 |
| 22. | Summit View | 5.91% | 0.47%(+5.44)#2 | 0.12%(+5.79)#22 |
| 23. | North Highlands | 5.70% | 0.15%(+5.55)#5 | 0.12%(+5.58)#23 |
| 24. | Buffalo Grove | 5.59% | 0.23%(+5.36)#1 | 0.12%(+5.47)#24 |
| 25. | Kendall | 5.42% | 0.47%(+4.96)#3 | 0.12%(+5.31)#25 |
| 26. | East Vineland | 5.35% | 0.25%(+5.10)#3 | 0.12%(+5.23)#26 |
| 27. | Hopewell | 5.35% | 0.033%(+5.31)#1 | 0.12%(+5.23)#27 |
| 28. | Wheeling | 5.25% | 0.23%(+5.02)#2 | 0.12%(+5.14)#28 |
| 29. | Ridgecrest | 5.23% | 0.10%(+5.13)#1 | 0.12%(+5.12)#29 |
| 30. | Battle Ground | 5.13% | 0.47%(+4.67)#4 | 0.12%(+5.02)#30 |
| 31. | Titusville | 5.06% | 0.39%(+4.66)#3 | 0.12%(+4.94)#31 |
| 32. | Oto | 5.00% | 0.026%(+4.97)#2 | 0.12%(+4.88)#32 |
| 33. | Moose Wilson Road | 4.99% | 0.067%(+4.92)#1 | 0.12%(+4.87)#33 |
| 34. | Foothill Farms | 4.97% | 0.15%(+4.81)#6 | 0.12%(+4.85)#34 |
| 35. | Feasterville | 4.96% | 0.15%(+4.81)#3 | 0.12%(+4.85)#35 |
| 36. | Forest Lake | 4.91% | 0.23%(+4.68)#3 | 0.12%(+4.79)#36 |
| 37. | Oregon Shores | 4.90% | 0.20%(+4.70)#1 | 0.12%(+4.78)#37 |
| 38. | Yorketown | 4.83% | 0.25%(+4.58)#4 | 0.12%(+4.71)#38 |
| 39. | Towaco | 4.79% | 0.25%(+4.54)#5 | 0.12%(+4.67)#39 |
| 40. | Highland Lakes | 4.55% | 0.25%(+4.30)#6 | 0.12%(+4.43)#40 |
| 41. | Shrub Oak | 4.46% | 0.39%(+4.07)#4 | 0.12%(+4.35)#41 |
| 42. | Carolina | 4.38% | 0.070%(+4.31)#1 | 0.12%(+4.26)#42 |
| 43. | Mountain Meadows | 4.33% | 0.15%(+4.18)#7 | 0.12%(+4.21)#43 |
| 44. | Sunny Isles Beach | 4.29% | 0.10%(+4.19)#2 | 0.12%(+4.17)#44 |
| 45. | Wofford Heights | 4.28% | 0.15%(+4.12)#8 | 0.12%(+4.16)#45 |
| 46. | Shartlesville | 4.06% | 0.15%(+3.91)#4 | 0.12%(+3.94)#46 |
| 47. | Lakeland South | 3.97% | 0.47%(+3.51)#5 | 0.12%(+3.86)#47 |
| 48. | Boys Ranch | 3.97% | 0.030%(+3.94)#1 | 0.12%(+3.85)#48 |
| 49. | Lake Morton Berrydale | 3.96% | 0.47%(+3.49)#6 | 0.12%(+3.84)#49 |
| 50. | Johnson City | 3.95% | 0.20%(+3.75)#2 | 0.12%(+3.84)#50 |
| 51. | Harbour Heights | 3.93% | 0.10%(+3.83)#3 | 0.12%(+3.82)#51 |
| 52. | Stone Ridge | 3.84% | 0.39%(+3.45)#5 | 0.12%(+3.73)#52 |
| 53. | Fife Heights | 3.75% | 0.47%(+3.28)#7 | 0.12%(+3.64)#53 |
| 54. | Glacier View | 3.70% | 0.14%(+3.56)#2 | 0.12%(+3.59)#54 |
| 55. | Milton | 3.64% | 0.47%(+3.17)#8 | 0.12%(+3.52)#55 |
| 56. | Carlton | 3.61% | 0.052%(+3.56)#2 | 0.12%(+3.49)#56 |
| 57. | Helmetta Borough | 3.61% | 0.25%(+3.36)#7 | 0.12%(+3.49)#57 |
| 58. | Duluth | 3.59% | 0.47%(+3.13)#9 | 0.12%(+3.48)#58 |
| 59. | Plumsteadville | 3.53% | 0.15%(+3.38)#5 | 0.12%(+3.42)#59 |
| 60. | Masthope | 3.52% | 0.15%(+3.36)#6 | 0.12%(+3.40)#60 |
| 61. | Edgewood | 3.48% | 0.47%(+3.02)#10 | 0.12%(+3.37)#61 |
| 62. | Eagle | 3.42% | 0.15%(+3.27)#7 | 0.12%(+3.31)#62 |
| 63. | Lakeland North | 3.37% | 0.47%(+2.90)#11 | 0.12%(+3.25)#63 |
| 64. | Harwood Heights | 3.31% | 0.23%(+3.08)#4 | 0.12%(+3.19)#64 |
| 65. | Deltana | 3.30% | 0.14%(+3.16)#3 | 0.12%(+3.19)#65 |
| 66. | Penndel Borough | 3.24% | 0.15%(+3.09)#8 | 0.12%(+3.13)#66 |
| 67. | Hockinson | 3.24% | 0.47%(+2.77)#12 | 0.12%(+3.12)#67 |
| 68. | Wixom | 3.21% | 0.068%(+3.14)#2 | 0.12%(+3.09)#68 |
| 69. | Millington | 3.20% | 0.25%(+2.95)#8 | 0.12%(+3.08)#69 |
| 70. | Meadow Glade | 3.10% | 0.47%(+2.63)#13 | 0.12%(+2.98)#70 |
| 71. | River Grove | 3.10% | 0.23%(+2.87)#5 | 0.12%(+2.98)#71 |
| 72. | Honesdale Borough | 3.09% | 0.15%(+2.94)#9 | 0.12%(+2.97)#72 |
| 73. | Eastmont | 3.08% | 0.47%(+2.61)#14 | 0.12%(+2.96)#73 |
| 74. | Setauket | 3.05% | 0.39%(+2.66)#6 | 0.12%(+2.93)#74 |
| 75. | Watkins | 3.03% | 0.074%(+2.95)#1 | 0.12%(+2.91)#75 |
| 76. | Dorrington | 3.01% | 0.15%(+2.86)#9 | 0.12%(+2.90)#76 |
| 77. | Princeton Junction | 2.92% | 0.25%(+2.67)#9 | 0.12%(+2.80)#77 |
| 78. | Warm Mineral Springs | 2.91% | 0.10%(+2.81)#4 | 0.12%(+2.79)#78 |
| 79. | Lakeland | 2.90% | 0.39%(+2.51)#7 | 0.12%(+2.79)#79 |
| 80. | Bal Harbour | 2.90% | 0.10%(+2.80)#5 | 0.12%(+2.78)#80 |
| 81. | Five Corners | 2.90% | 0.47%(+2.43)#15 | 0.12%(+2.78)#81 |
| 82. | Trevose | 2.88% | 0.15%(+2.73)#10 | 0.12%(+2.77)#82 |
| 83. | Riverdale | 2.88% | 0.062%(+2.81)#2 | 0.12%(+2.76)#83 |
| 84. | Wrightsville Borough | 2.86% | 0.15%(+2.71)#11 | 0.12%(+2.74)#84 |
| 85. | Lublin | 2.86% | 0.037%(+2.82)#1 | 0.12%(+2.74)#85 |
| 86. | New Seabury | 2.85% | 0.15%(+2.69)#1 | 0.12%(+2.73)#86 |
| 87. | Emmett | 2.82% | 0.069%(+2.75)#1 | 0.12%(+2.70)#87 |
| 88. | North Royalton | 2.80% | 0.081%(+2.72)#2 | 0.12%(+2.68)#88 |
| 89. | Churchville | 2.78% | 0.15%(+2.63)#12 | 0.12%(+2.67)#89 |
| 90. | Moriches | 2.78% | 0.39%(+2.39)#8 | 0.12%(+2.66)#90 |
| 91. | Minnehaha | 2.76% | 0.47%(+2.30)#16 | 0.12%(+2.65)#91 |
| 92. | Cavalero | 2.75% | 0.47%(+2.28)#17 | 0.12%(+2.63)#92 |
| 93. | Hewlett Harbor | 2.72% | 0.39%(+2.33)#9 | 0.12%(+2.60)#93 |
| 94. | Lochsloy | 2.69% | 0.47%(+2.22)#18 | 0.12%(+2.57)#94 |
| 95. | Pine Ridge | 2.67% | 0.15%(+2.52)#13 | 0.12%(+2.56)#95 |
| 96. | Zemple | 2.65% | 0.082%(+2.57)#1 | 0.12%(+2.54)#96 |
| 97. | Fair Lawn Borough | 2.65% | 0.25%(+2.40)#10 | 0.12%(+2.53)#97 |
| 98. | Cazadero | 2.63% | 0.15%(+2.47)#10 | 0.12%(+2.51)#98 |
| 99. | Damascus | 2.57% | 0.20%(+2.37)#3 | 0.12%(+2.45)#99 |
| 100. | Flying Hills | 2.56% | 0.15%(+2.41)#14 | 0.12%(+2.45)#100 |
Common Questions
What are the Top 10 Cities with the Highest Percentage of Immigrants from Ukraine in the United States?
Top 10 Cities with the Highest Percentage of Immigrants from Ukraine in the United States are:
#1
50.00%
#2
19.67%
#3
16.50%
#4
14.05%
#5
13.87%
#6
11.59%
#7
11.51%
#8
9.22%
#9
8.82%
#10
8.42%
What city has the Highest Percentage of Immigrants from Ukraine in the United States?
Spring Gap has the Highest Percentage of Immigrants from Ukraine in the United States with 50.00%.
What is the Percentage of Immigrants from Ukraine in the United States?
Percentage of Immigrants from Ukraine in the United States is 0.12%.