Cities with the Lowest Poverty Level Among Single Fathers in the United States
RELATED REPORTS & OPTIONS
Lowest Poverty | Single Father
United States
Compare Cities
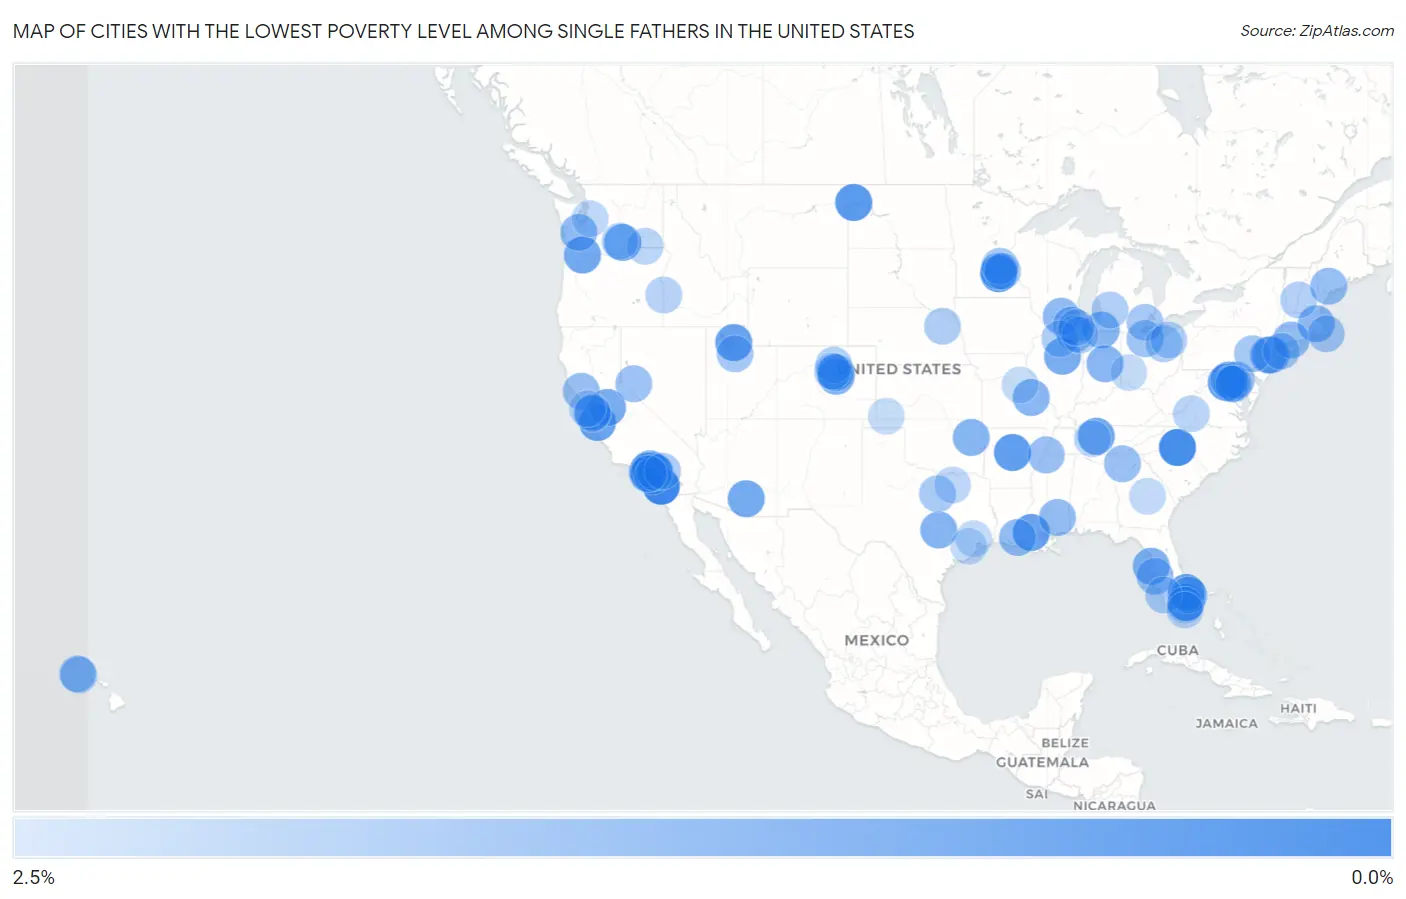
Map of Cities with the Lowest Poverty Level Among Single Fathers in the United States
2.5%
0.0%
Cities with the Lowest Poverty Level Among Single Fathers in the United States
| City | Single Father Poverty | vs State | vs National | |
| 1. | San Marcos | 0.17% | 12.0%(-11.9)#1 | 13.7%(-13.5)#1 |
| 2. | Huntersville | 0.33% | 16.3%(-16.0)#1 | 13.7%(-13.4)#2 |
| 3. | Walnut | 0.43% | 12.0%(-11.6)#2 | 13.7%(-13.3)#3 |
| 4. | Davie | 0.56% | 13.8%(-13.3)#1 | 13.7%(-13.2)#4 |
| 5. | Williston | 0.63% | 8.2%(-7.54)#1 | 13.7%(-13.1)#5 |
| 6. | Conway | 0.69% | 19.8%(-19.1)#1 | 13.7%(-13.0)#6 |
| 7. | Prior Lake | 0.72% | 9.3%(-8.56)#1 | 13.7%(-13.0)#7 |
| 8. | Dulles Town Center | 0.76% | 10.5%(-9.69)#1 | 13.7%(-13.0)#8 |
| 9. | Gardere | 0.79% | 20.6%(-19.9)#1 | 13.7%(-12.9)#9 |
| 10. | Wellington | 0.80% | 13.8%(-13.0)#2 | 13.7%(-12.9)#10 |
| 11. | Roy | 0.82% | 6.3%(-5.48)#1 | 13.7%(-12.9)#11 |
| 12. | Prunedale | 0.84% | 12.0%(-11.2)#3 | 13.7%(-12.9)#12 |
| 13. | Chino | 0.89% | 12.0%(-11.1)#4 | 13.7%(-12.8)#13 |
| 14. | Carson | 0.89% | 12.3%(-11.4)#1 | 13.7%(-12.8)#14 |
| 15. | Paramount | 0.92% | 12.0%(-11.1)#5 | 13.7%(-12.8)#15 |
| 16. | La Vergne | 0.93% | 15.6%(-14.7)#1 | 13.7%(-12.8)#16 |
| 17. | Hazel Dell | 0.95% | 10.6%(-9.61)#1 | 13.7%(-12.8)#17 |
| 18. | Marana | 0.99% | 13.2%(-12.2)#1 | 13.7%(-12.7)#18 |
| 19. | Empire | 1.0% | 12.0%(-11.0)#6 | 13.7%(-12.7)#19 |
| 20. | Bloomington | 1.1% | 13.4%(-12.3)#1 | 13.7%(-12.7)#20 |
| 21. | Grandview | 1.1% | 10.6%(-9.46)#2 | 13.7%(-12.6)#21 |
| 22. | Centennial | 1.1% | 10.0%(-8.92)#1 | 13.7%(-12.6)#22 |
| 23. | Gaithersburg | 1.2% | 9.8%(-8.62)#1 | 13.7%(-12.5)#23 |
| 24. | Bayonet Point | 1.2% | 13.8%(-12.6)#3 | 13.7%(-12.5)#24 |
| 25. | Perth Amboy | 1.2% | 11.7%(-10.5)#1 | 13.7%(-12.5)#25 |
| 26. | Round Rock | 1.2% | 13.4%(-12.1)#1 | 13.7%(-12.5)#26 |
| 27. | New Brunswick | 1.3% | 11.7%(-10.5)#2 | 13.7%(-12.5)#27 |
| 28. | Wagoner | 1.3% | 17.2%(-15.9)#1 | 13.7%(-12.4)#28 |
| 29. | Niles | 1.3% | 15.1%(-13.8)#1 | 13.7%(-12.4)#29 |
| 30. | Castle Rock | 1.3% | 10.0%(-8.76)#2 | 13.7%(-12.4)#30 |
| 31. | Pico Rivera | 1.3% | 12.0%(-10.7)#7 | 13.7%(-12.4)#31 |
| 32. | Sullivan | 1.3% | 13.8%(-12.5)#1 | 13.7%(-12.4)#32 |
| 33. | Noblesville | 1.3% | 14.0%(-12.7)#1 | 13.7%(-12.4)#33 |
| 34. | Randolph Town | 1.3% | 12.5%(-11.2)#1 | 13.7%(-12.4)#34 |
| 35. | Eden Prairie | 1.3% | 9.3%(-7.94)#2 | 13.7%(-12.4)#35 |
| 36. | Centralia | 1.4% | 10.6%(-9.17)#3 | 13.7%(-12.3)#36 |
| 37. | Beloit | 1.4% | 11.2%(-9.79)#1 | 13.7%(-12.3)#37 |
| 38. | Hattiesburg | 1.4% | 23.7%(-22.3)#1 | 13.7%(-12.3)#38 |
| 39. | Monrovia | 1.4% | 12.0%(-10.6)#8 | 13.7%(-12.3)#39 |
| 40. | Maurice | 1.4% | 20.6%(-19.2)#2 | 13.7%(-12.3)#40 |
| 41. | Severn | 1.4% | 9.8%(-8.35)#2 | 13.7%(-12.3)#41 |
| 42. | East Haven | 1.4% | 12.2%(-10.8)#1 | 13.7%(-12.3)#42 |
| 43. | Carpentersville | 1.4% | 13.4%(-11.9)#2 | 13.7%(-12.3)#43 |
| 44. | Boynton Beach | 1.5% | 13.8%(-12.4)#4 | 13.7%(-12.3)#44 |
| 45. | Auburn | 1.5% | 12.2%(-10.7)#1 | 13.7%(-12.2)#45 |
| 46. | Bethesda | 1.5% | 9.8%(-8.28)#3 | 13.7%(-12.2)#46 |
| 47. | Ruskin | 1.5% | 13.8%(-12.3)#5 | 13.7%(-12.2)#47 |
| 48. | Windsor | 1.5% | 12.0%(-10.5)#9 | 13.7%(-12.2)#48 |
| 49. | Horn Lake | 1.5% | 23.7%(-22.2)#2 | 13.7%(-12.2)#49 |
| 50. | Campbell | 1.6% | 12.0%(-10.5)#10 | 13.7%(-12.2)#50 |
| 51. | Fairmount | 1.6% | 15.3%(-13.7)#1 | 13.7%(-12.1)#51 |
| 52. | Yerington | 1.6% | 12.3%(-10.7)#2 | 13.7%(-12.1)#52 |
| 53. | Fremont | 1.6% | 14.6%(-13.0)#1 | 13.7%(-12.1)#53 |
| 54. | Barnstable Town | 1.7% | 12.5%(-10.8)#2 | 13.7%(-12.0)#54 |
| 55. | Ecorse | 1.7% | 15.1%(-13.4)#2 | 13.7%(-12.0)#55 |
| 56. | South Jordan | 1.7% | 6.3%(-4.60)#2 | 13.7%(-12.0)#56 |
| 57. | Wescosville | 1.7% | 14.3%(-12.6)#1 | 13.7%(-12.0)#57 |
| 58. | Nanakuli | 1.7% | 12.9%(-11.2)#1 | 13.7%(-12.0)#58 |
| 59. | Romeoville | 1.7% | 13.4%(-11.7)#3 | 13.7%(-12.0)#59 |
| 60. | Tustin | 1.7% | 12.0%(-10.3)#11 | 13.7%(-12.0)#60 |
| 61. | Sunnyvale | 1.7% | 12.0%(-10.3)#12 | 13.7%(-12.0)#61 |
| 62. | Weatherford | 1.7% | 13.4%(-11.6)#2 | 13.7%(-12.0)#62 |
| 63. | Brooklyn Center | 1.7% | 9.3%(-7.54)#3 | 13.7%(-12.0)#63 |
| 64. | Norco | 1.8% | 12.0%(-10.3)#13 | 13.7%(-11.9)#64 |
| 65. | Uniondale | 1.8% | 15.3%(-13.5)#1 | 13.7%(-11.9)#65 |
| 66. | San Carlos Park | 1.8% | 13.8%(-12.0)#6 | 13.7%(-11.9)#66 |
| 67. | Norfolk | 1.8% | 11.4%(-9.54)#1 | 13.7%(-11.9)#67 |
| 68. | Eagan | 1.8% | 9.3%(-7.47)#4 | 13.7%(-11.9)#68 |
| 69. | Yucaipa | 1.8% | 12.0%(-10.2)#14 | 13.7%(-11.9)#69 |
| 70. | West Mifflin Borough | 1.8% | 14.3%(-12.5)#2 | 13.7%(-11.9)#70 |
| 71. | Kentwood | 1.8% | 15.1%(-13.2)#3 | 13.7%(-11.9)#71 |
| 72. | Waianae | 1.9% | 12.9%(-11.0)#2 | 13.7%(-11.9)#72 |
| 73. | Peru | 1.9% | 13.4%(-11.5)#4 | 13.7%(-11.9)#73 |
| 74. | Medina | 1.9% | 14.6%(-12.8)#2 | 13.7%(-11.9)#74 |
| 75. | East Riverdale | 1.9% | 9.8%(-7.89)#4 | 13.7%(-11.8)#75 |
| 76. | Broomfield | 1.9% | 10.0%(-8.14)#3 | 13.7%(-11.8)#76 |
| 77. | Oak Forest | 1.9% | 13.4%(-11.5)#5 | 13.7%(-11.8)#77 |
| 78. | Claremont | 1.9% | 11.7%(-9.83)#1 | 13.7%(-11.8)#78 |
| 79. | Twinsburg | 1.9% | 14.6%(-12.7)#3 | 13.7%(-11.8)#79 |
| 80. | Homedale | 2.0% | 10.5%(-8.49)#1 | 13.7%(-11.8)#80 |
| 81. | Bensenville | 2.0% | 13.4%(-11.4)#6 | 13.7%(-11.7)#81 |
| 82. | Highlands Ranch | 2.0% | 10.0%(-8.05)#4 | 13.7%(-11.7)#82 |
| 83. | Vinton | 2.0% | 10.5%(-8.46)#2 | 13.7%(-11.7)#83 |
| 84. | Walla Walla | 2.0% | 10.6%(-8.56)#4 | 13.7%(-11.7)#84 |
| 85. | Dakota Ridge | 2.0% | 10.0%(-8.04)#5 | 13.7%(-11.7)#85 |
| 86. | Sunnyside | 2.0% | 10.6%(-8.55)#5 | 13.7%(-11.7)#86 |
| 87. | La Mirada | 2.0% | 12.0%(-10.0)#15 | 13.7%(-11.7)#87 |
| 88. | Kent | 2.0% | 10.6%(-8.52)#6 | 13.7%(-11.7)#88 |
| 89. | Franklin | 2.0% | 15.6%(-13.6)#2 | 13.7%(-11.7)#89 |
| 90. | Mckinney | 2.1% | 13.4%(-11.3)#3 | 13.7%(-11.7)#90 |
| 91. | San Mateo | 2.1% | 12.0%(-9.97)#16 | 13.7%(-11.6)#91 |
| 92. | Miami Lakes | 2.1% | 13.8%(-11.7)#7 | 13.7%(-11.6)#92 |
| 93. | Cutler Bay | 2.1% | 13.8%(-11.7)#8 | 13.7%(-11.6)#93 |
| 94. | Dublin | 2.1% | 15.3%(-13.1)#2 | 13.7%(-11.6)#94 |
| 95. | Atascocita | 2.1% | 13.4%(-11.3)#4 | 13.7%(-11.6)#95 |
| 96. | Missouri City | 2.1% | 13.4%(-11.3)#5 | 13.7%(-11.6)#96 |
| 97. | Franklin | 2.1% | 14.6%(-12.5)#4 | 13.7%(-11.6)#97 |
| 98. | Fulton | 2.2% | 13.8%(-11.7)#2 | 13.7%(-11.6)#98 |
| 99. | Bristol Borough | 2.2% | 14.3%(-12.2)#3 | 13.7%(-11.6)#99 |
| 100. | Hugoton | 2.2% | 12.8%(-10.6)#1 | 13.7%(-11.6)#100 |
Common Questions
What are the Top 10 Cities with the Lowest Poverty Level Among Single Fathers in the United States?
Top 10 Cities with the Lowest Poverty Level Among Single Fathers in the United States are:
#1
0.17%
#2
0.33%
#3
0.43%
#4
0.56%
#5
0.63%
#6
0.69%
#7
0.72%
#8
0.76%
#9
0.79%
#10
0.80%
What city has the Lowest Poverty Level Among Single Fathers in the United States?
San Marcos has the Lowest Poverty Level Among Single Fathers in the United States with 0.17%.
What is the Poverty Level Among Single Fathers in the United States?
Poverty Level Among Single Fathers in the United States is 13.7%.