Cities with the Highest Percentage of Immigrants from Western Africa in the United States
RELATED REPORTS & OPTIONS
Western Africa
United States
Compare Cities
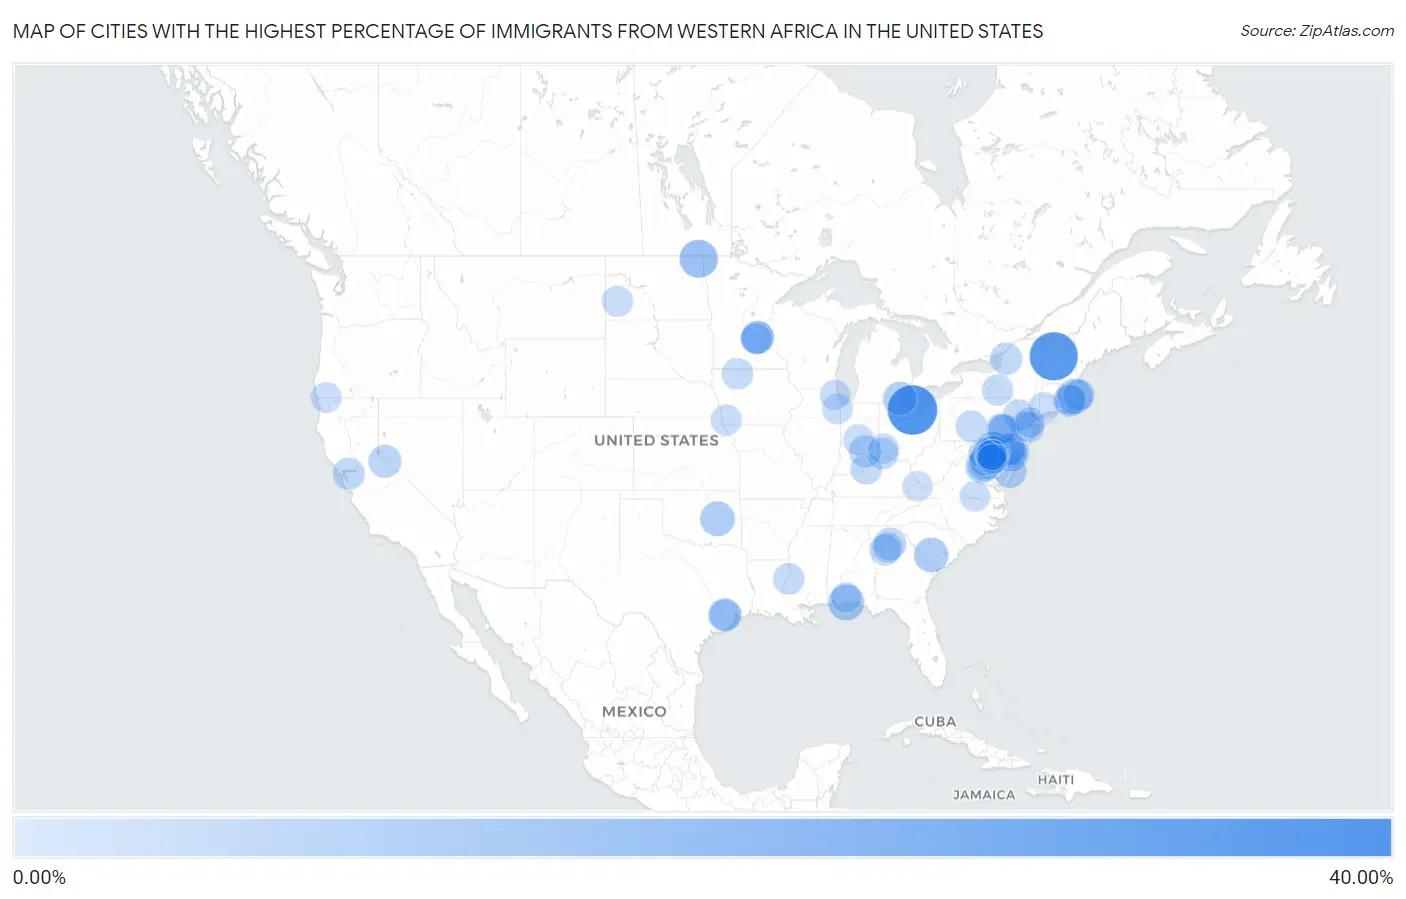
Map of Cities with the Highest Percentage of Immigrants from Western Africa in the United States
0.00%
40.00%
Cities with the Highest Percentage of Immigrants from Western Africa in the United States
| City | Western Africa | vs State | vs National | |
| 1. | Beulah Beach | 35.82% | 0.29%(+35.5)#-1 | 0.30%(+35.5)#0 |
| 2. | Graniteville | 33.47% | 0.15%(+33.3)#-1 | 0.30%(+33.2)#1 |
| 3. | Colwyn Borough | 22.18% | 0.31%(+21.9)#-1 | 0.30%(+21.9)#2 |
| 4. | Woodbourne | 18.59% | 0.59%(+18.0)#-1 | 0.30%(+18.3)#3 |
| 5. | Bathgate | 16.67% | 0.66%(+16.0)#-1 | 0.30%(+16.4)#4 |
| 6. | Camden | 15.99% | 0.68%(+15.3)#-1 | 0.30%(+15.7)#5 |
| 7. | Garcon Point | 13.30% | 0.091%(+13.2)#-1 | 0.30%(+13.0)#6 |
| 8. | Brockton | 12.03% | 0.88%(+11.2)#52 | 0.30%(+11.7)#899 |
| 9. | Bladensburg | 11.82% | 1.56%(+10.3)#-1 | 0.30%(+11.5)#900 |
| 10. | Clearview | 11.36% | 0.14%(+11.2)#-1 | 0.30%(+11.1)#901 |
| 11. | Denmark | 11.15% | 0.066%(+11.1)#-1 | 0.30%(+10.9)#902 |
| 12. | Darby Borough | 11.10% | 0.31%(+10.8)#0 | 0.30%(+10.8)#903 |
| 13. | Stony Point | 10.08% | 0.12%(+9.96)#-1 | 0.30%(+9.78)#904 |
| 14. | White Oak | 9.95% | 1.56%(+8.39)#0 | 0.30%(+9.65)#905 |
| 15. | Vauxhall | 9.90% | 0.66%(+9.24)#-1 | 0.30%(+9.61)#906 |
| 16. | Southern Gateway | 9.88% | 0.44%(+9.44)#-1 | 0.30%(+9.58)#907 |
| 17. | Seabrook | 9.40% | 1.56%(+7.84)#1 | 0.30%(+9.10)#908 |
| 18. | Pawtucket | 9.39% | 1.56%(+7.83)#1 | 0.30%(+9.09)#909 |
| 19. | Four Corners | 9.31% | 0.45%(+8.86)#-1 | 0.30%(+9.01)#910 |
| 20. | West Pocomoke | 9.18% | 1.56%(+7.62)#2 | 0.30%(+8.88)#911 |
| 21. | Sharon Hill Borough | 9.17% | 0.31%(+8.86)#1 | 0.30%(+8.87)#912 |
| 22. | Landover | 9.07% | 1.56%(+7.51)#3 | 0.30%(+8.77)#913 |
| 23. | Brooklyn Park | 8.90% | 0.57%(+8.32)#16 | 0.30%(+8.60)#948 |
| 24. | Largo | 8.88% | 1.56%(+7.32)#4 | 0.30%(+8.58)#949 |
| 25. | Cherry Hill | 8.76% | 0.44%(+8.32)#20 | 0.30%(+8.46)#950 |
| 26. | Glenn Dale | 8.67% | 1.56%(+7.12)#5 | 0.30%(+8.37)#951 |
| 27. | Topaz | 8.64% | 0.14%(+8.50)#-1 | 0.30%(+8.34)#952 |
| 28. | New Carrollton | 8.42% | 1.56%(+6.87)#6 | 0.30%(+8.13)#953 |
| 29. | Montrose Manor | 8.31% | 0.31%(+8.00)#2 | 0.30%(+8.02)#954 |
| 30. | Burtonsville | 7.96% | 1.56%(+6.40)#28 | 0.30%(+7.66)#955 |
| 31. | Stafford Courthouse | 7.87% | 0.44%(+7.43)#21 | 0.30%(+7.57)#956 |
| 32. | Woodmore | 7.86% | 1.56%(+6.31)#29 | 0.30%(+7.57)#957 |
| 33. | Fairland | 7.86% | 1.56%(+6.30)#30 | 0.30%(+7.56)#958 |
| 34. | Lake Arbor | 7.74% | 1.56%(+6.19)#31 | 0.30%(+7.45)#959 |
| 35. | Brooklyn Center | 7.68% | 0.57%(+7.11)#17 | 0.30%(+7.39)#960 |
| 36. | Leesylvania | 7.67% | 0.44%(+7.23)#22 | 0.30%(+7.37)#961 |
| 37. | South Coatesville Borough | 7.54% | 0.31%(+7.22)#3 | 0.30%(+7.24)#962 |
| 38. | Milford Mill | 7.53% | 1.56%(+5.97)#32 | 0.30%(+7.23)#963 |
| 39. | Glenarden | 7.51% | 1.56%(+5.96)#33 | 0.30%(+7.22)#964 |
| 40. | Wall Borough | 7.41% | 0.31%(+7.10)#4 | 0.30%(+7.12)#965 |
| 41. | Laurel | 7.41% | 1.56%(+5.85)#34 | 0.30%(+7.11)#966 |
| 42. | Lawrenceville | 7.35% | 0.52%(+6.83)#14 | 0.30%(+7.06)#967 |
| 43. | Calcium | 7.15% | 0.59%(+6.56)#0 | 0.30%(+6.85)#968 |
| 44. | Elizabethtown | 7.10% | 0.29%(+6.80)#-1 | 0.30%(+6.80)#969 |
| 45. | Millbourne Borough | 7.09% | 0.31%(+6.77)#5 | 0.30%(+6.79)#970 |
| 46. | Queensland | 6.93% | 1.56%(+5.38)#35 | 0.30%(+6.63)#971 |
| 47. | Shell Ridge | 6.92% | 0.14%(+6.77)#0 | 0.30%(+6.62)#972 |
| 48. | District Heights | 6.86% | 1.56%(+5.30)#36 | 0.30%(+6.56)#973 |
| 49. | South Laurel | 6.81% | 1.56%(+5.26)#37 | 0.30%(+6.52)#974 |
| 50. | Marlboro Village | 6.70% | 1.56%(+5.14)#38 | 0.30%(+6.40)#975 |
| 51. | Clayton | 6.54% | 0.68%(+5.86)#0 | 0.30%(+6.24)#976 |
| 52. | Randallstown | 6.40% | 1.56%(+4.84)#47 | 0.30%(+6.10)#977 |
| 53. | Brown Station | 6.36% | 1.56%(+4.80)#48 | 0.30%(+6.06)#978 |
| 54. | Scituate | 6.30% | 0.88%(+5.43)#53 | 0.30%(+6.01)#979 |
| 55. | Cheswold | 6.28% | 0.68%(+5.61)#1 | 0.30%(+5.99)#980 |
| 56. | Lansdowne Borough | 6.24% | 0.31%(+5.93)#6 | 0.30%(+5.95)#981 |
| 57. | County Center | 6.21% | 0.44%(+5.77)#23 | 0.30%(+5.92)#982 |
| 58. | Graettinger | 6.14% | 0.22%(+5.92)#-1 | 0.30%(+5.84)#983 |
| 59. | Mission Bend | 5.98% | 0.45%(+5.53)#0 | 0.30%(+5.68)#984 |
| 60. | Alcorn State University | 5.98% | 0.053%(+5.92)#-1 | 0.30%(+5.68)#985 |
| 61. | Folcroft Borough | 5.93% | 0.31%(+5.62)#22 | 0.30%(+5.64)#986 |
| 62. | West Buechel | 5.89% | 0.11%(+5.78)#-1 | 0.30%(+5.59)#987 |
| 63. | Crescent Springs | 5.86% | 0.11%(+5.75)#2 | 0.30%(+5.56)#988 |
| 64. | Greenwood | 5.81% | 0.31%(+5.50)#23 | 0.30%(+5.51)#989 |
| 65. | Pine Ridge | 5.71% | 0.31%(+5.39)#24 | 0.30%(+5.41)#990 |
| 66. | Forest Home | 5.69% | 0.59%(+5.10)#1 | 0.30%(+5.39)#991 |
| 67. | Riverdale | 5.63% | 0.52%(+5.11)#15 | 0.30%(+5.33)#992 |
| 68. | Belfield | 5.57% | 0.66%(+4.91)#0 | 0.30%(+5.27)#993 |
| 69. | Beltsville | 5.55% | 1.56%(+3.99)#49 | 0.30%(+5.25)#994 |
| 70. | North Laurel | 5.50% | 1.56%(+3.94)#50 | 0.30%(+5.20)#995 |
| 71. | Rising Sun Lebanon | 5.49% | 0.68%(+4.82)#2 | 0.30%(+5.19)#996 |
| 72. | Mitchellville | 5.43% | 1.56%(+3.87)#51 | 0.30%(+5.13)#997 |
| 73. | Randolph | 5.26% | 0.22%(+5.05)#0 | 0.30%(+4.97)#998 |
| 74. | Summerfield | 5.25% | 1.56%(+3.69)#52 | 0.30%(+4.95)#999 |
| 75. | Speedway | 5.22% | 0.29%(+4.93)#0 | 0.30%(+4.93)#1,000 |
| 76. | Yeadon Borough | 5.14% | 0.31%(+4.83)#25 | 0.30%(+4.85)#1,001 |
| 77. | New Hope | 5.09% | 0.57%(+4.51)#18 | 0.30%(+4.79)#1,002 |
| 78. | Elkridge | 5.07% | 1.56%(+3.52)#53 | 0.30%(+4.78)#1,003 |
| 79. | Cheverly | 5.02% | 1.56%(+3.47)#54 | 0.30%(+4.73)#1,004 |
| 80. | Redan | 4.97% | 0.52%(+4.45)#16 | 0.30%(+4.67)#1,005 |
| 81. | Voorhees | 4.95% | 0.66%(+4.29)#0 | 0.30%(+4.65)#1,006 |
| 82. | Madison Park | 4.95% | 0.66%(+4.28)#1 | 0.30%(+4.65)#1,007 |
| 83. | West Lawn | 4.93% | 0.31%(+4.61)#26 | 0.30%(+4.63)#1,008 |
| 84. | Dulles Town Center | 4.74% | 0.44%(+4.30)#24 | 0.30%(+4.44)#1,009 |
| 85. | Takilma | 4.74% | 0.083%(+4.66)#-1 | 0.30%(+4.44)#1,010 |
| 86. | Crest View Heights | 4.74% | 0.59%(+4.15)#2 | 0.30%(+4.44)#1,011 |
| 87. | Brodnax | 4.66% | 0.44%(+4.22)#25 | 0.30%(+4.36)#1,012 |
| 88. | Central Falls | 4.64% | 1.56%(+3.08)#2 | 0.30%(+4.34)#1,013 |
| 89. | Woodbury Center | 4.64% | 0.34%(+4.30)#-1 | 0.30%(+4.34)#1,014 |
| 90. | Lanham | 4.63% | 1.56%(+3.07)#55 | 0.30%(+4.33)#1,015 |
| 91. | University Park | 4.63% | 0.27%(+4.36)#-1 | 0.30%(+4.33)#1,016 |
| 92. | Bannockburn | 4.60% | 0.27%(+4.33)#0 | 0.30%(+4.30)#1,017 |
| 93. | Greenbelt | 4.58% | 1.56%(+3.02)#56 | 0.30%(+4.28)#1,018 |
| 94. | Brandywine | 4.51% | 1.56%(+2.95)#57 | 0.30%(+4.21)#1,019 |
| 95. | Rosaryville | 4.49% | 1.56%(+2.93)#58 | 0.30%(+4.19)#1,020 |
| 96. | Newark | 4.49% | 0.66%(+3.83)#58 | 0.30%(+4.19)#1,021 |
| 97. | Allentown | 4.47% | 0.091%(+4.38)#0 | 0.30%(+4.17)#1,022 |
| 98. | Newmanstown | 4.40% | 0.31%(+4.08)#27 | 0.30%(+4.10)#1,023 |
| 99. | Springdale | 4.39% | 0.29%(+4.10)#0 | 0.30%(+4.09)#1,024 |
| 100. | Vansant | 4.37% | 0.44%(+3.93)#26 | 0.30%(+4.07)#1,025 |
Common Questions
What are the Top 10 Cities with the Highest Percentage of Immigrants from Western Africa in the United States?
Top 10 Cities with the Highest Percentage of Immigrants from Western Africa in the United States are:
#1
35.82%
#2
33.47%
#3
16.67%
#4
15.99%
#5
13.30%
#6
12.03%
#7
11.82%
#8
11.36%
#9
11.15%
#10
10.08%
What city has the Highest Percentage of Immigrants from Western Africa in the United States?
Beulah Beach has the Highest Percentage of Immigrants from Western Africa in the United States with 35.82%.
What is the Percentage of Immigrants from Western Africa in the United States?
Percentage of Immigrants from Western Africa in the United States is 0.30%.