Cities with the Highest Percentage of Eastern European Population in the United States
RELATED REPORTS & OPTIONS
Eastern European
United States
Compare Cities
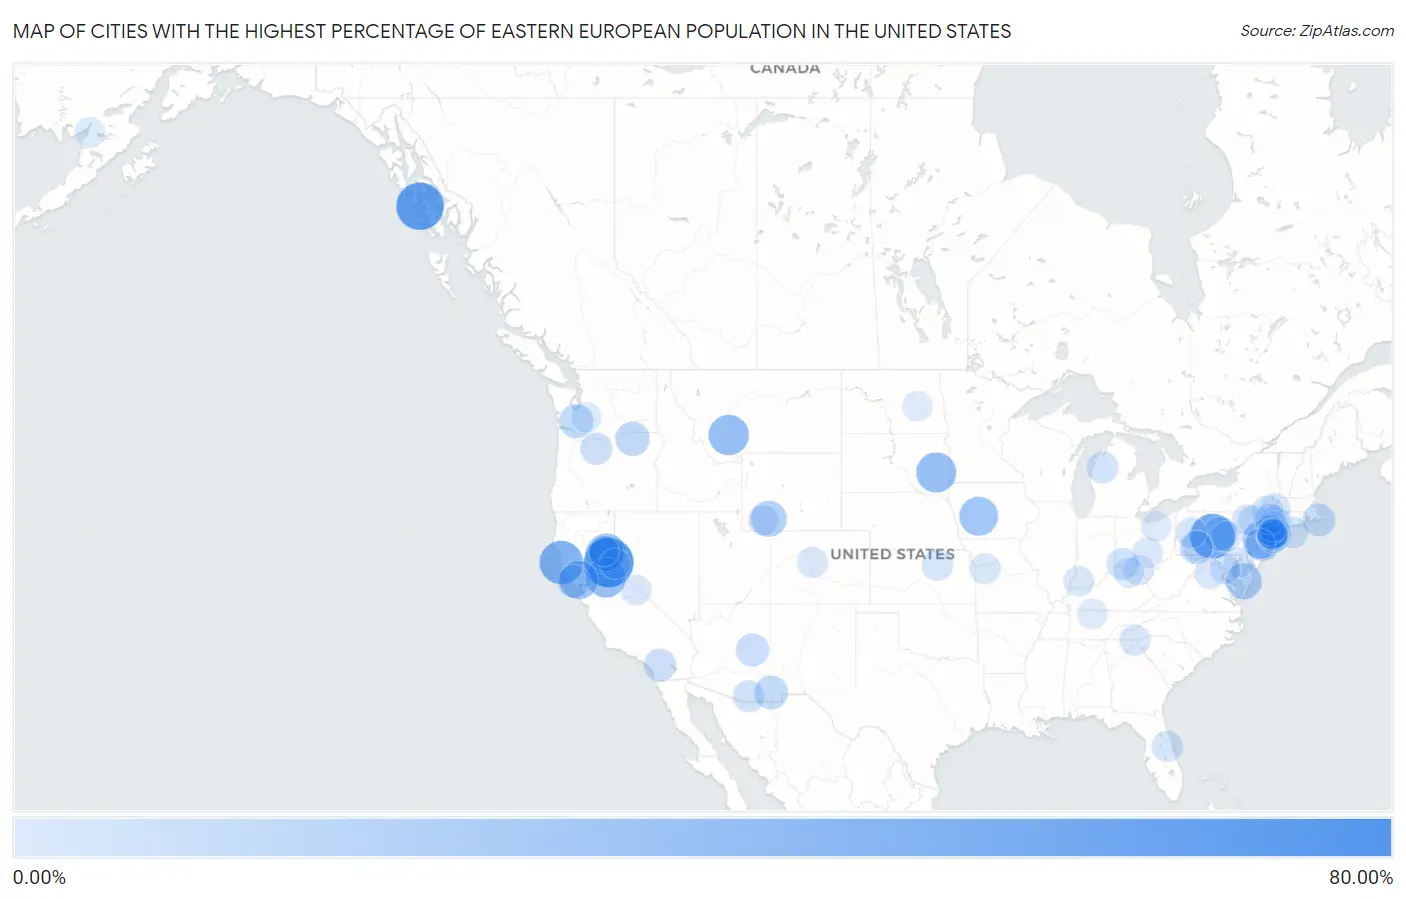
Map of Cities with the Highest Percentage of Eastern European Population in the United States
0.00%
80.00%
Cities with the Highest Percentage of Eastern European Population in the United States
| City | Eastern European | vs State | vs National | |
| 1. | Dixie | 64.12% | 0.20%(+63.9)#1 | 0.30%(+63.8)#1 |
| 2. | Kingvale | 63.53% | 0.30%(+63.2)#1 | 0.30%(+63.2)#2 |
| 3. | Edna Bay | 57.14% | 0.26%(+56.9)#1 | 0.30%(+56.8)#3 |
| 4. | Baileyville | 49.14% | 0.48%(+48.7)#1 | 0.30%(+48.8)#4 |
| 5. | Little River | 44.84% | 0.30%(+44.5)#2 | 0.30%(+44.5)#5 |
| 6. | Choctaw Valley | 39.29% | 0.30%(+39.0)#3 | 0.30%(+39.0)#6 |
| 7. | Mohawk Vista | 35.71% | 0.30%(+35.4)#4 | 0.30%(+35.4)#7 |
| 8. | Cardwell | 35.42% | 0.20%(+35.2)#1 | 0.30%(+35.1)#8 |
| 9. | Winfred | 34.78% | 0.12%(+34.7)#1 | 0.30%(+34.5)#9 |
| 10. | Schooner Bay | 34.04% | 0.29%(+33.8)#1 | 0.30%(+33.7)#10 |
| 11. | Volcano | 33.90% | 0.30%(+33.6)#5 | 0.30%(+33.6)#11 |
| 12. | Yale | 30.70% | 0.13%(+30.6)#1 | 0.30%(+30.4)#12 |
| 13. | Glen Ellen | 30.26% | 0.30%(+30.0)#6 | 0.30%(+30.0)#13 |
| 14. | Clyde | 27.63% | 0.66%(+27.0)#1 | 0.30%(+27.3)#14 |
| 15. | Windsor | 27.13% | 0.66%(+26.5)#2 | 0.30%(+26.8)#15 |
| 16. | Upper Witter Gulch | 25.20% | 0.37%(+24.8)#1 | 0.30%(+24.9)#16 |
| 17. | Whitehaven | 23.31% | 0.55%(+22.8)#1 | 0.30%(+23.0)#17 |
| 18. | Reliance | 22.78% | 0.21%(+22.6)#1 | 0.30%(+22.5)#18 |
| 19. | Stonebridge | 21.66% | 0.66%(+21.0)#3 | 0.30%(+21.4)#19 |
| 20. | C Road | 20.43% | 0.30%(+20.1)#7 | 0.30%(+20.1)#20 |
| 21. | Concordia | 18.63% | 0.66%(+18.0)#4 | 0.30%(+18.3)#21 |
| 22. | Danby | 18.55% | 0.74%(+17.8)#1 | 0.30%(+18.2)#22 |
| 23. | Chemult | 17.71% | 0.38%(+17.3)#1 | 0.30%(+17.4)#23 |
| 24. | Riverside | 17.61% | 0.38%(+17.2)#2 | 0.30%(+17.3)#24 |
| 25. | Coburn | 17.07% | 0.48%(+16.6)#2 | 0.30%(+16.8)#25 |
| 26. | Onalaska | 16.69% | 0.28%(+16.4)#1 | 0.30%(+16.4)#26 |
| 27. | Big Rock | 16.67% | 0.13%(+16.5)#2 | 0.30%(+16.4)#28 |
| 28. | Dewey | 16.67% | 0.20%(+16.5)#2 | 0.30%(+16.4)#29 |
| 29. | Pottersville | 16.24% | 0.66%(+15.6)#5 | 0.30%(+15.9)#30 |
| 30. | Rodeo | 16.00% | 0.19%(+15.8)#1 | 0.30%(+15.7)#31 |
| 31. | Roslyn Estates | 14.81% | 0.74%(+14.1)#2 | 0.30%(+14.5)#32 |
| 32. | Tomales | 14.04% | 0.30%(+13.7)#8 | 0.30%(+13.7)#33 |
| 33. | Clay Springs | 14.00% | 0.26%(+13.7)#1 | 0.30%(+13.7)#34 |
| 34. | Williams Canyon | 13.89% | 0.30%(+13.6)#9 | 0.30%(+13.6)#35 |
| 35. | Edie | 13.79% | 0.48%(+13.3)#3 | 0.30%(+13.5)#36 |
| 36. | Popponesset | 13.66% | 0.57%(+13.1)#1 | 0.30%(+13.4)#37 |
| 37. | Lake Riverside | 12.56% | 0.30%(+12.3)#10 | 0.30%(+12.3)#38 |
| 38. | Fenwick Borough | 12.50% | 0.56%(+11.9)#1 | 0.30%(+12.2)#39 |
| 39. | Rock Ridge | 11.72% | 0.56%(+11.2)#2 | 0.30%(+11.4)#40 |
| 40. | Wamic | 11.54% | 0.38%(+11.2)#3 | 0.30%(+11.2)#41 |
| 41. | Great Neck Estates | 11.00% | 0.74%(+10.3)#3 | 0.30%(+10.7)#42 |
| 42. | Oldwick | 10.78% | 0.66%(+10.1)#6 | 0.30%(+10.5)#43 |
| 43. | Brewster Hill | 10.75% | 0.74%(+10.0)#4 | 0.30%(+10.4)#44 |
| 44. | Elgin | 10.65% | 0.26%(+10.4)#2 | 0.30%(+10.3)#45 |
| 45. | North Bay | 10.46% | 0.74%(+9.71)#5 | 0.30%(+10.2)#46 |
| 46. | Remington | 10.10% | 0.33%(+9.77)#1 | 0.30%(+9.79)#47 |
| 47. | Woodsburgh | 10.03% | 0.74%(+9.29)#6 | 0.30%(+9.73)#48 |
| 48. | Weston | 9.91% | 0.56%(+9.35)#3 | 0.30%(+9.61)#49 |
| 49. | Caberfae | 9.72% | 0.29%(+9.43)#1 | 0.30%(+9.42)#50 |
| 50. | Water Mill | 9.71% | 0.74%(+8.96)#7 | 0.30%(+9.40)#51 |
| 51. | Longford | 9.43% | 0.17%(+9.26)#1 | 0.30%(+9.13)#52 |
| 52. | East Hills | 9.38% | 0.74%(+8.63)#8 | 0.30%(+9.07)#53 |
| 53. | Greenehaven | 9.16% | 0.26%(+8.90)#3 | 0.30%(+8.86)#54 |
| 54. | Chuluota | 9.02% | 0.32%(+8.70)#1 | 0.30%(+8.71)#55 |
| 55. | Masthope | 8.88% | 0.48%(+8.40)#4 | 0.30%(+8.57)#56 |
| 56. | Woodstock | 8.77% | 0.74%(+8.03)#9 | 0.30%(+8.47)#57 |
| 57. | Port Washington North | 8.58% | 0.74%(+7.84)#10 | 0.30%(+8.28)#58 |
| 58. | Plainview | 8.57% | 0.74%(+7.83)#11 | 0.30%(+8.27)#59 |
| 59. | Dillard | 8.10% | 0.20%(+7.90)#2 | 0.30%(+7.79)#60 |
| 60. | James Town | 8.07% | 0.21%(+7.87)#2 | 0.30%(+7.77)#61 |
| 61. | Glen Rock Borough | 8.06% | 0.66%(+7.40)#7 | 0.30%(+7.76)#62 |
| 62. | Jerome | 7.94% | 0.48%(+7.46)#5 | 0.30%(+7.63)#63 |
| 63. | Simpson | 7.93% | 0.48%(+7.46)#6 | 0.30%(+7.63)#64 |
| 64. | Great Neck Gardens | 7.90% | 0.74%(+7.16)#12 | 0.30%(+7.60)#65 |
| 65. | Templeton | 7.88% | 0.48%(+7.40)#7 | 0.30%(+7.57)#66 |
| 66. | Dodgingtown | 7.87% | 0.56%(+7.31)#4 | 0.30%(+7.56)#67 |
| 67. | Lake Lafayette | 7.85% | 0.20%(+7.65)#1 | 0.30%(+7.55)#68 |
| 68. | Copake Lake | 7.83% | 0.74%(+7.09)#13 | 0.30%(+7.53)#69 |
| 69. | Alma | 7.83% | 0.37%(+7.46)#2 | 0.30%(+7.52)#70 |
| 70. | Worton | 7.62% | 0.55%(+7.07)#2 | 0.30%(+7.32)#71 |
| 71. | Hewlett Neck | 7.49% | 0.74%(+6.74)#14 | 0.30%(+7.18)#72 |
| 72. | Washington | 7.41% | 0.29%(+7.12)#2 | 0.30%(+7.10)#73 |
| 73. | Great Neck | 7.32% | 0.74%(+6.58)#15 | 0.30%(+7.02)#74 |
| 74. | New Baltimore | 7.30% | 0.74%(+6.55)#16 | 0.30%(+6.99)#75 |
| 75. | Somerset | 7.30% | 0.55%(+6.74)#3 | 0.30%(+6.99)#76 |
| 76. | Mclean | 7.20% | 0.74%(+6.45)#17 | 0.30%(+6.89)#77 |
| 77. | Centre Island | 7.18% | 0.74%(+6.44)#18 | 0.30%(+6.88)#78 |
| 78. | Merion Station | 7.16% | 0.48%(+6.68)#8 | 0.30%(+6.85)#79 |
| 79. | Spackenkill | 7.15% | 0.74%(+6.40)#19 | 0.30%(+6.85)#80 |
| 80. | Crystal Bay | 7.07% | 0.22%(+6.85)#1 | 0.30%(+6.76)#81 |
| 81. | Piermont | 6.98% | 0.74%(+6.24)#20 | 0.30%(+6.68)#82 |
| 82. | The Ponds | 6.98% | 0.66%(+6.32)#8 | 0.30%(+6.68)#83 |
| 83. | Benton | 6.87% | 0.30%(+6.57)#11 | 0.30%(+6.57)#84 |
| 84. | Thurston | 6.76% | 0.33%(+6.44)#2 | 0.30%(+6.46)#85 |
| 85. | Katonah | 6.76% | 0.74%(+6.02)#21 | 0.30%(+6.46)#86 |
| 86. | Mackey | 6.73% | 0.17%(+6.56)#1 | 0.30%(+6.43)#87 |
| 87. | Otway | 6.67% | 0.33%(+6.34)#3 | 0.30%(+6.36)#88 |
| 88. | Mount Pleasant Mills | 6.64% | 0.48%(+6.17)#9 | 0.30%(+6.34)#89 |
| 89. | Naknek | 6.46% | 0.26%(+6.20)#2 | 0.30%(+6.16)#90 |
| 90. | Princeton Junction | 6.38% | 0.66%(+5.72)#9 | 0.30%(+6.08)#91 |
| 91. | Valley City | 6.35% | 0.33%(+6.02)#4 | 0.30%(+6.05)#92 |
| 92. | Scalp Level Borough | 6.34% | 0.48%(+5.87)#10 | 0.30%(+6.04)#93 |
| 93. | Graball | 6.34% | 0.16%(+6.18)#1 | 0.30%(+6.03)#94 |
| 94. | Greenhorn | 6.32% | 0.30%(+6.02)#12 | 0.30%(+6.02)#95 |
| 95. | Dover | 6.29% | 0.12%(+6.17)#1 | 0.30%(+5.99)#96 |
| 96. | Pringle Borough | 6.27% | 0.48%(+5.80)#11 | 0.30%(+5.97)#97 |
| 97. | Ashford | 6.22% | 0.28%(+5.94)#2 | 0.30%(+5.92)#98 |
| 98. | Mountain Dale | 6.15% | 0.74%(+5.41)#22 | 0.30%(+5.85)#99 |
| 99. | Sands Point | 6.14% | 0.74%(+5.40)#23 | 0.30%(+5.84)#100 |
| 100. | Kensal | 6.14% | 0.11%(+6.03)#1 | 0.30%(+5.83)#101 |
Common Questions
What are the Top 10 Cities with the Highest Percentage of Eastern European Population in the United States?
Top 10 Cities with the Highest Percentage of Eastern European Population in the United States are:
#1
63.53%
#2
57.14%
#3
49.14%
#4
44.84%
#5
35.71%
#6
35.42%
#7
34.78%
#8
33.90%
#9
30.70%
#10
30.26%
What city has the Highest Percentage of Eastern European Population in the United States?
Kingvale has the Highest Percentage of Eastern European Population in the United States with 63.53%.
What is the Percentage of Eastern European Population in the United States?
Percentage of Eastern European Population in the United States is 0.30%.