Cities with the Highest Percentage of Population with a Degree in Communications in the United States
RELATED REPORTS & OPTIONS
Communications
United States
Compare Cities
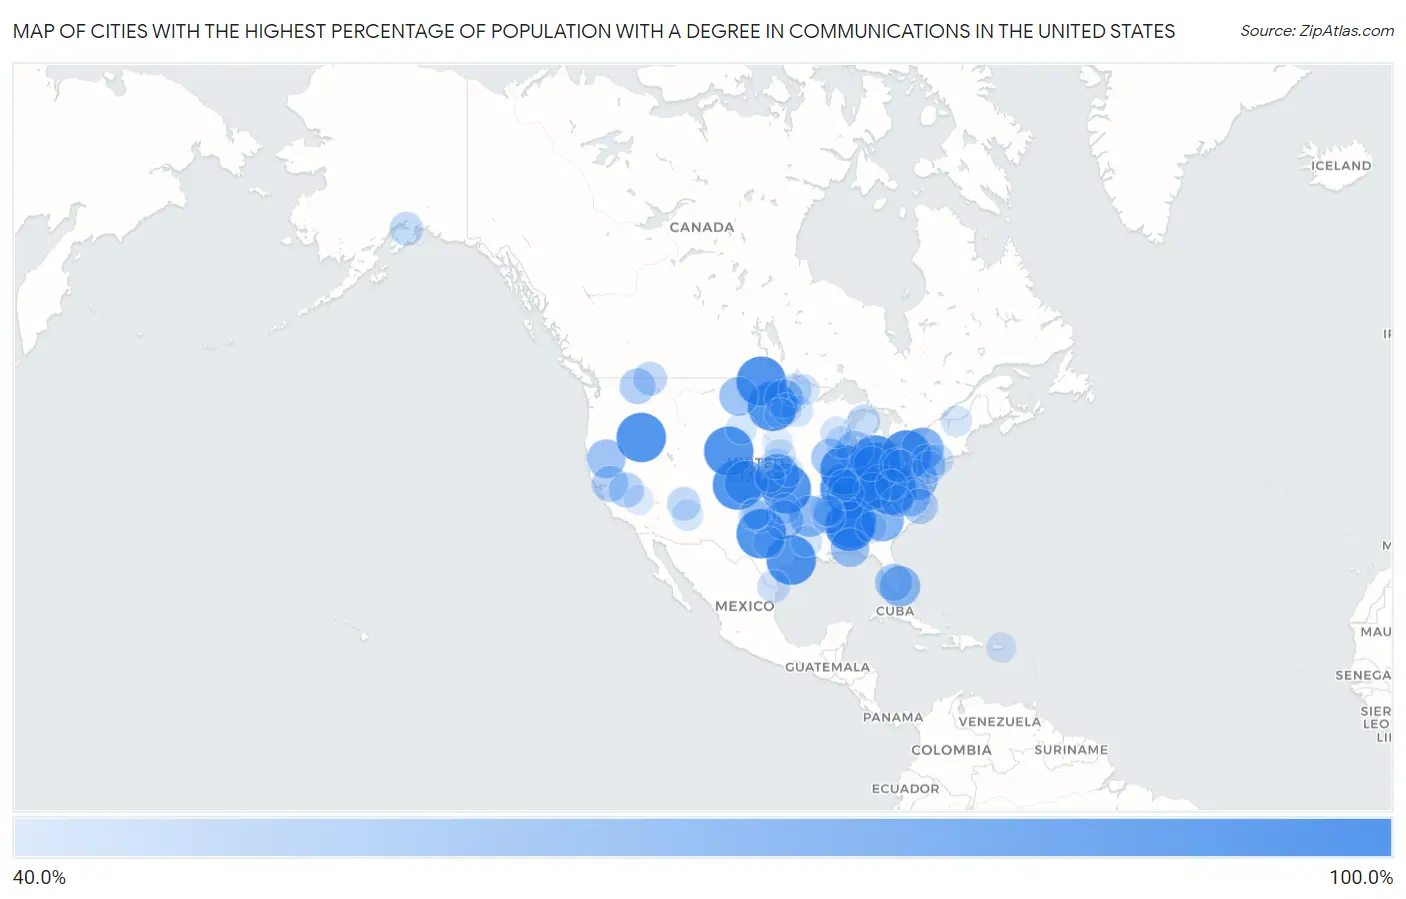
Map of Cities with the Highest Percentage of Population with a Degree in Communications in the United States
0.0%
100.0%
Cities with the Highest Percentage of Population with a Degree in Communications in the United States
| City | % Graduates | vs State | vs National | |
| 1. | Breckinridge Center | 100.0% | 4.2%(+95.8)#1 | 4.1%(+95.9)#1 |
| 2. | Rosharon | 100.0% | 4.1%(+95.9)#1 | 4.1%(+95.9)#2 |
| 3. | Drakesboro | 100.0% | 4.2%(+95.8)#2 | 4.1%(+95.9)#3 |
| 4. | Myra | 100.0% | 4.1%(+95.9)#2 | 4.1%(+95.9)#4 |
| 5. | Plumwood | 100.0% | 4.3%(+95.7)#1 | 4.1%(+95.9)#5 |
| 6. | Box Springs | 100.0% | 4.5%(+95.5)#1 | 4.1%(+95.9)#6 |
| 7. | Pauline | 100.0% | 3.3%(+96.7)#1 | 4.1%(+95.9)#7 |
| 8. | Sipsey | 100.0% | 3.2%(+96.8)#1 | 4.1%(+95.9)#8 |
| 9. | Metcalf | 100.0% | 5.1%(+94.9)#1 | 4.1%(+95.9)#9 |
| 10. | Murphy | 100.0% | 3.7%(+96.3)#1 | 4.1%(+95.9)#10 |
| 11. | Hattieville | 100.0% | 3.3%(+96.7)#1 | 4.1%(+95.9)#11 |
| 12. | North Johns | 100.0% | 3.2%(+96.8)#2 | 4.1%(+95.9)#12 |
| 13. | Dola | 100.0% | 4.3%(+95.7)#2 | 4.1%(+95.9)#13 |
| 14. | Rhodell | 100.0% | 3.1%(+96.9)#1 | 4.1%(+95.9)#14 |
| 15. | Verona | 100.0% | 3.4%(+96.6)#1 | 4.1%(+95.9)#15 |
| 16. | New Haven Cdp Hamilton County | 100.0% | 4.3%(+95.7)#3 | 4.1%(+95.9)#16 |
| 17. | Tylersburg | 100.0% | 4.2%(+95.8)#1 | 4.1%(+95.9)#17 |
| 18. | Hasty | 100.0% | 4.8%(+95.2)#1 | 4.1%(+95.9)#18 |
| 19. | Rectortown | 100.0% | 3.4%(+96.6)#1 | 4.1%(+95.9)#19 |
| 20. | Climax | 100.0% | 4.1%(+95.9)#1 | 4.1%(+95.9)#20 |
| 21. | Twin Lakes | 100.0% | 3.8%(+96.2)#1 | 4.1%(+95.9)#21 |
| 22. | Hawk Springs | 100.0% | 2.7%(+97.3)#1 | 4.1%(+95.9)#22 |
| 23. | Saltese | 100.0% | 3.2%(+96.8)#1 | 4.1%(+95.9)#23 |
| 24. | Impact | 100.0% | 4.1%(+95.9)#3 | 4.1%(+95.9)#24 |
| 25. | Mylo | 100.0% | 3.4%(+96.6)#2 | 4.1%(+95.9)#25 |
| 26. | Manchester | 85.7% | 4.1%(+81.6)#2 | 4.1%(+81.6)#26 |
| 27. | Blaine | 83.3% | 4.2%(+79.1)#3 | 4.1%(+79.2)#27 |
| 28. | Horace | 83.3% | 4.1%(+79.2)#3 | 4.1%(+79.2)#28 |
| 29. | Lowndesville | 81.2% | 3.3%(+77.9)#2 | 4.1%(+77.1)#29 |
| 30. | Millerton | 80.0% | 4.2%(+75.8)#2 | 4.1%(+75.9)#30 |
| 31. | Lonsdale | 76.9% | 3.3%(+73.7)#2 | 4.1%(+72.8)#31 |
| 32. | Clemson University | 76.2% | 3.3%(+72.9)#3 | 4.1%(+72.1)#32 |
| 33. | Franklin Park | 74.8% | 3.9%(+70.9)#1 | 4.1%(+70.7)#33 |
| 34. | Calverton | 73.8% | 3.4%(+70.4)#2 | 4.1%(+69.7)#34 |
| 35. | Clover | 73.5% | 3.4%(+70.0)#3 | 4.1%(+69.3)#35 |
| 36. | Bee | 72.2% | 3.8%(+68.4)#2 | 4.1%(+68.1)#36 |
| 37. | Marlboro | 71.4% | 4.2%(+67.2)#1 | 4.1%(+67.3)#37 |
| 38. | Paris | 71.0% | 3.4%(+67.5)#4 | 4.1%(+66.8)#38 |
| 39. | Manning | 70.6% | 3.4%(+67.2)#3 | 4.1%(+66.5)#39 |
| 40. | Felton | 70.0% | 4.8%(+65.2)#1 | 4.1%(+65.9)#40 |
| 41. | Fall River Mills | 69.7% | 4.6%(+65.1)#1 | 4.1%(+65.6)#41 |
| 42. | Pine Level | 69.7% | 3.9%(+65.8)#2 | 4.1%(+65.6)#42 |
| 43. | New Troy | 66.7% | 3.9%(+62.8)#1 | 4.1%(+62.5)#43 |
| 44. | La Fayette | 66.7% | 5.1%(+61.6)#2 | 4.1%(+62.5)#44 |
| 45. | Montura | 66.2% | 3.9%(+62.3)#3 | 4.1%(+62.1)#45 |
| 46. | Mckee | 65.9% | 4.2%(+61.6)#4 | 4.1%(+61.7)#46 |
| 47. | Sprague | 64.0% | 3.1%(+60.9)#2 | 4.1%(+59.9)#47 |
| 48. | Camanche North Shore | 63.0% | 4.6%(+58.3)#2 | 4.1%(+58.8)#48 |
| 49. | South Mount Vernon | 62.7% | 4.3%(+58.4)#4 | 4.1%(+58.5)#49 |
| 50. | Oldtown | 61.6% | 3.7%(+58.0)#2 | 4.1%(+57.5)#50 |
| 51. | Stokes | 61.3% | 4.1%(+57.2)#1 | 4.1%(+57.2)#51 |
| 52. | Aspen Springs | 60.0% | 4.6%(+55.4)#3 | 4.1%(+55.9)#52 |
| 53. | Kettlersville | 60.0% | 4.3%(+55.7)#5 | 4.1%(+55.9)#53 |
| 54. | Seltzer | 58.3% | 4.2%(+54.1)#3 | 4.1%(+54.2)#54 |
| 55. | El Paso | 57.9% | 3.3%(+54.6)#3 | 4.1%(+53.8)#55 |
| 56. | West Kootenai | 57.1% | 3.2%(+53.9)#2 | 4.1%(+53.0)#56 |
| 57. | Brilliant | 56.5% | 4.3%(+52.1)#6 | 4.1%(+52.3)#57 |
| 58. | Hope | 56.1% | 2.5%(+53.6)#1 | 4.1%(+52.0)#58 |
| 59. | Hard Rock | 55.6% | 4.0%(+51.5)#1 | 4.1%(+51.4)#59 |
| 60. | Wylandville | 55.5% | 4.2%(+51.3)#4 | 4.1%(+51.4)#60 |
| 61. | Gordonville | 54.8% | 4.2%(+50.6)#5 | 4.1%(+50.7)#61 |
| 62. | Crenshaw | 54.5% | 2.4%(+52.2)#1 | 4.1%(+50.4)#62 |
| 63. | Alden | 54.5% | 3.9%(+50.7)#2 | 4.1%(+50.4)#63 |
| 64. | Red Lake | 54.2% | 4.8%(+49.4)#2 | 4.1%(+50.0)#64 |
| 65. | St Charles | 53.8% | 4.2%(+49.6)#5 | 4.1%(+49.7)#65 |
| 66. | Morris Chapel | 53.7% | 4.3%(+49.4)#1 | 4.1%(+49.5)#66 |
| 67. | Gould | 53.3% | 3.8%(+49.5)#3 | 4.1%(+49.2)#67 |
| 68. | Solis | 53.1% | 4.1%(+49.0)#4 | 4.1%(+49.0)#68 |
| 69. | Earle | 52.8% | 3.3%(+49.6)#4 | 4.1%(+48.7)#69 |
| 70. | Springfield | 51.7% | 4.4%(+47.4)#1 | 4.1%(+47.6)#70 |
| 71. | Pinnacle | 51.2% | 4.1%(+47.1)#2 | 4.1%(+47.1)#71 |
| 72. | East Griffin | 50.0% | 4.5%(+45.5)#2 | 4.1%(+45.9)#72 |
| 73. | Powellton | 50.0% | 3.1%(+46.9)#3 | 4.1%(+45.9)#73 |
| 74. | Marquette | 50.0% | 4.4%(+45.6)#2 | 4.1%(+45.9)#74 |
| 75. | Great Meadows | 50.0% | 4.2%(+45.8)#2 | 4.1%(+45.9)#75 |
| 76. | Elmdale | 50.0% | 4.8%(+45.2)#3 | 4.1%(+45.9)#76 |
| 77. | Mullin | 50.0% | 4.1%(+45.9)#5 | 4.1%(+45.9)#77 |
| 78. | Irasburg | 50.0% | 2.7%(+47.3)#1 | 4.1%(+45.9)#78 |
| 79. | Wendell | 50.0% | 4.8%(+45.2)#4 | 4.1%(+45.9)#79 |
| 80. | Peever | 50.0% | 3.0%(+47.0)#1 | 4.1%(+45.9)#80 |
| 81. | Sunset | 50.0% | 3.3%(+46.7)#5 | 4.1%(+45.9)#81 |
| 82. | Robeline | 50.0% | 3.2%(+46.8)#1 | 4.1%(+45.9)#82 |
| 83. | Effie | 50.0% | 4.8%(+45.2)#5 | 4.1%(+45.9)#83 |
| 84. | Goff | 50.0% | 4.1%(+45.9)#4 | 4.1%(+45.9)#84 |
| 85. | Wasta | 50.0% | 3.0%(+47.0)#2 | 4.1%(+45.9)#85 |
| 86. | Woodruff | 50.0% | 4.0%(+46.0)#2 | 4.1%(+45.9)#86 |
| 87. | Abie | 50.0% | 4.0%(+46.0)#1 | 4.1%(+45.9)#87 |
| 88. | Easton | 50.0% | 4.4%(+45.6)#3 | 4.1%(+45.9)#88 |
| 89. | Phillipstown | 50.0% | 5.1%(+44.9)#3 | 4.1%(+45.9)#89 |
| 90. | Lakeview | 50.0% | 4.1%(+45.9)#6 | 4.1%(+45.9)#90 |
| 91. | Ixl | 50.0% | 3.8%(+46.2)#4 | 4.1%(+45.9)#91 |
| 92. | Strang | 50.0% | 4.0%(+46.0)#2 | 4.1%(+45.9)#92 |
| 93. | Quail | 50.0% | 4.1%(+45.9)#7 | 4.1%(+45.9)#93 |
| 94. | Chimney Point | 48.9% | 3.9%(+45.0)#1 | 4.1%(+44.7)#94 |
| 95. | Kamaili | 47.8% | 3.6%(+44.2)#1 | 4.1%(+43.7)#95 |
| 96. | Jagual | 47.6% | 2.2%(+45.5)#1 | 4.1%(+43.5)#96 |
| 97. | Cincinnati | 47.2% | 3.3%(+44.0)#6 | 4.1%(+43.1)#97 |
| 98. | Furnace Creek | 47.1% | 4.6%(+42.4)#4 | 4.1%(+42.9)#98 |
| 99. | Sylvan Grove | 46.9% | 4.1%(+42.8)#5 | 4.1%(+42.8)#99 |
| 100. | Fordyce | 46.9% | 4.0%(+42.9)#3 | 4.1%(+42.7)#100 |
Common Questions
What are the Top 10 Cities with the Highest Percentage of Population with a Degree in Communications in the United States?
Top 10 Cities with the Highest Percentage of Population with a Degree in Communications in the United States are:
What city has the Highest Percentage of Population with a Degree in Communications in the United States?
Breckinridge Center has the Highest Percentage of Population with a Degree in Communications in the United States with 100.0%.
What is the Percentage of Population with a Degree in Communications in the United States?
Percentage of Population with a Degree in Communications in the United States is 4.1%.