Cities with the Largest Irish Community in the United States
RELATED REPORTS & OPTIONS
Irish
United States
Compare Cities
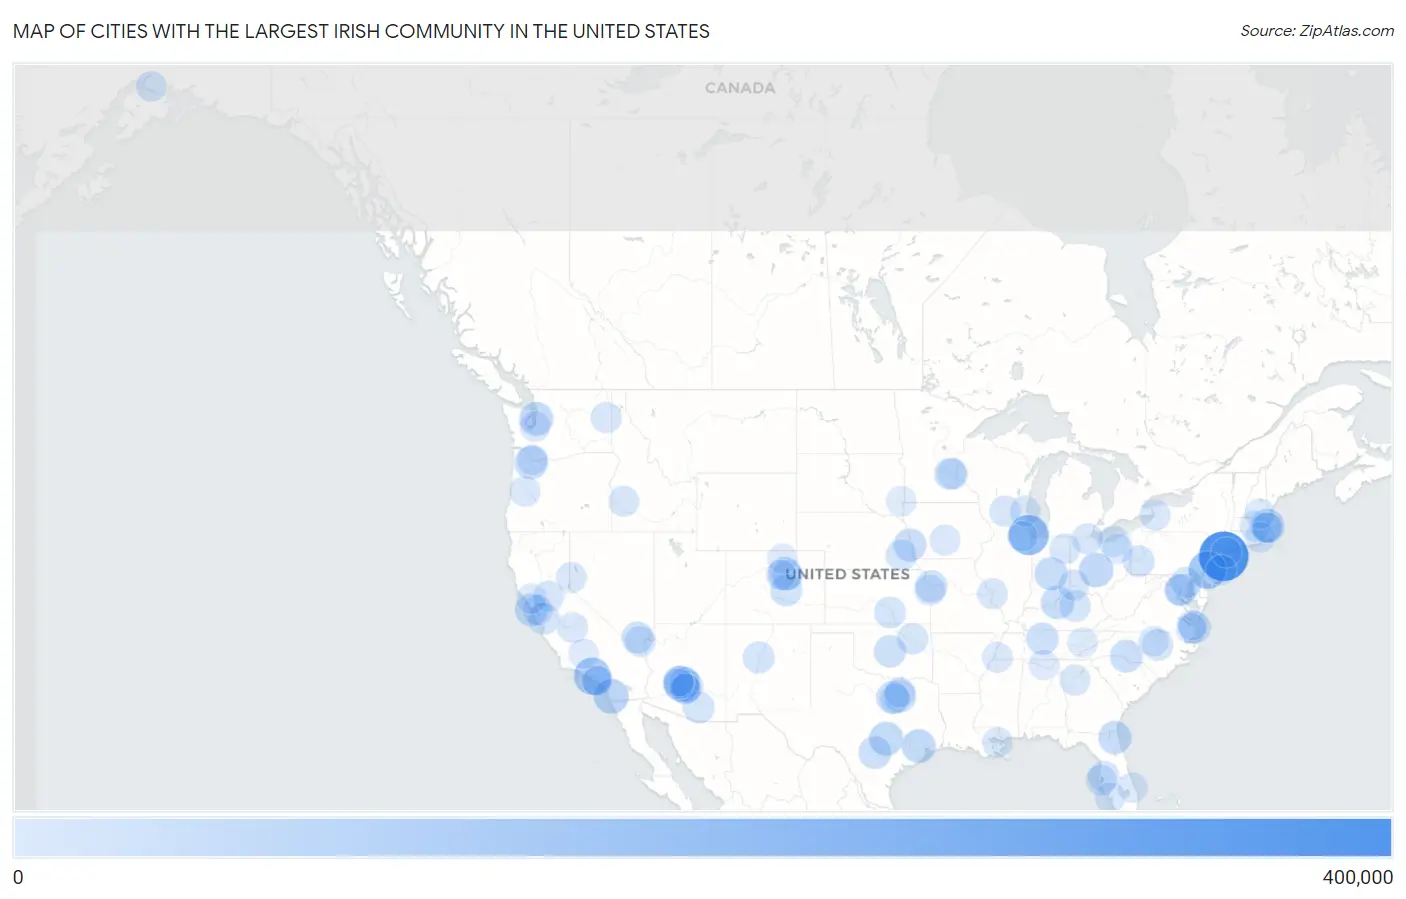
Map of Cities with the Largest Irish Community in the United States
0
400,000
Cities with the Largest Irish Community in the United States
| City | Irish | vs State | vs National | |
| 1. | New York | 377,193 | 2,131,998(17.69%)#1 | 31,313,347(1.20%)#1 |
| 2. | Chicago | 195,955 | 1,370,654(14.30%)#1 | 31,313,347(0.63%)#2 |
| 3. | Philadelphia | 154,492 | 1,947,932(7.93%)#1 | 31,313,347(0.49%)#3 |
| 4. | Los Angeles | 141,317 | 2,287,353(6.18%)#1 | 31,313,347(0.45%)#4 |
| 5. | Phoenix | 118,272 | 623,408(18.97%)#1 | 31,313,347(0.38%)#5 |
| 6. | San Diego | 100,675 | 2,287,353(4.40%)#2 | 31,313,347(0.32%)#6 |
| 7. | Columbus | 91,080 | 1,471,036(6.19%)#1 | 31,313,347(0.29%)#7 |
| 8. | Boston | 86,884 | 1,319,826(6.58%)#1 | 31,313,347(0.28%)#8 |
| 9. | Austin | 81,757 | 1,744,675(4.69%)#1 | 31,313,347(0.26%)#9 |
| 10. | Houston | 81,052 | 1,744,675(4.65%)#2 | 31,313,347(0.26%)#10 |
| 11. | Seattle | 79,426 | 761,455(10.43%)#1 | 31,313,347(0.25%)#11 |
| 12. | Denver | 74,859 | 621,429(12.05%)#1 | 31,313,347(0.24%)#12 |
| 13. | Portland | 73,993 | 464,726(15.92%)#1 | 31,313,347(0.24%)#13 |
| 14. | Jacksonville | 72,508 | 1,784,539(4.06%)#1 | 31,313,347(0.23%)#14 |
| 15. | Louisville | 71,725 | 500,090(14.34%)#1 | 31,313,347(0.23%)#15 |
| 16. | Indianapolis | 69,130 | 689,550(10.03%)#1 | 31,313,347(0.22%)#16 |
| 17. | San Francisco | 63,955 | 2,287,353(2.80%)#3 | 31,313,347(0.20%)#17 |
| 18. | Omaha | 63,140 | 230,281(27.42%)#1 | 31,313,347(0.20%)#18 |
| 19. | San Antonio | 62,014 | 1,744,675(3.55%)#3 | 31,313,347(0.20%)#19 |
| 20. | Charlotte | 59,924 | 855,171(7.01%)#1 | 31,313,347(0.19%)#20 |
| 21. | Dallas | 56,280 | 1,744,675(3.23%)#4 | 31,313,347(0.18%)#21 |
| 22. | Fort Worth | 56,107 | 1,744,675(3.22%)#5 | 31,313,347(0.18%)#22 |
| 23. | Nashville | 54,358 | 641,170(8.48%)#1 | 31,313,347(0.17%)#23 |
| 24. | Oklahoma City | 52,559 | 391,719(13.42%)#1 | 31,313,347(0.17%)#24 |
| 25. | Colorado Springs | 50,823 | 621,429(8.18%)#2 | 31,313,347(0.16%)#25 |
| 26. | Kansas City | 50,363 | 737,161(6.83%)#1 | 31,313,347(0.16%)#26 |
| 27. | Washington | 49,862 | 49,862(100.00%)#1 | 31,313,347(0.16%)#27 |
| 28. | Virginia Beach | 48,363 | 779,464(6.20%)#1 | 31,313,347(0.15%)#28 |
| 29. | Las Vegas | 45,561 | 243,739(18.69%)#1 | 31,313,347(0.15%)#29 |
| 30. | Minneapolis | 44,790 | 563,010(7.96%)#1 | 31,313,347(0.14%)#30 |
| 31. | Tucson | 43,699 | 623,408(7.01%)#2 | 31,313,347(0.14%)#31 |
| 32. | Albuquerque | 43,304 | 132,989(32.56%)#1 | 31,313,347(0.14%)#32 |
| 33. | Mesa | 42,856 | 623,408(6.87%)#3 | 31,313,347(0.14%)#33 |
| 34. | San Jose | 41,496 | 2,287,353(1.81%)#4 | 31,313,347(0.13%)#34 |
| 35. | Pittsburgh | 40,165 | 1,947,932(2.06%)#2 | 31,313,347(0.13%)#35 |
| 36. | Wichita | 39,243 | 324,644(12.09%)#1 | 31,313,347(0.13%)#36 |
| 37. | Raleigh | 38,855 | 855,171(4.54%)#2 | 31,313,347(0.12%)#37 |
| 38. | Lexington | 35,948 | 500,090(7.19%)#2 | 31,313,347(0.11%)#38 |
| 39. | Tulsa | 35,899 | 391,719(9.16%)#2 | 31,313,347(0.11%)#39 |
| 40. | Baltimore | 33,720 | 587,339(5.74%)#1 | 31,313,347(0.11%)#40 |
| 41. | Lincoln | 33,037 | 230,281(14.35%)#2 | 31,313,347(0.11%)#41 |
| 42. | Madison | 32,743 | 613,259(5.34%)#1 | 31,313,347(0.10%)#42 |
| 43. | Milwaukee | 31,828 | 613,259(5.19%)#2 | 31,313,347(0.10%)#43 |
| 44. | Cleveland | 31,554 | 1,471,036(2.15%)#2 | 31,313,347(0.10%)#44 |
| 45. | Henderson | 31,426 | 243,739(12.89%)#2 | 31,313,347(0.10%)#45 |
| 46. | St Paul | 30,989 | 563,010(5.50%)#2 | 31,313,347(0.10%)#46 |
| 47. | Tampa | 30,613 | 1,784,539(1.72%)#2 | 31,313,347(0.10%)#47 |
| 48. | Sacramento | 30,551 | 2,287,353(1.34%)#5 | 31,313,347(0.10%)#48 |
| 49. | Buffalo | 30,315 | 2,131,998(1.42%)#2 | 31,313,347(0.10%)#49 |
| 50. | Arlington | 30,310 | 779,464(3.89%)#2 | 31,313,347(0.10%)#50 |
| 51. | Atlanta | 30,185 | 736,842(4.10%)#1 | 31,313,347(0.10%)#51 |
| 52. | Spokane | 30,124 | 761,455(3.96%)#2 | 31,313,347(0.10%)#52 |
| 53. | Cincinnati | 29,945 | 1,471,036(2.04%)#3 | 31,313,347(0.10%)#53 |
| 54. | Scottsdale | 28,983 | 623,408(4.65%)#4 | 31,313,347(0.09%)#54 |
| 55. | Reno | 28,851 | 243,739(11.84%)#3 | 31,313,347(0.09%)#55 |
| 56. | St Petersburg | 28,603 | 1,784,539(1.60%)#3 | 31,313,347(0.09%)#56 |
| 57. | St Louis | 28,558 | 737,161(3.87%)#2 | 31,313,347(0.09%)#57 |
| 58. | Boise City | 28,520 | 171,482(16.63%)#1 | 31,313,347(0.09%)#58 |
| 59. | Worcester | 27,961 | 1,319,826(2.12%)#2 | 31,313,347(0.09%)#59 |
| 60. | Overland Park | 27,921 | 324,644(8.60%)#2 | 31,313,347(0.09%)#60 |
| 61. | Toledo | 27,896 | 1,471,036(1.90%)#4 | 31,313,347(0.09%)#61 |
| 62. | Anchorage | 27,710 | 69,921(39.63%)#1 | 31,313,347(0.09%)#62 |
| 63. | Aurora | 27,659 | 621,429(4.45%)#3 | 31,313,347(0.09%)#63 |
| 64. | Gilbert | 25,634 | 623,408(4.11%)#5 | 31,313,347(0.08%)#64 |
| 65. | Des Moines | 25,582 | 405,795(6.30%)#1 | 31,313,347(0.08%)#65 |
| 66. | Fresno | 25,038 | 2,287,353(1.09%)#6 | 31,313,347(0.08%)#66 |
| 67. | Chandler | 24,517 | 623,408(3.93%)#6 | 31,313,347(0.08%)#67 |
| 68. | Fort Wayne | 24,331 | 689,550(3.53%)#2 | 31,313,347(0.08%)#68 |
| 69. | Chesapeake | 23,901 | 779,464(3.07%)#3 | 31,313,347(0.08%)#69 |
| 70. | Memphis | 23,831 | 641,170(3.72%)#2 | 31,313,347(0.08%)#70 |
| 71. | Quincy | 23,573 | 1,319,826(1.79%)#3 | 31,313,347(0.08%)#71 |
| 72. | Oakland | 23,556 | 2,287,353(1.03%)#7 | 31,313,347(0.08%)#72 |
| 73. | Eugene | 23,448 | 464,726(5.05%)#2 | 31,313,347(0.07%)#73 |
| 74. | Long Beach | 23,186 | 2,287,353(1.01%)#8 | 31,313,347(0.07%)#74 |
| 75. | Cape Coral | 22,766 | 1,784,539(1.28%)#4 | 31,313,347(0.07%)#75 |
| 76. | Tacoma | 22,056 | 761,455(2.90%)#3 | 31,313,347(0.07%)#76 |
| 77. | Naperville | 21,809 | 1,370,654(1.59%)#2 | 31,313,347(0.07%)#77 |
| 78. | Arlington | 21,791 | 1,744,675(1.25%)#6 | 31,313,347(0.07%)#78 |
| 79. | Peoria | 21,589 | 623,408(3.46%)#7 | 31,313,347(0.07%)#79 |
| 80. | New Orleans | 21,564 | 300,492(7.18%)#1 | 31,313,347(0.07%)#80 |
| 81. | Sioux Falls | 21,008 | 87,554(23.99%)#1 | 31,313,347(0.07%)#81 |
| 82. | Fort Collins | 20,859 | 621,429(3.36%)#4 | 31,313,347(0.07%)#82 |
| 83. | Manchester | 20,775 | 278,617(7.46%)#1 | 31,313,347(0.07%)#83 |
| 84. | Huntington Beach | 20,669 | 2,287,353(0.90%)#9 | 31,313,347(0.07%)#84 |
| 85. | Akron | 20,300 | 1,471,036(1.38%)#5 | 31,313,347(0.06%)#85 |
| 86. | Port St Lucie | 19,996 | 1,784,539(1.12%)#5 | 31,313,347(0.06%)#86 |
| 87. | Warwick | 19,739 | 182,950(10.79%)#1 | 31,313,347(0.06%)#87 |
| 88. | Plano | 19,470 | 1,744,675(1.12%)#7 | 31,313,347(0.06%)#88 |
| 89. | Durham | 19,236 | 855,171(2.25%)#3 | 31,313,347(0.06%)#89 |
| 90. | Huntsville | 19,129 | 394,282(4.85%)#1 | 31,313,347(0.06%)#90 |
| 91. | Yonkers | 19,002 | 2,131,998(0.89%)#3 | 31,313,347(0.06%)#91 |
| 92. | Lakewood | 18,908 | 621,429(3.04%)#5 | 31,313,347(0.06%)#92 |
| 93. | Weymouth Town | 18,883 | 1,319,826(1.43%)#4 | 31,313,347(0.06%)#93 |
| 94. | Glendale | 18,736 | 623,408(3.01%)#8 | 31,313,347(0.06%)#94 |
| 95. | Norfolk | 18,715 | 779,464(2.40%)#4 | 31,313,347(0.06%)#95 |
| 96. | Knoxville | 18,648 | 641,170(2.91%)#3 | 31,313,347(0.06%)#96 |
| 97. | Vancouver | 18,345 | 761,455(2.41%)#4 | 31,313,347(0.06%)#97 |
| 98. | Toms River | 18,089 | 1,154,951(1.57%)#1 | 31,313,347(0.06%)#98 |
| 99. | Santa Rosa | 18,084 | 2,287,353(0.79%)#10 | 31,313,347(0.06%)#99 |
| 100. | Bakersfield | 18,053 | 2,287,353(0.79%)#11 | 31,313,347(0.06%)#100 |
Common Questions
What are the Top 10 Cities with the Largest Irish Community in the United States?
Top 10 Cities with the Largest Irish Community in the United States are:
What city has the Largest Irish Community in the United States?
New York has the Largest Irish Community in the United States with 377,193.
What is the Total Irish Population in the United States?
Total Irish Population in the United States is 31,313,347.