Cities with the Highest Percentage of Immigrants from Croatia in the United States
RELATED REPORTS & OPTIONS
Croatia
United States
Compare Cities
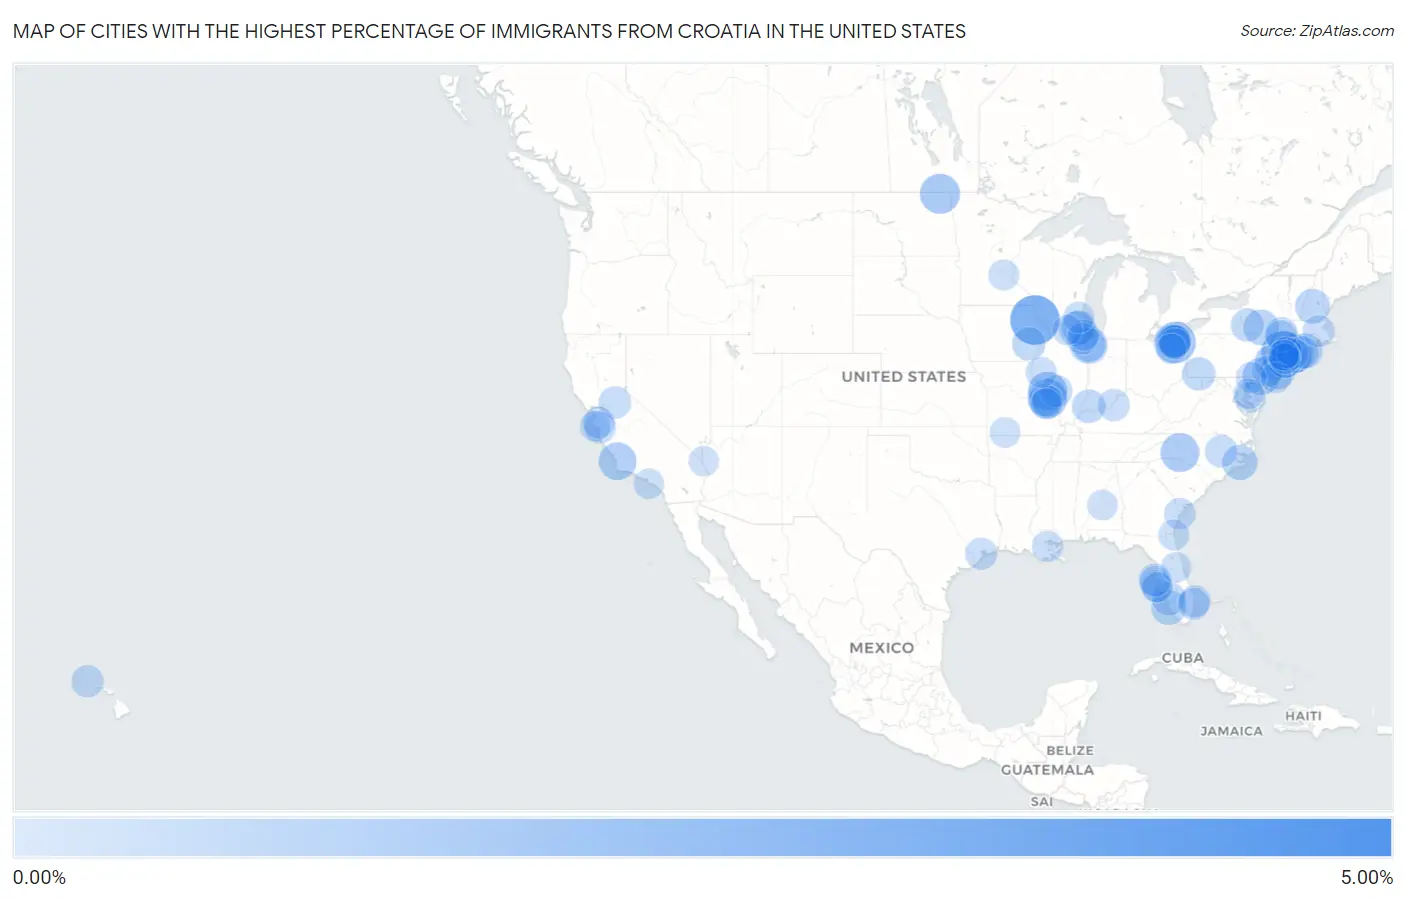
Map of Cities with the Highest Percentage of Immigrants from Croatia in the United States
0.00%
5.00%
Cities with the Highest Percentage of Immigrants from Croatia in the United States
| City | Croatia | vs State | vs National | |
| 1. | South Wilton | 4.41% | 0.012%(+4.40)#1 | 0.012%(+4.40)#1 |
| 2. | Garber | 2.91% | 0.012%(+2.90)#1 | 0.012%(+2.90)#2 |
| 3. | Jobstown | 2.45% | 0.028%(+2.42)#1 | 0.012%(+2.44)#3 |
| 4. | Fairview Borough | 2.32% | 0.028%(+2.29)#2 | 0.012%(+2.31)#4 |
| 5. | Irvington | 2.00% | 0.033%(+1.97)#1 | 0.012%(+1.99)#5 |
| 6. | Kirtland | 1.85% | 0.019%(+1.83)#1 | 0.012%(+1.84)#6 |
| 7. | Walhalla | 1.65% | 0.018%(+1.63)#1 | 0.012%(+1.64)#7 |
| 8. | Belle Terre | 1.60% | 0.033%(+1.57)#2 | 0.012%(+1.59)#8 |
| 9. | Gilmer Park | 1.57% | 0.014%(+1.56)#1 | 0.012%(+1.56)#9 |
| 10. | St George | 1.55% | 0.012%(+1.53)#1 | 0.012%(+1.54)#10 |
| 11. | Portage Des Sioux | 1.52% | 0.012%(+1.50)#2 | 0.012%(+1.50)#11 |
| 12. | Denver | 1.50% | 0.0053%(+1.49)#1 | 0.012%(+1.49)#12 |
| 13. | North Haledon Borough | 1.41% | 0.028%(+1.38)#3 | 0.012%(+1.40)#13 |
| 14. | Centre Island | 1.38% | 0.033%(+1.35)#3 | 0.012%(+1.37)#14 |
| 15. | Callender | 1.35% | 0.013%(+1.34)#1 | 0.012%(+1.34)#15 |
| 16. | Schererville | 1.31% | 0.014%(+1.29)#2 | 0.012%(+1.29)#16 |
| 17. | Beckett | 1.29% | 0.028%(+1.26)#4 | 0.012%(+1.28)#17 |
| 18. | Eastlake | 1.11% | 0.019%(+1.09)#2 | 0.012%(+1.10)#18 |
| 19. | East Millstone | 1.11% | 0.028%(+1.08)#5 | 0.012%(+1.10)#19 |
| 20. | North Lynbrook | 1.06% | 0.033%(+1.03)#4 | 0.012%(+1.05)#20 |
| 21. | Unadilla | 1.06% | 0.033%(+1.03)#5 | 0.012%(+1.05)#21 |
| 22. | Leisure Village East | 1.05% | 0.028%(+1.02)#6 | 0.012%(+1.04)#22 |
| 23. | Minnesott Beach | 1.03% | 0.0053%(+1.02)#2 | 0.012%(+1.02)#23 |
| 24. | Rest Haven | 1.00% | 0.031%(+0.971)#1 | 0.012%(+0.990)#24 |
| 25. | Pelican Bay | 0.99% | 0.017%(+0.970)#1 | 0.012%(+0.976)#25 |
| 26. | Orient | 0.98% | 0.033%(+0.951)#6 | 0.012%(+0.972)#26 |
| 27. | Bull Valley | 0.96% | 0.031%(+0.930)#2 | 0.012%(+0.950)#27 |
| 28. | Franklin | 0.96% | 0.022%(+0.939)#1 | 0.012%(+0.949)#28 |
| 29. | Timberlake | 0.92% | 0.019%(+0.897)#3 | 0.012%(+0.904)#29 |
| 30. | Volo | 0.88% | 0.031%(+0.848)#3 | 0.012%(+0.868)#30 |
| 31. | Hillsdale Borough | 0.87% | 0.028%(+0.841)#7 | 0.012%(+0.858)#31 |
| 32. | Sparrow Bush | 0.86% | 0.033%(+0.832)#7 | 0.012%(+0.853)#32 |
| 33. | St John | 0.83% | 0.014%(+0.816)#3 | 0.012%(+0.818)#33 |
| 34. | Middle Island | 0.82% | 0.033%(+0.787)#8 | 0.012%(+0.809)#34 |
| 35. | Harbor Isle | 0.81% | 0.033%(+0.776)#9 | 0.012%(+0.797)#35 |
| 36. | Suncoast Estates | 0.81% | 0.017%(+0.791)#2 | 0.012%(+0.796)#36 |
| 37. | Elberfeld | 0.81% | 0.014%(+0.792)#4 | 0.012%(+0.795)#37 |
| 38. | Kalona | 0.80% | 0.012%(+0.785)#2 | 0.012%(+0.785)#38 |
| 39. | Cove Neck | 0.78% | 0.033%(+0.751)#10 | 0.012%(+0.773)#39 |
| 40. | Dobbs Ferry | 0.78% | 0.033%(+0.746)#11 | 0.012%(+0.767)#40 |
| 41. | Leith Hatfield | 0.78% | 0.0058%(+0.772)#1 | 0.012%(+0.766)#41 |
| 42. | Golden S Bridge | 0.77% | 0.033%(+0.738)#12 | 0.012%(+0.760)#42 |
| 43. | Dryden | 0.76% | 0.033%(+0.729)#13 | 0.012%(+0.750)#43 |
| 44. | Ridgefield Borough | 0.75% | 0.028%(+0.722)#8 | 0.012%(+0.739)#44 |
| 45. | Glasco | 0.75% | 0.033%(+0.717)#14 | 0.012%(+0.738)#45 |
| 46. | High Ridge | 0.73% | 0.012%(+0.719)#3 | 0.012%(+0.719)#46 |
| 47. | Belleair Beach | 0.73% | 0.017%(+0.710)#3 | 0.012%(+0.716)#47 |
| 48. | Harrington Park Borough | 0.70% | 0.028%(+0.676)#9 | 0.012%(+0.693)#48 |
| 49. | Willowick | 0.69% | 0.019%(+0.671)#4 | 0.012%(+0.678)#49 |
| 50. | Southold | 0.69% | 0.033%(+0.656)#15 | 0.012%(+0.677)#50 |
| 51. | Willoughby | 0.68% | 0.019%(+0.657)#5 | 0.012%(+0.664)#51 |
| 52. | Kenly | 0.67% | 0.0053%(+0.667)#3 | 0.012%(+0.661)#52 |
| 53. | Jackson | 0.66% | 0.013%(+0.647)#2 | 0.012%(+0.648)#53 |
| 54. | Kahaluu | 0.65% | 0.0084%(+0.643)#1 | 0.012%(+0.640)#54 |
| 55. | Williamson | 0.65% | 0.031%(+0.618)#4 | 0.012%(+0.638)#55 |
| 56. | Cliffside Park Borough | 0.63% | 0.028%(+0.598)#10 | 0.012%(+0.615)#56 |
| 57. | West Buechel | 0.62% | 0.0062%(+0.614)#1 | 0.012%(+0.608)#57 |
| 58. | Kemah | 0.62% | 0.0028%(+0.614)#1 | 0.012%(+0.605)#58 |
| 59. | Herricks | 0.62% | 0.033%(+0.582)#16 | 0.012%(+0.604)#59 |
| 60. | Manalapan | 0.61% | 0.017%(+0.596)#4 | 0.012%(+0.602)#60 |
| 61. | Walpole | 0.61% | 0.0078%(+0.604)#1 | 0.012%(+0.600)#61 |
| 62. | Anna Maria | 0.61% | 0.017%(+0.589)#5 | 0.012%(+0.595)#62 |
| 63. | Plandome Manor | 0.60% | 0.033%(+0.569)#17 | 0.012%(+0.590)#63 |
| 64. | Rhinebeck | 0.59% | 0.033%(+0.561)#18 | 0.012%(+0.583)#64 |
| 65. | Old Field | 0.59% | 0.033%(+0.555)#19 | 0.012%(+0.577)#65 |
| 66. | Highland Beach | 0.59% | 0.017%(+0.569)#6 | 0.012%(+0.575)#66 |
| 67. | Skidaway Island | 0.57% | 0.0067%(+0.564)#1 | 0.012%(+0.559)#67 |
| 68. | Countryside | 0.57% | 0.031%(+0.538)#5 | 0.012%(+0.558)#68 |
| 69. | Freedom | 0.57% | 0.013%(+0.553)#3 | 0.012%(+0.554)#69 |
| 70. | Cambrian Park | 0.56% | 0.013%(+0.551)#4 | 0.012%(+0.552)#70 |
| 71. | Arnold | 0.55% | 0.012%(+0.535)#4 | 0.012%(+0.535)#71 |
| 72. | Harwood Heights | 0.54% | 0.031%(+0.506)#6 | 0.012%(+0.525)#72 |
| 73. | New Sarpy | 0.53% | 0.0053%(+0.521)#1 | 0.012%(+0.515)#73 |
| 74. | Beverly | 0.52% | 0.028%(+0.491)#11 | 0.012%(+0.508)#74 |
| 75. | Muskego | 0.52% | 0.013%(+0.506)#1 | 0.012%(+0.507)#75 |
| 76. | West Long Branch Borough | 0.51% | 0.028%(+0.486)#12 | 0.012%(+0.503)#76 |
| 77. | Cos Cob | 0.51% | 0.012%(+0.499)#2 | 0.012%(+0.499)#77 |
| 78. | Mount Sterling | 0.51% | 0.031%(+0.474)#7 | 0.012%(+0.494)#78 |
| 79. | Hunting Valley | 0.50% | 0.019%(+0.481)#6 | 0.012%(+0.488)#79 |
| 80. | Pevely | 0.50% | 0.012%(+0.487)#5 | 0.012%(+0.487)#80 |
| 81. | Medicine Lake | 0.48% | 0.0056%(+0.472)#1 | 0.012%(+0.466)#81 |
| 82. | Ocean Acres | 0.48% | 0.028%(+0.449)#13 | 0.012%(+0.466)#82 |
| 83. | Algonquin | 0.47% | 0.0038%(+0.470)#1 | 0.012%(+0.462)#83 |
| 84. | Rising Sun | 0.47% | 0.0038%(+0.468)#2 | 0.012%(+0.460)#84 |
| 85. | North New Hyde Park | 0.47% | 0.033%(+0.438)#20 | 0.012%(+0.459)#85 |
| 86. | Fernandina Beach | 0.47% | 0.017%(+0.451)#7 | 0.012%(+0.457)#86 |
| 87. | St Michaels | 0.46% | 0.0038%(+0.456)#3 | 0.012%(+0.448)#87 |
| 88. | Mamaroneck | 0.46% | 0.033%(+0.424)#21 | 0.012%(+0.445)#88 |
| 89. | Bonny Doon | 0.45% | 0.013%(+0.442)#5 | 0.012%(+0.443)#89 |
| 90. | Redington Beach | 0.45% | 0.017%(+0.437)#8 | 0.012%(+0.443)#90 |
| 91. | Branson West | 0.45% | 0.012%(+0.434)#6 | 0.012%(+0.434)#91 |
| 92. | Rancho Palos Verdes | 0.44% | 0.013%(+0.432)#6 | 0.012%(+0.433)#92 |
| 93. | Leonia Borough | 0.44% | 0.028%(+0.414)#14 | 0.012%(+0.431)#93 |
| 94. | South Bradenton | 0.44% | 0.017%(+0.418)#9 | 0.012%(+0.424)#94 |
| 95. | Prattville | 0.44% | 0.0054%(+0.430)#1 | 0.012%(+0.424)#95 |
| 96. | Ho Ho Kus Borough | 0.43% | 0.028%(+0.397)#15 | 0.012%(+0.414)#96 |
| 97. | Casselberry | 0.42% | 0.017%(+0.405)#10 | 0.012%(+0.411)#97 |
| 98. | Fort Mohave | 0.41% | 0.019%(+0.393)#1 | 0.012%(+0.400)#98 |
| 99. | Cherry Valley | 0.41% | 0.031%(+0.375)#8 | 0.012%(+0.395)#99 |
| 100. | Richfield | 0.40% | 0.019%(+0.385)#7 | 0.012%(+0.392)#100 |
Common Questions
What are the Top 10 Cities with the Highest Percentage of Immigrants from Croatia in the United States?
Top 10 Cities with the Highest Percentage of Immigrants from Croatia in the United States are:
What city has the Highest Percentage of Immigrants from Croatia in the United States?
Garber has the Highest Percentage of Immigrants from Croatia in the United States with 2.91%.
What is the Percentage of Immigrants from Croatia in the United States?
Percentage of Immigrants from Croatia in the United States is 0.012%.