Cities with the Largest Serbian Community in the United States
RELATED REPORTS & OPTIONS
Serbian
United States
Compare Cities
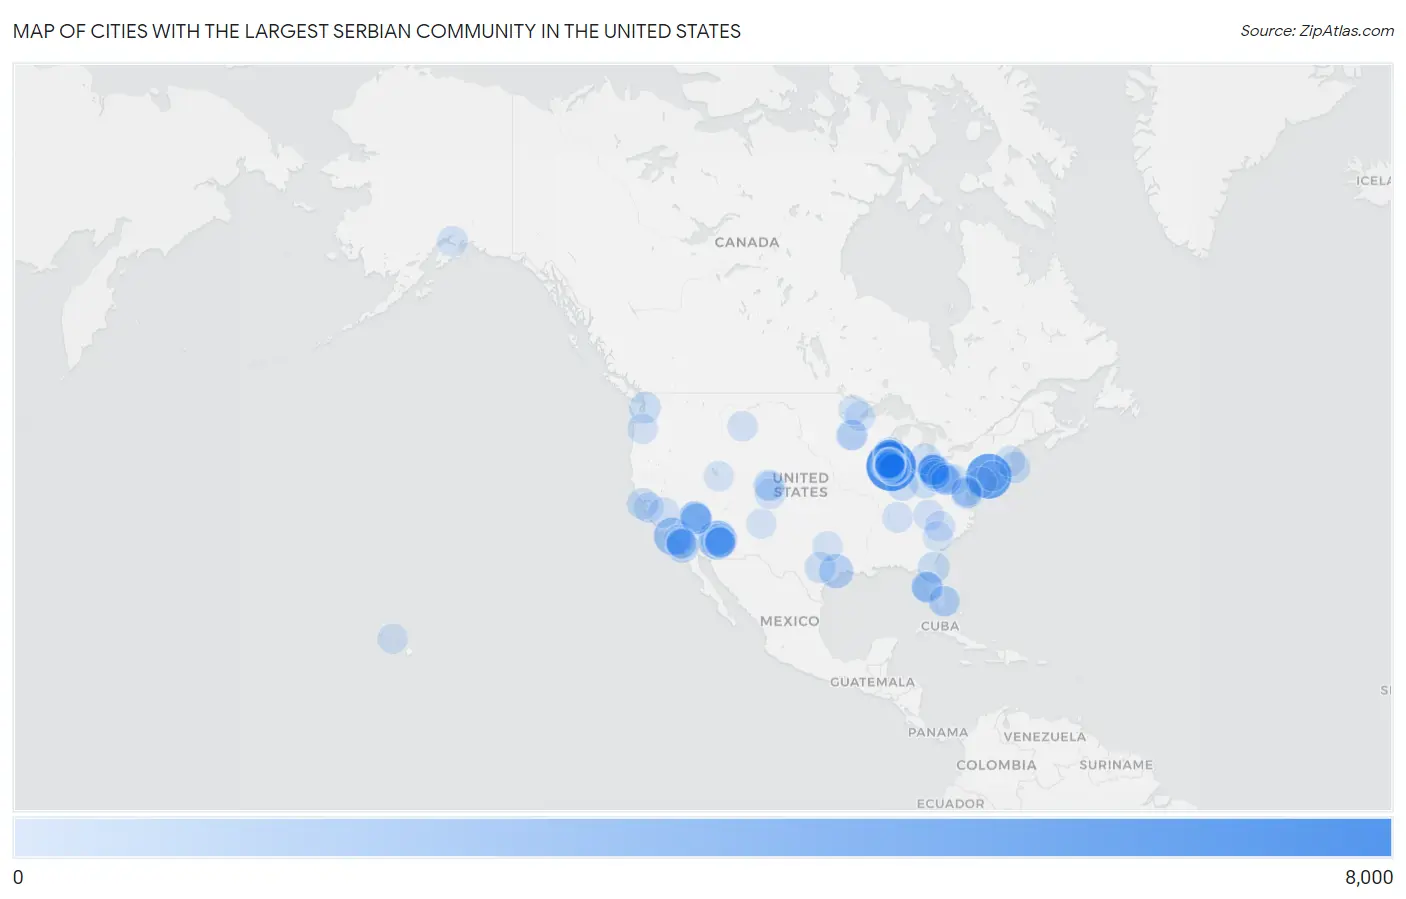
Map of Cities with the Largest Serbian Community in the United States
0
8,000
Cities with the Largest Serbian Community in the United States
| City | Serbian | vs State | vs National | |
| 1. | Chicago | 6,865 | 25,407(27.02%)#1 | 194,511(3.53%)#1 |
| 2. | New York | 5,298 | 9,875(53.65%)#1 | 194,511(2.72%)#2 |
| 3. | Phoenix | 3,143 | 7,124(44.12%)#1 | 194,511(1.62%)#3 |
| 4. | Los Angeles | 2,627 | 18,555(14.16%)#1 | 194,511(1.35%)#4 |
| 5. | Houston | 1,520 | 7,253(20.96%)#1 | 194,511(0.78%)#5 |
| 6. | Spring Valley | 1,487 | 3,868(38.44%)#1 | 194,511(0.76%)#6 |
| 7. | Milwaukee | 1,196 | 8,196(14.59%)#1 | 194,511(0.61%)#7 |
| 8. | Schererville | 1,194 | 10,095(11.83%)#1 | 194,511(0.61%)#8 |
| 9. | San Diego | 1,185 | 18,555(6.39%)#2 | 194,511(0.61%)#9 |
| 10. | Parma | 1,110 | 16,379(6.78%)#1 | 194,511(0.57%)#10 |
| 11. | Akron | 953 | 16,379(5.82%)#2 | 194,511(0.49%)#11 |
| 12. | Pittsburgh | 927 | 17,292(5.36%)#1 | 194,511(0.48%)#12 |
| 13. | St Petersburg | 743 | 11,186(6.64%)#1 | 194,511(0.38%)#13 |
| 14. | Glendale | 730 | 7,124(10.25%)#2 | 194,511(0.38%)#14 |
| 15. | Seattle | 726 | 3,344(21.71%)#1 | 194,511(0.37%)#15 |
| 16. | Columbus | 719 | 16,379(4.39%)#3 | 194,511(0.37%)#16 |
| 17. | Jacksonville | 717 | 11,186(6.41%)#2 | 194,511(0.37%)#17 |
| 18. | San Francisco | 661 | 18,555(3.56%)#3 | 194,511(0.34%)#18 |
| 19. | Indianapolis | 639 | 10,095(6.33%)#2 | 194,511(0.33%)#19 |
| 20. | Naperville | 626 | 25,407(2.46%)#2 | 194,511(0.32%)#20 |
| 21. | North Royalton | 594 | 16,379(3.63%)#4 | 194,511(0.31%)#21 |
| 22. | Enterprise | 593 | 3,868(15.33%)#2 | 194,511(0.30%)#22 |
| 23. | Austin | 581 | 7,253(8.01%)#2 | 194,511(0.30%)#23 |
| 24. | Cleveland | 580 | 16,379(3.54%)#5 | 194,511(0.30%)#24 |
| 25. | Escondido | 565 | 18,555(3.05%)#4 | 194,511(0.29%)#25 |
| 26. | Downers Grove | 563 | 25,407(2.22%)#3 | 194,511(0.29%)#26 |
| 27. | Barnstable Town | 533 | 3,607(14.78%)#1 | 194,511(0.27%)#27 |
| 28. | Muskego | 496 | 8,196(6.05%)#2 | 194,511(0.25%)#28 |
| 29. | Philadelphia | 494 | 17,292(2.86%)#2 | 194,511(0.25%)#29 |
| 30. | Park Ridge | 483 | 25,407(1.90%)#4 | 194,511(0.25%)#30 |
| 31. | Brookfield | 480 | 25,407(1.89%)#5 | 194,511(0.25%)#31 |
| 32. | Carol Stream | 471 | 25,407(1.85%)#6 | 194,511(0.24%)#32 |
| 33. | Scottsdale | 470 | 7,124(6.60%)#3 | 194,511(0.24%)#33 |
| 34. | Hoffman Estates | 462 | 25,407(1.82%)#7 | 194,511(0.24%)#34 |
| 35. | Sterling Heights | 459 | 9,236(4.97%)#1 | 194,511(0.24%)#35 |
| 36. | Fresno | 454 | 18,555(2.45%)#5 | 194,511(0.23%)#36 |
| 37. | Boston | 453 | 3,607(12.56%)#2 | 194,511(0.23%)#37 |
| 38. | Arlington | 451 | 3,316(13.60%)#1 | 194,511(0.23%)#38 |
| 39. | Racine | 450 | 8,196(5.49%)#3 | 194,511(0.23%)#39 |
| 40. | Washington | 438 | 438(100.00%)#1 | 194,511(0.23%)#40 |
| 41. | Greenfield | 431 | 8,196(5.26%)#4 | 194,511(0.22%)#41 |
| 42. | Denver | 421 | 2,918(14.43%)#1 | 194,511(0.22%)#42 |
| 43. | Franklin | 418 | 8,196(5.10%)#5 | 194,511(0.21%)#43 |
| 44. | Gilbert | 416 | 7,124(5.84%)#4 | 194,511(0.21%)#44 |
| 45. | Crown Point | 412 | 10,095(4.08%)#3 | 194,511(0.21%)#45 |
| 46. | Addison | 410 | 25,407(1.61%)#8 | 194,511(0.21%)#46 |
| 47. | Oak Creek | 408 | 8,196(4.98%)#6 | 194,511(0.21%)#47 |
| 48. | Las Vegas | 406 | 3,868(10.50%)#3 | 194,511(0.21%)#48 |
| 49. | Anchorage | 404 | 589(68.59%)#1 | 194,511(0.21%)#49 |
| 50. | Mesa | 395 | 7,124(5.54%)#5 | 194,511(0.20%)#50 |
| 51. | Dania Beach | 390 | 11,186(3.49%)#3 | 194,511(0.20%)#51 |
| 52. | Des Plaines | 389 | 25,407(1.53%)#9 | 194,511(0.20%)#52 |
| 53. | San Jose | 386 | 18,555(2.08%)#6 | 194,511(0.20%)#53 |
| 54. | Mission Viejo | 385 | 18,555(2.07%)#7 | 194,511(0.20%)#54 |
| 55. | Portage | 383 | 10,095(3.79%)#4 | 194,511(0.20%)#55 |
| 56. | Broadview Heights | 379 | 16,379(2.31%)#6 | 194,511(0.19%)#56 |
| 57. | Henderson | 372 | 3,868(9.62%)#4 | 194,511(0.19%)#57 |
| 58. | Nashville | 369 | 1,614(22.86%)#1 | 194,511(0.19%)#58 |
| 59. | Elgin | 365 | 25,407(1.44%)#10 | 194,511(0.19%)#59 |
| 60. | Kingsport | 365 | 1,614(22.61%)#2 | 194,511(0.19%)#60 |
| 61. | Weirton | 365 | 947(38.54%)#1 | 194,511(0.19%)#61 |
| 62. | Colorado Springs | 364 | 2,918(12.47%)#2 | 194,511(0.19%)#62 |
| 63. | Johnstown | 362 | 17,292(2.09%)#3 | 194,511(0.19%)#63 |
| 64. | Hobart | 359 | 10,095(3.56%)#5 | 194,511(0.18%)#64 |
| 65. | Strongsville | 345 | 16,379(2.11%)#7 | 194,511(0.18%)#65 |
| 66. | Minneapolis | 338 | 3,771(8.96%)#1 | 194,511(0.17%)#66 |
| 67. | St Paul | 336 | 3,771(8.91%)#2 | 194,511(0.17%)#67 |
| 68. | Charlotte | 334 | 2,245(14.88%)#1 | 194,511(0.17%)#68 |
| 69. | Billings | 333 | 963(34.58%)#1 | 194,511(0.17%)#69 |
| 70. | Wantagh | 316 | 9,875(3.20%)#2 | 194,511(0.16%)#70 |
| 71. | Portland | 307 | 1,933(15.88%)#1 | 194,511(0.16%)#71 |
| 72. | Lexington | 305 | 1,451(21.02%)#1 | 194,511(0.16%)#72 |
| 73. | St John | 303 | 10,095(3.00%)#6 | 194,511(0.16%)#73 |
| 74. | Davie | 302 | 11,186(2.70%)#4 | 194,511(0.16%)#74 |
| 75. | Mount Prospect | 302 | 25,407(1.19%)#11 | 194,511(0.16%)#75 |
| 76. | Lyons | 301 | 25,407(1.18%)#12 | 194,511(0.15%)#76 |
| 77. | Elk Grove Village | 297 | 25,407(1.17%)#13 | 194,511(0.15%)#77 |
| 78. | Aliquippa | 293 | 17,292(1.69%)#4 | 194,511(0.15%)#78 |
| 79. | La Grange | 285 | 25,407(1.12%)#14 | 194,511(0.15%)#79 |
| 80. | Munster | 283 | 10,095(2.80%)#7 | 194,511(0.15%)#80 |
| 81. | Oceanside | 281 | 18,555(1.51%)#8 | 194,511(0.14%)#81 |
| 82. | Eldorado At Santa Fe | 279 | 731(38.17%)#1 | 194,511(0.14%)#82 |
| 83. | Niles | 274 | 25,407(1.08%)#15 | 194,511(0.14%)#83 |
| 84. | Dallas | 273 | 7,253(3.76%)#3 | 194,511(0.14%)#84 |
| 85. | Orland Park | 273 | 25,407(1.07%)#16 | 194,511(0.14%)#85 |
| 86. | Urban Honolulu | 270 | 480(56.25%)#1 | 194,511(0.14%)#86 |
| 87. | Duluth | 270 | 3,771(7.16%)#3 | 194,511(0.14%)#87 |
| 88. | Prospect Heights | 270 | 25,407(1.06%)#17 | 194,511(0.14%)#88 |
| 89. | Salt Lake City | 268 | 1,134(23.63%)#1 | 194,511(0.14%)#89 |
| 90. | Rockville | 262 | 3,012(8.70%)#1 | 194,511(0.13%)#90 |
| 91. | Hibbing | 262 | 3,771(6.95%)#4 | 194,511(0.13%)#91 |
| 92. | Massillon | 260 | 16,379(1.59%)#8 | 194,511(0.13%)#92 |
| 93. | Aurora | 258 | 2,918(8.84%)#3 | 194,511(0.13%)#93 |
| 94. | Clearwater | 258 | 11,186(2.31%)#5 | 194,511(0.13%)#94 |
| 95. | Green | 258 | 16,379(1.58%)#9 | 194,511(0.13%)#95 |
| 96. | Lealman | 256 | 11,186(2.29%)#6 | 194,511(0.13%)#96 |
| 97. | Norridge | 256 | 25,407(1.01%)#18 | 194,511(0.13%)#97 |
| 98. | Chandler | 254 | 7,124(3.57%)#6 | 194,511(0.13%)#98 |
| 99. | San Marcos | 254 | 18,555(1.37%)#9 | 194,511(0.13%)#99 |
| 100. | Bethel Park | 250 | 17,292(1.45%)#5 | 194,511(0.13%)#100 |
Common Questions
What are the Top 10 Cities with the Largest Serbian Community in the United States?
Top 10 Cities with the Largest Serbian Community in the United States are:
What city has the Largest Serbian Community in the United States?
Chicago has the Largest Serbian Community in the United States with 6,865.
What is the Total Serbian Population in the United States?
Total Serbian Population in the United States is 194,511.