Anderson, SC Map & Demographics
Anderson Map
Anderson Overview
$26,102
PER CAPITA INCOME
$55,686
AVG FAMILY INCOME
$40,445
AVG HOUSEHOLD INCOME
27.3%
WAGE / INCOME GAP [ % ]
72.7¢/ $1
WAGE / INCOME GAP [ $ ]
$14,099
FAMILY INCOME DEFICIT
0.49
INEQUALITY / GINI INDEX
29,345
TOTAL POPULATION
13,501
MALE POPULATION
15,844
FEMALE POPULATION
85.21
MALES / 100 FEMALES
117.35
FEMALES / 100 MALES
32.7
MEDIAN AGE
3.0
AVG FAMILY SIZE
2.3
AVG HOUSEHOLD SIZE
13,807
LABOR FORCE [ PEOPLE ]
59.8%
PERCENT IN LABOR FORCE
6.9%
UNEMPLOYMENT RATE
Anderson Area Codes
Income in Anderson
Income Overview in Anderson
Per Capita Income in Anderson is $26,102, while median incomes of families and households are $55,686 and $40,445 respectively.
| Characteristic | Number | Measure |
| Per Capita Income | 29,345 | $26,102 |
| Median Family Income | 6,657 | $55,686 |
| Mean Family Income | 6,657 | $77,936 |
| Median Household Income | 12,008 | $40,445 |
| Mean Household Income | 12,008 | $61,521 |
| Income Deficit | 6,657 | $14,099 |
| Wage / Income Gap (%) | 29,345 | 27.27% |
| Wage / Income Gap ($) | 29,345 | 72.73¢ per $1 |
| Gini / Inequality Index | 29,345 | 0.49 |
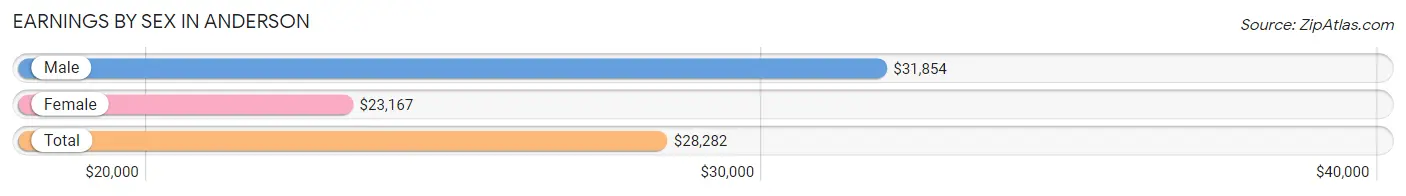
Earnings by Sex in Anderson
Average Earnings in Anderson are $28,282, $31,854 for men and $23,167 for women, a difference of 27.3%.
| Sex | Number | Average Earnings |
| Male | 7,122 (49.0%) | $31,854 |
| Female | 7,407 (51.0%) | $23,167 |
| Total | 14,529 (100.0%) | $28,282 |
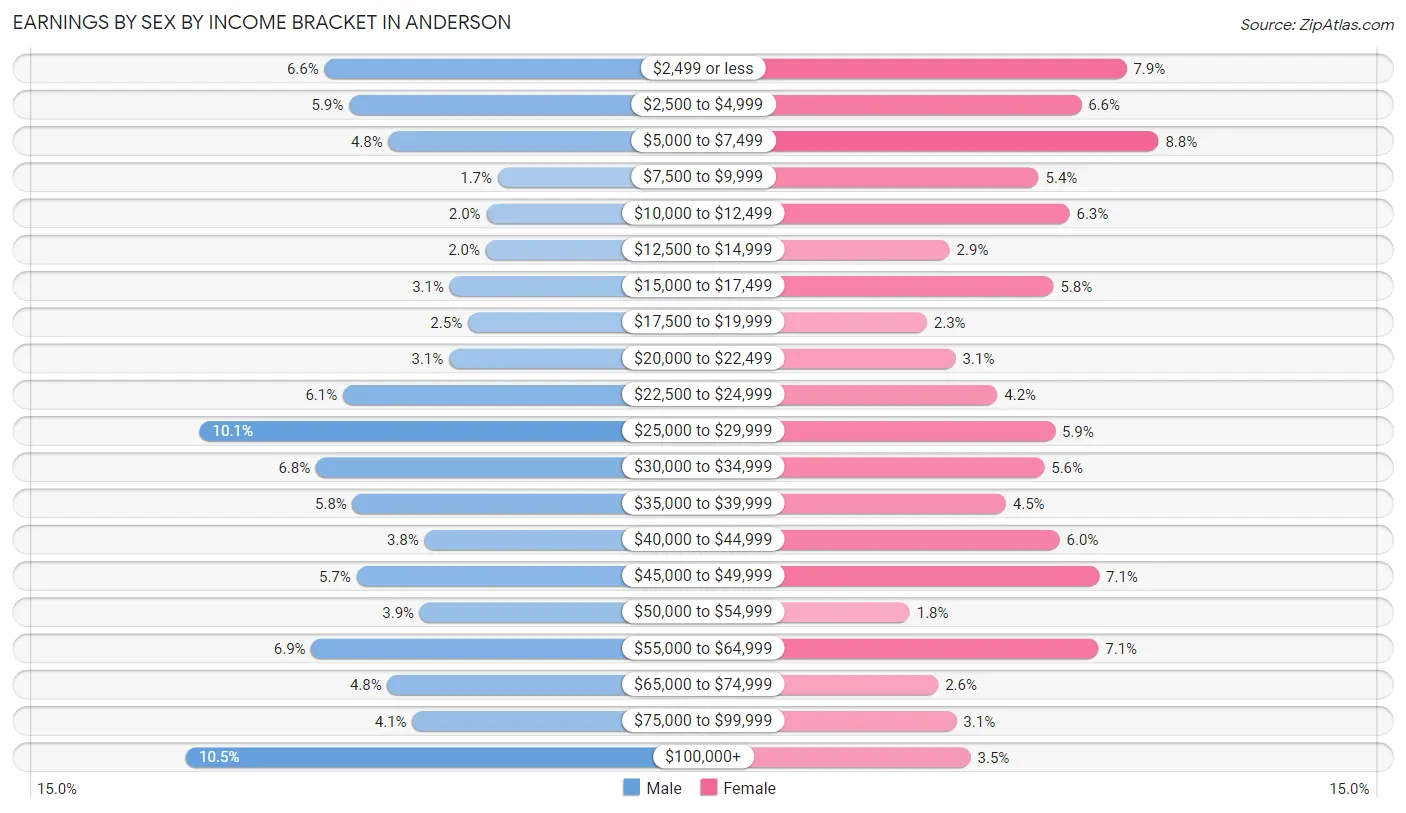
Earnings by Sex by Income Bracket in Anderson
The most common earnings brackets in Anderson are $100,000+ for men (745 | 10.5%) and $5,000 to $7,499 for women (649 | 8.8%).
| Income | Male | Female |
| $2,499 or less | 468 (6.6%) | 582 (7.9%) |
| $2,500 to $4,999 | 419 (5.9%) | 488 (6.6%) |
| $5,000 to $7,499 | 340 (4.8%) | 649 (8.8%) |
| $7,500 to $9,999 | 121 (1.7%) | 399 (5.4%) |
| $10,000 to $12,499 | 144 (2.0%) | 464 (6.3%) |
| $12,500 to $14,999 | 145 (2.0%) | 214 (2.9%) |
| $15,000 to $17,499 | 217 (3.0%) | 430 (5.8%) |
| $17,500 to $19,999 | 181 (2.5%) | 167 (2.2%) |
| $20,000 to $22,499 | 219 (3.1%) | 227 (3.1%) |
| $22,500 to $24,999 | 431 (6.0%) | 313 (4.2%) |
| $25,000 to $29,999 | 718 (10.1%) | 433 (5.9%) |
| $30,000 to $34,999 | 485 (6.8%) | 411 (5.6%) |
| $35,000 to $39,999 | 412 (5.8%) | 331 (4.5%) |
| $40,000 to $44,999 | 268 (3.8%) | 443 (6.0%) |
| $45,000 to $49,999 | 404 (5.7%) | 525 (7.1%) |
| $50,000 to $54,999 | 277 (3.9%) | 131 (1.8%) |
| $55,000 to $64,999 | 494 (6.9%) | 524 (7.1%) |
| $65,000 to $74,999 | 342 (4.8%) | 190 (2.6%) |
| $75,000 to $99,999 | 292 (4.1%) | 228 (3.1%) |
| $100,000+ | 745 (10.5%) | 258 (3.5%) |
| Total | 7,122 (100.0%) | 7,407 (100.0%) |
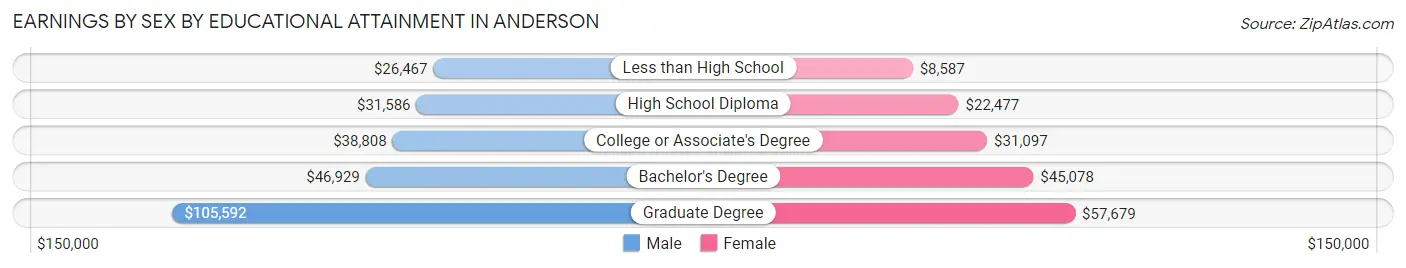
Earnings by Sex by Educational Attainment in Anderson
Average earnings in Anderson are $38,793 for men and $32,534 for women, a difference of 16.1%. Men with an educational attainment of graduate degree enjoy the highest average annual earnings of $105,592, while those with less than high school education earn the least with $26,467. Women with an educational attainment of graduate degree earn the most with the average annual earnings of $57,679, while those with less than high school education have the smallest earnings of $8,587.
| Educational Attainment | Male Income | Female Income |
| Less than High School | $26,467 | $8,587 |
| High School Diploma | $31,586 | $22,477 |
| College or Associate's Degree | $38,808 | $31,097 |
| Bachelor's Degree | $46,929 | $45,078 |
| Graduate Degree | $105,592 | $57,679 |
| Total | $38,793 | $32,534 |
Family Income in Anderson
Family Income Brackets in Anderson
According to the Anderson family income data, there are 1,092 families falling into the $35,000 to $49,999 income range, which is the most common income bracket and makes up 16.4% of all families. Conversely, the $10,000 to $14,999 income bracket is the least frequent group with only 206 families (3.1%) belonging to this category.
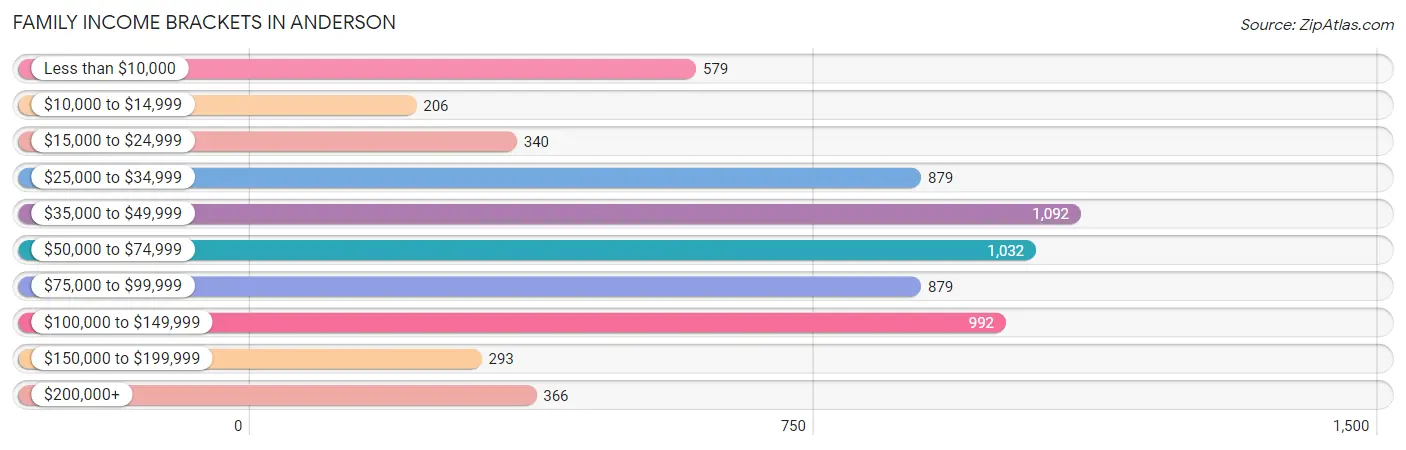
| Income Bracket | # Families | % Families |
| Less than $10,000 | 579 | 8.7% |
| $10,000 to $14,999 | 206 | 3.1% |
| $15,000 to $24,999 | 340 | 5.1% |
| $25,000 to $34,999 | 879 | 13.2% |
| $35,000 to $49,999 | 1,092 | 16.4% |
| $50,000 to $74,999 | 1,032 | 15.5% |
| $75,000 to $99,999 | 879 | 13.2% |
| $100,000 to $149,999 | 992 | 14.9% |
| $150,000 to $199,999 | 293 | 4.4% |
| $200,000+ | 366 | 5.5% |
Family Income by Famaliy Size in Anderson
7+ person families (106 | 1.6%) account for the highest median family income in Anderson with $81,136 per family, while 2-person families (3,428 | 51.5%) have the highest median income of $28,254 per family member.
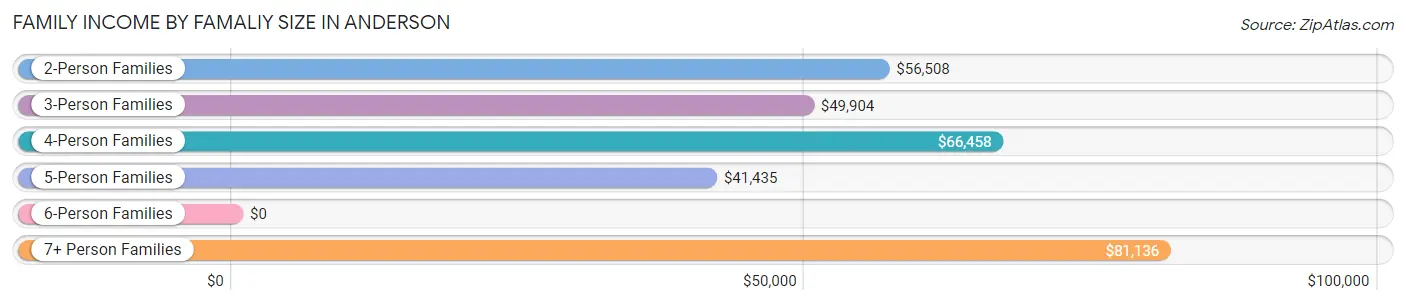
| Income Bracket | # Families | Median Income |
| 2-Person Families | 3,428 (51.5%) | $56,508 |
| 3-Person Families | 1,539 (23.1%) | $49,904 |
| 4-Person Families | 961 (14.4%) | $66,458 |
| 5-Person Families | 515 (7.7%) | $41,435 |
| 6-Person Families | 108 (1.6%) | $0 |
| 7+ Person Families | 106 (1.6%) | $81,136 |
| Total | 6,657 (100.0%) | $55,686 |
Family Income by Number of Earners in Anderson
The median family income in Anderson is $55,686, with families comprising 3+ earners (443) having the highest median family income of $101,573, while families with no earners (1,073) have the lowest median family income of $35,074, accounting for 6.7% and 16.1% of families, respectively.
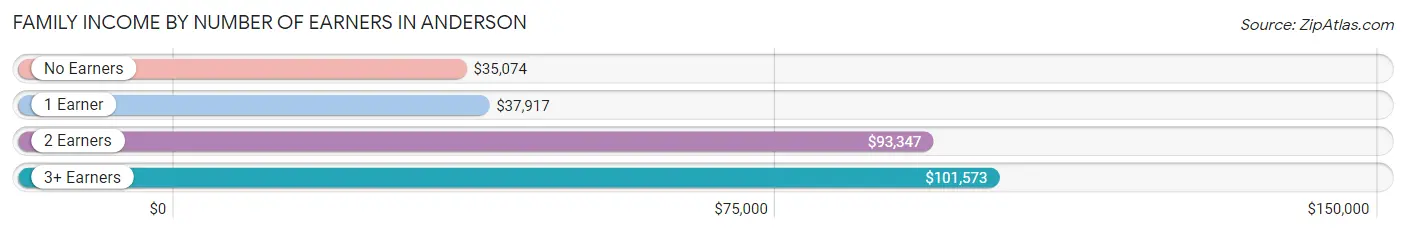
| Number of Earners | # Families | Median Income |
| No Earners | 1,073 (16.1%) | $35,074 |
| 1 Earner | 2,937 (44.1%) | $37,917 |
| 2 Earners | 2,204 (33.1%) | $93,347 |
| 3+ Earners | 443 (6.7%) | $101,573 |
| Total | 6,657 (100.0%) | $55,686 |
Household Income in Anderson
Household Income Brackets in Anderson
With 1,885 households falling in the category, the $50,000 to $74,999 income range is the most frequent in Anderson, accounting for 15.7% of all households. In contrast, only 336 households (2.8%) fall into the $150,000 to $199,999 income bracket, making it the least populous group.
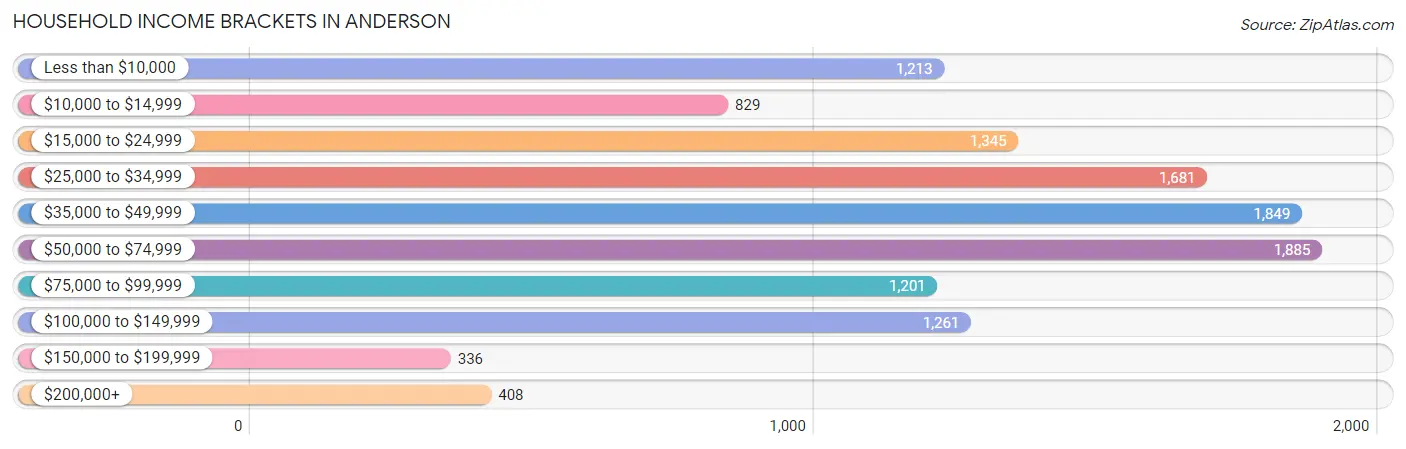
| Income Bracket | # Households | % Households |
| Less than $10,000 | 1,213 | 10.1% |
| $10,000 to $14,999 | 829 | 6.9% |
| $15,000 to $24,999 | 1,345 | 11.2% |
| $25,000 to $34,999 | 1,681 | 14.0% |
| $35,000 to $49,999 | 1,849 | 15.4% |
| $50,000 to $74,999 | 1,885 | 15.7% |
| $75,000 to $99,999 | 1,201 | 10.0% |
| $100,000 to $149,999 | 1,261 | 10.5% |
| $150,000 to $199,999 | 336 | 2.8% |
| $200,000+ | 408 | 3.4% |
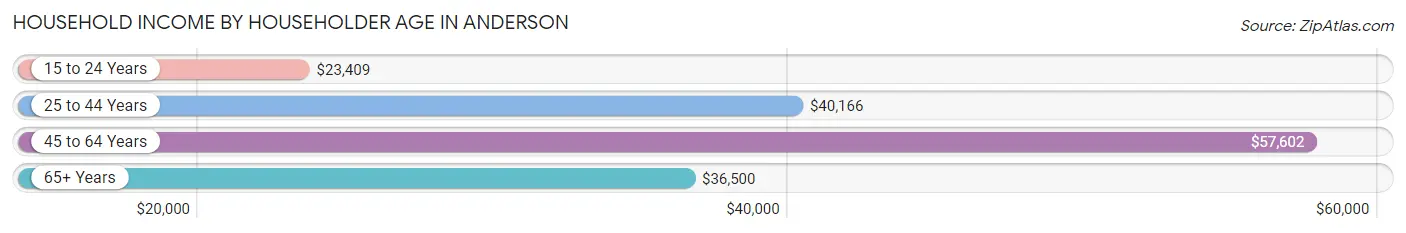
Household Income by Householder Age in Anderson
The median household income in Anderson is $40,445, with the highest median household income of $57,602 found in the 45 to 64 years age bracket for the primary householder. A total of 3,725 households (31.0%) fall into this category. Meanwhile, the 15 to 24 years age bracket for the primary householder has the lowest median household income of $23,409, with 842 households (7.0%) in this group.
| Income Bracket | # Households | Median Income |
| 15 to 24 Years | 842 (7.0%) | $23,409 |
| 25 to 44 Years | 4,289 (35.7%) | $40,166 |
| 45 to 64 Years | 3,725 (31.0%) | $57,602 |
| 65+ Years | 3,152 (26.3%) | $36,500 |
| Total | 12,008 (100.0%) | $40,445 |
Poverty in Anderson
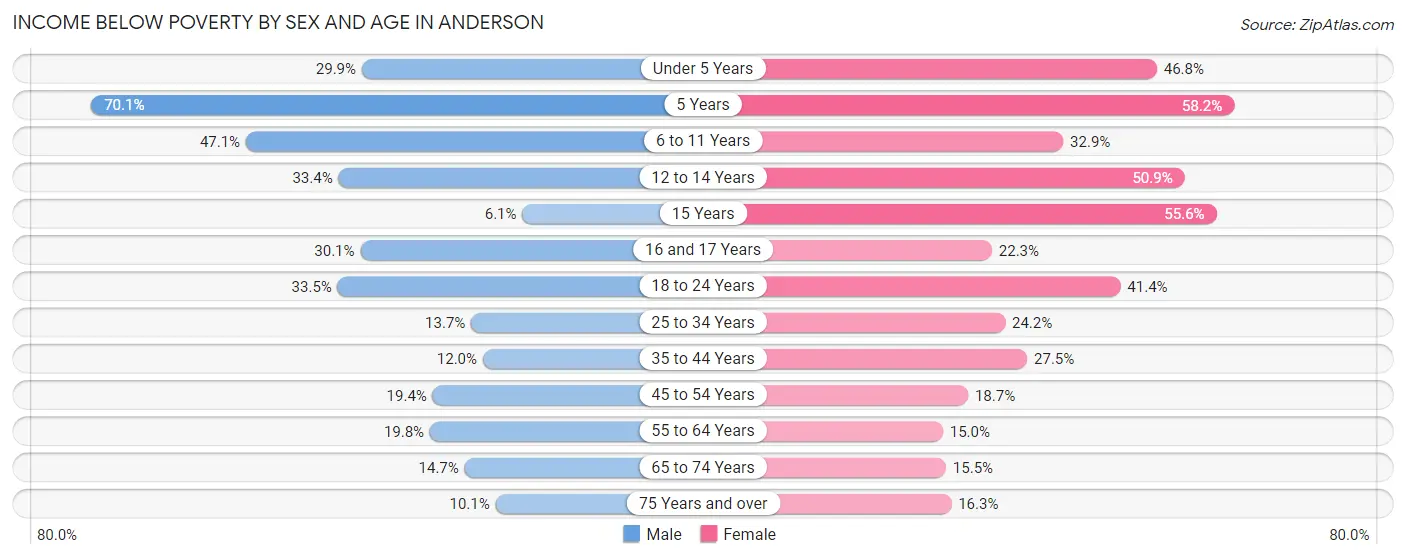
Income Below Poverty by Sex and Age in Anderson
With 23.0% poverty level for males and 27.0% for females among the residents of Anderson, 5 year old males and 5 year old females are the most vulnerable to poverty, with 68 males (70.1%) and 99 females (58.2%) in their respective age groups living below the poverty level.
| Age Bracket | Male | Female |
| Under 5 Years | 321 (29.9%) | 384 (46.8%) |
| 5 Years | 68 (70.1%) | 99 (58.2%) |
| 6 to 11 Years | 583 (47.1%) | 451 (32.9%) |
| 12 to 14 Years | 196 (33.4%) | 231 (50.9%) |
| 15 Years | 12 (6.1%) | 99 (55.6%) |
| 16 and 17 Years | 88 (30.1%) | 80 (22.3%) |
| 18 to 24 Years | 389 (33.5%) | 719 (41.4%) |
| 25 to 34 Years | 297 (13.7%) | 573 (24.2%) |
| 35 to 44 Years | 132 (11.9%) | 387 (27.5%) |
| 45 to 54 Years | 321 (19.4%) | 227 (18.7%) |
| 55 to 64 Years | 278 (19.8%) | 287 (15.0%) |
| 65 to 74 Years | 156 (14.7%) | 202 (15.5%) |
| 75 Years and over | 58 (10.1%) | 238 (16.3%) |
| Total | 2,899 (23.0%) | 3,977 (27.0%) |
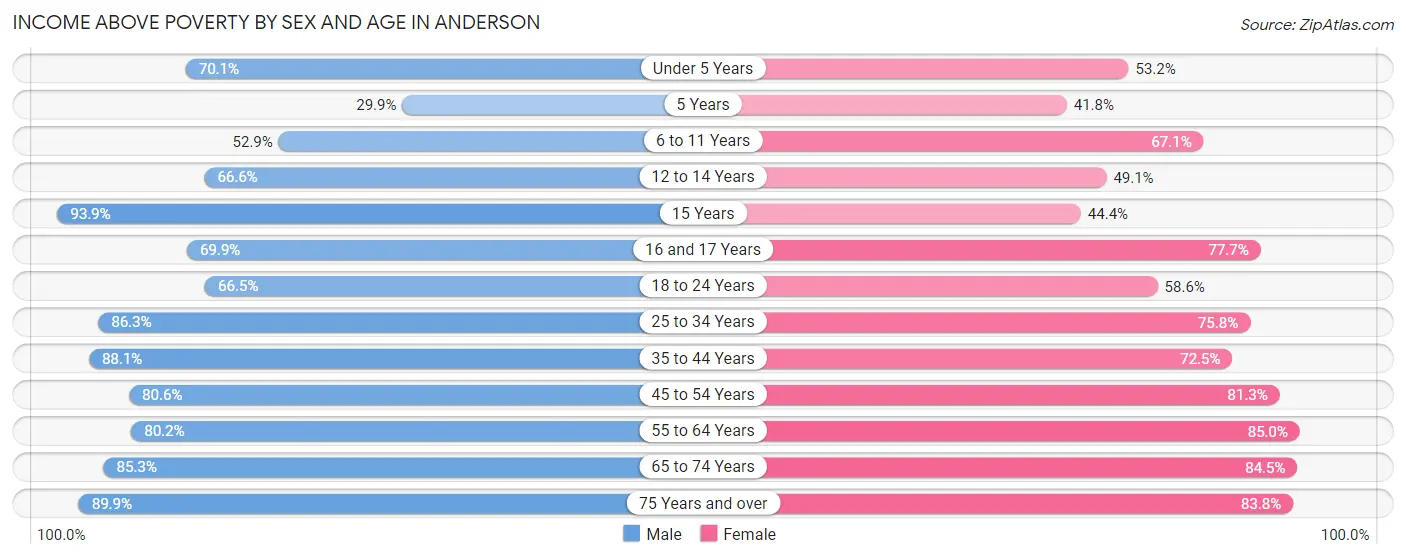
Income Above Poverty by Sex and Age in Anderson
According to the poverty statistics in Anderson, males aged 15 years and females aged 55 to 64 years are the age groups that are most secure financially, with 93.9% of males and 85.0% of females in these age groups living above the poverty line.
| Age Bracket | Male | Female |
| Under 5 Years | 752 (70.1%) | 437 (53.2%) |
| 5 Years | 29 (29.9%) | 71 (41.8%) |
| 6 to 11 Years | 654 (52.9%) | 921 (67.1%) |
| 12 to 14 Years | 391 (66.6%) | 223 (49.1%) |
| 15 Years | 185 (93.9%) | 79 (44.4%) |
| 16 and 17 Years | 204 (69.9%) | 279 (77.7%) |
| 18 to 24 Years | 772 (66.5%) | 1,019 (58.6%) |
| 25 to 34 Years | 1,873 (86.3%) | 1,791 (75.8%) |
| 35 to 44 Years | 973 (88.0%) | 1,019 (72.5%) |
| 45 to 54 Years | 1,333 (80.6%) | 984 (81.3%) |
| 55 to 64 Years | 1,125 (80.2%) | 1,626 (85.0%) |
| 65 to 74 Years | 908 (85.3%) | 1,105 (84.5%) |
| 75 Years and over | 518 (89.9%) | 1,227 (83.8%) |
| Total | 9,717 (77.0%) | 10,781 (73.1%) |
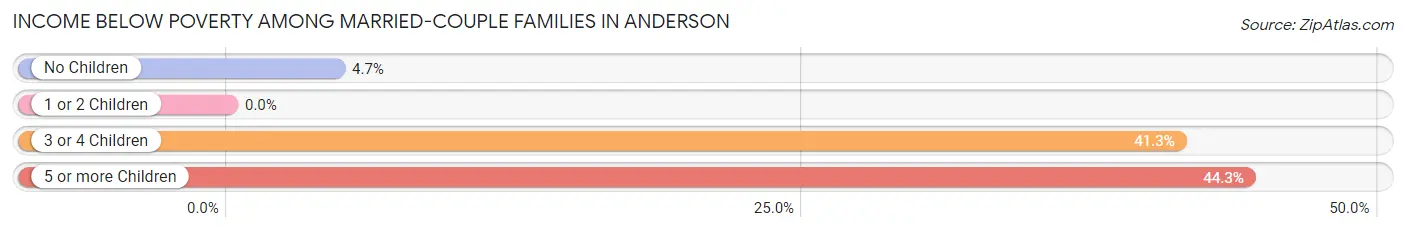
Income Below Poverty Among Married-Couple Families in Anderson
The poverty statistics for married-couple families in Anderson show that 6.9% or 268 of the total 3,868 families live below the poverty line. Families with 5 or more children have the highest poverty rate of 44.3%, comprising of 31 families. On the other hand, families with 1 or 2 children have the lowest poverty rate of 0.0%, which includes 0 families.
| Children | Above Poverty | Below Poverty |
| No Children | 2,332 (95.3%) | 114 (4.7%) |
| 1 or 2 Children | 1,054 (100.0%) | 0 (0.0%) |
| 3 or 4 Children | 175 (58.7%) | 123 (41.3%) |
| 5 or more Children | 39 (55.7%) | 31 (44.3%) |
| Total | 3,600 (93.1%) | 268 (6.9%) |
Income Below Poverty Among Single-Parent Households in Anderson
According to the poverty data in Anderson, 22.4% or 173 single-father households and 35.5% or 716 single-mother households are living below the poverty line. Among single-father households, those with 3 or 4 children have the highest poverty rate, with 109 households (100.0%) experiencing poverty. Likewise, among single-mother households, those with 5 or more children have the highest poverty rate, with 41 households (100.0%) falling below the poverty line.
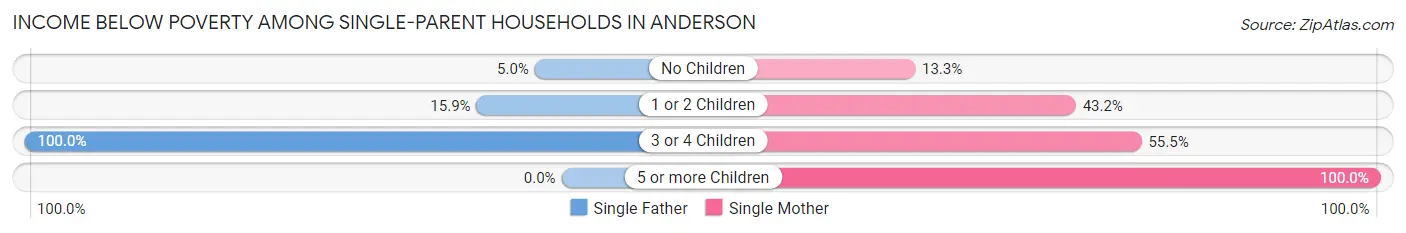
| Children | Single Father | Single Mother |
| No Children | 19 (5.0%) | 93 (13.3%) |
| 1 or 2 Children | 45 (15.9%) | 440 (43.2%) |
| 3 or 4 Children | 109 (100.0%) | 142 (55.5%) |
| 5 or more Children | 0 (0.0%) | 41 (100.0%) |
| Total | 173 (22.4%) | 716 (35.5%) |
Income Below Poverty Among Married-Couple vs Single-Parent Households in Anderson
The poverty data for Anderson shows that 268 of the married-couple family households (6.9%) and 889 of the single-parent households (31.9%) are living below the poverty level. Within the married-couple family households, those with 5 or more children have the highest poverty rate, with 31 households (44.3%) falling below the poverty line. Among the single-parent households, those with 5 or more children have the highest poverty rate, with 41 household (100.0%) living below poverty.
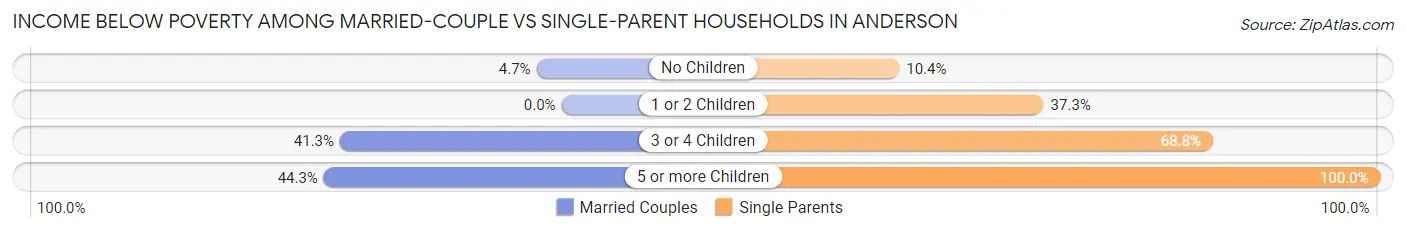
| Children | Married-Couple Families | Single-Parent Households |
| No Children | 114 (4.7%) | 112 (10.4%) |
| 1 or 2 Children | 0 (0.0%) | 485 (37.2%) |
| 3 or 4 Children | 123 (41.3%) | 251 (68.8%) |
| 5 or more Children | 31 (44.3%) | 41 (100.0%) |
| Total | 268 (6.9%) | 889 (31.9%) |
Race in Anderson
The most populous races in Anderson are White / Caucasian (18,405 | 62.7%), Black / African American (8,452 | 28.8%), and Two or more Races (1,464 | 5.0%).
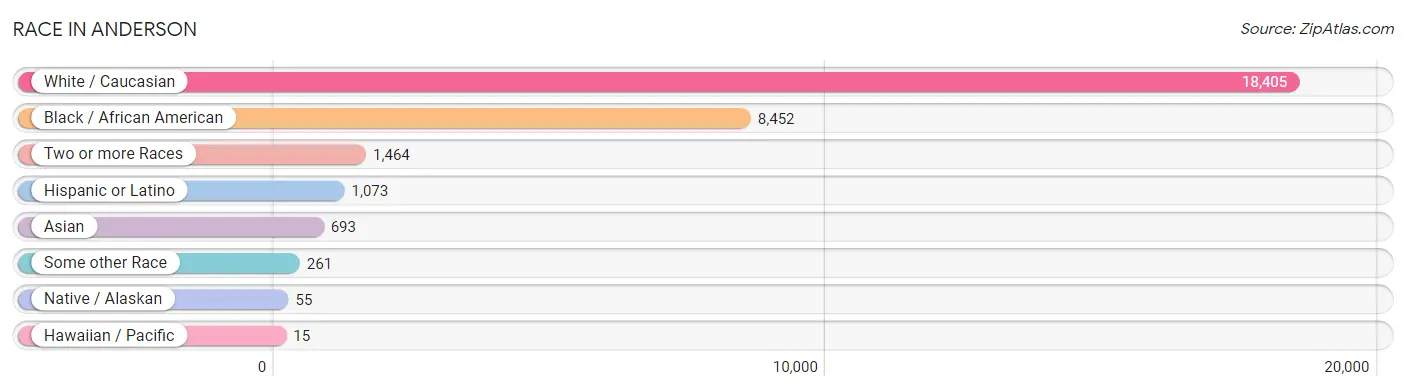
| Race | # Population | % Population |
| Asian | 693 | 2.4% |
| Black / African American | 8,452 | 28.8% |
| Hawaiian / Pacific | 15 | 0.1% |
| Hispanic or Latino | 1,073 | 3.7% |
| Native / Alaskan | 55 | 0.2% |
| White / Caucasian | 18,405 | 62.7% |
| Two or more Races | 1,464 | 5.0% |
| Some other Race | 261 | 0.9% |
| Total | 29,345 | 100.0% |
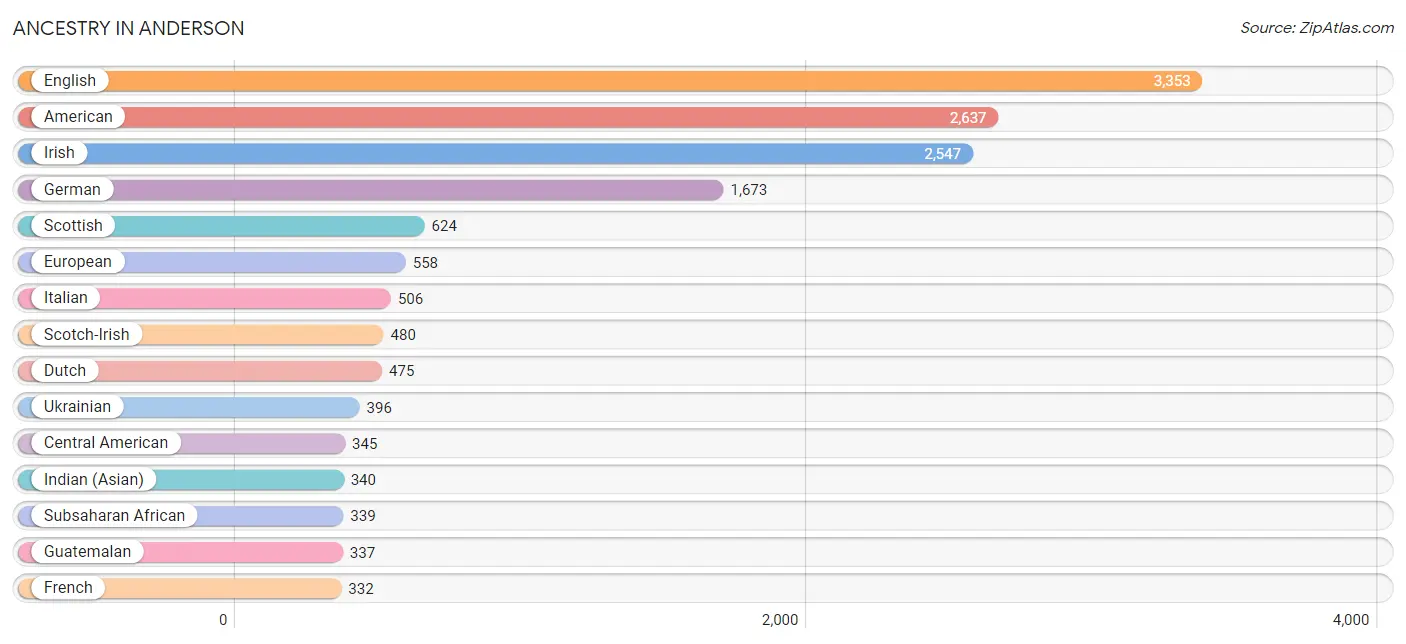
Ancestry in Anderson
The most populous ancestries reported in Anderson are English (3,353 | 11.4%), American (2,637 | 9.0%), Irish (2,547 | 8.7%), German (1,673 | 5.7%), and Scottish (624 | 2.1%), together accounting for 36.9% of all Anderson residents.
| Ancestry | # Population | % Population |
| African | 313 | 1.1% |
| Alaskan Athabascan | 4 | 0.0% |
| American | 2,637 | 9.0% |
| Arab | 183 | 0.6% |
| Armenian | 8 | 0.0% |
| Australian | 36 | 0.1% |
| Austrian | 62 | 0.2% |
| Belizean | 4 | 0.0% |
| Blackfeet | 9 | 0.0% |
| Brazilian | 42 | 0.1% |
| British | 136 | 0.5% |
| Burmese | 33 | 0.1% |
| Canadian | 11 | 0.0% |
| Central American | 345 | 1.2% |
| Central American Indian | 89 | 0.3% |
| Cherokee | 317 | 1.1% |
| Colombian | 21 | 0.1% |
| Croatian | 11 | 0.0% |
| Cuban | 114 | 0.4% |
| Czech | 64 | 0.2% |
| Dominican | 29 | 0.1% |
| Dutch | 475 | 1.6% |
| Dutch West Indian | 20 | 0.1% |
| Eastern European | 22 | 0.1% |
| Ecuadorian | 29 | 0.1% |
| Egyptian | 23 | 0.1% |
| English | 3,353 | 11.4% |
| Ethiopian | 67 | 0.2% |
| European | 558 | 1.9% |
| French | 332 | 1.1% |
| French American Indian | 13 | 0.0% |
| French Canadian | 62 | 0.2% |
| German | 1,673 | 5.7% |
| Greek | 17 | 0.1% |
| Guatemalan | 337 | 1.1% |
| Haitian | 62 | 0.2% |
| Honduran | 4 | 0.0% |
| Hungarian | 64 | 0.2% |
| Indian (Asian) | 340 | 1.2% |
| Irish | 2,547 | 8.7% |
| Italian | 506 | 1.7% |
| Jamaican | 13 | 0.0% |
| Korean | 143 | 0.5% |
| Lebanese | 140 | 0.5% |
| Lithuanian | 29 | 0.1% |
| Macedonian | 23 | 0.1% |
| Malaysian | 9 | 0.0% |
| Mexican | 259 | 0.9% |
| Native Hawaiian | 9 | 0.0% |
| Nigerian | 26 | 0.1% |
| Northern European | 31 | 0.1% |
| Norwegian | 84 | 0.3% |
| Polish | 216 | 0.7% |
| Portuguese | 105 | 0.4% |
| Puerto Rican | 144 | 0.5% |
| Romanian | 55 | 0.2% |
| Russian | 107 | 0.4% |
| Salvadoran | 4 | 0.0% |
| Scandinavian | 127 | 0.4% |
| Scotch-Irish | 480 | 1.6% |
| Scottish | 624 | 2.1% |
| Serbian | 20 | 0.1% |
| Slavic | 8 | 0.0% |
| Slovak | 53 | 0.2% |
| South American | 109 | 0.4% |
| Spaniard | 62 | 0.2% |
| Sri Lankan | 80 | 0.3% |
| Subsaharan African | 339 | 1.2% |
| Swedish | 195 | 0.7% |
| Syrian | 20 | 0.1% |
| Thai | 103 | 0.4% |
| Trinidadian and Tobagonian | 14 | 0.1% |
| Ukrainian | 396 | 1.3% |
| Venezuelan | 59 | 0.2% |
| Welsh | 44 | 0.2% | View All 75 Rows |
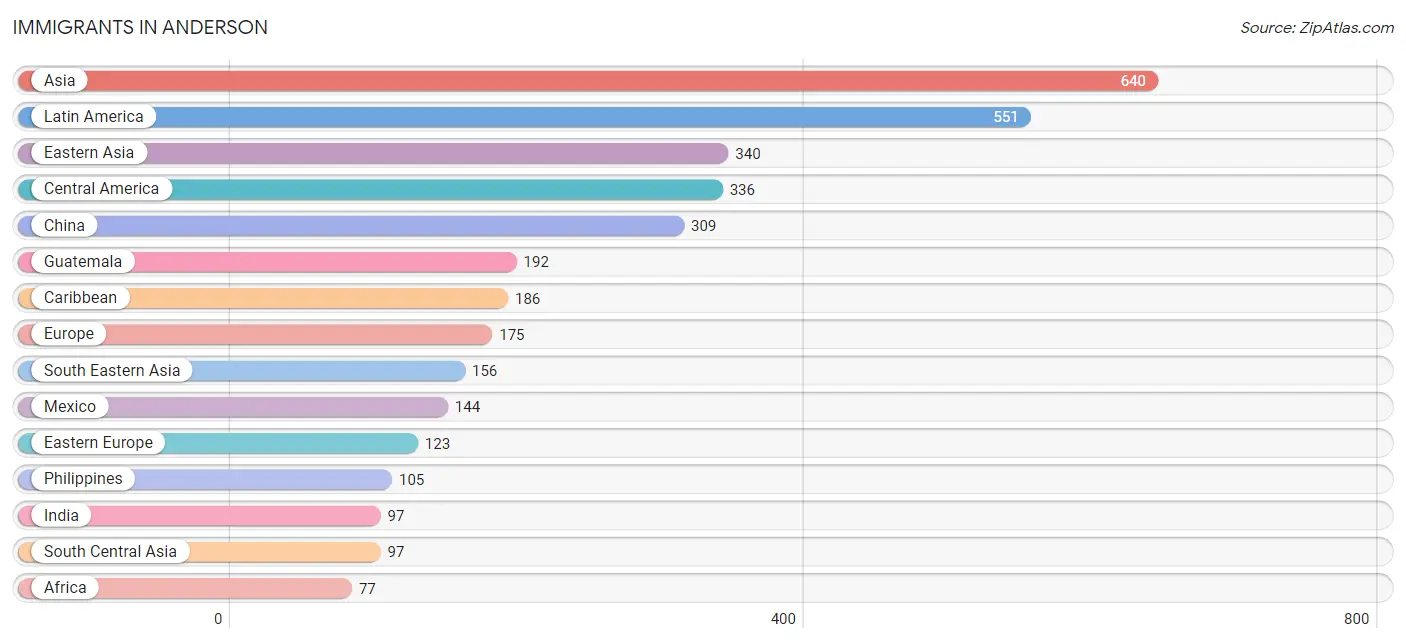
Immigrants in Anderson
The most numerous immigrant groups reported in Anderson came from Asia (640 | 2.2%), Latin America (551 | 1.9%), Eastern Asia (340 | 1.2%), Central America (336 | 1.1%), and China (309 | 1.1%), together accounting for 7.4% of all Anderson residents.
| Immigration Origin | # Population | % Population |
| Africa | 77 | 0.3% |
| Asia | 640 | 2.2% |
| Australia | 47 | 0.2% |
| Canada | 11 | 0.0% |
| Caribbean | 186 | 0.6% |
| Central America | 336 | 1.1% |
| China | 309 | 1.1% |
| Cuba | 48 | 0.2% |
| Czechoslovakia | 11 | 0.0% |
| Dominican Republic | 25 | 0.1% |
| Eastern Asia | 340 | 1.2% |
| Eastern Europe | 123 | 0.4% |
| Ecuador | 29 | 0.1% |
| Egypt | 40 | 0.1% |
| England | 25 | 0.1% |
| Europe | 175 | 0.6% |
| Guatemala | 192 | 0.6% |
| Haiti | 39 | 0.1% |
| Hong Kong | 73 | 0.3% |
| India | 97 | 0.3% |
| Ireland | 21 | 0.1% |
| Jamaica | 7 | 0.0% |
| Japan | 15 | 0.1% |
| Korea | 16 | 0.1% |
| Latin America | 551 | 1.9% |
| Lebanon | 27 | 0.1% |
| Mexico | 144 | 0.5% |
| Moldova | 11 | 0.0% |
| Netherlands | 6 | 0.0% |
| Northern Africa | 40 | 0.1% |
| Northern Europe | 46 | 0.2% |
| Oceania | 47 | 0.2% |
| Philippines | 105 | 0.4% |
| Russia | 47 | 0.2% |
| South America | 29 | 0.1% |
| South Central Asia | 97 | 0.3% |
| South Eastern Asia | 156 | 0.5% |
| Syria | 20 | 0.1% |
| Trinidad and Tobago | 67 | 0.2% |
| Ukraine | 54 | 0.2% |
| Vietnam | 51 | 0.2% |
| Western Asia | 47 | 0.2% |
| Western Europe | 6 | 0.0% | View All 43 Rows |
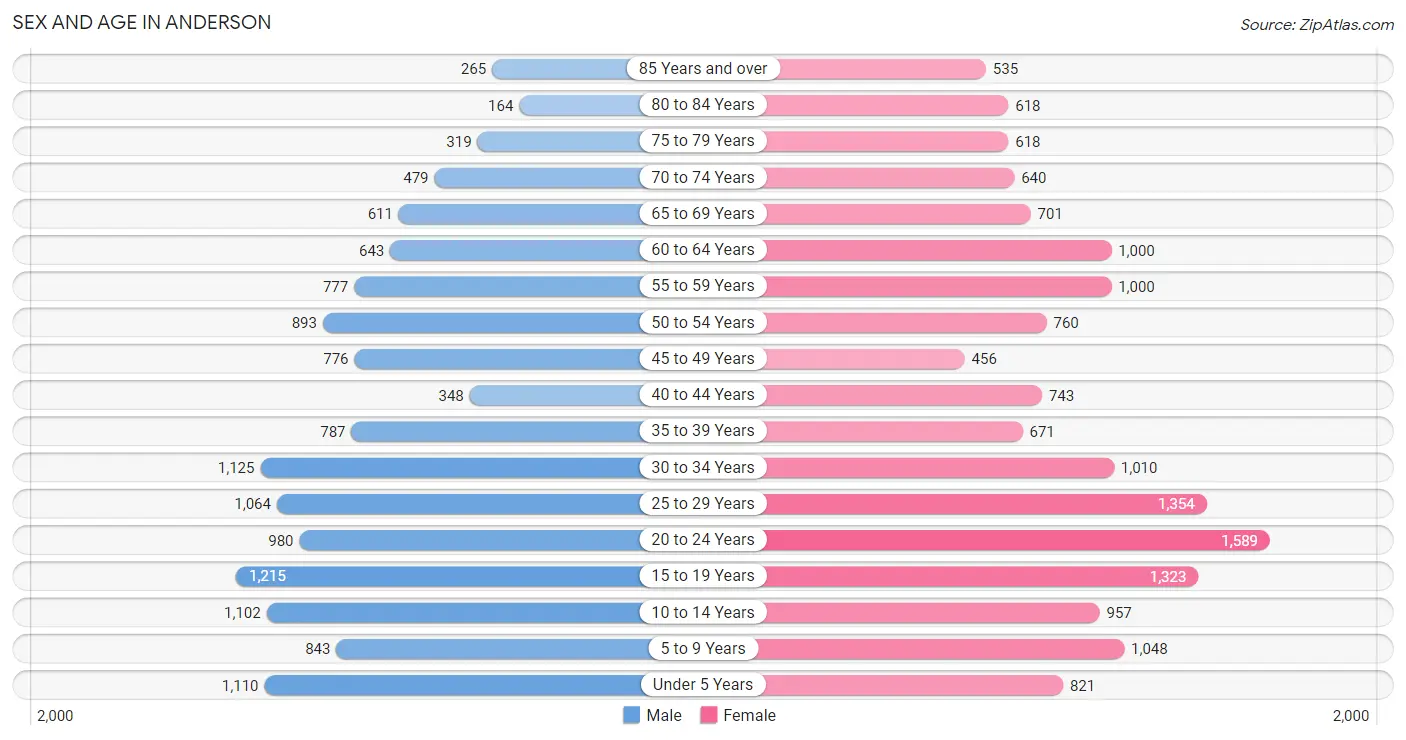
Sex and Age in Anderson
Sex and Age in Anderson
The most populous age groups in Anderson are 15 to 19 Years (1,215 | 9.0%) for men and 20 to 24 Years (1,589 | 10.0%) for women.
| Age Bracket | Male | Female |
| Under 5 Years | 1,110 (8.2%) | 821 (5.2%) |
| 5 to 9 Years | 843 (6.2%) | 1,048 (6.6%) |
| 10 to 14 Years | 1,102 (8.2%) | 957 (6.0%) |
| 15 to 19 Years | 1,215 (9.0%) | 1,323 (8.4%) |
| 20 to 24 Years | 980 (7.3%) | 1,589 (10.0%) |
| 25 to 29 Years | 1,064 (7.9%) | 1,354 (8.6%) |
| 30 to 34 Years | 1,125 (8.3%) | 1,010 (6.4%) |
| 35 to 39 Years | 787 (5.8%) | 671 (4.2%) |
| 40 to 44 Years | 348 (2.6%) | 743 (4.7%) |
| 45 to 49 Years | 776 (5.8%) | 456 (2.9%) |
| 50 to 54 Years | 893 (6.6%) | 760 (4.8%) |
| 55 to 59 Years | 777 (5.8%) | 1,000 (6.3%) |
| 60 to 64 Years | 643 (4.8%) | 1,000 (6.3%) |
| 65 to 69 Years | 611 (4.5%) | 701 (4.4%) |
| 70 to 74 Years | 479 (3.5%) | 640 (4.0%) |
| 75 to 79 Years | 319 (2.4%) | 618 (3.9%) |
| 80 to 84 Years | 164 (1.2%) | 618 (3.9%) |
| 85 Years and over | 265 (2.0%) | 535 (3.4%) |
| Total | 13,501 (100.0%) | 15,844 (100.0%) |
Families and Households in Anderson
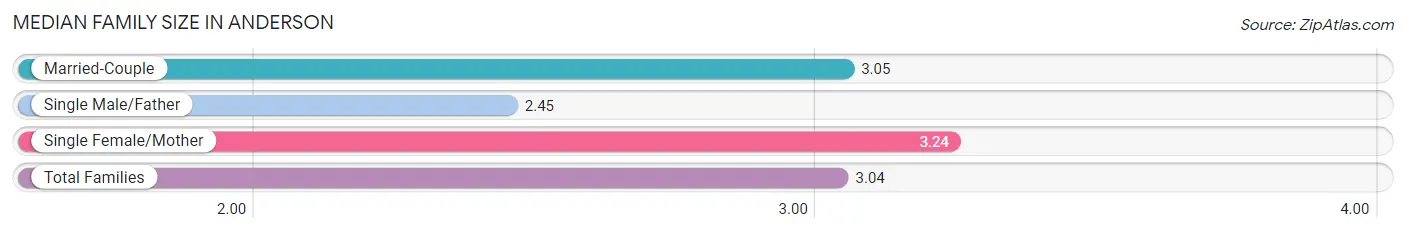
Median Family Size in Anderson
The median family size in Anderson is 3.04 persons per family, with single female/mother families (2,015 | 30.3%) accounting for the largest median family size of 3.24 persons per family. On the other hand, single male/father families (774 | 11.6%) represent the smallest median family size with 2.45 persons per family.
| Family Type | # Families | Family Size |
| Married-Couple | 3,868 (58.1%) | 3.05 |
| Single Male/Father | 774 (11.6%) | 2.45 |
| Single Female/Mother | 2,015 (30.3%) | 3.24 |
| Total Families | 6,657 (100.0%) | 3.04 |
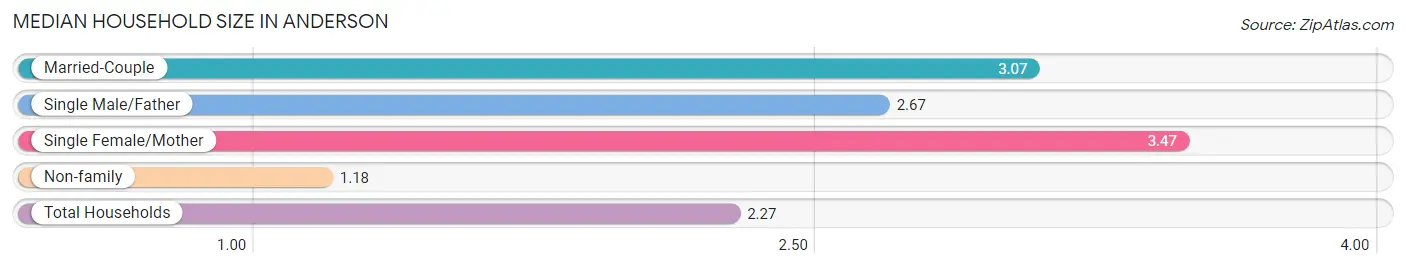
Median Household Size in Anderson
The median household size in Anderson is 2.27 persons per household, with single female/mother households (2,015 | 16.8%) accounting for the largest median household size of 3.47 persons per household. non-family households (5,351 | 44.6%) represent the smallest median household size with 1.18 persons per household.
| Household Type | # Households | Household Size |
| Married-Couple | 3,868 (32.2%) | 3.07 |
| Single Male/Father | 774 (6.5%) | 2.67 |
| Single Female/Mother | 2,015 (16.8%) | 3.47 |
| Non-family | 5,351 (44.6%) | 1.18 |
| Total Households | 12,008 (100.0%) | 2.27 |
Household Size by Marriage Status in Anderson
Out of a total of 12,008 households in Anderson, 6,657 (55.4%) are family households, while 5,351 (44.6%) are nonfamily households. The most numerous type of family households are 2-person households, comprising 3,211, and the most common type of nonfamily households are 1-person households, comprising 4,633.
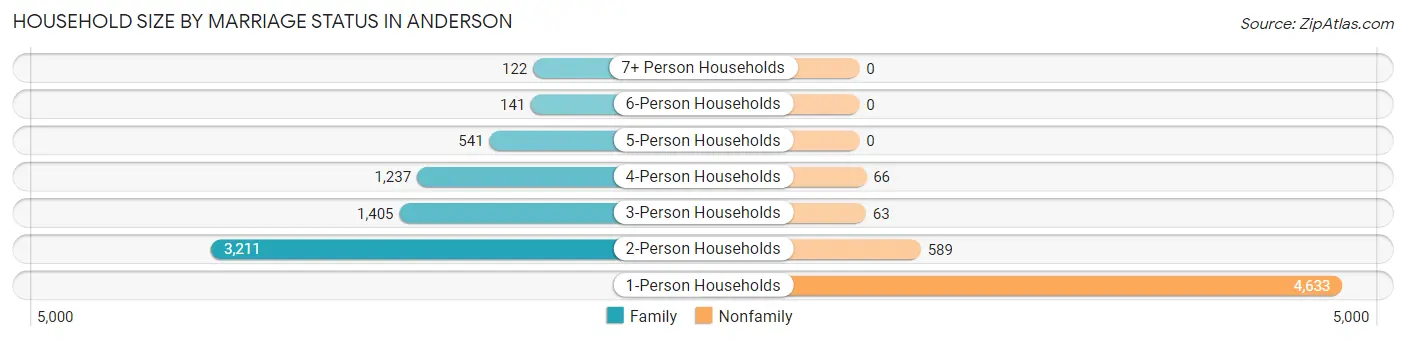
| Household Size | Family Households | Nonfamily Households |
| 1-Person Households | - | 4,633 (38.6%) |
| 2-Person Households | 3,211 (26.7%) | 589 (4.9%) |
| 3-Person Households | 1,405 (11.7%) | 63 (0.5%) |
| 4-Person Households | 1,237 (10.3%) | 66 (0.5%) |
| 5-Person Households | 541 (4.5%) | 0 (0.0%) |
| 6-Person Households | 141 (1.2%) | 0 (0.0%) |
| 7+ Person Households | 122 (1.0%) | 0 (0.0%) |
| Total | 6,657 (55.4%) | 5,351 (44.6%) |
Female Fertility in Anderson
Fertility by Age in Anderson
Average fertility rate in Anderson is 57.0 births per 1,000 women. Women in the age bracket of 20 to 34 years have the highest fertility rate with 83.0 births per 1,000 women. Women in the age bracket of 20 to 34 years acount for 78.8% of all women with births.
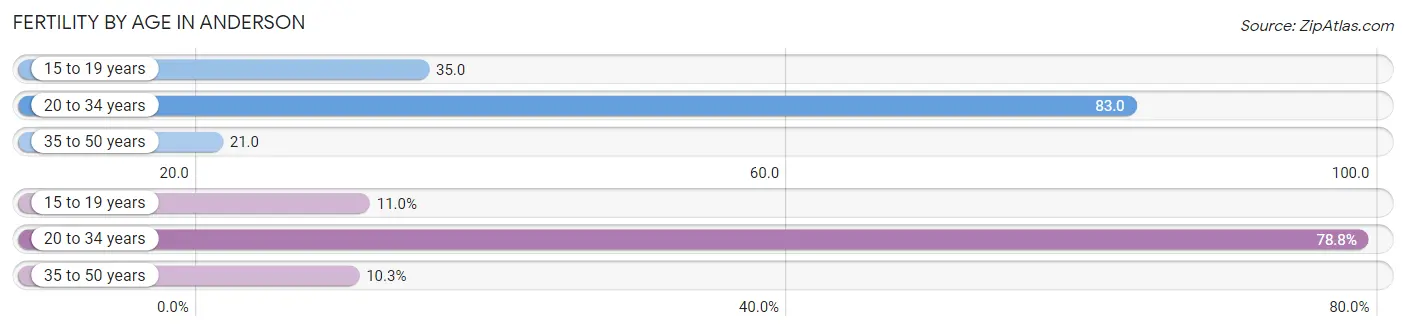
| Age Bracket | Women with Births | Births / 1,000 Women |
| 15 to 19 years | 46 (11.0%) | 35.0 |
| 20 to 34 years | 330 (78.8%) | 83.0 |
| 35 to 50 years | 43 (10.3%) | 21.0 |
| Total | 419 (100.0%) | 57.0 |
Fertility by Age by Marriage Status in Anderson
29.6% of women with births (419) in Anderson are married. The highest percentage of unmarried women with births falls into 15 to 19 years age bracket with 100.0% of them unmarried at the time of birth, while the lowest percentage of unmarried women with births belong to 35 to 50 years age bracket with 65.1% of them unmarried.
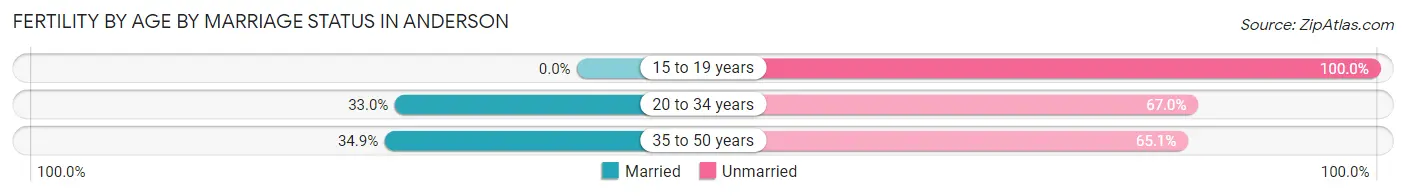
| Age Bracket | Married | Unmarried |
| 15 to 19 years | 0 (0.0%) | 46 (100.0%) |
| 20 to 34 years | 109 (33.0%) | 221 (67.0%) |
| 35 to 50 years | 15 (34.9%) | 28 (65.1%) |
| Total | 124 (29.6%) | 295 (70.4%) |
Fertility by Education in Anderson
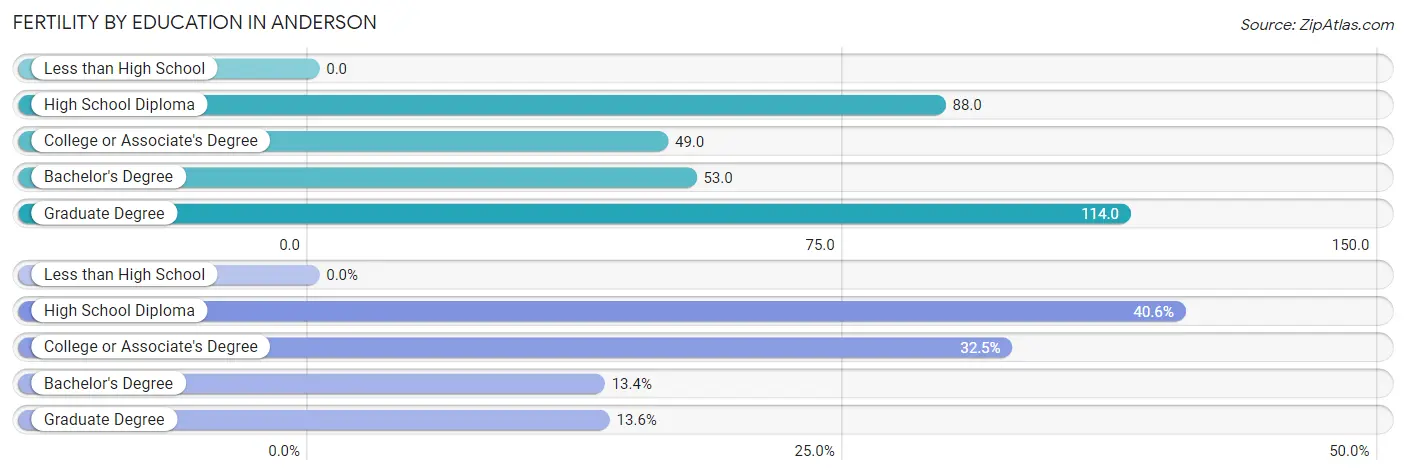
| Educational Attainment | Women with Births | Births / 1,000 Women |
| Less than High School | 0 (0.0%) | 0.0 |
| High School Diploma | 170 (40.6%) | 88.0 |
| College or Associate's Degree | 136 (32.5%) | 49.0 |
| Bachelor's Degree | 56 (13.4%) | 53.0 |
| Graduate Degree | 57 (13.6%) | 114.0 |
| Total | 419 (100.0%) | 57.0 |
Fertility by Education by Marriage Status in Anderson
70.4% of women with births in Anderson are unmarried. Women with the educational attainment of graduate degree are most likely to be married with 100.0% of them married at childbirth, while women with the educational attainment of high school diploma are least likely to be married with 100.0% of them unmarried at childbirth.
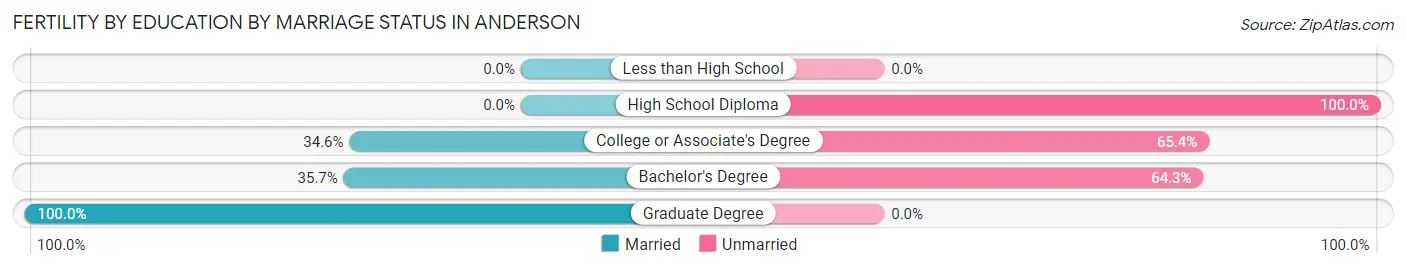
| Educational Attainment | Married | Unmarried |
| Less than High School | 0 (0.0%) | 0 (0.0%) |
| High School Diploma | 0 (0.0%) | 170 (100.0%) |
| College or Associate's Degree | 47 (34.6%) | 89 (65.4%) |
| Bachelor's Degree | 20 (35.7%) | 36 (64.3%) |
| Graduate Degree | 57 (100.0%) | 0 (0.0%) |
| Total | 124 (29.6%) | 295 (70.4%) |
Employment Characteristics in Anderson
Employment by Class of Employer in Anderson
Among the 12,562 employed individuals in Anderson, private company employees (8,681 | 69.1%), not-for-profit organizations (1,202 | 9.6%), and state government employees (763 | 6.1%) make up the most common classes of employment.
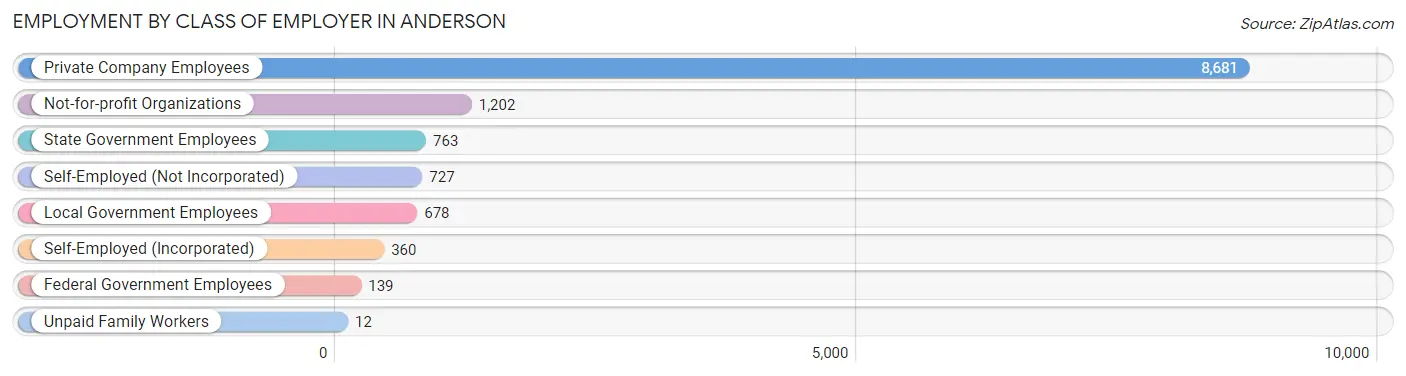
| Employer Class | # Employees | % Employees |
| Private Company Employees | 8,681 | 69.1% |
| Self-Employed (Incorporated) | 360 | 2.9% |
| Self-Employed (Not Incorporated) | 727 | 5.8% |
| Not-for-profit Organizations | 1,202 | 9.6% |
| Local Government Employees | 678 | 5.4% |
| State Government Employees | 763 | 6.1% |
| Federal Government Employees | 139 | 1.1% |
| Unpaid Family Workers | 12 | 0.1% |
| Total | 12,562 | 100.0% |
Employment Status by Age in Anderson
According to the labor force statistics for Anderson, out of the total population over 16 years of age (23,089), 59.8% or 13,807 individuals are in the labor force, with 6.9% or 953 of them unemployed. The age group with the highest labor force participation rate is 25 to 29 years, with 85.4% or 2,065 individuals in the labor force. Within the labor force, the 16 to 19 years age range has the highest percentage of unemployed individuals, with 19.6% or 203 of them being unemployed.
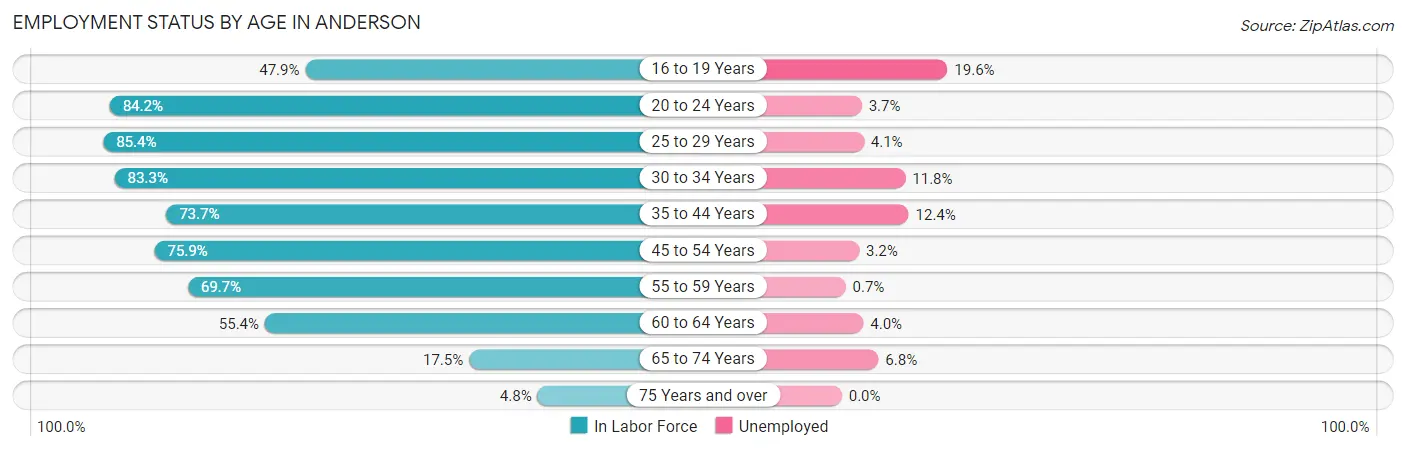
| Age Bracket | In Labor Force | Unemployed |
| 16 to 19 Years | 1,036 (47.9%) | 203 (19.6%) |
| 20 to 24 Years | 2,163 (84.2%) | 80 (3.7%) |
| 25 to 29 Years | 2,065 (85.4%) | 85 (4.1%) |
| 30 to 34 Years | 1,778 (83.3%) | 210 (11.8%) |
| 35 to 44 Years | 1,879 (73.7%) | 233 (12.4%) |
| 45 to 54 Years | 2,190 (75.9%) | 70 (3.2%) |
| 55 to 59 Years | 1,239 (69.7%) | 9 (0.7%) |
| 60 to 64 Years | 910 (55.4%) | 36 (4.0%) |
| 65 to 74 Years | 425 (17.5%) | 29 (6.8%) |
| 75 Years and over | 121 (4.8%) | 0 (0.0%) |
| Total | 13,807 (59.8%) | 953 (6.9%) |
Employment Status by Educational Attainment in Anderson
According to labor force statistics for Anderson, 75.0% of individuals (10,055) out of the total population between 25 and 64 years of age (13,407) are in the labor force, with 6.4% or 644 of them being unemployed. The group with the highest labor force participation rate are those with the educational attainment of bachelor's degree or higher, with 89.6% or 3,235 individuals in the labor force. Within the labor force, individuals with less than high school education have the highest percentage of unemployment, with 21.3% or 168 of them being unemployed.
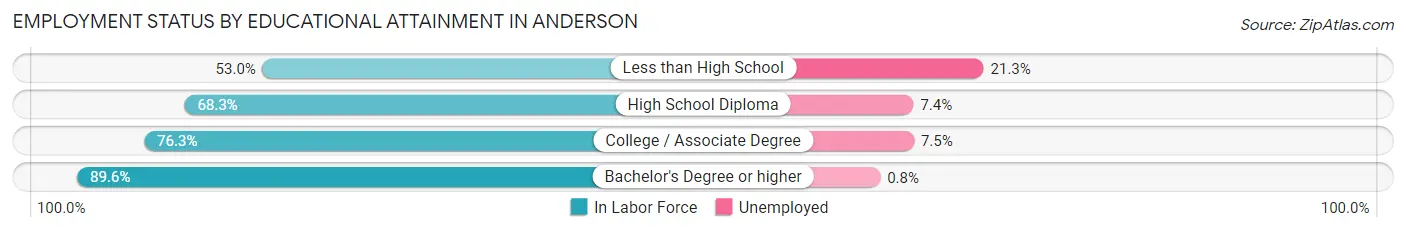
| Educational Attainment | In Labor Force | Unemployed |
| Less than High School | 789 (53.0%) | 317 (21.3%) |
| High School Diploma | 2,610 (68.3%) | 283 (7.4%) |
| College / Associate Degree | 3,423 (76.3%) | 336 (7.5%) |
| Bachelor's Degree or higher | 3,235 (89.6%) | 29 (0.8%) |
| Total | 10,055 (75.0%) | 858 (6.4%) |
Employment Occupations by Sex in Anderson
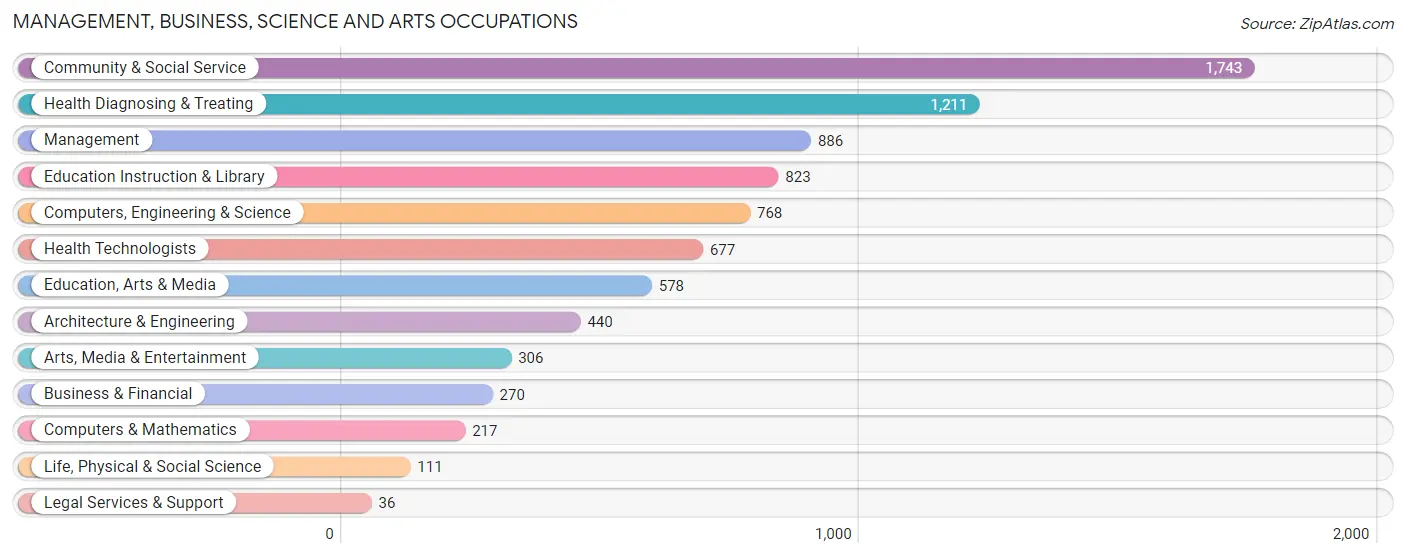
Management, Business, Science and Arts Occupations
The most common Management, Business, Science and Arts occupations in Anderson are Community & Social Service (1,743 | 13.6%), Health Diagnosing & Treating (1,211 | 9.4%), Management (886 | 6.9%), Education Instruction & Library (823 | 6.4%), and Computers, Engineering & Science (768 | 6.0%).
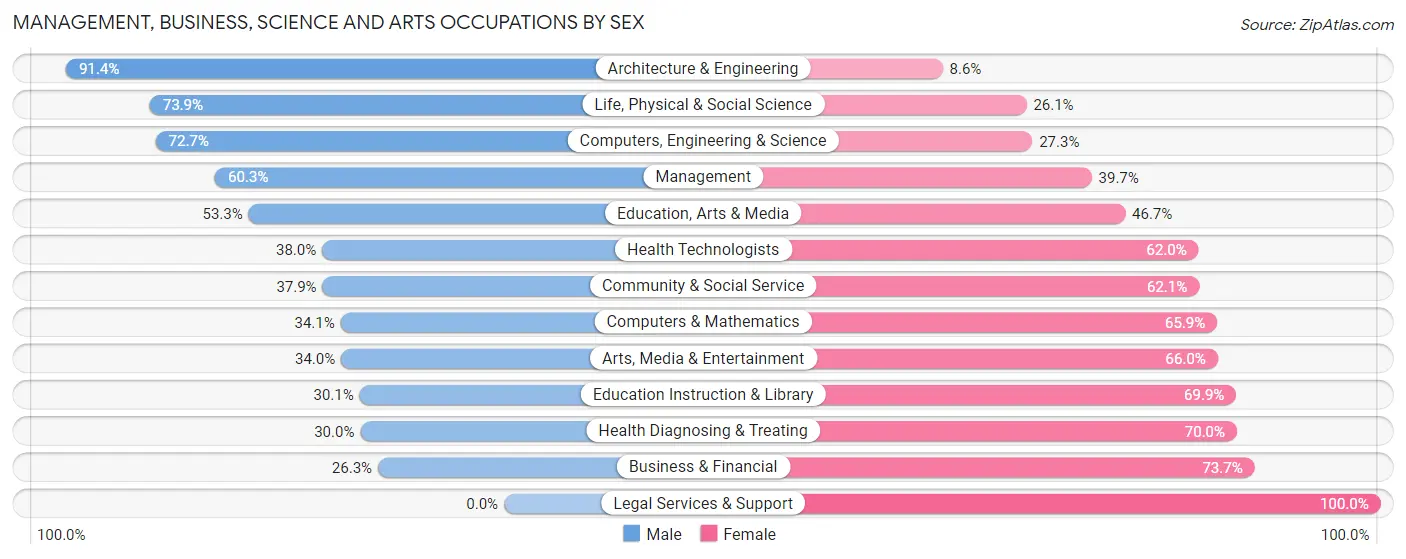
Management, Business, Science and Arts Occupations by Sex
Within the Management, Business, Science and Arts occupations in Anderson, the most male-oriented occupations are Architecture & Engineering (91.4%), Life, Physical & Social Science (73.9%), and Computers, Engineering & Science (72.7%), while the most female-oriented occupations are Legal Services & Support (100.0%), Business & Financial (73.7%), and Health Diagnosing & Treating (70.0%).
| Occupation | Male | Female |
| Management | 534 (60.3%) | 352 (39.7%) |
| Business & Financial | 71 (26.3%) | 199 (73.7%) |
| Computers, Engineering & Science | 558 (72.7%) | 210 (27.3%) |
| Computers & Mathematics | 74 (34.1%) | 143 (65.9%) |
| Architecture & Engineering | 402 (91.4%) | 38 (8.6%) |
| Life, Physical & Social Science | 82 (73.9%) | 29 (26.1%) |
| Community & Social Service | 660 (37.9%) | 1,083 (62.1%) |
| Education, Arts & Media | 308 (53.3%) | 270 (46.7%) |
| Legal Services & Support | 0 (0.0%) | 36 (100.0%) |
| Education Instruction & Library | 248 (30.1%) | 575 (69.9%) |
| Arts, Media & Entertainment | 104 (34.0%) | 202 (66.0%) |
| Health Diagnosing & Treating | 363 (30.0%) | 848 (70.0%) |
| Health Technologists | 257 (38.0%) | 420 (62.0%) |
| Total (Category) | 2,186 (44.8%) | 2,692 (55.2%) |
| Total (Overall) | 6,464 (50.4%) | 6,359 (49.6%) |
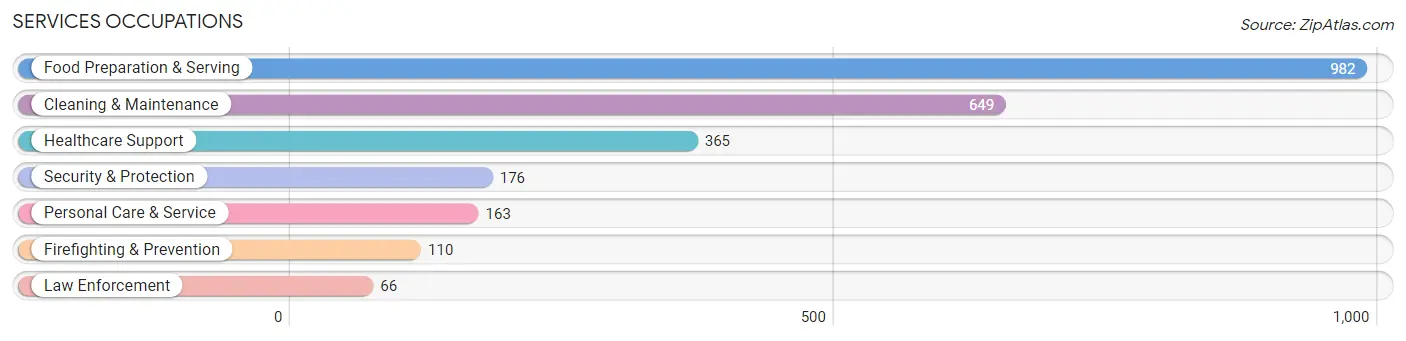
Services Occupations
The most common Services occupations in Anderson are Food Preparation & Serving (982 | 7.7%), Cleaning & Maintenance (649 | 5.1%), Healthcare Support (365 | 2.9%), Security & Protection (176 | 1.4%), and Personal Care & Service (163 | 1.3%).
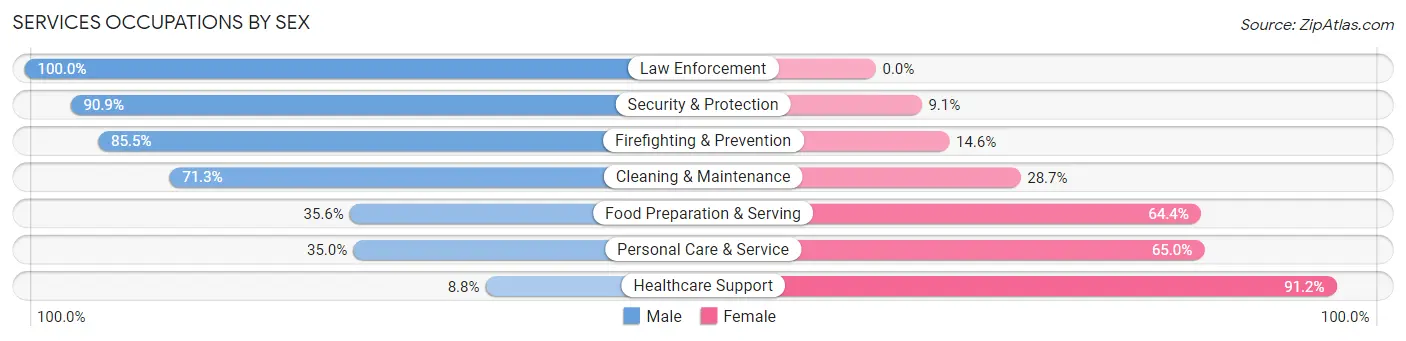
Services Occupations by Sex
Within the Services occupations in Anderson, the most male-oriented occupations are Law Enforcement (100.0%), Security & Protection (90.9%), and Firefighting & Prevention (85.5%), while the most female-oriented occupations are Healthcare Support (91.2%), Personal Care & Service (65.0%), and Food Preparation & Serving (64.4%).
| Occupation | Male | Female |
| Healthcare Support | 32 (8.8%) | 333 (91.2%) |
| Security & Protection | 160 (90.9%) | 16 (9.1%) |
| Firefighting & Prevention | 94 (85.5%) | 16 (14.5%) |
| Law Enforcement | 66 (100.0%) | 0 (0.0%) |
| Food Preparation & Serving | 350 (35.6%) | 632 (64.4%) |
| Cleaning & Maintenance | 463 (71.3%) | 186 (28.7%) |
| Personal Care & Service | 57 (35.0%) | 106 (65.0%) |
| Total (Category) | 1,062 (45.5%) | 1,273 (54.5%) |
| Total (Overall) | 6,464 (50.4%) | 6,359 (49.6%) |
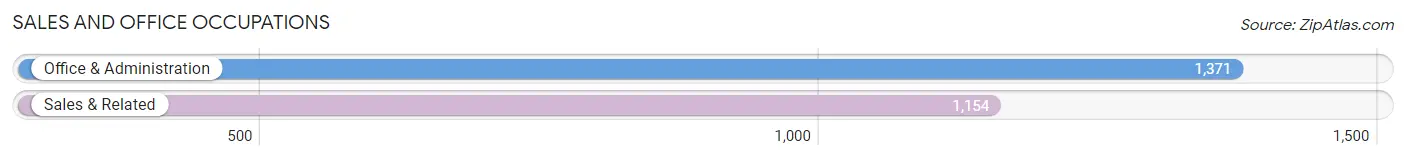
Sales and Office Occupations
The most common Sales and Office occupations in Anderson are Office & Administration (1,371 | 10.7%), and Sales & Related (1,154 | 9.0%).
Sales and Office Occupations by Sex
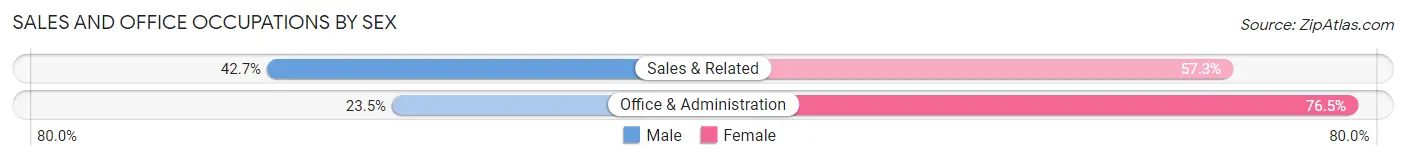
| Occupation | Male | Female |
| Sales & Related | 493 (42.7%) | 661 (57.3%) |
| Office & Administration | 322 (23.5%) | 1,049 (76.5%) |
| Total (Category) | 815 (32.3%) | 1,710 (67.7%) |
| Total (Overall) | 6,464 (50.4%) | 6,359 (49.6%) |
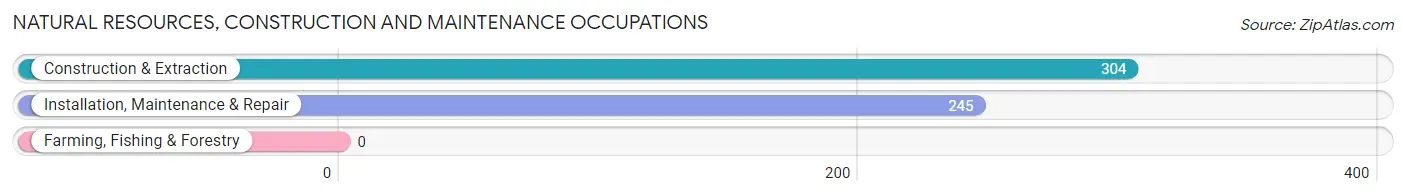
Natural Resources, Construction and Maintenance Occupations
The most common Natural Resources, Construction and Maintenance occupations in Anderson are Construction & Extraction (304 | 2.4%), and Installation, Maintenance & Repair (245 | 1.9%).
Natural Resources, Construction and Maintenance Occupations by Sex
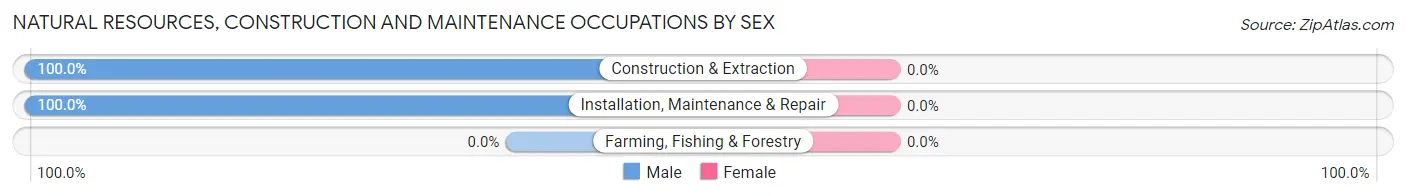
| Occupation | Male | Female |
| Farming, Fishing & Forestry | 0 (0.0%) | 0 (0.0%) |
| Construction & Extraction | 304 (100.0%) | 0 (0.0%) |
| Installation, Maintenance & Repair | 245 (100.0%) | 0 (0.0%) |
| Total (Category) | 549 (100.0%) | 0 (0.0%) |
| Total (Overall) | 6,464 (50.4%) | 6,359 (49.6%) |
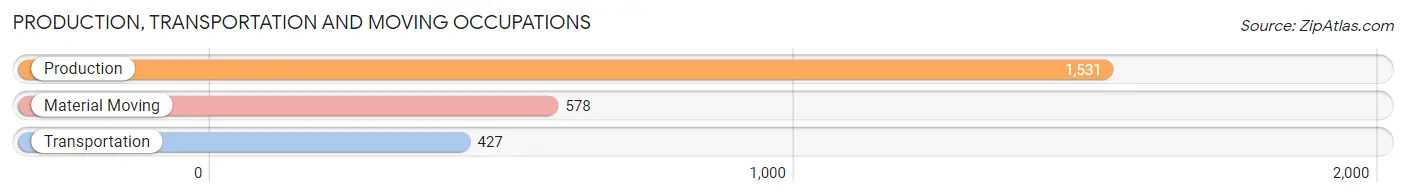
Production, Transportation and Moving Occupations
The most common Production, Transportation and Moving occupations in Anderson are Production (1,531 | 11.9%), Material Moving (578 | 4.5%), and Transportation (427 | 3.3%).
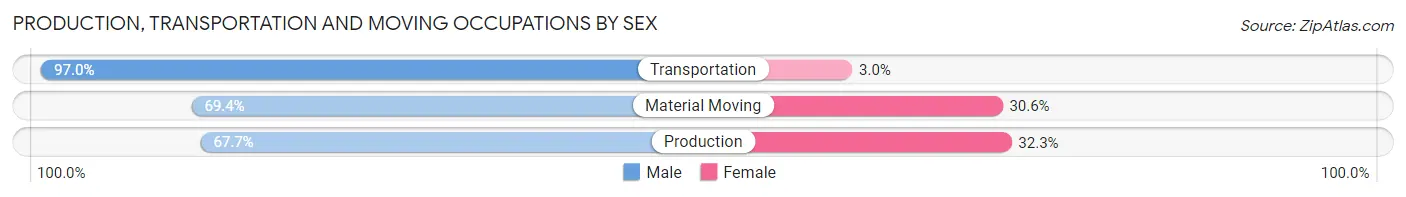
Production, Transportation and Moving Occupations by Sex
| Occupation | Male | Female |
| Production | 1,037 (67.7%) | 494 (32.3%) |
| Transportation | 414 (97.0%) | 13 (3.0%) |
| Material Moving | 401 (69.4%) | 177 (30.6%) |
| Total (Category) | 1,852 (73.0%) | 684 (27.0%) |
| Total (Overall) | 6,464 (50.4%) | 6,359 (49.6%) |
Employment Industries by Sex in Anderson
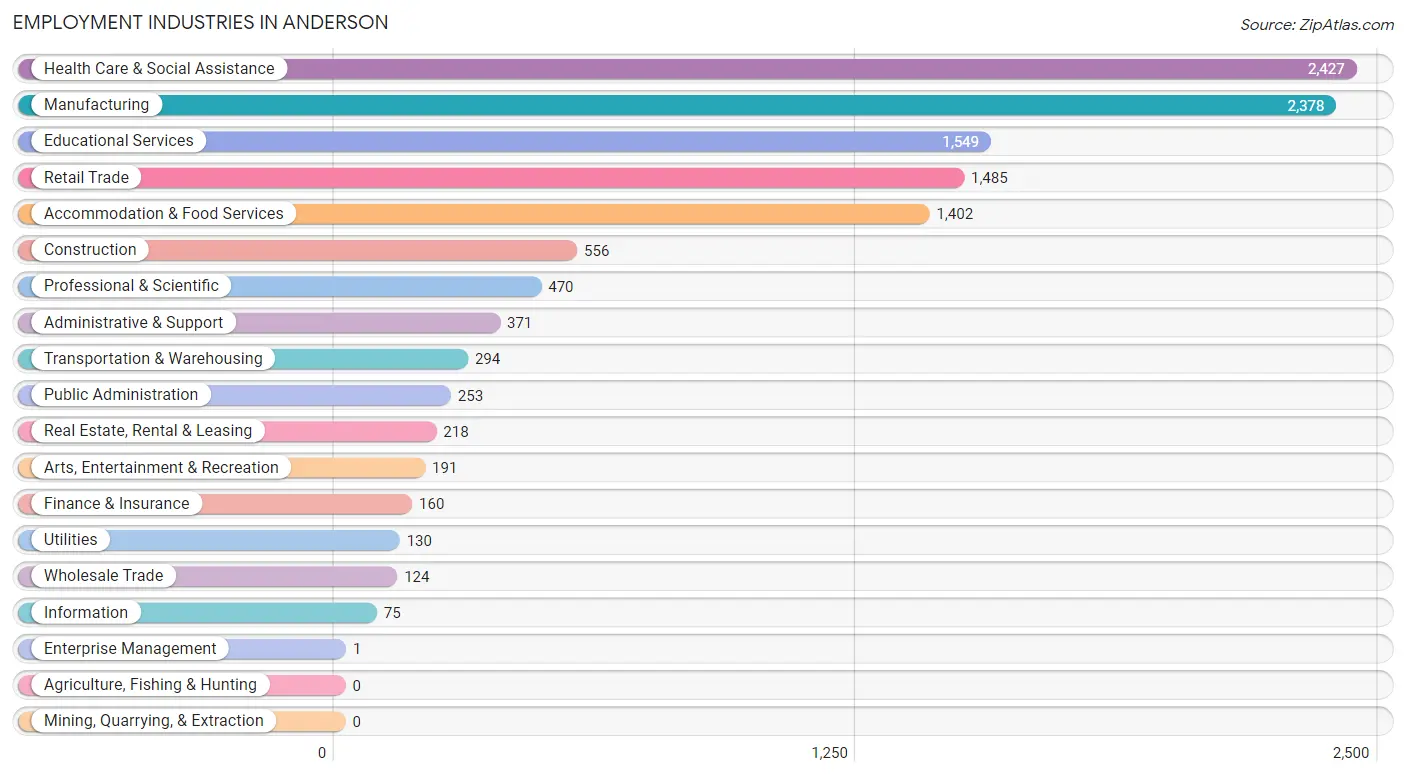
Employment Industries in Anderson
The major employment industries in Anderson include Health Care & Social Assistance (2,427 | 18.9%), Manufacturing (2,378 | 18.5%), Educational Services (1,549 | 12.1%), Retail Trade (1,485 | 11.6%), and Accommodation & Food Services (1,402 | 10.9%).
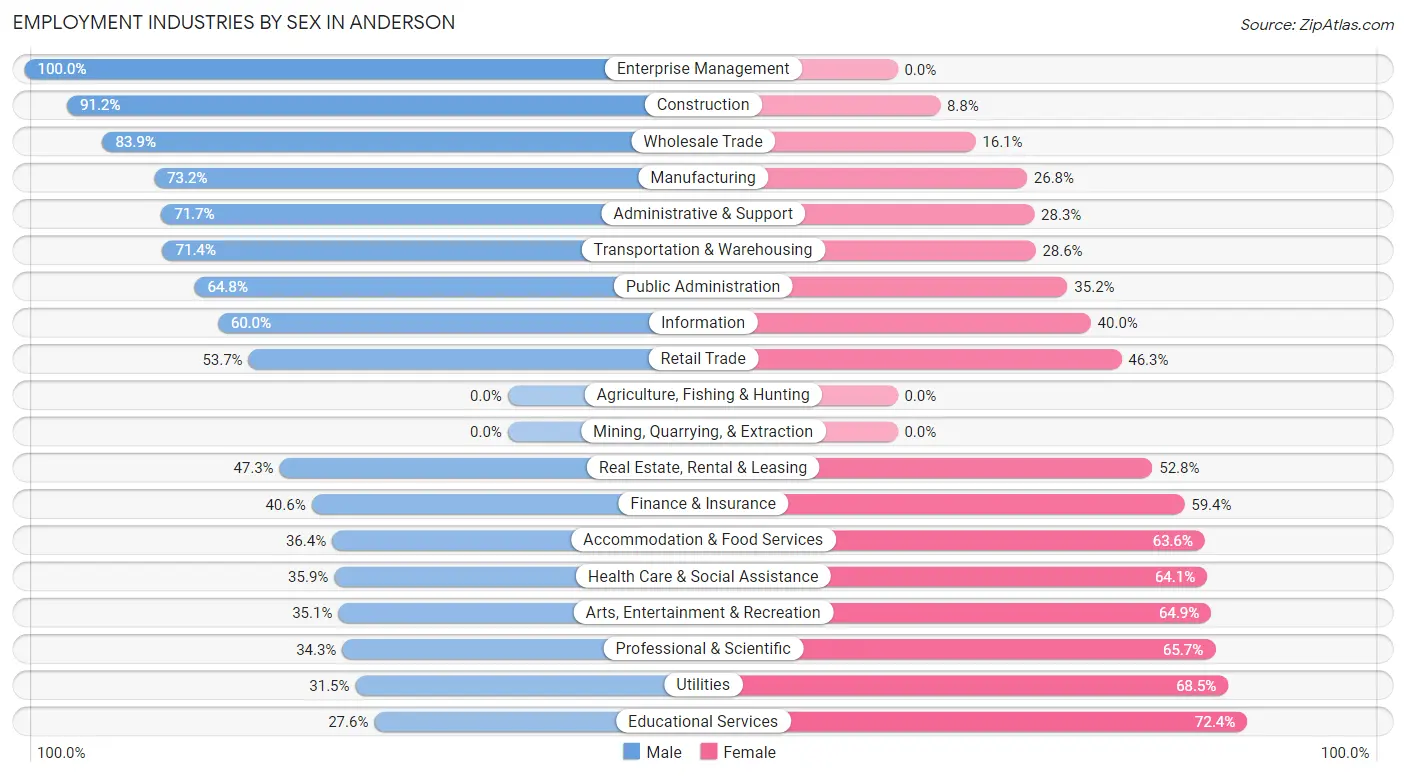
Employment Industries by Sex in Anderson
The Anderson industries that see more men than women are Enterprise Management (100.0%), Construction (91.2%), and Wholesale Trade (83.9%), whereas the industries that tend to have a higher number of women are Educational Services (72.4%), Utilities (68.5%), and Professional & Scientific (65.7%).
| Industry | Male | Female |
| Agriculture, Fishing & Hunting | 0 (0.0%) | 0 (0.0%) |
| Mining, Quarrying, & Extraction | 0 (0.0%) | 0 (0.0%) |
| Construction | 507 (91.2%) | 49 (8.8%) |
| Manufacturing | 1,741 (73.2%) | 637 (26.8%) |
| Wholesale Trade | 104 (83.9%) | 20 (16.1%) |
| Retail Trade | 797 (53.7%) | 688 (46.3%) |
| Transportation & Warehousing | 210 (71.4%) | 84 (28.6%) |
| Utilities | 41 (31.5%) | 89 (68.5%) |
| Information | 45 (60.0%) | 30 (40.0%) |
| Finance & Insurance | 65 (40.6%) | 95 (59.4%) |
| Real Estate, Rental & Leasing | 103 (47.2%) | 115 (52.7%) |
| Professional & Scientific | 161 (34.3%) | 309 (65.7%) |
| Enterprise Management | 1 (100.0%) | 0 (0.0%) |
| Administrative & Support | 266 (71.7%) | 105 (28.3%) |
| Educational Services | 428 (27.6%) | 1,121 (72.4%) |
| Health Care & Social Assistance | 872 (35.9%) | 1,555 (64.1%) |
| Arts, Entertainment & Recreation | 67 (35.1%) | 124 (64.9%) |
| Accommodation & Food Services | 510 (36.4%) | 892 (63.6%) |
| Public Administration | 164 (64.8%) | 89 (35.2%) |
| Total | 6,464 (50.4%) | 6,359 (49.6%) |
Education in Anderson
School Enrollment in Anderson
The most common levels of schooling among the 7,789 students in Anderson are college / undergraduate (2,551 | 32.8%), elementary school (1,659 | 21.3%), and middle school (1,505 | 19.3%).
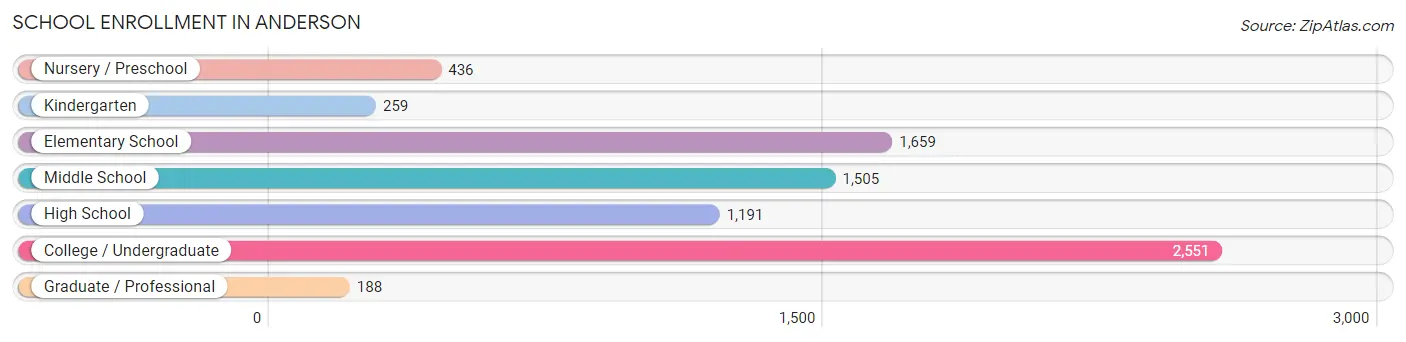
| School Level | # Students | % Students |
| Nursery / Preschool | 436 | 5.6% |
| Kindergarten | 259 | 3.3% |
| Elementary School | 1,659 | 21.3% |
| Middle School | 1,505 | 19.3% |
| High School | 1,191 | 15.3% |
| College / Undergraduate | 2,551 | 32.8% |
| Graduate / Professional | 188 | 2.4% |
| Total | 7,789 | 100.0% |
School Enrollment by Age by Funding Source in Anderson
Out of a total of 7,789 students who are enrolled in schools in Anderson, 2,859 (36.7%) attend a private institution, while the remaining 4,930 (63.3%) are enrolled in public schools. The age group of 20 to 24 year olds has the highest likelihood of being enrolled in private schools, with 958 (80.1% in the age bracket) enrolled. Conversely, the age group of 5 to 9 year old has the lowest likelihood of being enrolled in a private school, with 1,499 (92.8% in the age bracket) attending a public institution.
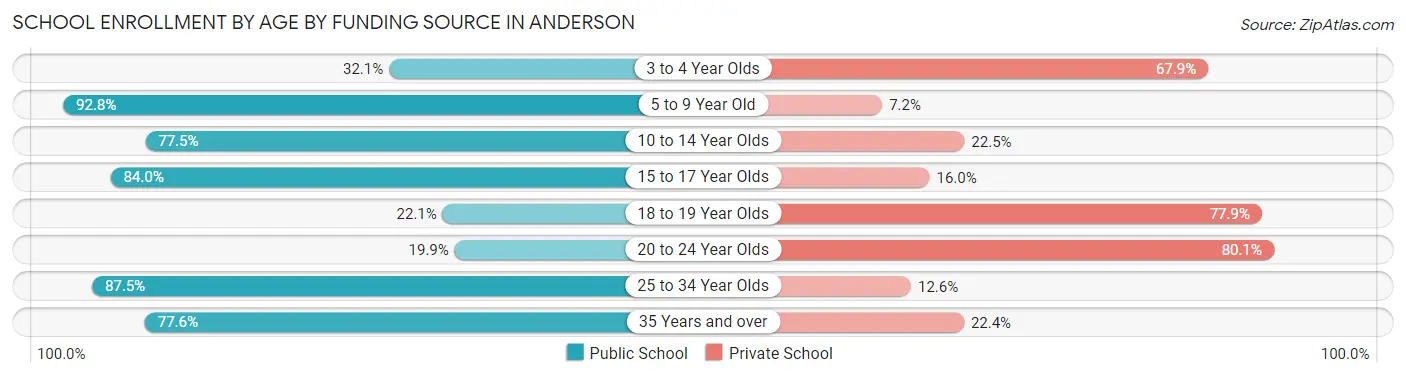
| Age Bracket | Public School | Private School |
| 3 to 4 Year Olds | 115 (32.1%) | 243 (67.9%) |
| 5 to 9 Year Old | 1,499 (92.8%) | 116 (7.2%) |
| 10 to 14 Year Olds | 1,544 (77.5%) | 448 (22.5%) |
| 15 to 17 Year Olds | 777 (84.0%) | 148 (16.0%) |
| 18 to 19 Year Olds | 236 (22.1%) | 830 (77.9%) |
| 20 to 24 Year Olds | 238 (19.9%) | 958 (80.1%) |
| 25 to 34 Year Olds | 237 (87.5%) | 34 (12.6%) |
| 35 Years and over | 284 (77.6%) | 82 (22.4%) |
| Total | 4,930 (63.3%) | 2,859 (36.7%) |
Educational Attainment by Field of Study in Anderson
Business (1,066 | 21.3%), education (849 | 17.0%), science & technology (671 | 13.4%), arts & humanities (443 | 8.9%), and bio, nature & agricultural (396 | 7.9%) are the most common fields of study among 4,997 individuals in Anderson who have obtained a bachelor's degree or higher.
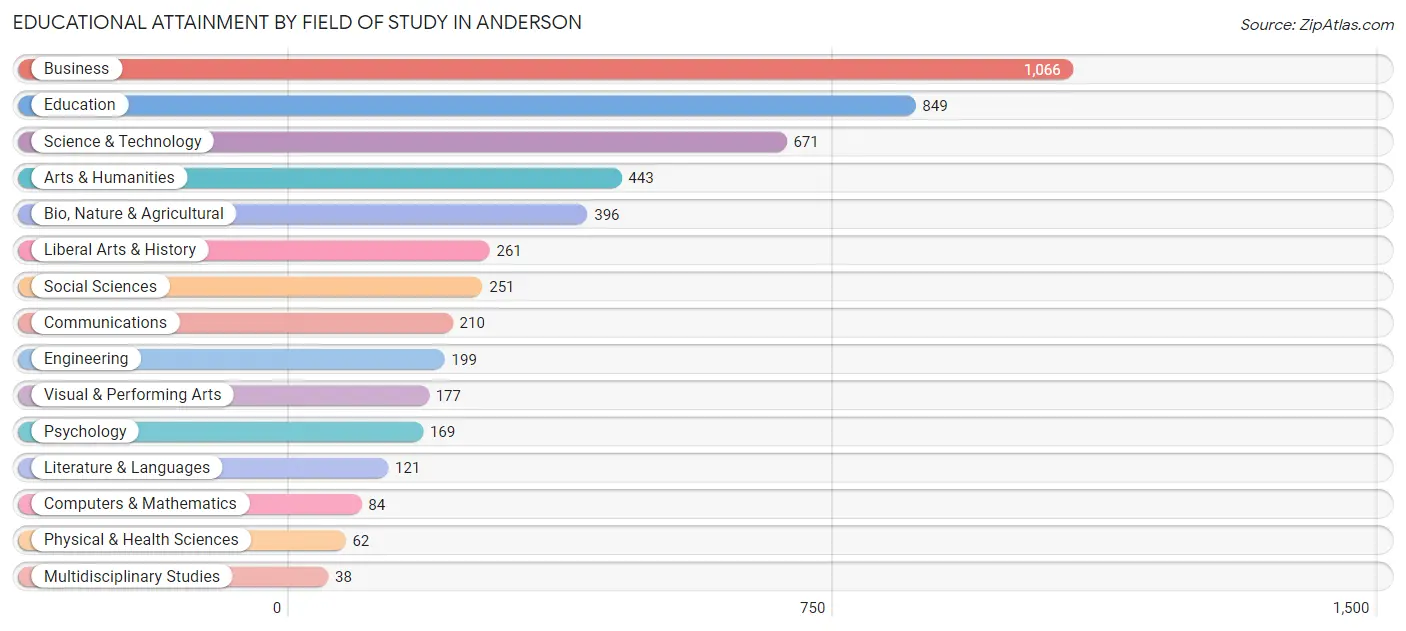
| Field of Study | # Graduates | % Graduates |
| Computers & Mathematics | 84 | 1.7% |
| Bio, Nature & Agricultural | 396 | 7.9% |
| Physical & Health Sciences | 62 | 1.2% |
| Psychology | 169 | 3.4% |
| Social Sciences | 251 | 5.0% |
| Engineering | 199 | 4.0% |
| Multidisciplinary Studies | 38 | 0.8% |
| Science & Technology | 671 | 13.4% |
| Business | 1,066 | 21.3% |
| Education | 849 | 17.0% |
| Literature & Languages | 121 | 2.4% |
| Liberal Arts & History | 261 | 5.2% |
| Visual & Performing Arts | 177 | 3.5% |
| Communications | 210 | 4.2% |
| Arts & Humanities | 443 | 8.9% |
| Total | 4,997 | 100.0% |
Transportation & Commute in Anderson
Vehicle Availability by Sex in Anderson
The most prevalent vehicle ownership categories in Anderson are males with 2 vehicles (2,659, accounting for 42.9%) and females with 2 vehicles (2,404, making up 45.6%).
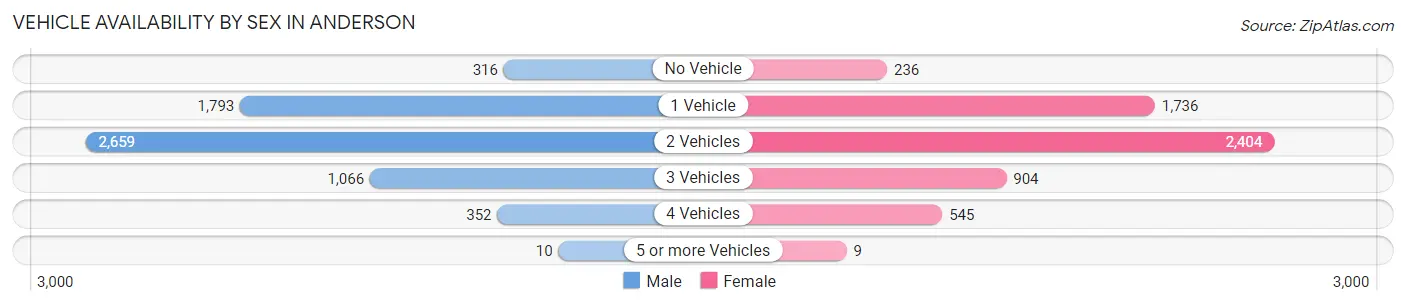
| Vehicles Available | Male | Female |
| No Vehicle | 316 (5.1%) | 236 (4.1%) |
| 1 Vehicle | 1,793 (28.9%) | 1,736 (29.8%) |
| 2 Vehicles | 2,659 (42.9%) | 2,404 (41.2%) |
| 3 Vehicles | 1,066 (17.2%) | 904 (15.5%) |
| 4 Vehicles | 352 (5.7%) | 545 (9.3%) |
| 5 or more Vehicles | 10 (0.2%) | 9 (0.2%) |
| Total | 6,196 (100.0%) | 5,834 (100.0%) |
Commute Time in Anderson
The most frequently occuring commute durations in Anderson are 10 to 14 minutes (2,695 commuters, 22.2%), 15 to 19 minutes (2,348 commuters, 19.3%), and 5 to 9 minutes (1,820 commuters, 15.0%).
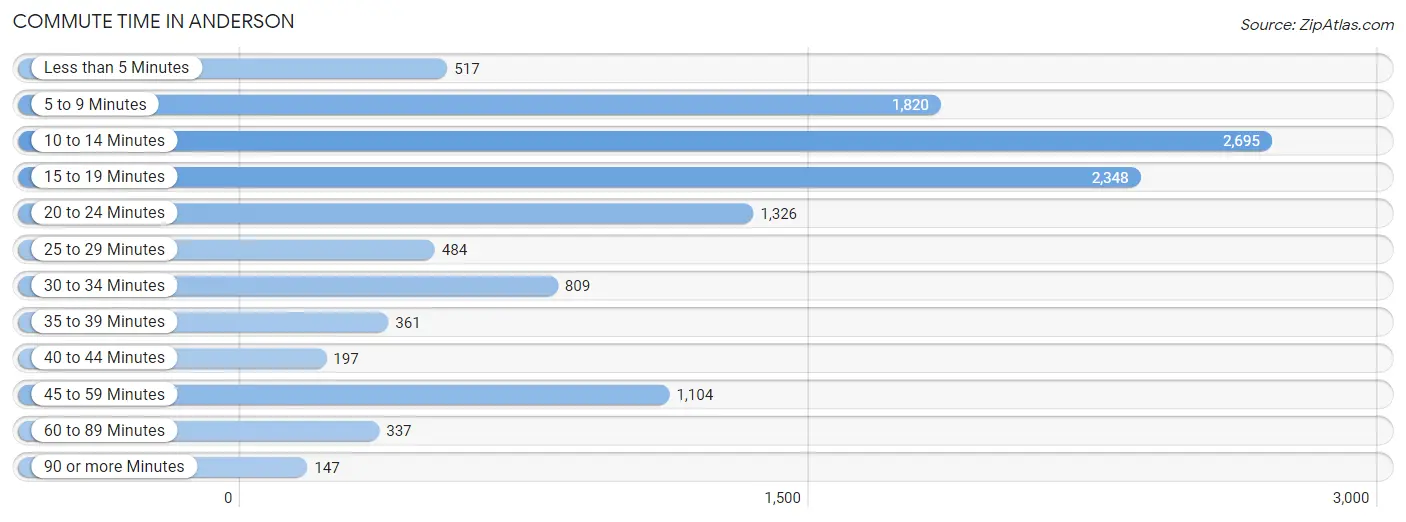
| Commute Time | # Commuters | % Commuters |
| Less than 5 Minutes | 517 | 4.3% |
| 5 to 9 Minutes | 1,820 | 15.0% |
| 10 to 14 Minutes | 2,695 | 22.2% |
| 15 to 19 Minutes | 2,348 | 19.3% |
| 20 to 24 Minutes | 1,326 | 10.9% |
| 25 to 29 Minutes | 484 | 4.0% |
| 30 to 34 Minutes | 809 | 6.7% |
| 35 to 39 Minutes | 361 | 3.0% |
| 40 to 44 Minutes | 197 | 1.6% |
| 45 to 59 Minutes | 1,104 | 9.1% |
| 60 to 89 Minutes | 337 | 2.8% |
| 90 or more Minutes | 147 | 1.2% |
Commute Time by Sex in Anderson
The most common commute times in Anderson are 10 to 14 minutes (1,401 commuters, 22.2%) for males and 10 to 14 minutes (1,294 commuters, 22.2%) for females.
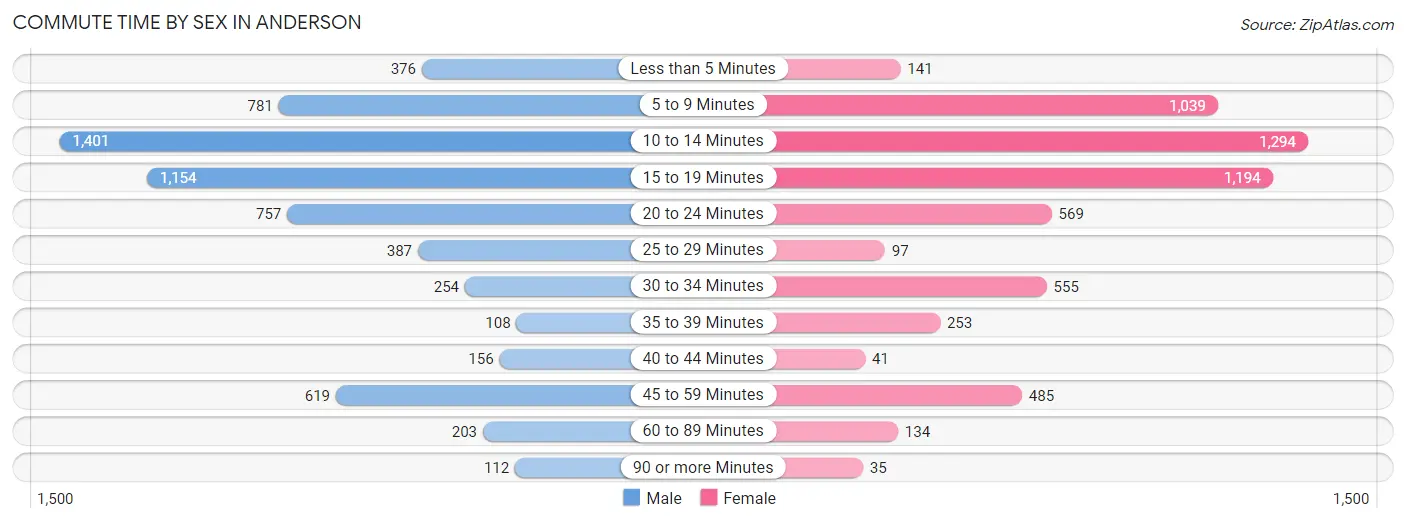
| Commute Time | Male | Female |
| Less than 5 Minutes | 376 (6.0%) | 141 (2.4%) |
| 5 to 9 Minutes | 781 (12.4%) | 1,039 (17.8%) |
| 10 to 14 Minutes | 1,401 (22.2%) | 1,294 (22.2%) |
| 15 to 19 Minutes | 1,154 (18.3%) | 1,194 (20.5%) |
| 20 to 24 Minutes | 757 (12.0%) | 569 (9.8%) |
| 25 to 29 Minutes | 387 (6.1%) | 97 (1.7%) |
| 30 to 34 Minutes | 254 (4.0%) | 555 (9.5%) |
| 35 to 39 Minutes | 108 (1.7%) | 253 (4.3%) |
| 40 to 44 Minutes | 156 (2.5%) | 41 (0.7%) |
| 45 to 59 Minutes | 619 (9.8%) | 485 (8.3%) |
| 60 to 89 Minutes | 203 (3.2%) | 134 (2.3%) |
| 90 or more Minutes | 112 (1.8%) | 35 (0.6%) |
Time of Departure to Work by Sex in Anderson
The most frequent times of departure to work in Anderson are 6:30 AM to 6:59 AM (771, 12.2%) for males and 12:00 PM to 3:59 PM (1,029, 17.6%) for females.
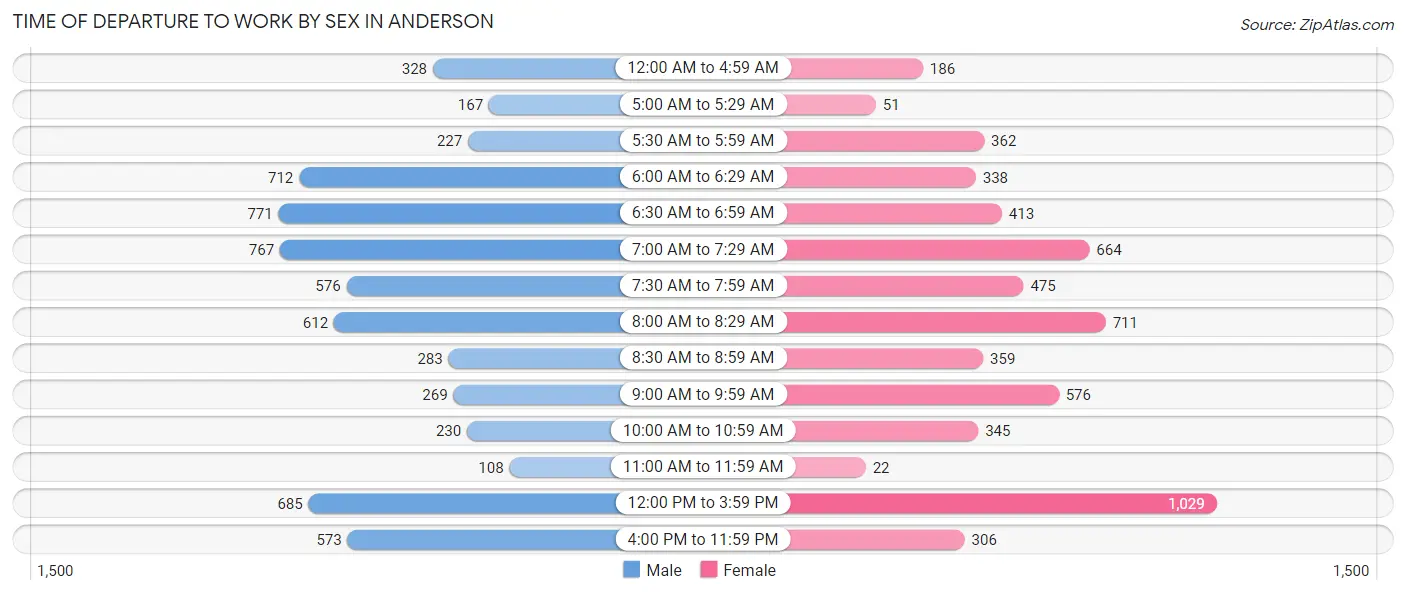
| Time of Departure | Male | Female |
| 12:00 AM to 4:59 AM | 328 (5.2%) | 186 (3.2%) |
| 5:00 AM to 5:29 AM | 167 (2.6%) | 51 (0.9%) |
| 5:30 AM to 5:59 AM | 227 (3.6%) | 362 (6.2%) |
| 6:00 AM to 6:29 AM | 712 (11.3%) | 338 (5.8%) |
| 6:30 AM to 6:59 AM | 771 (12.2%) | 413 (7.1%) |
| 7:00 AM to 7:29 AM | 767 (12.2%) | 664 (11.4%) |
| 7:30 AM to 7:59 AM | 576 (9.1%) | 475 (8.1%) |
| 8:00 AM to 8:29 AM | 612 (9.7%) | 711 (12.2%) |
| 8:30 AM to 8:59 AM | 283 (4.5%) | 359 (6.1%) |
| 9:00 AM to 9:59 AM | 269 (4.3%) | 576 (9.9%) |
| 10:00 AM to 10:59 AM | 230 (3.6%) | 345 (5.9%) |
| 11:00 AM to 11:59 AM | 108 (1.7%) | 22 (0.4%) |
| 12:00 PM to 3:59 PM | 685 (10.9%) | 1,029 (17.6%) |
| 4:00 PM to 11:59 PM | 573 (9.1%) | 306 (5.2%) |
| Total | 6,308 (100.0%) | 5,837 (100.0%) |
Housing Occupancy in Anderson
Occupancy by Ownership in Anderson
Of the total 12,008 dwellings in Anderson, owner-occupied units account for 6,009 (50.0%), while renter-occupied units make up 5,999 (50.0%).
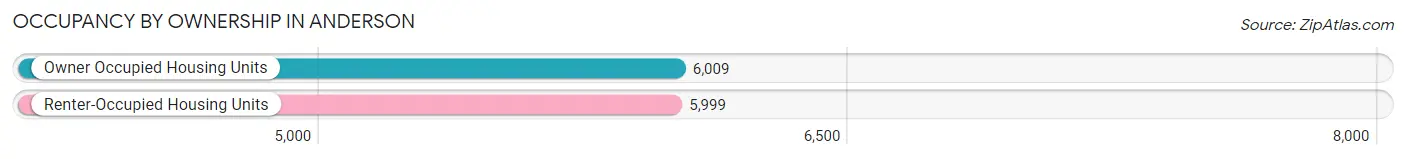
| Occupancy | # Housing Units | % Housing Units |
| Owner Occupied Housing Units | 6,009 | 50.0% |
| Renter-Occupied Housing Units | 5,999 | 50.0% |
| Total Occupied Housing Units | 12,008 | 100.0% |
Occupancy by Household Size in Anderson
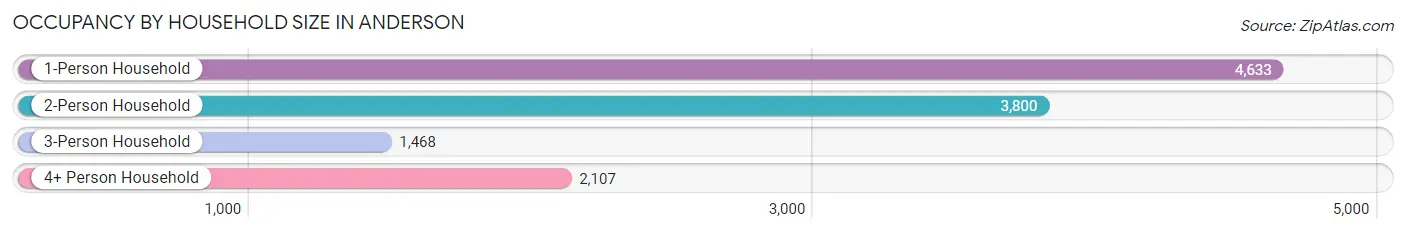
| Household Size | # Housing Units | % Housing Units |
| 1-Person Household | 4,633 | 38.6% |
| 2-Person Household | 3,800 | 31.7% |
| 3-Person Household | 1,468 | 12.2% |
| 4+ Person Household | 2,107 | 17.5% |
| Total Housing Units | 12,008 | 100.0% |
Occupancy by Ownership by Household Size in Anderson
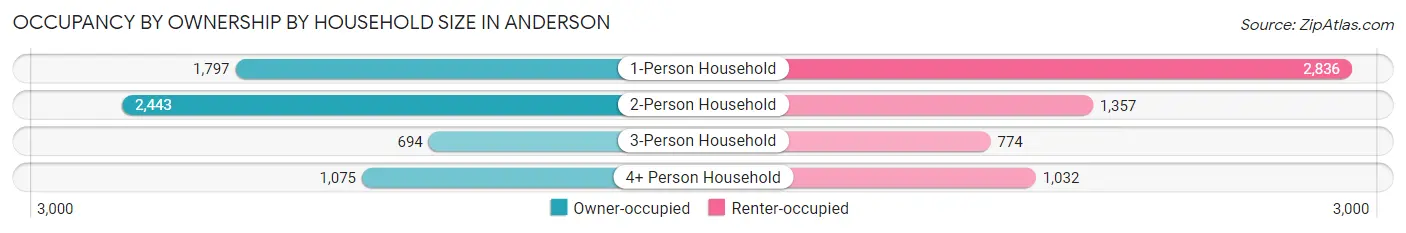
| Household Size | Owner-occupied | Renter-occupied |
| 1-Person Household | 1,797 (38.8%) | 2,836 (61.2%) |
| 2-Person Household | 2,443 (64.3%) | 1,357 (35.7%) |
| 3-Person Household | 694 (47.3%) | 774 (52.7%) |
| 4+ Person Household | 1,075 (51.0%) | 1,032 (49.0%) |
| Total Housing Units | 6,009 (50.0%) | 5,999 (50.0%) |
Occupancy by Educational Attainment in Anderson
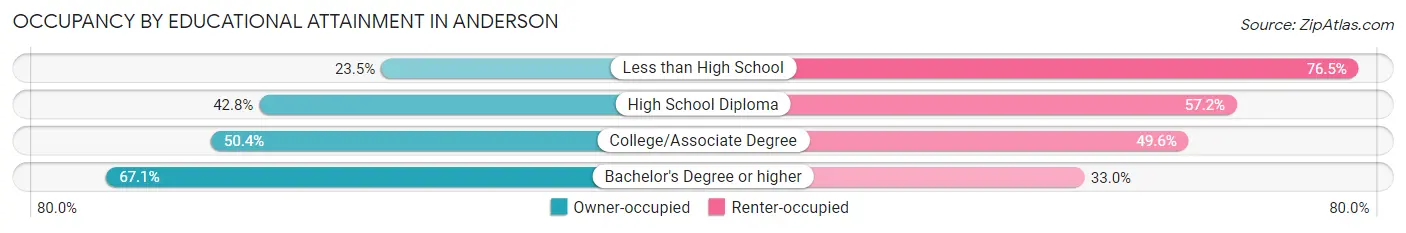
| Household Size | Owner-occupied | Renter-occupied |
| Less than High School | 322 (23.5%) | 1,050 (76.5%) |
| High School Diploma | 1,347 (42.8%) | 1,801 (57.2%) |
| College/Associate Degree | 2,067 (50.4%) | 2,031 (49.6%) |
| Bachelor's Degree or higher | 2,273 (67.0%) | 1,117 (33.0%) |
Occupancy by Age of Householder in Anderson
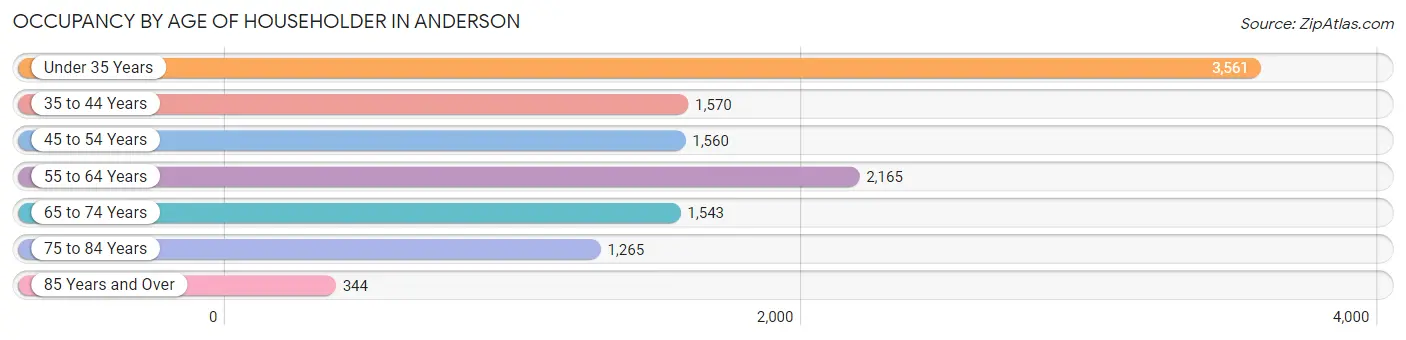
| Age Bracket | # Households | % Households |
| Under 35 Years | 3,561 | 29.7% |
| 35 to 44 Years | 1,570 | 13.1% |
| 45 to 54 Years | 1,560 | 13.0% |
| 55 to 64 Years | 2,165 | 18.0% |
| 65 to 74 Years | 1,543 | 12.9% |
| 75 to 84 Years | 1,265 | 10.5% |
| 85 Years and Over | 344 | 2.9% |
| Total | 12,008 | 100.0% |
Housing Finances in Anderson
Median Income by Occupancy in Anderson
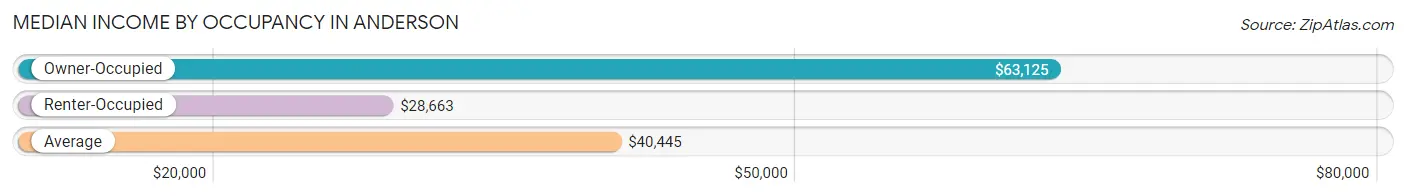
| Occupancy Type | # Households | Median Income |
| Owner-Occupied | 6,009 (50.0%) | $63,125 |
| Renter-Occupied | 5,999 (50.0%) | $28,663 |
| Average | 12,008 (100.0%) | $40,445 |
Occupancy by Householder Income Bracket in Anderson
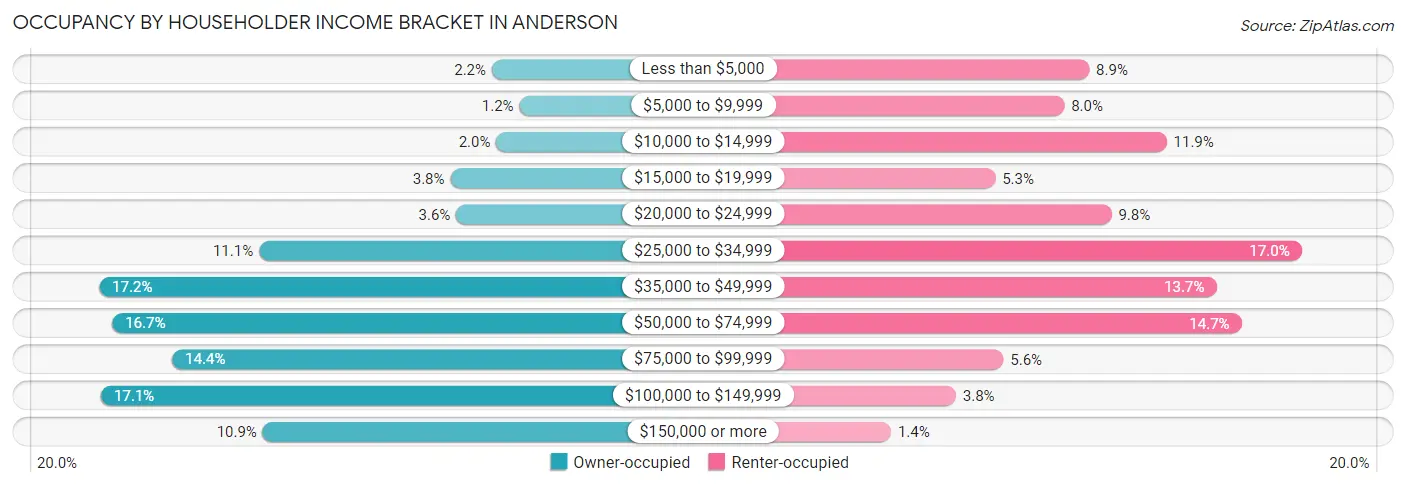
| Income Bracket | Owner-occupied | Renter-occupied |
| Less than $5,000 | 132 (2.2%) | 534 (8.9%) |
| $5,000 to $9,999 | 69 (1.1%) | 477 (8.0%) |
| $10,000 to $14,999 | 122 (2.0%) | 711 (11.8%) |
| $15,000 to $19,999 | 227 (3.8%) | 319 (5.3%) |
| $20,000 to $24,999 | 214 (3.6%) | 585 (9.8%) |
| $25,000 to $34,999 | 665 (11.1%) | 1,019 (17.0%) |
| $35,000 to $49,999 | 1,031 (17.2%) | 824 (13.7%) |
| $50,000 to $74,999 | 1,001 (16.7%) | 882 (14.7%) |
| $75,000 to $99,999 | 864 (14.4%) | 338 (5.6%) |
| $100,000 to $149,999 | 1,027 (17.1%) | 229 (3.8%) |
| $150,000 or more | 657 (10.9%) | 81 (1.3%) |
| Total | 6,009 (100.0%) | 5,999 (100.0%) |
Monthly Housing Cost Tiers in Anderson
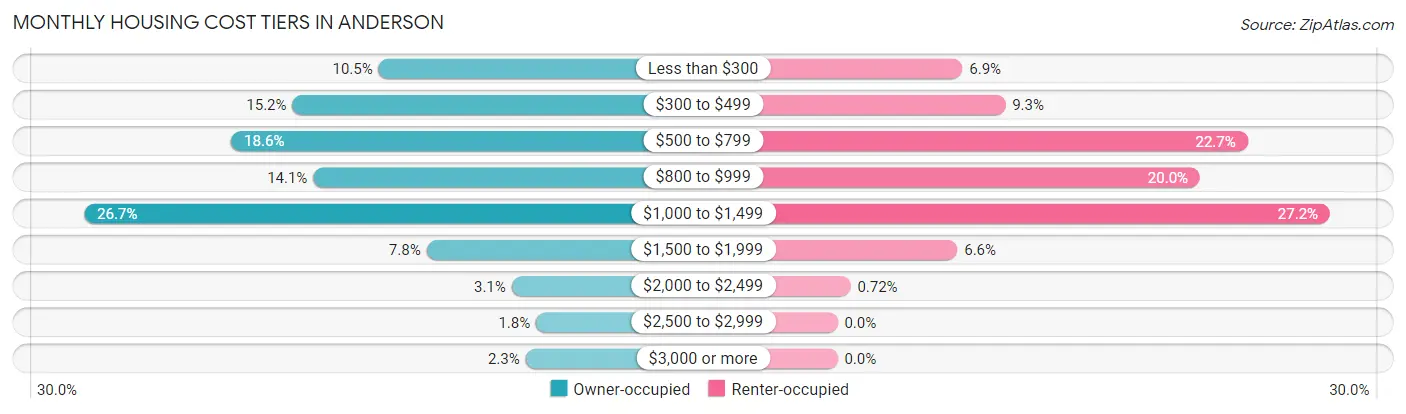
| Monthly Cost | Owner-occupied | Renter-occupied |
| Less than $300 | 628 (10.4%) | 414 (6.9%) |
| $300 to $499 | 914 (15.2%) | 556 (9.3%) |
| $500 to $799 | 1,117 (18.6%) | 1,359 (22.7%) |
| $800 to $999 | 845 (14.1%) | 1,201 (20.0%) |
| $1,000 to $1,499 | 1,605 (26.7%) | 1,632 (27.2%) |
| $1,500 to $1,999 | 469 (7.8%) | 397 (6.6%) |
| $2,000 to $2,499 | 186 (3.1%) | 43 (0.7%) |
| $2,500 to $2,999 | 105 (1.8%) | 0 (0.0%) |
| $3,000 or more | 140 (2.3%) | 0 (0.0%) |
| Total | 6,009 (100.0%) | 5,999 (100.0%) |
Physical Housing Characteristics in Anderson
Housing Structures in Anderson
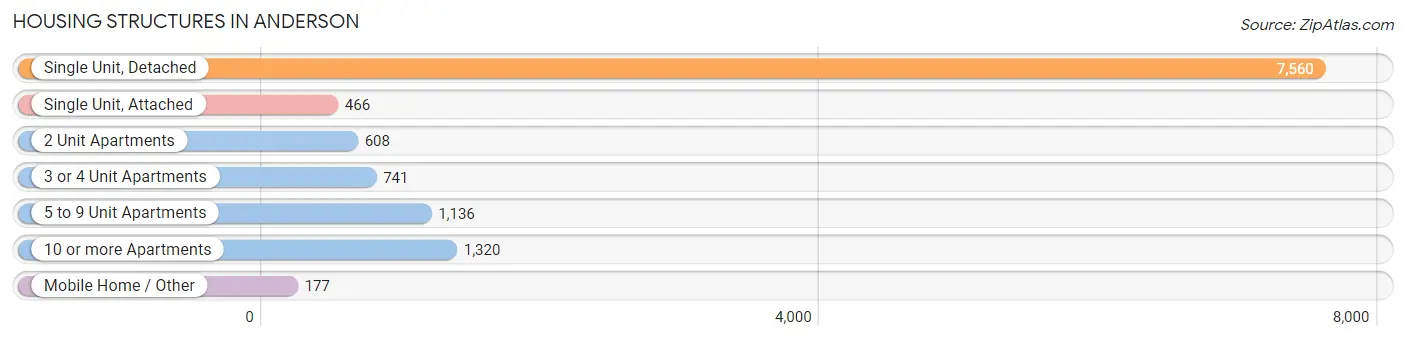
| Structure Type | # Housing Units | % Housing Units |
| Single Unit, Detached | 7,560 | 63.0% |
| Single Unit, Attached | 466 | 3.9% |
| 2 Unit Apartments | 608 | 5.1% |
| 3 or 4 Unit Apartments | 741 | 6.2% |
| 5 to 9 Unit Apartments | 1,136 | 9.5% |
| 10 or more Apartments | 1,320 | 11.0% |
| Mobile Home / Other | 177 | 1.5% |
| Total | 12,008 | 100.0% |
Housing Structures by Occupancy in Anderson
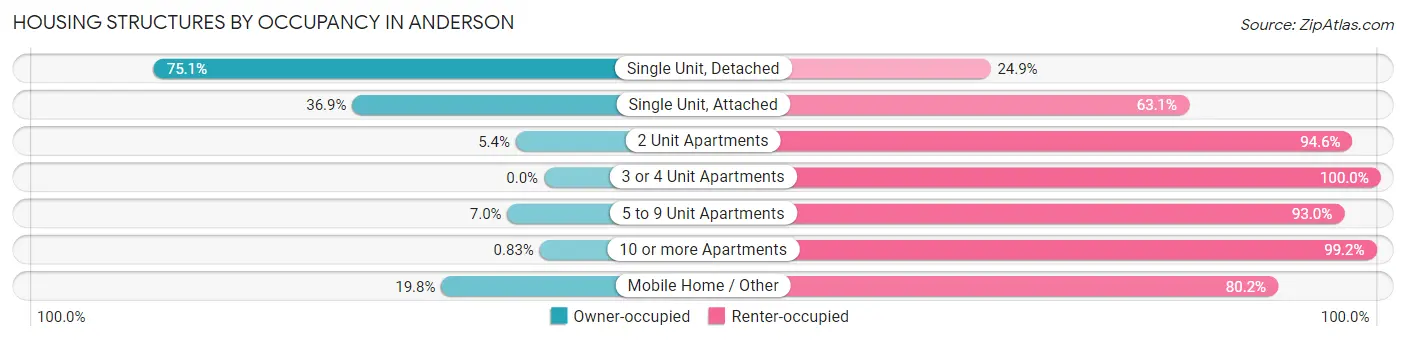
| Structure Type | Owner-occupied | Renter-occupied |
| Single Unit, Detached | 5,678 (75.1%) | 1,882 (24.9%) |
| Single Unit, Attached | 172 (36.9%) | 294 (63.1%) |
| 2 Unit Apartments | 33 (5.4%) | 575 (94.6%) |
| 3 or 4 Unit Apartments | 0 (0.0%) | 741 (100.0%) |
| 5 to 9 Unit Apartments | 80 (7.0%) | 1,056 (93.0%) |
| 10 or more Apartments | 11 (0.8%) | 1,309 (99.2%) |
| Mobile Home / Other | 35 (19.8%) | 142 (80.2%) |
| Total | 6,009 (50.0%) | 5,999 (50.0%) |
Housing Structures by Number of Rooms in Anderson
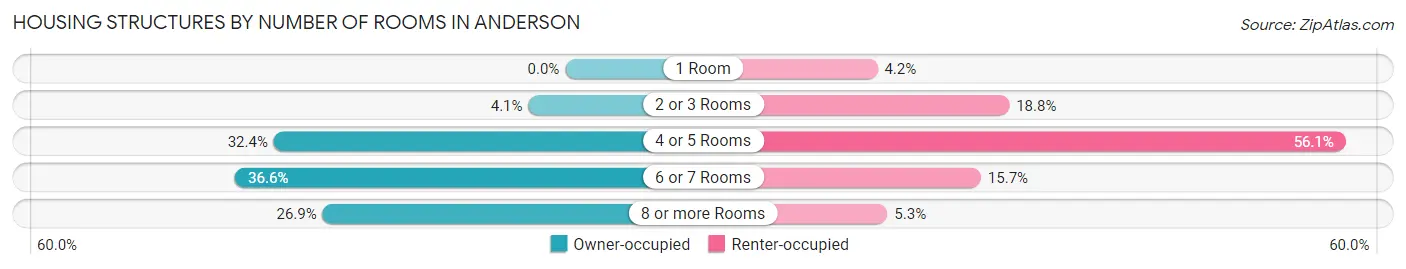
| Number of Rooms | Owner-occupied | Renter-occupied |
| 1 Room | 0 (0.0%) | 250 (4.2%) |
| 2 or 3 Rooms | 246 (4.1%) | 1,127 (18.8%) |
| 4 or 5 Rooms | 1,944 (32.4%) | 3,367 (56.1%) |
| 6 or 7 Rooms | 2,201 (36.6%) | 939 (15.7%) |
| 8 or more Rooms | 1,618 (26.9%) | 316 (5.3%) |
| Total | 6,009 (100.0%) | 5,999 (100.0%) |
Housing Structure by Heating Type in Anderson
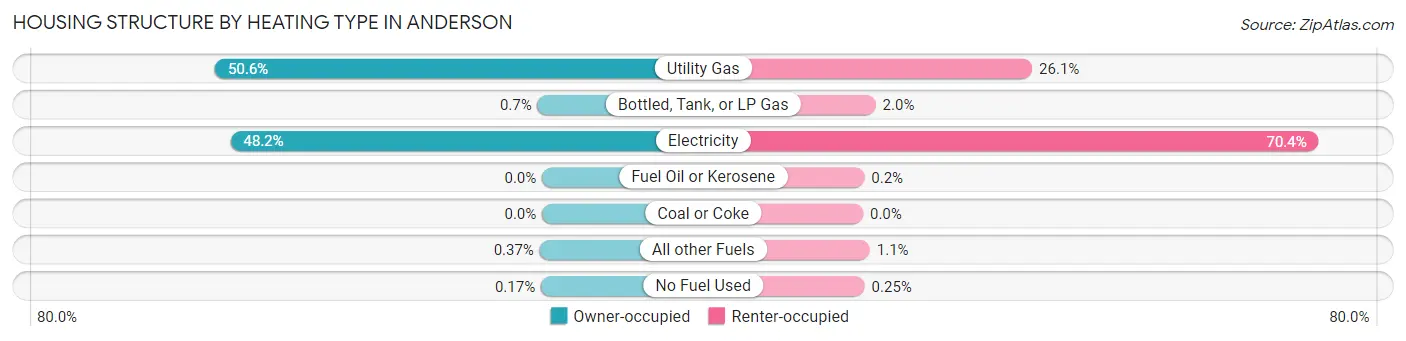
| Heating Type | Owner-occupied | Renter-occupied |
| Utility Gas | 3,039 (50.6%) | 1,568 (26.1%) |
| Bottled, Tank, or LP Gas | 42 (0.7%) | 117 (1.9%) |
| Electricity | 2,896 (48.2%) | 4,224 (70.4%) |
| Fuel Oil or Kerosene | 0 (0.0%) | 12 (0.2%) |
| Coal or Coke | 0 (0.0%) | 0 (0.0%) |
| All other Fuels | 22 (0.4%) | 63 (1.1%) |
| No Fuel Used | 10 (0.2%) | 15 (0.3%) |
| Total | 6,009 (100.0%) | 5,999 (100.0%) |
Household Vehicle Usage in Anderson
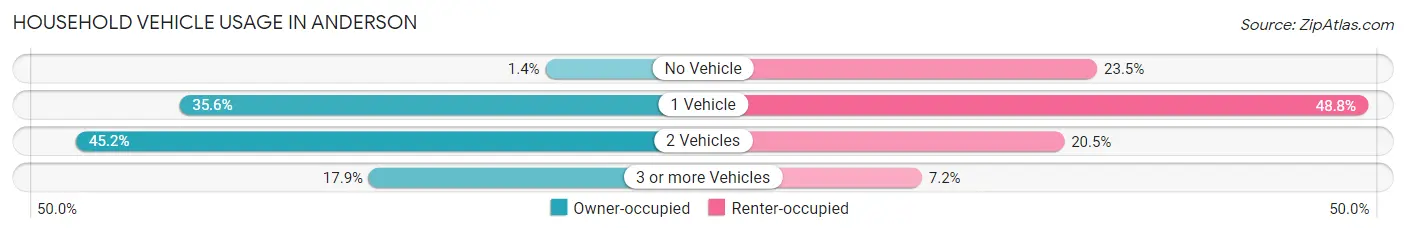
| Vehicles per Household | Owner-occupied | Renter-occupied |
| No Vehicle | 83 (1.4%) | 1,412 (23.5%) |
| 1 Vehicle | 2,137 (35.6%) | 2,928 (48.8%) |
| 2 Vehicles | 2,716 (45.2%) | 1,228 (20.5%) |
| 3 or more Vehicles | 1,073 (17.9%) | 431 (7.2%) |
| Total | 6,009 (100.0%) | 5,999 (100.0%) |
Real Estate & Mortgages in Anderson
Real Estate and Mortgage Overview in Anderson
| Characteristic | Without Mortgage | With Mortgage |
| Housing Units | 2,320 | 3,689 |
| Median Property Value | $167,800 | $185,200 |
| Median Household Income | $50,405 | $378 |
| Monthly Housing Costs | $395 | $127 |
| Real Estate Taxes | $988 | $103 |
Property Value by Mortgage Status in Anderson
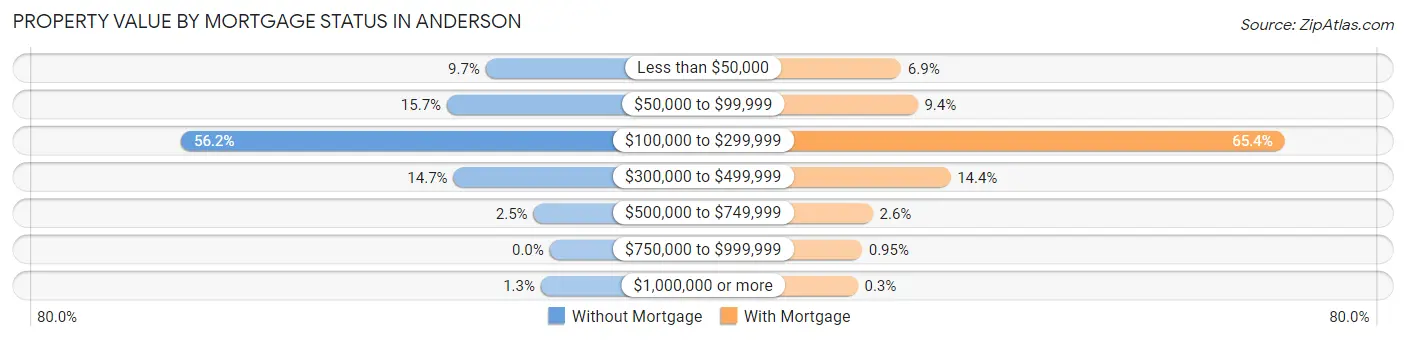
| Property Value | Without Mortgage | With Mortgage |
| Less than $50,000 | 226 (9.7%) | 255 (6.9%) |
| $50,000 to $99,999 | 363 (15.7%) | 348 (9.4%) |
| $100,000 to $299,999 | 1,303 (56.2%) | 2,412 (65.4%) |
| $300,000 to $499,999 | 340 (14.7%) | 532 (14.4%) |
| $500,000 to $749,999 | 57 (2.5%) | 96 (2.6%) |
| $750,000 to $999,999 | 0 (0.0%) | 35 (0.9%) |
| $1,000,000 or more | 31 (1.3%) | 11 (0.3%) |
| Total | 2,320 (100.0%) | 3,689 (100.0%) |
Household Income by Mortgage Status in Anderson
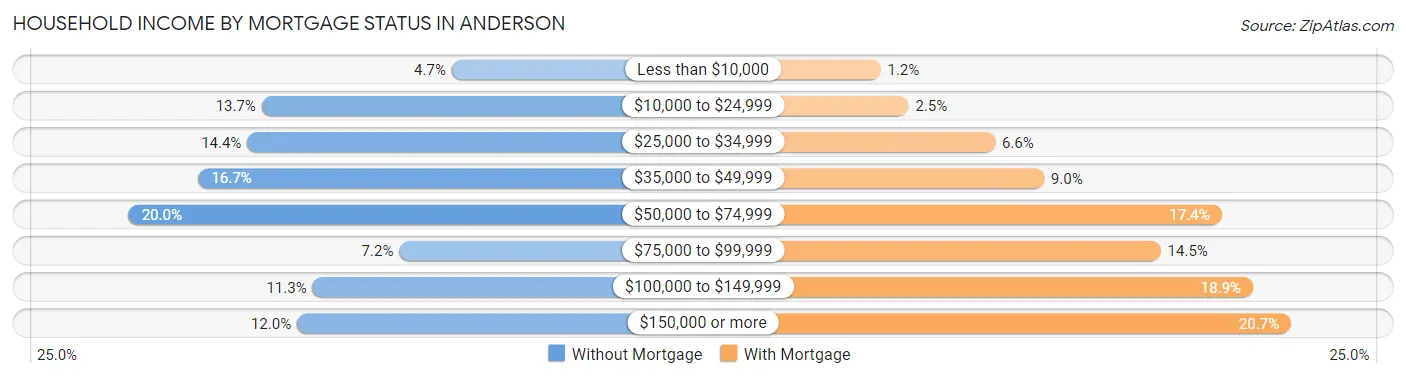
| Household Income | Without Mortgage | With Mortgage |
| Less than $10,000 | 108 (4.7%) | 44 (1.2%) |
| $10,000 to $24,999 | 318 (13.7%) | 93 (2.5%) |
| $25,000 to $34,999 | 334 (14.4%) | 245 (6.6%) |
| $35,000 to $49,999 | 388 (16.7%) | 331 (9.0%) |
| $50,000 to $74,999 | 465 (20.0%) | 643 (17.4%) |
| $75,000 to $99,999 | 166 (7.2%) | 536 (14.5%) |
| $100,000 to $149,999 | 262 (11.3%) | 698 (18.9%) |
| $150,000 or more | 279 (12.0%) | 765 (20.7%) |
| Total | 2,320 (100.0%) | 3,689 (100.0%) |
Property Value to Household Income Ratio in Anderson
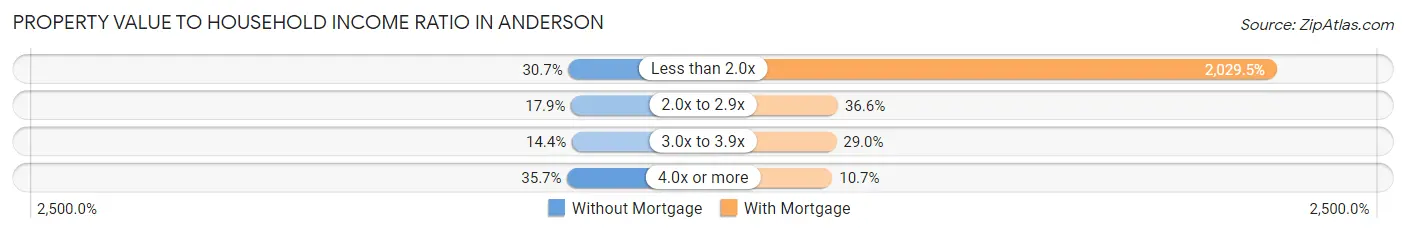
| Value-to-Income Ratio | Without Mortgage | With Mortgage |
| Less than 2.0x | 711 (30.6%) | 74,867 (2,029.5%) |
| 2.0x to 2.9x | 416 (17.9%) | 1,351 (36.6%) |
| 3.0x to 3.9x | 335 (14.4%) | 1,069 (29.0%) |
| 4.0x or more | 829 (35.7%) | 396 (10.7%) |
| Total | 2,320 (100.0%) | 3,689 (100.0%) |
Real Estate Taxes by Mortgage Status in Anderson
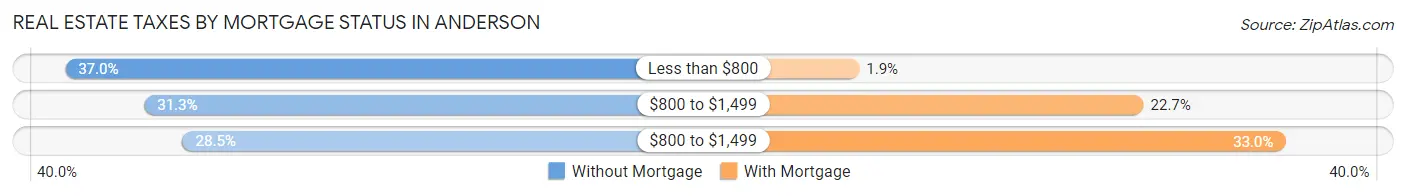
| Property Taxes | Without Mortgage | With Mortgage |
| Less than $800 | 859 (37.0%) | 71 (1.9%) |
| $800 to $1,499 | 725 (31.2%) | 837 (22.7%) |
| $800 to $1,499 | 660 (28.4%) | 1,219 (33.0%) |
| Total | 2,320 (100.0%) | 3,689 (100.0%) |
Health & Disability in Anderson
Health Insurance Coverage by Age in Anderson
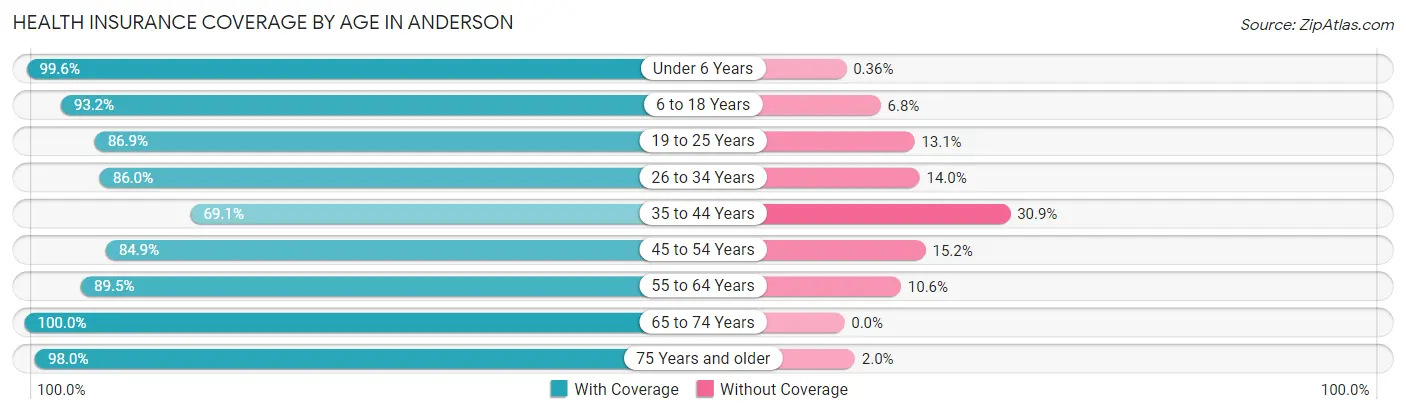
| Age Bracket | With Coverage | Without Coverage |
| Under 6 Years | 2,190 (99.6%) | 8 (0.4%) |
| 6 to 18 Years | 5,082 (93.2%) | 369 (6.8%) |
| 19 to 25 Years | 3,257 (86.9%) | 490 (13.1%) |
| 26 to 34 Years | 3,498 (86.0%) | 571 (14.0%) |
| 35 to 44 Years | 1,734 (69.1%) | 777 (30.9%) |
| 45 to 54 Years | 2,431 (84.9%) | 434 (15.1%) |
| 55 to 64 Years | 2,966 (89.4%) | 350 (10.5%) |
| 65 to 74 Years | 2,371 (100.0%) | 0 (0.0%) |
| 75 Years and older | 2,001 (98.0%) | 40 (2.0%) |
| Total | 25,530 (89.4%) | 3,039 (10.6%) |
Health Insurance Coverage by Citizenship Status in Anderson
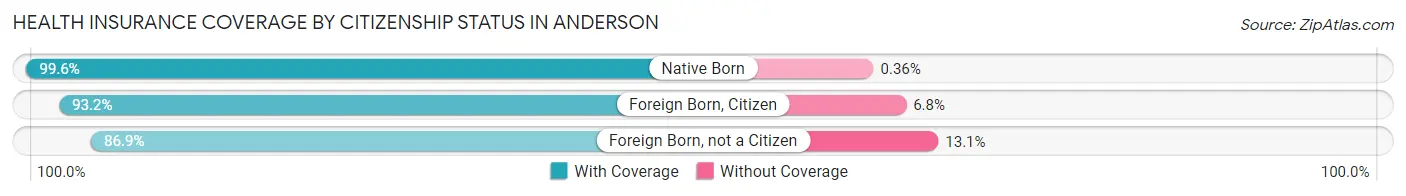
| Citizenship Status | With Coverage | Without Coverage |
| Native Born | 2,190 (99.6%) | 8 (0.4%) |
| Foreign Born, Citizen | 5,082 (93.2%) | 369 (6.8%) |
| Foreign Born, not a Citizen | 3,257 (86.9%) | 490 (13.1%) |
Health Insurance Coverage by Household Income in Anderson
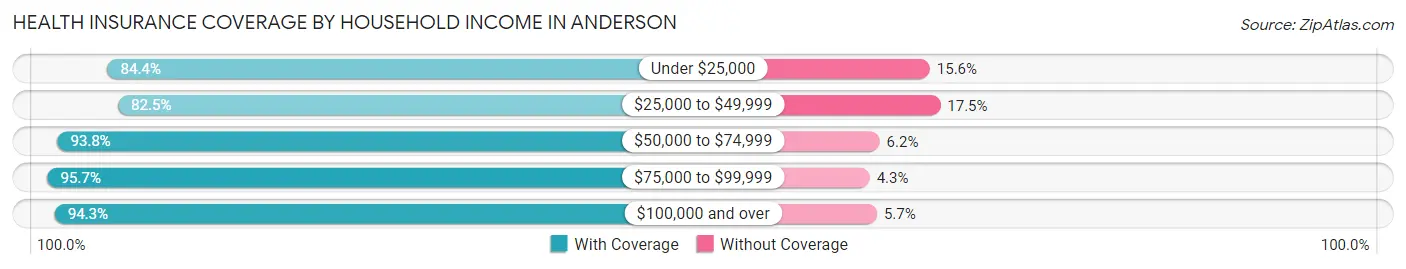
| Household Income | With Coverage | Without Coverage |
| Under $25,000 | 5,362 (84.4%) | 988 (15.6%) |
| $25,000 to $49,999 | 5,955 (82.5%) | 1,266 (17.5%) |
| $50,000 to $74,999 | 3,790 (93.8%) | 249 (6.2%) |
| $75,000 to $99,999 | 3,638 (95.7%) | 163 (4.3%) |
| $100,000 and over | 5,469 (94.3%) | 328 (5.7%) |
Public vs Private Health Insurance Coverage by Age in Anderson
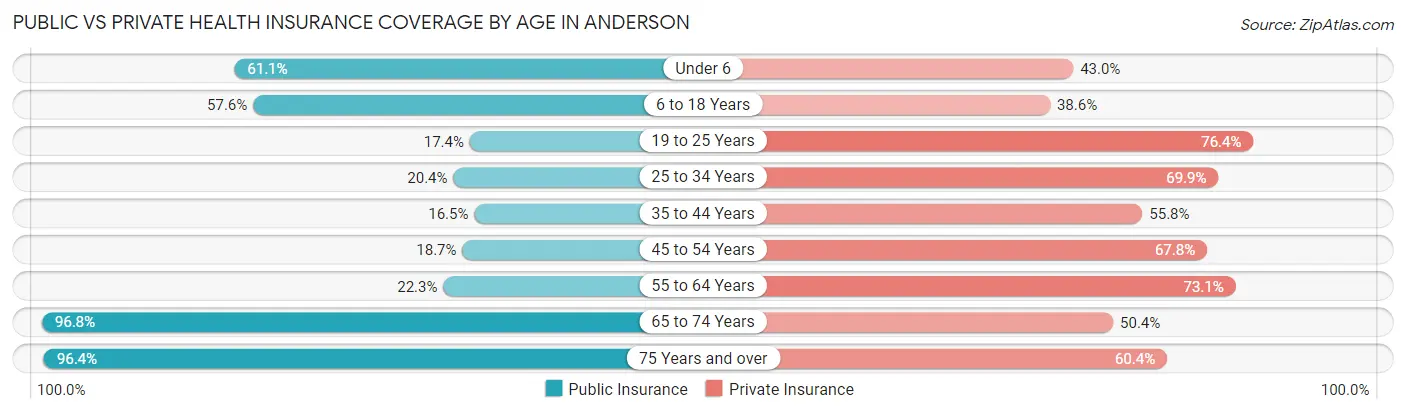
| Age Bracket | Public Insurance | Private Insurance |
| Under 6 | 1,342 (61.1%) | 944 (42.9%) |
| 6 to 18 Years | 3,139 (57.6%) | 2,106 (38.6%) |
| 19 to 25 Years | 651 (17.4%) | 2,862 (76.4%) |
| 25 to 34 Years | 831 (20.4%) | 2,844 (69.9%) |
| 35 to 44 Years | 415 (16.5%) | 1,401 (55.8%) |
| 45 to 54 Years | 537 (18.7%) | 1,942 (67.8%) |
| 55 to 64 Years | 739 (22.3%) | 2,424 (73.1%) |
| 65 to 74 Years | 2,295 (96.8%) | 1,194 (50.4%) |
| 75 Years and over | 1,968 (96.4%) | 1,232 (60.4%) |
| Total | 11,917 (41.7%) | 16,949 (59.3%) |
Disability Status by Sex by Age in Anderson
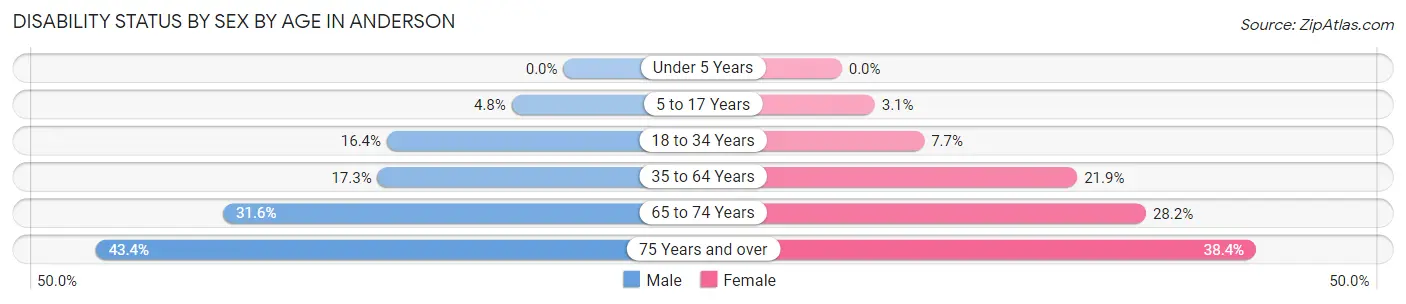
| Age Bracket | Male | Female |
| Under 5 Years | 0 (0.0%) | 0 (0.0%) |
| 5 to 17 Years | 117 (4.8%) | 78 (3.1%) |
| 18 to 34 Years | 627 (16.4%) | 362 (7.6%) |
| 35 to 64 Years | 718 (17.2%) | 990 (21.8%) |
| 65 to 74 Years | 336 (31.6%) | 369 (28.2%) |
| 75 Years and over | 250 (43.4%) | 563 (38.4%) |
Disability Class by Sex by Age in Anderson
Disability Class: Hearing Difficulty
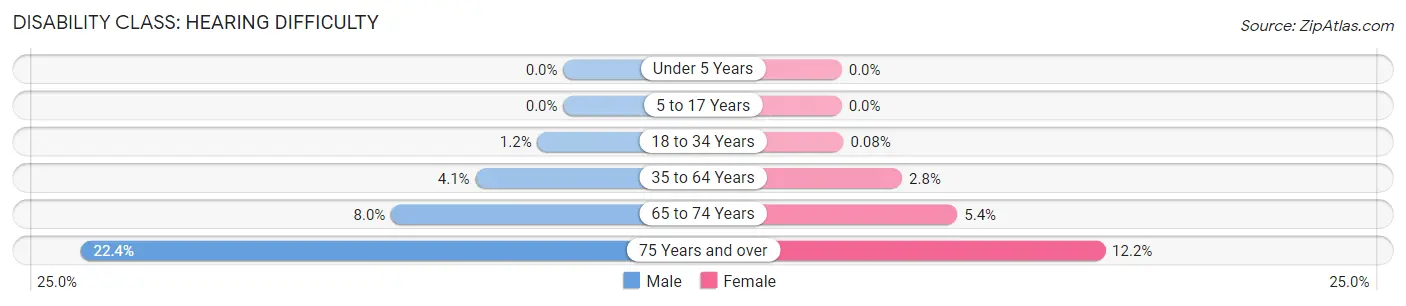
| Age Bracket | Male | Female |
| Under 5 Years | 0 (0.0%) | 0 (0.0%) |
| 5 to 17 Years | 0 (0.0%) | 0 (0.0%) |
| 18 to 34 Years | 46 (1.2%) | 4 (0.1%) |
| 35 to 64 Years | 170 (4.1%) | 127 (2.8%) |
| 65 to 74 Years | 85 (8.0%) | 70 (5.4%) |
| 75 Years and over | 129 (22.4%) | 179 (12.2%) |
Disability Class: Vision Difficulty
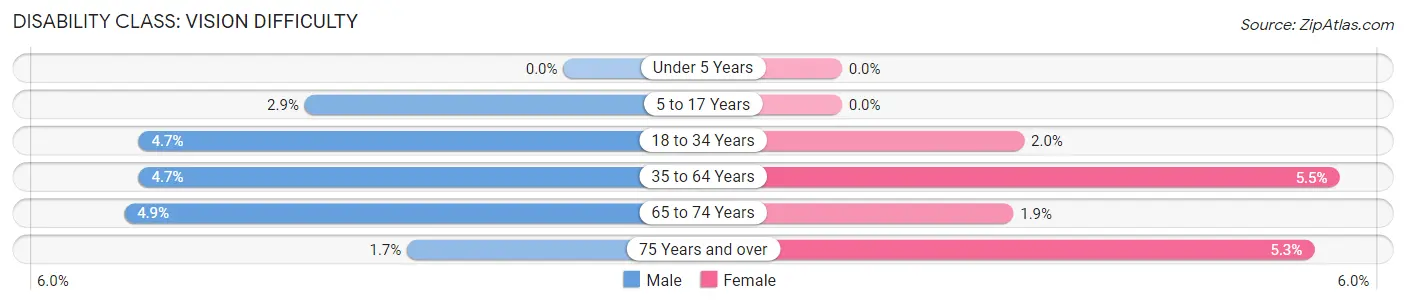
| Age Bracket | Male | Female |
| Under 5 Years | 0 (0.0%) | 0 (0.0%) |
| 5 to 17 Years | 70 (2.9%) | 0 (0.0%) |
| 18 to 34 Years | 181 (4.7%) | 96 (2.0%) |
| 35 to 64 Years | 197 (4.7%) | 251 (5.5%) |
| 65 to 74 Years | 52 (4.9%) | 25 (1.9%) |
| 75 Years and over | 10 (1.7%) | 77 (5.3%) |
Disability Class: Cognitive Difficulty
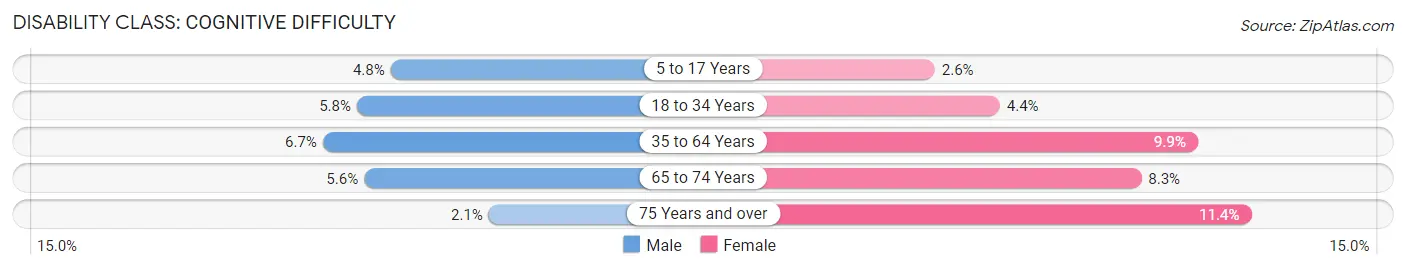
| Age Bracket | Male | Female |
| 5 to 17 Years | 117 (4.8%) | 66 (2.6%) |
| 18 to 34 Years | 220 (5.8%) | 208 (4.4%) |
| 35 to 64 Years | 279 (6.7%) | 449 (9.9%) |
| 65 to 74 Years | 59 (5.6%) | 109 (8.3%) |
| 75 Years and over | 12 (2.1%) | 167 (11.4%) |
Disability Class: Ambulatory Difficulty
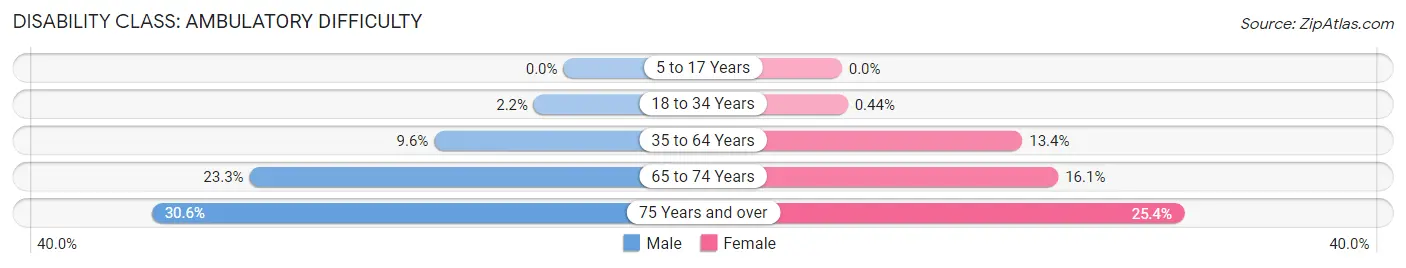
| Age Bracket | Male | Female |
| 5 to 17 Years | 0 (0.0%) | 0 (0.0%) |
| 18 to 34 Years | 84 (2.2%) | 21 (0.4%) |
| 35 to 64 Years | 399 (9.6%) | 607 (13.4%) |
| 65 to 74 Years | 248 (23.3%) | 210 (16.1%) |
| 75 Years and over | 176 (30.6%) | 372 (25.4%) |
Disability Class: Self-Care Difficulty
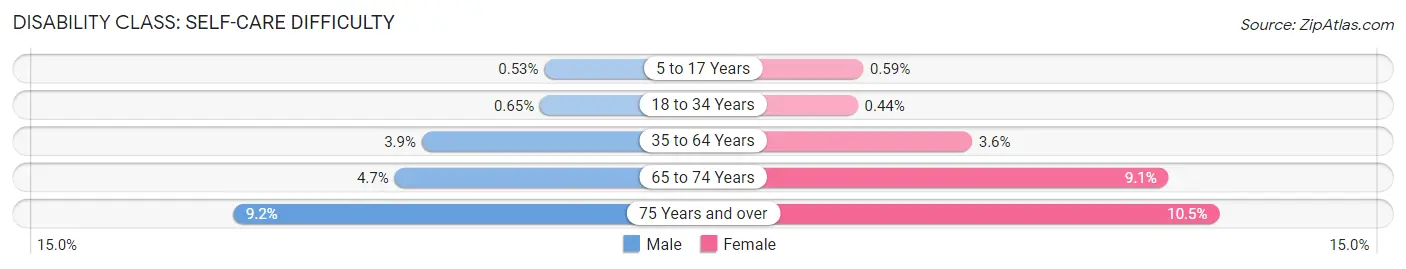
| Age Bracket | Male | Female |
| 5 to 17 Years | 13 (0.5%) | 15 (0.6%) |
| 18 to 34 Years | 25 (0.6%) | 21 (0.4%) |
| 35 to 64 Years | 164 (3.9%) | 164 (3.6%) |
| 65 to 74 Years | 50 (4.7%) | 119 (9.1%) |
| 75 Years and over | 53 (9.2%) | 154 (10.5%) |
Technology Access in Anderson
Computing Device Access in Anderson
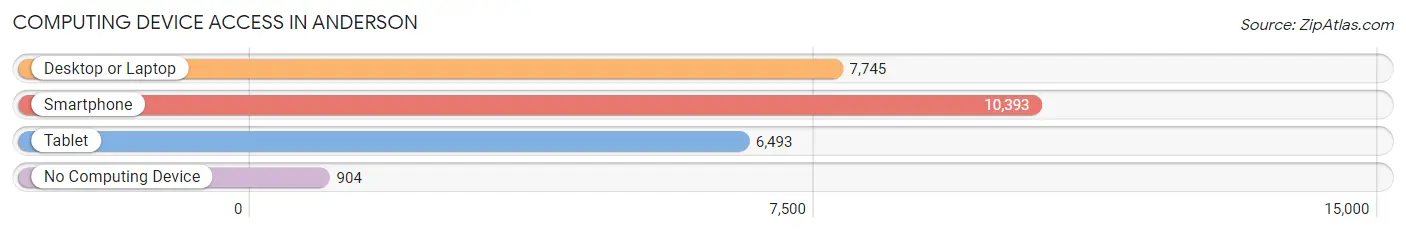
| Device Type | # Households | % Households |
| Desktop or Laptop | 7,745 | 64.5% |
| Smartphone | 10,393 | 86.6% |
| Tablet | 6,493 | 54.1% |
| No Computing Device | 904 | 7.5% |
| Total | 12,008 | 100.0% |
Internet Access in Anderson
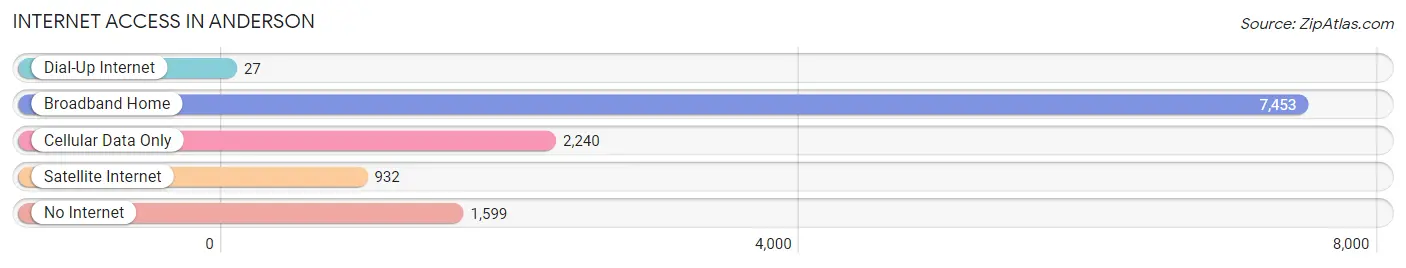
| Internet Type | # Households | % Households |
| Dial-Up Internet | 27 | 0.2% |
| Broadband Home | 7,453 | 62.1% |
| Cellular Data Only | 2,240 | 18.6% |
| Satellite Internet | 932 | 7.8% |
| No Internet | 1,599 | 13.3% |
| Total | 12,008 | 100.0% |
Anderson Summary
Anderson, South Carolina is a city located in the northwestern corner of the state, in Anderson County. It is the county seat and the largest city in the county. The city is situated along the banks of the Savannah River, and is part of the Greenville-Spartanburg-Anderson Combined Statistical Area. Anderson has a population of approximately 27,000 people, and is the principal city of the Anderson Metropolitan Statistical Area, which has a population of approximately 187,000 people.
History
The area that is now Anderson was originally inhabited by the Cherokee Indians. The first European settlers arrived in the area in the late 1700s, and the city was officially founded in 1826. The city was named after General Robert Anderson, who served in the American Revolutionary War and the War of 1812.
In the late 1800s, Anderson experienced a period of rapid growth, due to the development of the textile industry. The city was home to several large cotton mills, and the population grew from just over 1,000 people in 1880 to over 10,000 people by 1910.
The city continued to grow throughout the 20th century, and by 2000, the population had grown to over 27,000 people.
Geography
Anderson is located in the northwestern corner of South Carolina, in Anderson County. The city is situated along the banks of the Savannah River, and is part of the Greenville-Spartanburg-Anderson Combined Statistical Area.
The city has a total area of 16.2 square miles, of which 16.1 square miles is land and 0.1 square miles is water. The city is located at an elevation of 830 feet above sea level.
Economy
The economy of Anderson is largely based on manufacturing. The city is home to several large manufacturing companies, including AnMed Health, Bosch Rexroth, and Electrolux. The city is also home to several large automotive suppliers, including Magna International and Lear Corporation.
In addition to manufacturing, Anderson is also home to several large retail stores, including Walmart, Target, and Lowe's. The city is also home to several large healthcare providers, including AnMed Health and Anderson Regional Medical Center.
Demographics
As of the 2010 census, Anderson had a population of 27,051 people. The racial makeup of the city was 73.2% White, 22.2% African American, 0.3% Native American, 1.2% Asian, 0.1% Pacific Islander, 1.7% from other races, and 1.5% from two or more races. Hispanic or Latino of any race were 4.2% of the population.
The median household income in Anderson was $37,845, and the median family income was $45,945. The per capita income in Anderson was $20,945. Approximately 17.2% of the population was below the poverty line.
Common Questions
What is Per Capita Income in Anderson?
Per Capita income in Anderson is $26,102.
What is the Median Family Income in Anderson?
Median Family Income in Anderson is $55,686.
What is the Median Household income in Anderson?
Median Household Income in Anderson is $40,445.
What is Income or Wage Gap in Anderson?
Income or Wage Gap in Anderson is 27.3%.
Women in Anderson earn 72.7 cents for every dollar earned by a man.
What is Family Income Deficit in Anderson?
Family Income Deficit in Anderson is $14,099.
Families that are below poverty line in Anderson earn $14,099 less on average than the poverty threshold level.
What is Inequality or Gini Index in Anderson?
Inequality or Gini Index in Anderson is 0.49.
What is the Total Population of Anderson?
Total Population of Anderson is 29,345.
What is the Total Male Population of Anderson?
Total Male Population of Anderson is 13,501.
What is the Total Female Population of Anderson?
Total Female Population of Anderson is 15,844.
What is the Ratio of Males per 100 Females in Anderson?
There are 85.21 Males per 100 Females in Anderson.
What is the Ratio of Females per 100 Males in Anderson?
There are 117.35 Females per 100 Males in Anderson.
What is the Median Population Age in Anderson?
Median Population Age in Anderson is 32.7 Years.
What is the Average Family Size in Anderson
Average Family Size in Anderson is 3.0 People.
What is the Average Household Size in Anderson
Average Household Size in Anderson is 2.3 People.
How Large is the Labor Force in Anderson?
There are 13,807 People in the Labor Forcein in Anderson.
What is the Percentage of People in the Labor Force in Anderson?
59.8% of People are in the Labor Force in Anderson.
What is the Unemployment Rate in Anderson?
Unemployment Rate in Anderson is 6.9%.