Female Unemployment by Race, Ethnicity and Immigration Origin
SELECT DEMOGRAPHIC
Select Demographic
Female Unemployment
Common Questions
What are the top races in the United States with the lowest unemploymnet rate among females?
The top races in the United States with the lowest unemploymnet rate among females are:
#1
Whites/Caucasians
4.9%
(99.0/100)
#2
Asians
5.2%
(78.3/100)
#3
Hawaiians
5.4%
(22.2/100)
What are the top ancestries in the United States with the lowest unemploymnet rate among females?
The top ancestries in the United States with the lowest unemploymnet rate among females are:
#1
Norwegians
4.2%
(100.0/100)
#2
Czechs
4.4%
(100.0/100)
#3
Luxembourgers
4.4%
(100.0/100)
#4
Danes
4.4%
(100.0/100)
#5
Hmong
4.4%
(100.0/100)
What are the top immigration origins in the United States with the lowest unemploymnet rate among females?
The top immigration origins in the United States with the lowest unemploymnet rate among females are:
#1
Immigrants from India
4.7%
(99.9/100)
#2
Immigrants from Bosnia and Herzegovina
4.7%
(99.9/100)
#3
Immigrants from Bulgaria
4.9%
(99.3/100)
#4
Immigrants from Cuba
4.9%
(99.1/100)
#5
Immigrants from Zimbabwe
4.9%
(99.0/100)
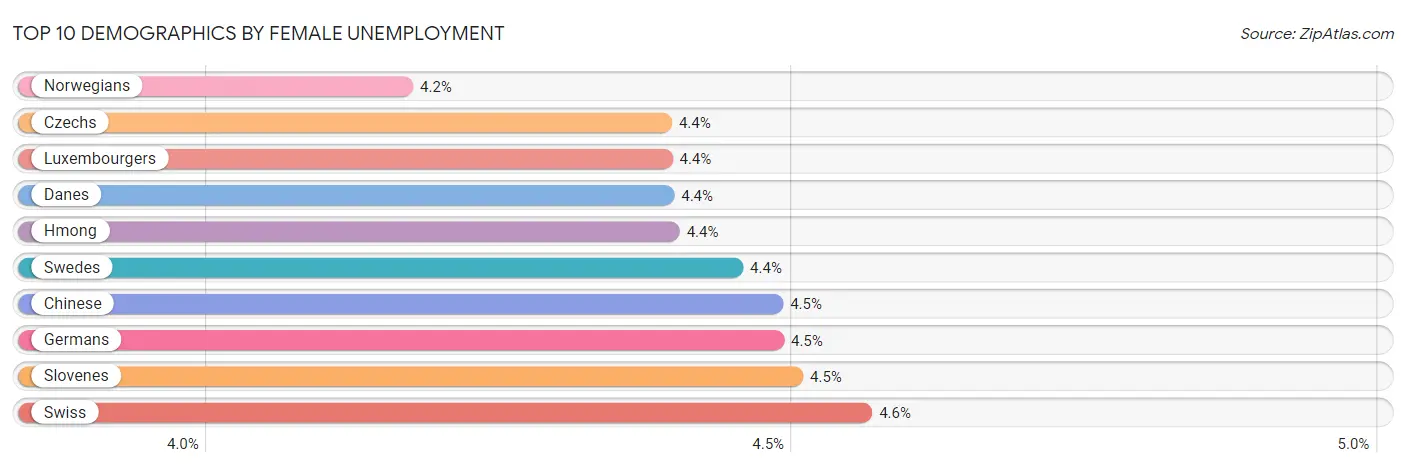
Top 10 Demographics by Female Unemployment
The best off demographics with the lowest unemploymnet rate among females in the United States are Norwegian (4.2%, 100.0/100), Czech (4.4%, 100.0/100), Luxembourger (4.4%, 100.0/100), Danish (4.4%, 100.0/100), and Hmong (4.4%, 100.0/100).
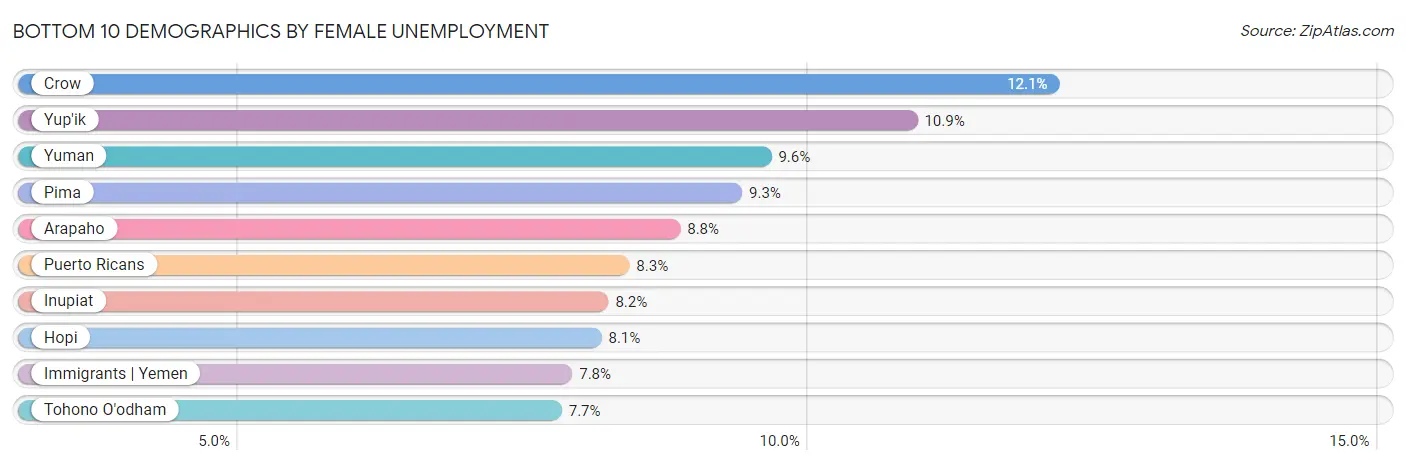
Bottom 10 Demographics by Female Unemployment
The worst off demographics with the highest unemploymnet rate among females in the United States are Crow (12.1%, 0.0/100), Yup'ik (10.9%, 0.0/100), Yuman (9.6%, 0.0/100), Pima (9.3%, 0.0/100), and Arapaho (8.8%, 0.0/100).
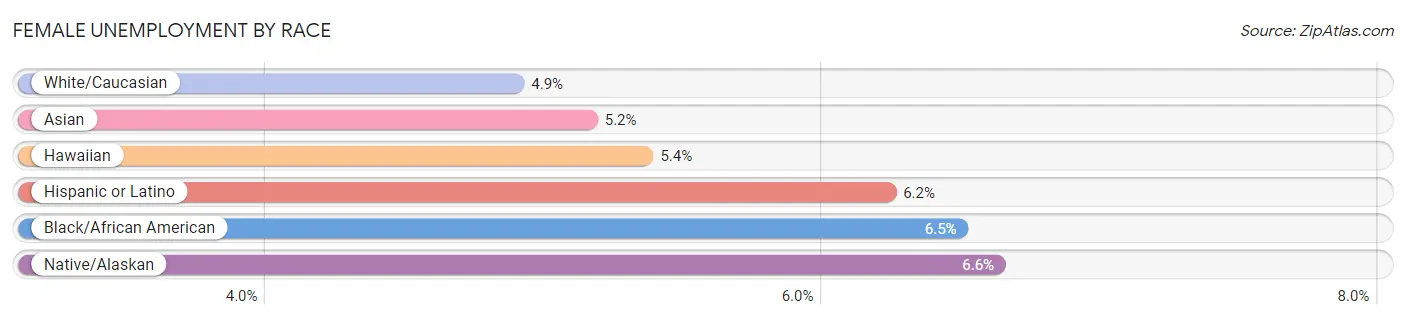
Female Unemployment by Race
Top demographics by Female Unemployment within the race category in the United States are Whites/Caucasians (4.9%, 99.0/100), Asians (5.2%, 78.3/100), and Hawaiians (5.4%, 22.2/100).
| Race | Rating | Rank | Female Unemployment |
| Asian | 78.3 /100 | #149 | Good 5.2% |
| Black/African American | 0.0 /100 | #321 | Tragic 6.5% |
| Hawaiian | 22.2 /100 | #199 | Fair 5.4% |
| Hispanic or Latino | 0.0 /100 | #308 | Tragic 6.2% |
| Native/Alaskan | 0.0 /100 | #326 | Tragic 6.6% |
| White/Caucasian | 99.0 /100 | #53 | Exceptional 4.9% |
Female Unemployment by Ancestry
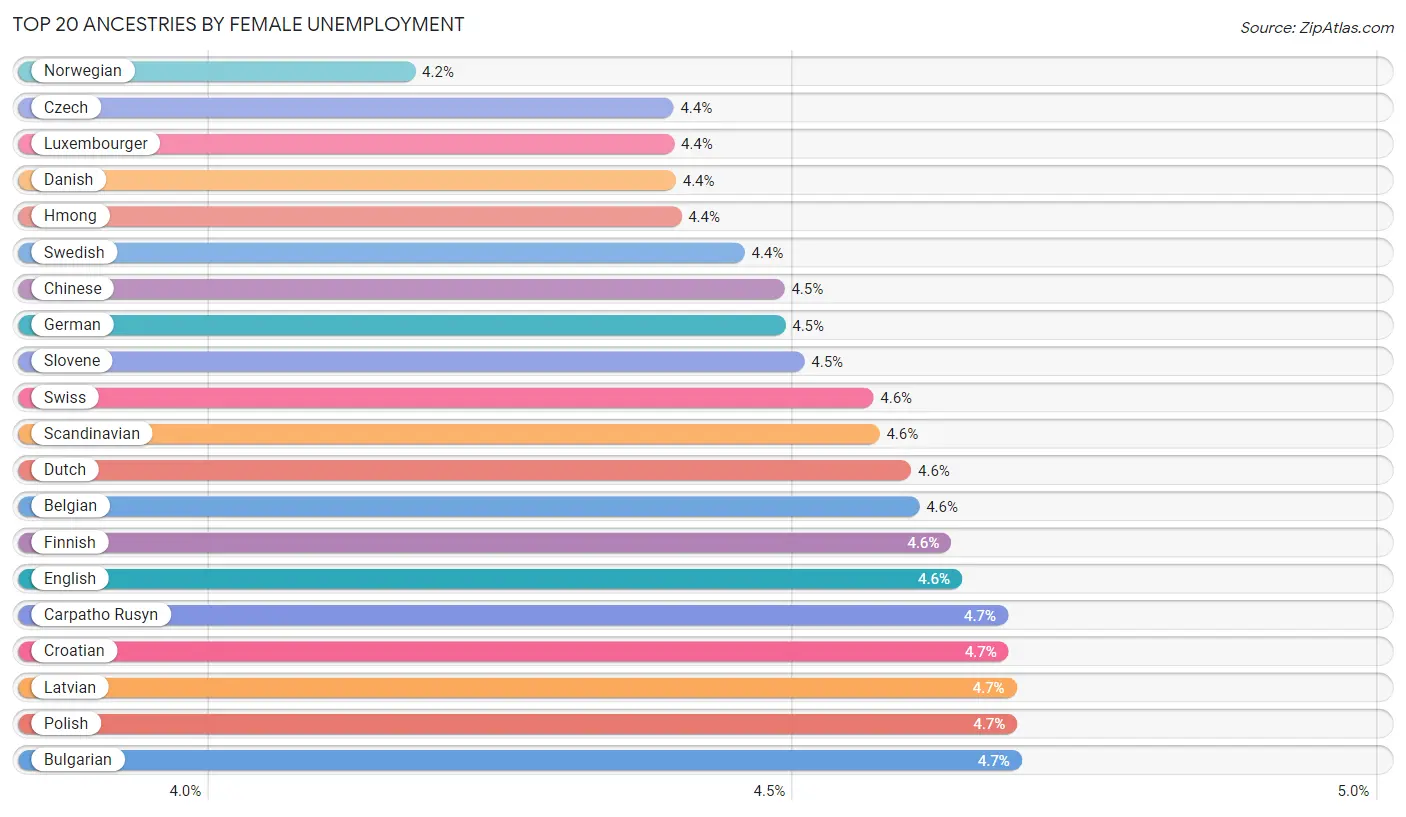
Top 20 Ancestries by Female Unemployment
Top demographics by Female Unemployment within the ancestry category in the United States are Norwegians (4.2%, 100.0/100), Czechs (4.4%, 100.0/100), Luxembourgers (4.4%, 100.0/100), Danes (4.4%, 100.0/100), and Hmong (4.4%, 100.0/100).
| Ancestry | Rating | Rank | Female Unemployment |
| Afghan | 33.9 /100 | #188 | Fair 5.3% |
| African | 0.0 /100 | #274 | Tragic 5.9% |
| Alaska Native | 0.0 /100 | #327 | Tragic 6.6% |
| Alaskan Athabascan | 0.0 /100 | #296 | Tragic 6.1% |
| Albanian | 68.3 /100 | #158 | Good 5.2% |
| Aleut | 3.0 /100 | #239 | Tragic 5.5% |
| Alsatian | 23.9 /100 | #197 | Fair 5.3% |
| American | 90.5 /100 | #116 | Exceptional 5.1% |
| Apache | 0.0 /100 | #325 | Tragic 6.6% |
| Arab | 27.7 /100 | #193 | Fair 5.3% |
| Arapaho | 0.0 /100 | #343 | Tragic 8.8% |
| Argentinean | 79.2 /100 | #147 | Good 5.2% |
| Armenian | 0.0 /100 | #279 | Tragic 6.0% |
| Assyrian/Chaldean/Syriac | 0.8 /100 | #251 | Tragic 5.6% |
| Australian | 99.2 /100 | #49 | Exceptional 4.9% |
| Austrian | 99.3 /100 | #45 | Exceptional 4.9% |
| Bahamian | 0.0 /100 | #276 | Tragic 6.0% |
| Bangladeshi | 64.3 /100 | #164 | Good 5.2% |
| Barbadian | 0.0 /100 | #303 | Tragic 6.2% |
| Basque | 86.5 /100 | #125 | Excellent 5.1% |
| Belgian | 100.0 /100 | #13 | Exceptional 4.6% |
| Belizean | 0.0 /100 | #313 | Tragic 6.3% |
| Bermudan | 9.0 /100 | #218 | Tragic 5.4% |
| Bhutanese | 98.7 /100 | #59 | Exceptional 4.9% |
| Blackfeet | 0.0 /100 | #265 | Tragic 5.9% |
| Bolivian | 97.1 /100 | #86 | Exceptional 5.0% |
| Brazilian | 7.3 /100 | #221 | Tragic 5.5% |
| British | 99.9 /100 | #27 | Exceptional 4.7% |
| British West Indian | 0.0 /100 | #318 | Tragic 6.4% |
| Bulgarian | 99.9 /100 | #20 | Exceptional 4.7% |
| Burmese | 95.6 /100 | #95 | Exceptional 5.0% |
| Cajun | 0.7 /100 | #252 | Tragic 5.7% |
| Cambodian | 99.1 /100 | #51 | Exceptional 4.9% |
| Canadian | 97.2 /100 | #84 | Exceptional 5.0% |
| Cape Verdean | 0.0 /100 | #266 | Tragic 5.9% |
| Carpatho Rusyn | 99.9 /100 | #16 | Exceptional 4.7% |
| Celtic | 98.5 /100 | #64 | Exceptional 4.9% |
| Central American | 0.0 /100 | #271 | Tragic 5.9% |
| Central American Indian | 0.0 /100 | #310 | Tragic 6.3% |
| Cherokee | 30.8 /100 | #191 | Fair 5.3% |
| Cheyenne | 0.0 /100 | #324 | Tragic 6.6% |
| Chickasaw | 83.2 /100 | #138 | Excellent 5.1% |
| Chilean | 85.8 /100 | #128 | Excellent 5.1% |
| Chinese | 100.0 /100 | #7 | Exceptional 4.5% |
| Chippewa | 0.0 /100 | #286 | Tragic 6.1% |
| Choctaw | 12.3 /100 | #210 | Poor 5.4% |
| Colombian | 27.0 /100 | #194 | Fair 5.3% |
| Colville | 0.0 /100 | #282 | Tragic 6.0% |
| Comanche | 10.0 /100 | #216 | Poor 5.4% |
| Costa Rican | 33.8 /100 | #189 | Fair 5.3% |
| Cree | 1.0 /100 | #248 | Tragic 5.6% |
| Creek | 15.4 /100 | #207 | Poor 5.4% |
| Croatian | 99.9 /100 | #17 | Exceptional 4.7% |
| Crow | 0.0 /100 | #347 | Tragic 12.1% |
| Cuban | 98.3 /100 | #67 | Exceptional 4.9% |
| Cypriot | 99.9 /100 | #29 | Exceptional 4.7% |
| Czech | 100.0 /100 | #2 | Exceptional 4.4% |
| Czechoslovakian | 99.7 /100 | #33 | Exceptional 4.8% |
| Danish | 100.0 /100 | #4 | Exceptional 4.4% |
| Delaware | 7.2 /100 | #223 | Tragic 5.5% |
| Dominican | 0.0 /100 | #335 | Tragic 7.2% |
| Dutch | 100.0 /100 | #12 | Exceptional 4.6% |
| Dutch West Indian | 0.3 /100 | #257 | Tragic 5.7% |
| Eastern European | 99.4 /100 | #43 | Exceptional 4.9% |
| Ecuadorian | 0.0 /100 | #309 | Tragic 6.3% |
| Egyptian | 78.3 /100 | #150 | Good 5.2% |
| English | 100.0 /100 | #15 | Exceptional 4.6% |
| Estonian | 92.1 /100 | #112 | Exceptional 5.1% |
| Ethiopian | 85.7 /100 | #129 | Excellent 5.1% |
| European | 99.9 /100 | #22 | Exceptional 4.7% |
| Fijian | 99.9 /100 | #21 | Exceptional 4.7% |
| Filipino | 97.3 /100 | #81 | Exceptional 5.0% |
| Finnish | 100.0 /100 | #14 | Exceptional 4.6% |
| French | 99.6 /100 | #40 | Exceptional 4.8% |
| French American Indian | 6.1 /100 | #225 | Tragic 5.5% |
| French Canadian | 99.7 /100 | #35 | Exceptional 4.8% |
| German | 100.0 /100 | #8 | Exceptional 4.5% |
| German Russian | 98.1 /100 | #71 | Exceptional 4.9% |
| Ghanaian | 0.0 /100 | #273 | Tragic 5.9% |
| Greek | 99.4 /100 | #44 | Exceptional 4.9% |
| Guamanian/Chamorro | 1.4 /100 | #245 | Tragic 5.6% |
| Guatemalan | 0.0 /100 | #281 | Tragic 6.0% |
| Guyanese | 0.0 /100 | #328 | Tragic 6.7% |
| Haitian | 0.0 /100 | #288 | Tragic 6.1% |
| Hmong | 100.0 /100 | #5 | Exceptional 4.4% |
| Honduran | 0.0 /100 | #268 | Tragic 5.9% |
| Hopi | 0.0 /100 | #340 | Tragic 8.1% |
| Houma | 0.0 /100 | #316 | Tragic 6.4% |
| Hungarian | 98.3 /100 | #66 | Exceptional 4.9% |
| Icelander | 98.8 /100 | #57 | Exceptional 4.9% |
| Indian (Asian) | 84.2 /100 | #136 | Excellent 5.1% |
| Indonesian | 95.1 /100 | #100 | Exceptional 5.0% |
| Inupiat | 0.0 /100 | #341 | Tragic 8.2% |
| Iranian | 50.4 /100 | #173 | Average 5.3% |
| Iraqi | 7.1 /100 | #224 | Tragic 5.5% |
| Irish | 99.9 /100 | #28 | Exceptional 4.7% |
| Iroquois | 20.8 /100 | #202 | Fair 5.4% |
| Israeli | 4.8 /100 | #228 | Tragic 5.5% |
| Italian | 99.5 /100 | #42 | Exceptional 4.8% |
| Jamaican | 0.0 /100 | #298 | Tragic 6.1% |
| Japanese | 1.2 /100 | #246 | Tragic 5.6% |
| Jordanian | 90.3 /100 | #117 | Exceptional 5.1% |
| Kenyan | 93.7 /100 | #104 | Exceptional 5.0% |
| Kiowa | 0.1 /100 | #261 | Tragic 5.8% |
| Korean | 13.4 /100 | #209 | Poor 5.4% |
| Laotian | 45.1 /100 | #179 | Average 5.3% |
| Latvian | 99.9 /100 | #18 | Exceptional 4.7% |
| Lebanese | 91.0 /100 | #115 | Exceptional 5.1% |
| Liberian | 3.9 /100 | #232 | Tragic 5.5% |
| Lithuanian | 99.8 /100 | #30 | Exceptional 4.7% |
| Lumbee | 0.0 /100 | #272 | Tragic 5.9% |
| Luxembourger | 100.0 /100 | #3 | Exceptional 4.4% |
| Macedonian | 92.4 /100 | #110 | Exceptional 5.1% |
| Malaysian | 40.1 /100 | #185 | Average 5.3% |
| Maltese | 85.5 /100 | #130 | Excellent 5.1% |
| Marshallese | 2.3 /100 | #242 | Tragic 5.6% |
| Menominee | 0.0 /100 | #333 | Tragic 7.0% |
| Mexican | 0.0 /100 | #293 | Tragic 6.1% |
| Mexican American Indian | 0.0 /100 | #280 | Tragic 6.0% |
| Mongolian | 97.8 /100 | #77 | Exceptional 5.0% |
| Moroccan | 3.4 /100 | #233 | Tragic 5.5% |
| Native Hawaiian | 62.7 /100 | #166 | Good 5.2% |
| Navajo | 0.0 /100 | #337 | Tragic 7.3% |
| Nepalese | 0.0 /100 | #267 | Tragic 5.9% |
| New Zealander | 97.4 /100 | #80 | Exceptional 5.0% |
| Nicaraguan | 7.2 /100 | #222 | Tragic 5.5% |
| Nigerian | 0.2 /100 | #260 | Tragic 5.8% |
| Northern European | 99.6 /100 | #38 | Exceptional 4.8% |
| Norwegian | 100.0 /100 | #1 | Exceptional 4.2% |
| Okinawan | 99.3 /100 | #47 | Exceptional 4.9% |
| Osage | 98.2 /100 | #70 | Exceptional 4.9% |
| Ottawa | 11.6 /100 | #211 | Poor 5.4% |
| Paiute | 0.0 /100 | #331 | Tragic 6.8% |
| Pakistani | 83.8 /100 | #137 | Excellent 5.1% |
| Palestinian | 80.8 /100 | #142 | Excellent 5.1% |
| Panamanian | 4.7 /100 | #229 | Tragic 5.5% |
| Paraguayan | 93.2 /100 | #106 | Exceptional 5.1% |
| Pennsylvania German | 99.6 /100 | #37 | Exceptional 4.8% |
| Peruvian | 9.6 /100 | #217 | Tragic 5.4% |
| Pima | 0.0 /100 | #344 | Tragic 9.3% |
| Polish | 99.9 /100 | #19 | Exceptional 4.7% |
| Portuguese | 28.6 /100 | #192 | Fair 5.3% |
| Potawatomi | 65.9 /100 | #162 | Good 5.2% |
| Pueblo | 0.0 /100 | #315 | Tragic 6.4% |
| Puerto Rican | 0.0 /100 | #342 | Tragic 8.3% |
| Puget Sound Salish | 93.0 /100 | #108 | Exceptional 5.1% |
| Romanian | 95.9 /100 | #92 | Exceptional 5.0% |
| Russian | 98.0 /100 | #73 | Exceptional 5.0% |
| Salvadoran | 0.0 /100 | #283 | Tragic 6.0% |
| Samoan | 10.6 /100 | #213 | Poor 5.4% |
| Scandinavian | 100.0 /100 | #11 | Exceptional 4.6% |
| Scotch-Irish | 99.6 /100 | #39 | Exceptional 4.8% |
| Scottish | 99.9 /100 | #23 | Exceptional 4.7% |
| Seminole | 10.3 /100 | #214 | Poor 5.4% |
| Senegalese | 0.0 /100 | #275 | Tragic 6.0% |
| Serbian | 99.0 /100 | #56 | Exceptional 4.9% |
| Shoshone | 0.0 /100 | #307 | Tragic 6.2% |
| Sierra Leonean | 3.2 /100 | #238 | Tragic 5.5% |
| Sioux | 0.0 /100 | #332 | Tragic 7.0% |
| Slavic | 99.1 /100 | #52 | Exceptional 4.9% |
| Slovak | 99.8 /100 | #32 | Exceptional 4.8% |
| Slovene | 100.0 /100 | #9 | Exceptional 4.5% |
| Somali | 94.6 /100 | #103 | Exceptional 5.0% |
| South African | 70.8 /100 | #154 | Good 5.2% |
| South American | 8.6 /100 | #219 | Tragic 5.4% |
| South American Indian | 2.8 /100 | #241 | Tragic 5.5% |
| Soviet Union | 21.7 /100 | #200 | Fair 5.4% |
| Spaniard | 25.2 /100 | #196 | Fair 5.3% |
| Spanish | 55.9 /100 | #170 | Average 5.2% |
| Spanish American | 2.2 /100 | #243 | Tragic 5.6% |
| Spanish American Indian | 0.0 /100 | #305 | Tragic 6.2% |
| Sri Lankan | 59.4 /100 | #168 | Average 5.2% |
| Subsaharan African | 0.4 /100 | #256 | Tragic 5.7% |
| Sudanese | 99.8 /100 | #31 | Exceptional 4.8% |
| Swedish | 100.0 /100 | #6 | Exceptional 4.4% |
| Swiss | 100.0 /100 | #10 | Exceptional 4.6% |
| Syrian | 62.8 /100 | #165 | Good 5.2% |
| Taiwanese | 42.7 /100 | #181 | Average 5.3% |
| Thai | 99.2 /100 | #48 | Exceptional 4.9% |
| Tlingit-Haida | 98.3 /100 | #68 | Exceptional 4.9% |
| Tohono O'Odham | 0.0 /100 | #338 | Tragic 7.7% |
| Tongan | 99.5 /100 | #41 | Exceptional 4.8% |
| Trinidadian and Tobagonian | 0.0 /100 | #289 | Tragic 6.1% |
| Tsimshian | 23.1 /100 | #198 | Fair 5.4% |
| Turkish | 97.6 /100 | #79 | Exceptional 5.0% |
| U.S. Virgin Islander | 0.0 /100 | #302 | Tragic 6.2% |
| Ugandan | 31.2 /100 | #190 | Fair 5.3% |
| Ukrainian | 97.1 /100 | #85 | Exceptional 5.0% |
| Uruguayan | 11.4 /100 | #212 | Poor 5.4% |
| Ute | 0.0 /100 | #299 | Tragic 6.1% |
| Venezuelan | 96.9 /100 | #87 | Exceptional 5.0% |
| Vietnamese | 0.0 /100 | #322 | Tragic 6.5% |
| Welsh | 99.9 /100 | #24 | Exceptional 4.7% |
| West Indian | 0.0 /100 | #297 | Tragic 6.1% |
| Yakama | 0.0 /100 | #330 | Tragic 6.7% |
| Yaqui | 0.0 /100 | #278 | Tragic 6.0% |
| Yugoslavian | 99.7 /100 | #36 | Exceptional 4.8% |
| Yuman | 0.0 /100 | #345 | Tragic 9.6% |
| Yup'ik | 0.0 /100 | #346 | Tragic 10.9% |
| Zimbabwean | 99.7 /100 | #34 | Exceptional 4.8% |
Female Unemployment by Immigration
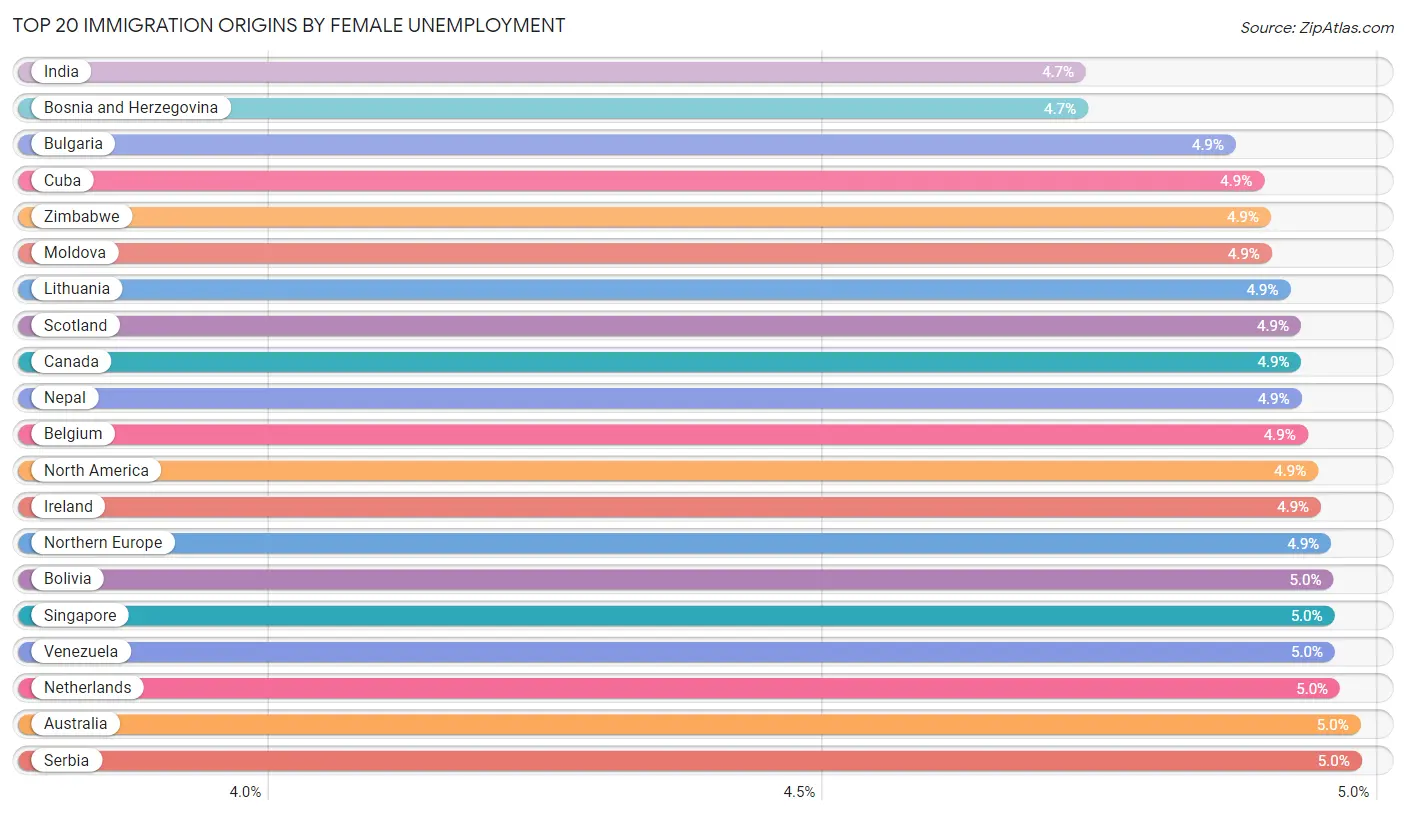
Top 20 Immigration Origins by Female Unemployment
Top demographics by Female Unemployment within the immigration category in the United States are Immigrants from India (4.7%, 99.9/100), Immigrants from Bosnia and Herzegovina (4.7%, 99.9/100), Immigrants from Bulgaria (4.9%, 99.3/100), Immigrants from Cuba (4.9%, 99.1/100), and Immigrants from Zimbabwe (4.9%, 99.0/100).
| Immigration | Rating | Rank | Female Unemployment |
| Nonimmigrants | 42.6 /100 | #182 | Average 5.3% |
| Immigrants | 0.6 /100 | #254 | Tragic 5.7% |
| Afghanistan | 18.9 /100 | #205 | Poor 5.4% |
| Africa | 8.5 /100 | #220 | Tragic 5.4% |
| Albania | 35.4 /100 | #187 | Fair 5.3% |
| Argentina | 78.7 /100 | #148 | Good 5.2% |
| Armenia | 0.0 /100 | #334 | Tragic 7.1% |
| Asia | 64.3 /100 | #163 | Good 5.2% |
| Australia | 97.3 /100 | #82 | Exceptional 5.0% |
| Austria | 95.7 /100 | #93 | Exceptional 5.0% |
| Bahamas | 0.1 /100 | #264 | Tragic 5.8% |
| Bangladesh | 0.0 /100 | #319 | Tragic 6.5% |
| Barbados | 0.0 /100 | #301 | Tragic 6.2% |
| Belarus | 39.4 /100 | #186 | Fair 5.3% |
| Belgium | 98.5 /100 | #63 | Exceptional 4.9% |
| Belize | 0.0 /100 | #323 | Tragic 6.5% |
| Bolivia | 98.0 /100 | #74 | Exceptional 5.0% |
| Bosnia and Herzegovina | 99.9 /100 | #26 | Exceptional 4.7% |
| Brazil | 18.8 /100 | #206 | Poor 5.4% |
| Bulgaria | 99.3 /100 | #46 | Exceptional 4.9% |
| Burma/Myanmar | 92.3 /100 | #111 | Exceptional 5.1% |
| Cabo Verde | 0.0 /100 | #285 | Tragic 6.1% |
| Cambodia | 3.3 /100 | #236 | Tragic 5.5% |
| Cameroon | 0.6 /100 | #255 | Tragic 5.7% |
| Canada | 98.6 /100 | #61 | Exceptional 4.9% |
| Caribbean | 0.0 /100 | #290 | Tragic 6.1% |
| Central America | 0.0 /100 | #306 | Tragic 6.2% |
| Chile | 59.0 /100 | #169 | Average 5.2% |
| China | 75.9 /100 | #151 | Good 5.2% |
| Colombia | 26.2 /100 | #195 | Fair 5.3% |
| Congo | 43.1 /100 | #180 | Average 5.3% |
| Costa Rica | 13.7 /100 | #208 | Poor 5.4% |
| Croatia | 89.9 /100 | #118 | Excellent 5.1% |
| Cuba | 99.1 /100 | #50 | Exceptional 4.9% |
| Czechoslovakia | 95.0 /100 | #101 | Exceptional 5.0% |
| Denmark | 55.0 /100 | #171 | Average 5.2% |
| Dominica | 0.0 /100 | #320 | Tragic 6.5% |
| Dominican Republic | 0.0 /100 | #336 | Tragic 7.2% |
| Eastern Africa | 92.8 /100 | #109 | Exceptional 5.1% |
| Eastern Asia | 83.0 /100 | #139 | Excellent 5.1% |
| Eastern Europe | 81.5 /100 | #141 | Excellent 5.1% |
| Ecuador | 0.0 /100 | #314 | Tragic 6.4% |
| Egypt | 70.0 /100 | #155 | Good 5.2% |
| El Salvador | 0.0 /100 | #294 | Tragic 6.1% |
| England | 93.6 /100 | #105 | Exceptional 5.0% |
| Eritrea | 84.6 /100 | #134 | Excellent 5.1% |
| Ethiopia | 85.4 /100 | #131 | Excellent 5.1% |
| Europe | 87.2 /100 | #124 | Excellent 5.1% |
| Fiji | 0.2 /100 | #259 | Tragic 5.8% |
| France | 82.7 /100 | #140 | Excellent 5.1% |
| Germany | 87.6 /100 | #122 | Excellent 5.1% |
| Ghana | 0.0 /100 | #277 | Tragic 6.0% |
| Greece | 74.9 /100 | #153 | Good 5.2% |
| Grenada | 0.0 /100 | #312 | Tragic 6.3% |
| Guatemala | 0.0 /100 | #287 | Tragic 6.1% |
| Guyana | 0.0 /100 | #329 | Tragic 6.7% |
| Haiti | 0.0 /100 | #300 | Tragic 6.1% |
| Honduras | 0.0 /100 | #270 | Tragic 5.9% |
| Hong Kong | 84.8 /100 | #133 | Excellent 5.1% |
| Hungary | 86.0 /100 | #127 | Excellent 5.1% |
| India | 99.9 /100 | #25 | Exceptional 4.7% |
| Indonesia | 40.7 /100 | #183 | Average 5.3% |
| Iran | 3.3 /100 | #235 | Tragic 5.5% |
| Iraq | 3.9 /100 | #231 | Tragic 5.5% |
| Ireland | 98.2 /100 | #69 | Exceptional 4.9% |
| Israel | 19.7 /100 | #204 | Poor 5.4% |
| Italy | 75.0 /100 | #152 | Good 5.2% |
| Jamaica | 0.0 /100 | #304 | Tragic 6.2% |
| Japan | 96.0 /100 | #91 | Exceptional 5.0% |
| Jordan | 80.4 /100 | #144 | Excellent 5.1% |
| Kazakhstan | 80.7 /100 | #143 | Excellent 5.1% |
| Kenya | 94.8 /100 | #102 | Exceptional 5.0% |
| Korea | 86.3 /100 | #126 | Excellent 5.1% |
| Kuwait | 95.2 /100 | #98 | Exceptional 5.0% |
| Laos | 47.5 /100 | #175 | Average 5.3% |
| Latin America | 0.0 /100 | #295 | Tragic 6.1% |
| Latvia | 84.6 /100 | #135 | Excellent 5.1% |
| Lebanon | 3.3 /100 | #234 | Tragic 5.5% |
| Liberia | 1.5 /100 | #244 | Tragic 5.6% |
| Lithuania | 98.8 /100 | #58 | Exceptional 4.9% |
| Malaysia | 95.7 /100 | #94 | Exceptional 5.0% |
| Mexico | 0.0 /100 | #311 | Tragic 6.3% |
| Micronesia | 66.9 /100 | #159 | Good 5.2% |
| Middle Africa | 20.8 /100 | #201 | Fair 5.4% |
| Moldova | 99.0 /100 | #55 | Exceptional 4.9% |
| Morocco | 47.4 /100 | #177 | Average 5.3% |
| Nepal | 98.6 /100 | #62 | Exceptional 4.9% |
| Netherlands | 97.8 /100 | #78 | Exceptional 5.0% |
| Nicaragua | 10.2 /100 | #215 | Poor 5.4% |
| Nigeria | 0.1 /100 | #262 | Tragic 5.8% |
| North America | 98.3 /100 | #65 | Exceptional 4.9% |
| North Macedonia | 88.3 /100 | #119 | Excellent 5.1% |
| Northern Africa | 69.6 /100 | #156 | Good 5.2% |
| Northern Europe | 98.0 /100 | #72 | Exceptional 4.9% |
| Norway | 79.4 /100 | #146 | Good 5.2% |
| Oceania | 79.5 /100 | #145 | Good 5.2% |
| Pakistan | 66.7 /100 | #161 | Good 5.2% |
| Panama | 3.2 /100 | #237 | Tragic 5.5% |
| Peru | 5.9 /100 | #226 | Tragic 5.5% |
| Philippines | 5.3 /100 | #227 | Tragic 5.5% |
| Poland | 50.0 /100 | #174 | Average 5.3% |
| Portugal | 0.2 /100 | #258 | Tragic 5.8% |
| Romania | 88.1 /100 | #120 | Excellent 5.1% |
| Russia | 69.3 /100 | #157 | Good 5.2% |
| Saudi Arabia | 91.2 /100 | #113 | Exceptional 5.1% |
| Scotland | 98.6 /100 | #60 | Exceptional 4.9% |
| Senegal | 0.0 /100 | #284 | Tragic 6.1% |
| Serbia | 97.2 /100 | #83 | Exceptional 5.0% |
| Sierra Leone | 0.6 /100 | #253 | Tragic 5.7% |
| Singapore | 98.0 /100 | #75 | Exceptional 5.0% |
| Somalia | 95.2 /100 | #97 | Exceptional 5.0% |
| South Africa | 87.6 /100 | #123 | Excellent 5.1% |
| South America | 2.9 /100 | #240 | Tragic 5.5% |
| South Central Asia | 95.5 /100 | #96 | Exceptional 5.0% |
| South Eastern Asia | 20.3 /100 | #203 | Fair 5.4% |
| Southern Europe | 46.2 /100 | #178 | Average 5.3% |
| Spain | 66.8 /100 | #160 | Good 5.2% |
| Sri Lanka | 85.0 /100 | #132 | Excellent 5.1% |
| St. Vincent and the Grenadines | 0.0 /100 | #317 | Tragic 6.4% |
| Sudan | 96.7 /100 | #88 | Exceptional 5.0% |
| Sweden | 96.3 /100 | #90 | Exceptional 5.0% |
| Switzerland | 93.1 /100 | #107 | Exceptional 5.1% |
| Syria | 0.8 /100 | #250 | Tragic 5.6% |
| Taiwan | 96.6 /100 | #89 | Exceptional 5.0% |
| Thailand | 62.1 /100 | #167 | Good 5.2% |
| Trinidad and Tobago | 0.0 /100 | #292 | Tragic 6.1% |
| Turkey | 91.0 /100 | #114 | Exceptional 5.1% |
| Uganda | 50.7 /100 | #172 | Average 5.3% |
| Ukraine | 40.1 /100 | #184 | Average 5.3% |
| Uruguay | 4.7 /100 | #230 | Tragic 5.5% |
| Uzbekistan | 1.0 /100 | #249 | Tragic 5.6% |
| Venezuela | 97.9 /100 | #76 | Exceptional 5.0% |
| Vietnam | 47.5 /100 | #176 | Average 5.3% |
| West Indies | 0.0 /100 | #291 | Tragic 6.1% |
| Western Africa | 0.0 /100 | #269 | Tragic 5.9% |
| Western Asia | 1.1 /100 | #247 | Tragic 5.6% |
| Western Europe | 88.1 /100 | #121 | Excellent 5.1% |
| Yemen | 0.0 /100 | #339 | Tragic 7.8% |
| Zaire | 95.2 /100 | #99 | Exceptional 5.0% |
| Zimbabwe | 99.0 /100 | #54 | Exceptional 4.9% |
| Azores | 0.1 /100 | #263 | Tragic 5.8% |